More homogeneous capillary flow and oxygenation in deeper cortical layers correlate with increased oxygen extraction
- Massachusetts General Hospital, Harvard Medical School, United States
- University of Pennsylvania, United States
- University of California, San Diego, United States
- École Polytechnique de Montréal, Canada
- Montreal Heart Institute, Canada
- Aarhus University, Denmark
- Boston University, United States
Figures
Figure 1 with 2 supplements
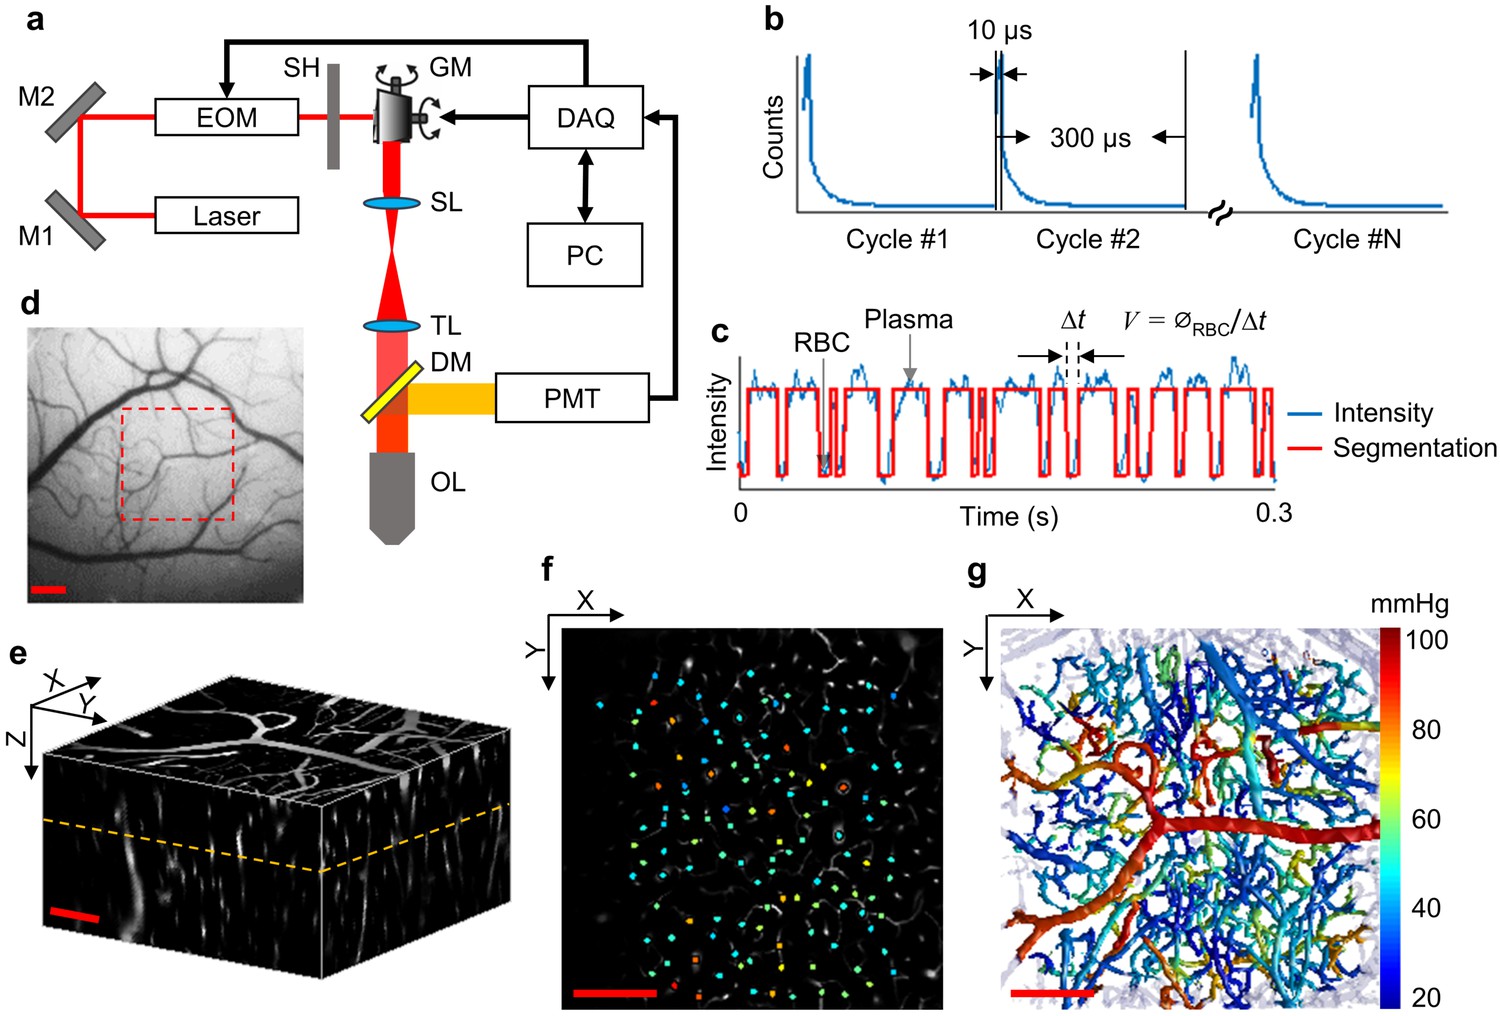
Experimental setup and data acquisition protocol.
(a) Schematic of our home-built two-photon microscope. The components are abbreviated as: mirror (M), electro-optic modulator (EOM), shutter (SH), galvo mirrors (GM), scan lens (SL), tube lens (TL), dichroic mirror (DM), objective lens (OL), and photomultiplier tube (PMT). (b) Illustrative example of the phosphorescence decays for PO2 recording at a single location. Each 300-µs-long cycle includes a 10-µs-long EOM-gated excitation, followed by a 290-µs-long detection of phosphorescence decay. (c) A representative phosphorescence intensity time course during PO2 recording at a single location (blue curve). Each point in the time course represents the sum of the photon counts acquired during one 300-µs-long excitation/decay cycle in b. The red curve represents the binary segmented time course, with valleys and peaks representing RBC and blood-plasma-passages through the focal volume, respectively. (d) An image of the brain surface vasculature, taken through the chronic cranial window using a CCD camera. (e) The 3D representation of a Sulforhodamine-B-labeled cortical microvasculature imaged over the region of interest outlined by the red dashed square in d. f. PO2 measurements inside the microvascular segments at the imaging plane outlined by the orange dashed line in e. PO2 values (in mmHg, color-coded) were spatially co-registered with the microvascular angiogram. (g) Composite image shows the top view of the 3D projection of the PO2 distribution in the microvascular network. Please note that panel g does not represent an instantaneous PO2 distribution in the presented microvascular network. The color bar serves for panels f and g. Scale bars: 200 µm.
-
Figure 1—source data 1
Measurements of Mean-PO2 acquired in 6544 microvascular segments over n = 15 mice.
- https://doi.org/10.7554/eLife.42299.005
Figure 1—figure supplement 1
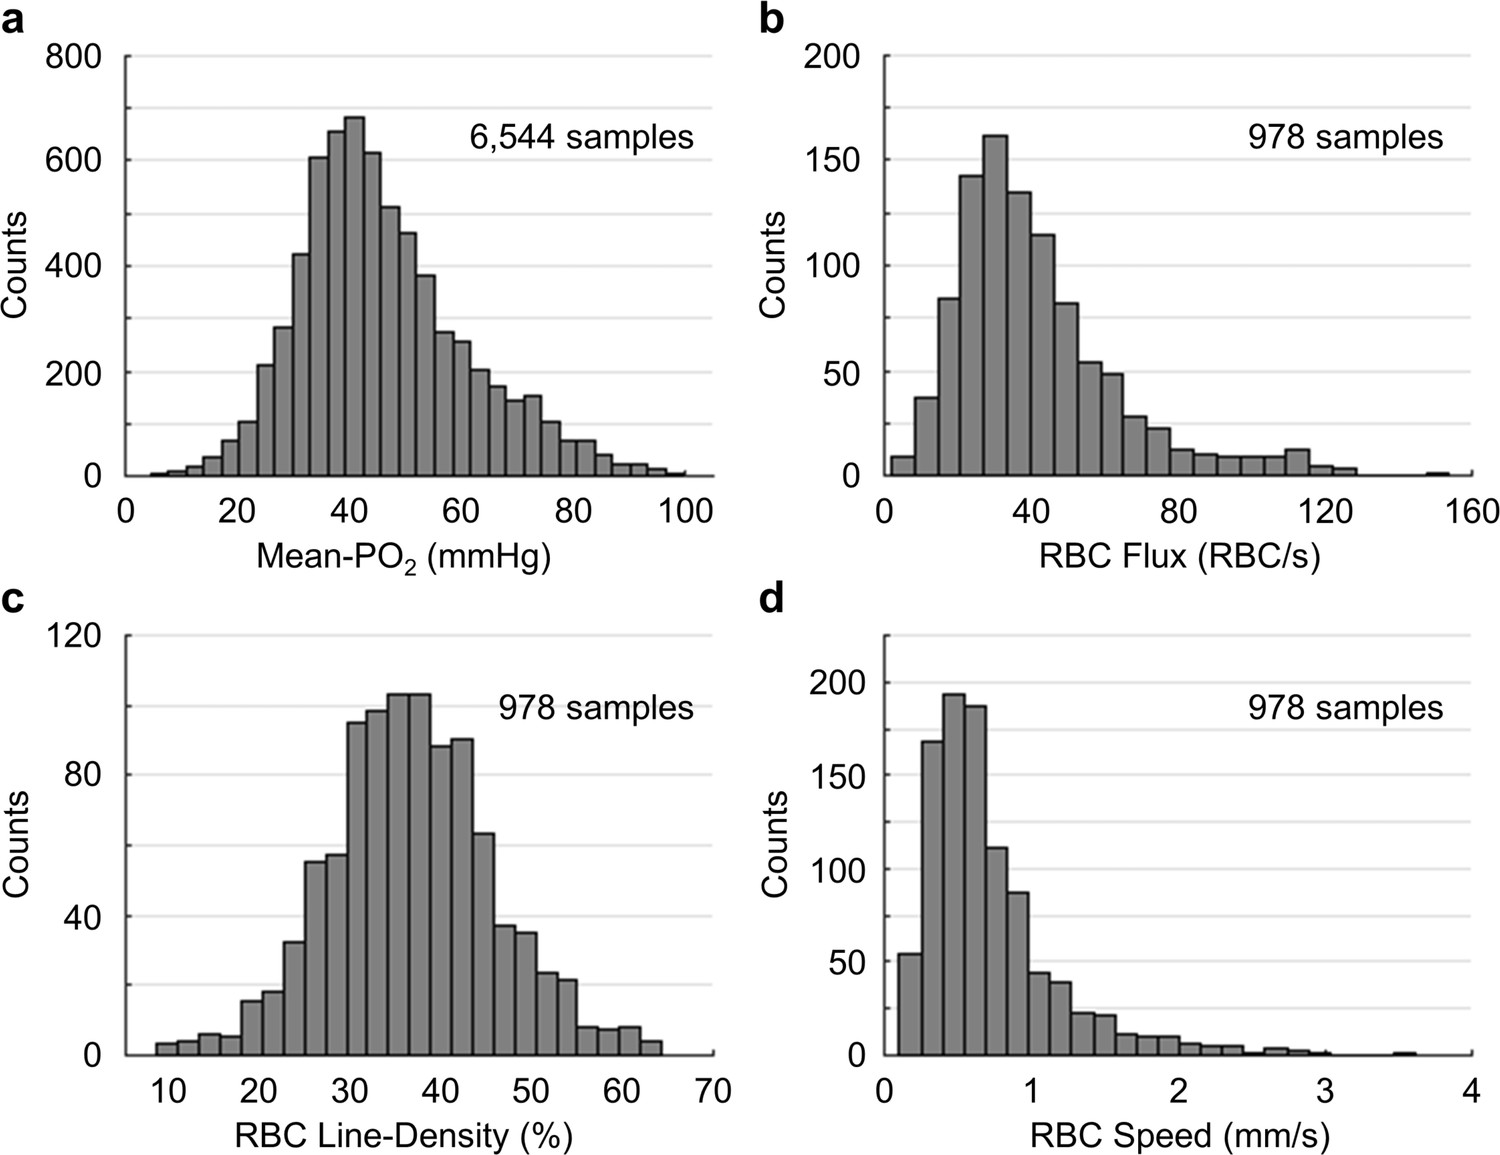
Histograms of capillary Mean-PO2, RBC flux, line-density and speed.
(a) Capillary Mean-PO2 was measured in 6544 capillary segments, across n = 15 mice. The Mean-PO2 range is from ~5 mmHg to ~100 mmHg (mean value: 45.6 ± 1.4 mmHg). (b–d) Capillary RBC flux, line-density and speed were measured in a subset of capillaries (978 segments). The RBC flux range (b) is from ~2 RBC/s to ~154 RBC/s (mean value: 41.5 ± 1.2 RBC/s); the line-density range (c) is from 8.6% to 64.4% (mean value: 37.2 ± 0.7%); the speed range (d) is from 0.11 mm/s to 3.63 mm/s (mean value: 0.71 ± 0.03 mm/s).
Figure 1—figure supplement 2
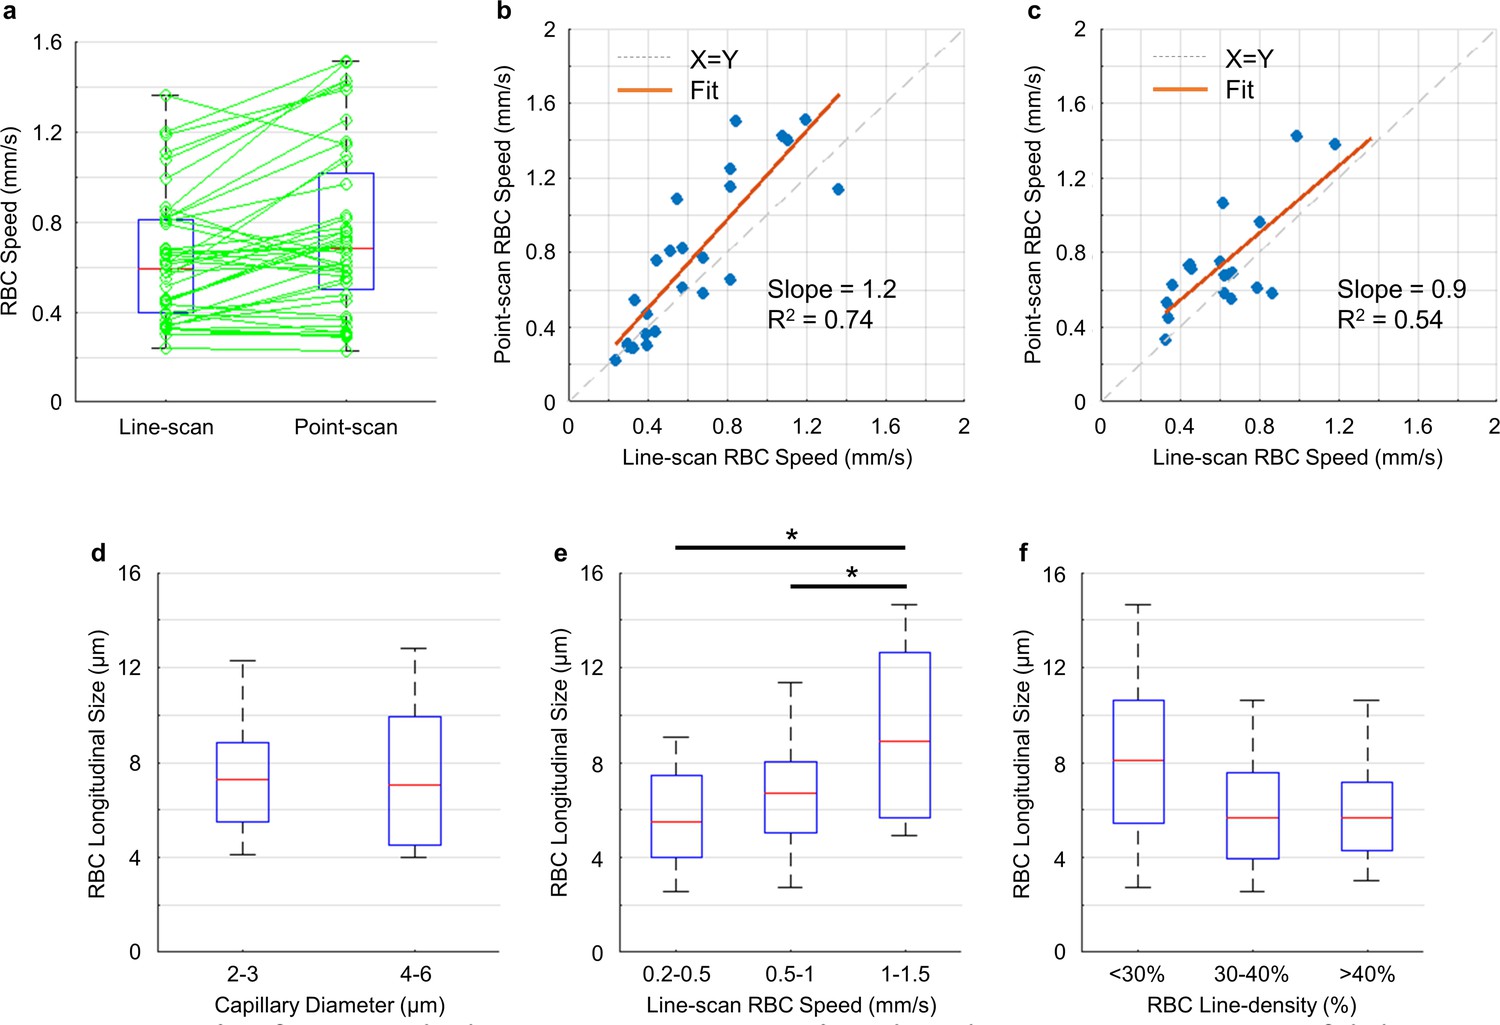
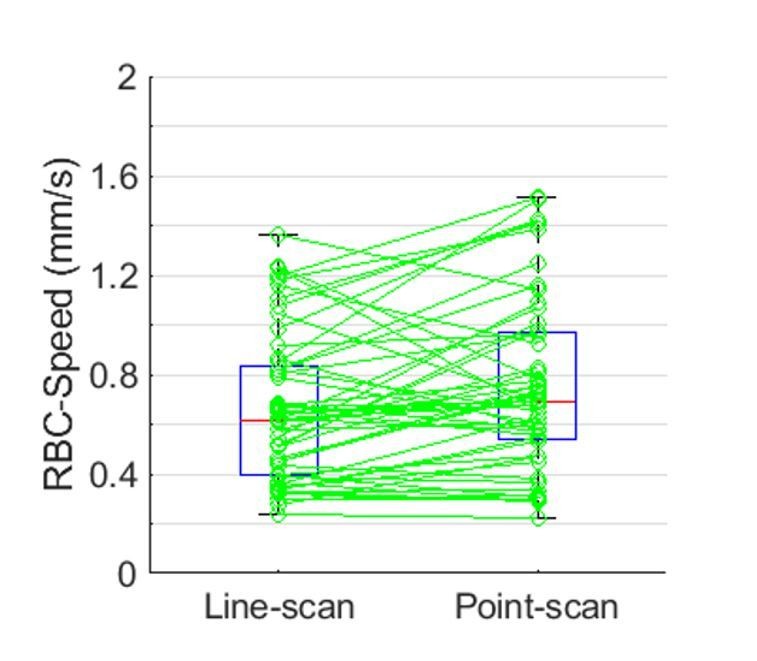
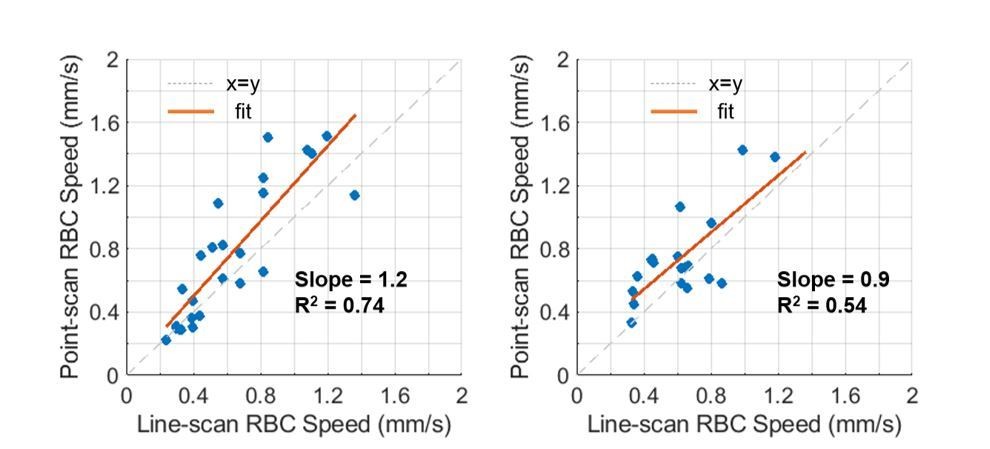
Comparison between the capillary RBC speed measurements by the line-scan and point-scan methods.
Estimation of the RBC speed based on the measured RBC-passage time through the excitation focal volume (i.e. ‘RBC-passage’ or ‘point-scan’ method) requires a knowledge of the RBC longitudinal size. In this work, we assumed a constant RBC longitudinal size (6 µm) (Unekawa et al., 2010) when estimating the RBC speed (please see Materials and methods section for details). However, the RBC longitudinal size may vary with capillary diameter, RBC speed and hematocrit (Chaigneau et al., 2003). To better understand this limitation, we performed line-scan measurements in 58 capillaries in two awake C57BL/6 mice (3–5 months old, female, 20–25 g, Charles River Laboratories). The cranial window was prepared following the same protocol as described in the Materials and methods section. The blood plasma was labeled by dextran-conjugated Sulforhodamine-B (0.1 ml at 5% W/V in saline, Sigma R9379). The line-scans (2-s-long acquisition in each capillary with 2 kHz line-scan rate) were performed within the cortical depth of 0–200 µm. The RBC speed was calculated from the line-scan images with the procedures described in Kleinfeld et al. (1998). In addition, we extracted the fluorescence intensity time courses from the same parallel line-scan images, and then the RBC speed was calculated by using the procedures described in the Methods section (i.e. by the ‘point-scan’ or ‘RBC-passage’ method). Furthermore, we investigated the dependence of RBC longitudinal size on capillary diameter, RBC speed, and linear-density. (a) The capillary RBC speed values estimated simultaneously by both the line-scan and point-scan methods. The RBC speed values obtained by the two methods in each capillary (green circles) are connected by green lines. Boxplots of the line-scan and point-scan RBC-speed values indicate the median values, the 1st and 3rd quartiles, and the maximum and minimum values. (b) and (c) Correlation between the line-scan and point-scan RBC speed values from the same n = 58 capillaries used in a), grouped by the capillary diameter: 2–3 µm (b) and 3–5 µm (c). In panels b and c, we also presented the corresponding linear regression lines (orange), as well as their slopes and coefficients of determination (R2). (d-f) Dependence of the RBC longitudinal size on capillary diameter (d), RBC speed (e), and line-density (f). For each of the 58 capillaries, we estimated the capillary diameter by fitting the transversal intensity profile to a Gaussian model. The diameters were calculated as the full width at half maximum of the Gaussian profiles. The RBC line-density and longitudinal size were calculated by following the procedures described in Chaigneau et al. (2003). By averaging over all the RBCs identified in each capillary and then across the 58 capillaries, we obtained the mean RBC longitudinal size (6.9 ± 3.0 µm; Mean ±STD). The mean RBC longitudinal size in the capillaries with smaller diameter (2–3 µm; panel d) was just slightly (statistically not significantly) larger than in the capillaries with larger diameter (4–6 µm). This result can be expected as the RBCs in the smaller capillaries may be squeezed to a greater extent. We further observed that the RBC longitudinal size increased with RBC speed (e), where the RBC longitudinal size in the fastest group of capillaries (1–1.5 mm/s) was statistically significantly larger than in the other two lower speed groups. Finally, the capillaries with lower-line-density had more elongated RBC size than the capillaries with median- and higher-line-density (f), although the difference was not statistically significant. The statistical comparison in d) was conducted using Student’s t-test. The statistical comparisons in e) and f) were conducted using ANOVA followed by a Tukey-HSD post-hoc test. The asterisk symbol indicates p<0.05. Data from 58 capillaries were used for the analysis in a and (d-f) and data from 25 and 19 capillaries were used for the analysis in b and c, respectively. In addition, we analyzed the temporal fluctuation of the RBC longitudinal size during the 2-s-long acquisition. For each capillary, we computed the standard deviation (STD) and coefficient of variance (CV) of the RBC longitudinal size from the individual RBC measurements acquired during the 2-s-long acquisition. Then, we obtained the mean STD (2.3 ± 0.6 µm) and CV (0.4 ± 0.1) values averaging over the 58 capillaries. Based on presented results, RBC longitudinal size may be different from capillary to capillary as a function of capillary diameter, RBC speed, and line-density, and may vary over time within the same capillaries. The RBC longitudinal size was especially large at high RBC speed (e). In addition, the average temporal fluctuation of the RBC longitudinal size was moderate (STD = 2.3 ± 0.6 µm). Finally, pairwise comparisons between the RBC speed values obtained by the two methods (a–c) reveal variability, especially at the high RBC speed. Therefore, instantaneous RBC speed obtained by the point-scan method may have larger measurement error, which needs to be considered when interpreting the data. On the other hand, the small difference between the mean RBC speed obtained in the paired measurements (a) did not reach statistical significance (Student’s t-test), and the linear regression slopes in panels b and c are reasonably close to 1. Therefore, for the purpose of providing mean values for group comparison, the RBC speed measurements based on the point-scan method, while limited by assuming the constant RBC longitudinal length, may still be reasonably accurate. Please note that regarding the extreme values of the estimated RBC longitudinal size (d–f), they were calculated as the product of the fitted temporal width of the shadows and the RBC speed, both of which were extracted from the line-scan images. Measurements of both these parameters have limitations. The line-scan method is less accurate for high RBC speed, while estimation of the shadow width sometimes may be influenced by the stacked RBCs, and the fluorescence intensity time courses may be noisier when acquired with the line-scan method (due to shorter dwelling time per time-point) than with the point-scan method.
Figure 2
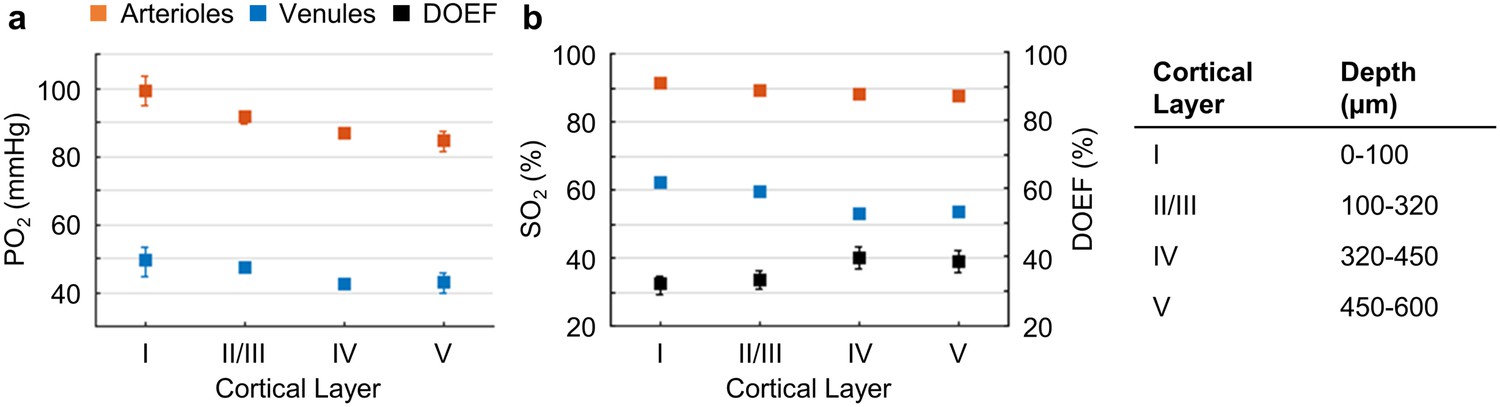
Cortical layer-dependent distributions of the arteriolar and venular intravascular PO2 and SO2.
(a) Intravascular PO2 in the diving arterioles (red symbols) and venules (blue symbols) across cortical layers I-V (11 arterioles, 14 venules, from n = 7 mice). (b) SO2 in the diving arterioles (red symbols) and venules (blue symbols) across cortical layers I-V, and the depth-dependent OEF (DOEF, black symbols). For each diving arteriole or surfacing venule in a and b, PO2 was tracked from the cortical surface down to the cortical depth of 600 µm. Data are expressed as mean ± SEM. Please note that the error bars may be too small to be visible.
Figure 3 with 1 supplement
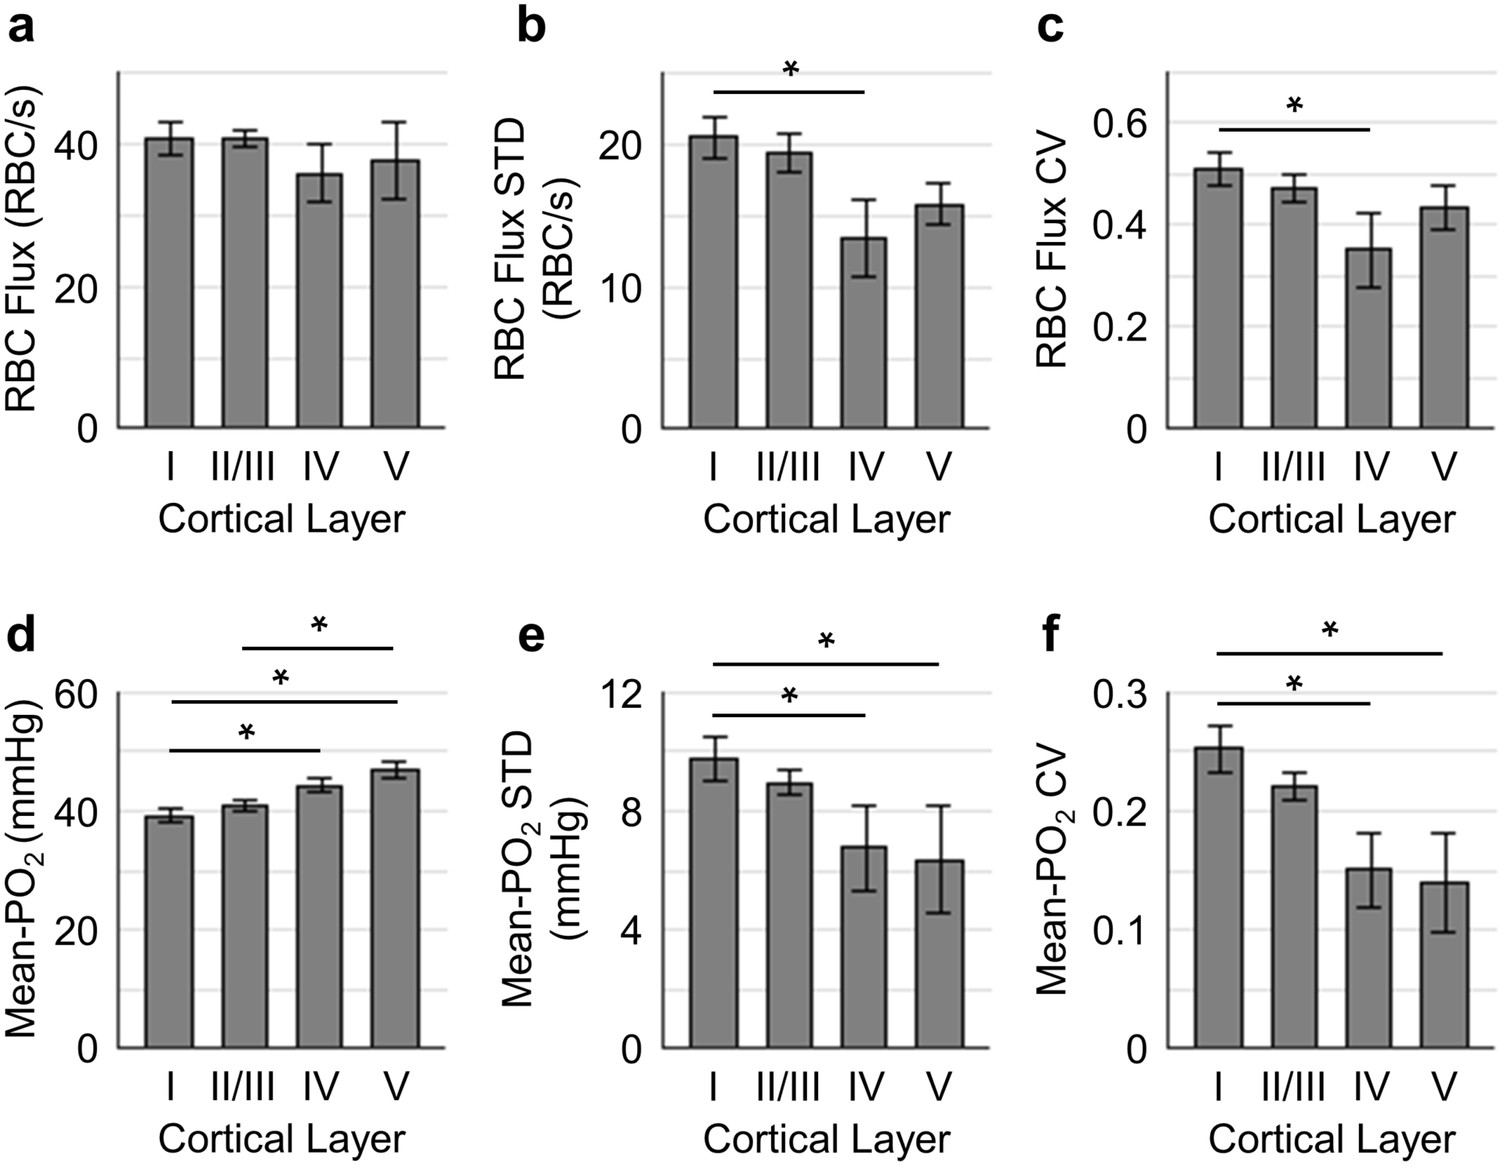
Spatial variations of capillary RBC flux and Mean-PO2 as a function of cortical depth.
The panels (a–c) and (d-f) show the dependence of the absolute values, standard deviations (STDs) and coefficients of variance (CVs) of capillary RBC flux and Mean-PO2 on cortical layer, respectively. The absolute values, STDs and CVs were calculated across capillaries. The analysis in (a–f) was made with 400, 356, 118, and 104 capillaries measured in cortical layers I, II/III, IV and V, respectively, across n = 15 mice. Data are expressed as mean ± SEM. Statistical comparisons were carried out using ANOVA followed by Tukey HSD post hoc test. The asterisk symbol (*) indicates p<0.05.
-
Figure 3—source data 1
Measurements of Mean-PO2, RBC-PO2, InterRBC-PO2 and RBC flux acquired in 978 microvascular segments over n = 15 mice.
- https://doi.org/10.7554/eLife.42299.009
Figure 3—figure supplement 1
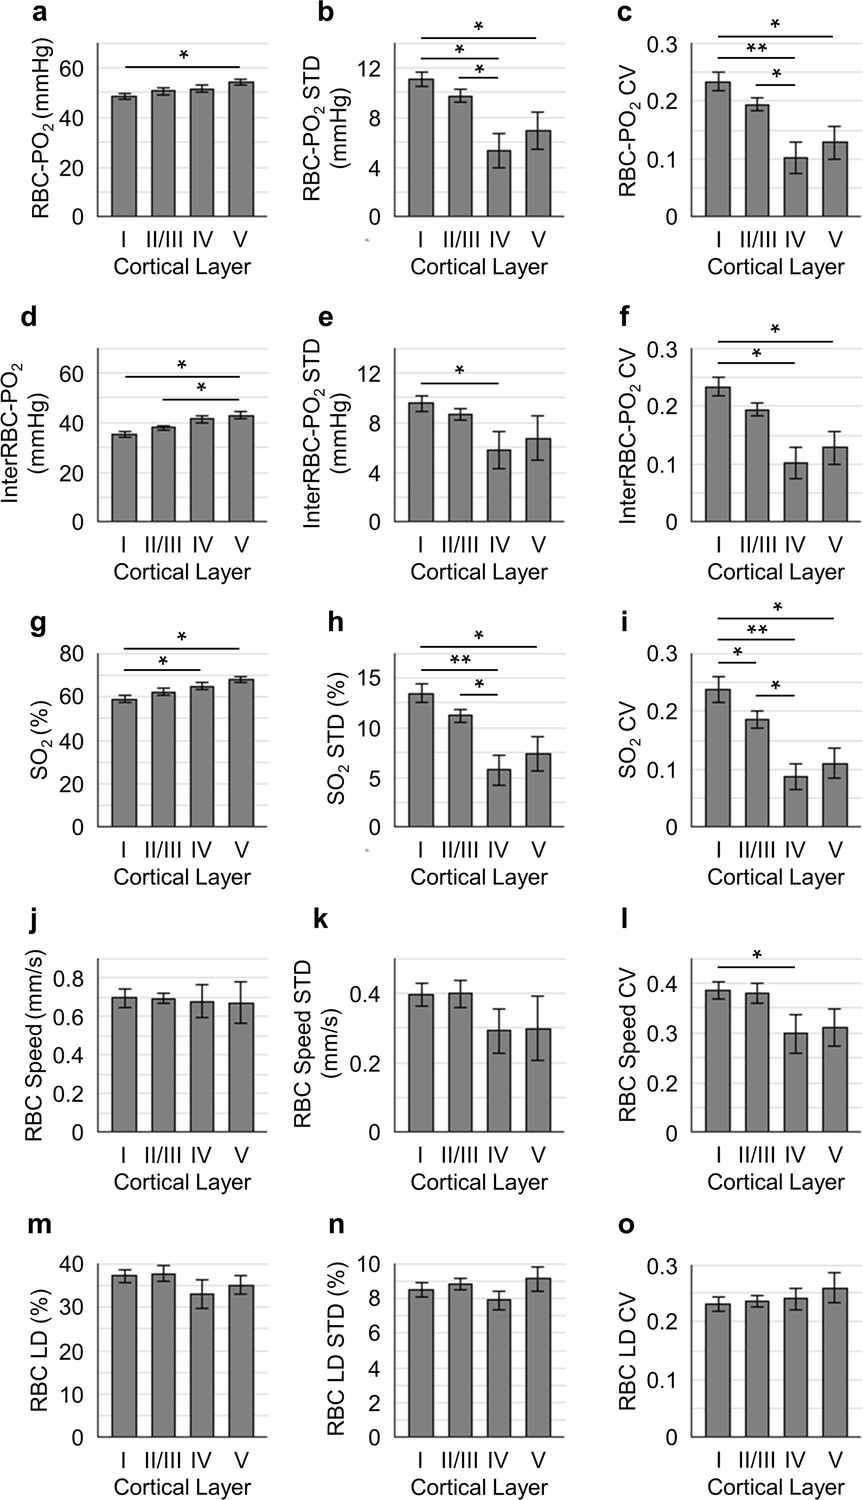
Distributions of capillary RBC-PO2, InterRBC-PO2, SO2, RBC speed, and line-density, and their STDs and CVs as a function of cortical layer.
(a-c) Distributions of the absolute capillary RBC-PO2, RBC-PO2 STD and CV as a function of cortical layer, respectively. (d-f) Distributions of the absolute InterRBC-PO2, InterRBC-PO2 STD and CV as a function of cortical layer, respectively. (g–i) Distributions of the absolute capillary SO2, SO2 STD and CV as a function of cortical layer, respectively. (j–l) Distributions of the absolute capillary RBC speed, speed STD and CV as a function of cortical layer, respectively. (m–o) Distributions of the absolute capillary RBC line-density (LD), LD STD and CV as a function of cortical layer, respectively. The analysis in a–o was made with the measurements acquired in 400, 356, 118 and 104 capillary segments in cortical layers I, II/III, IV and V, respectively, across n = 15 mice. Data are expressed as mean ± SEM. Statistical comparisons were carried out using ANOVA followed by Tukey HSD post hoc test. The single-asterisk symbol (*) indicates p<0.05; the double-asterisk symbol (*) indicates p<0.001.
Figure 4 with 1 supplement
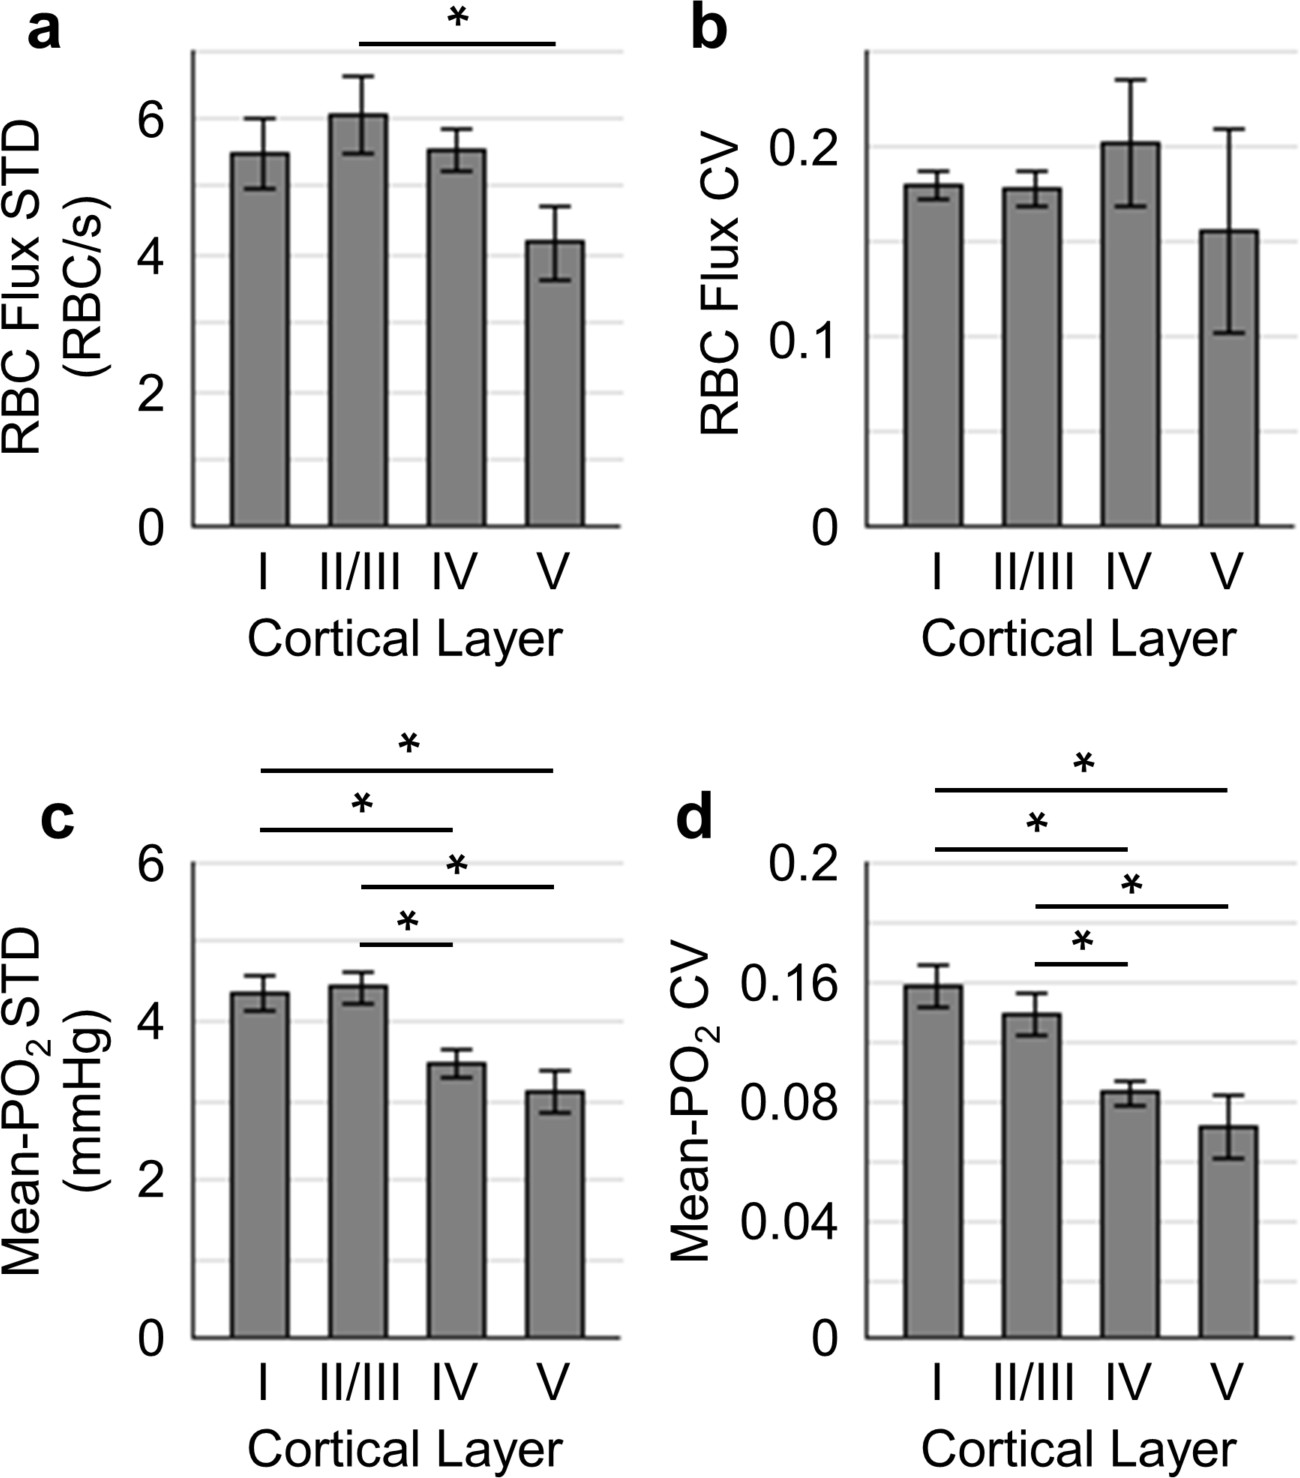
Temporal fluctuations of RBC flux and Mean-PO2 within individual capillaries in cortical layers I-V.
Panels (a–b) and (c–d) show the layer-dependent standard deviations (STDs) and coefficients of variance (CVs) of the temporal fluctuations of RBC flux and Mean-PO2, respectively. The STD and CV of each observable for each capillary were calculated based on the 9-s-long time course. The analysis in (a–d) was made with 130, 140, 63 and 40 samples, collected in cortical layers I, II/III, IV and V, respectively, across n = 7 mice. Each sample corresponds to a 9-s-long, 15-time-point measurement acquired in each capillary. Data are expressed as mean ± SEM. Statistical comparisons were carried out using ANOVA followed by Tukey HSD post hoc test. The asterisk symbol (*) indicates p<0.05.
Figure 4—figure supplement 1
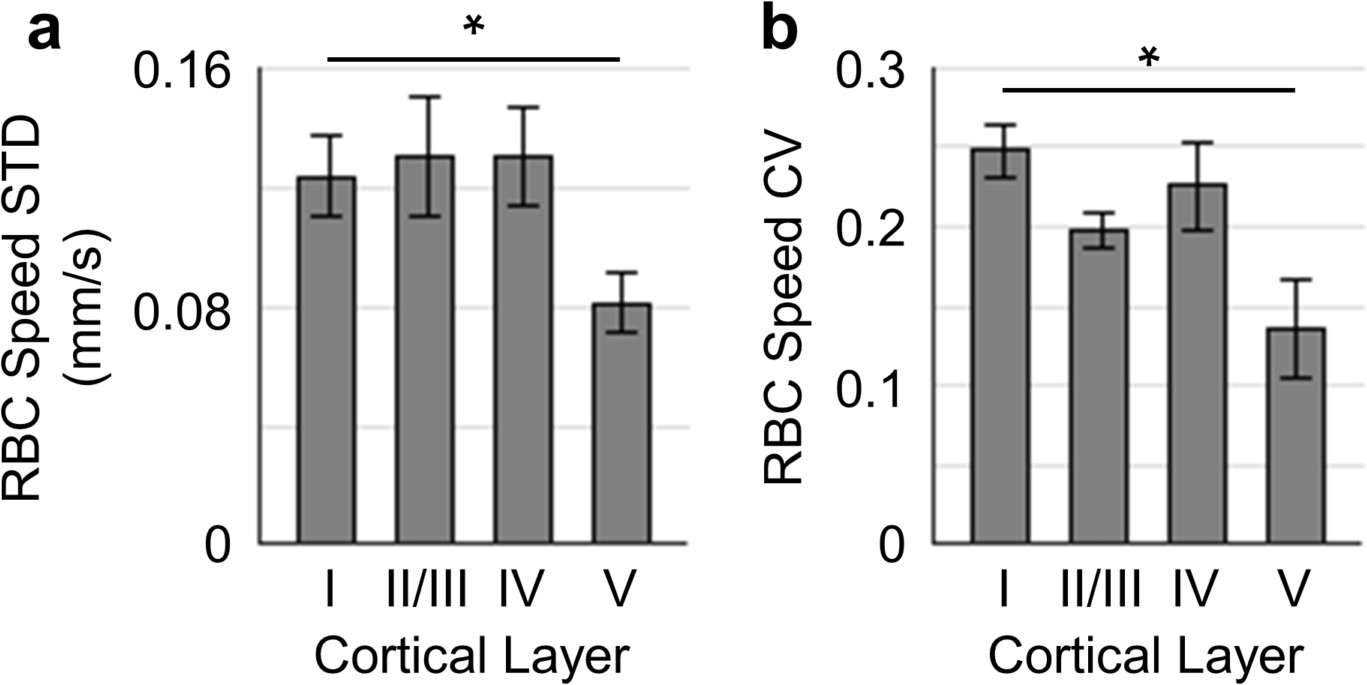
Temporal fluctuations of RBC speed within individual capillaries in cortical layers I-V.
Panels (a–b) show the layer-dependent standard deviations (STDs) and coefficients of variance (CVs) of the temporal fluctuations of RBC speed. The STD and CV of each observable for each capillary were calculated based on the 9-s-long time course. This analysis was made with 130, 140, 63 and 40 samples, collected in cortical layers I, II/III, IV and V, respectively, across n = 7 mice. Each sample corresponds to a 9-s-long, 15-time-point measurement acquired in each capillary. Data are expressed as mean ± SEM. Statistical comparisons were carried out using ANOVA followed by Tukey HSD post hoc test. The single-asterisk symbol (*) indicates p<0.05.
Figure 5 with 1 supplement
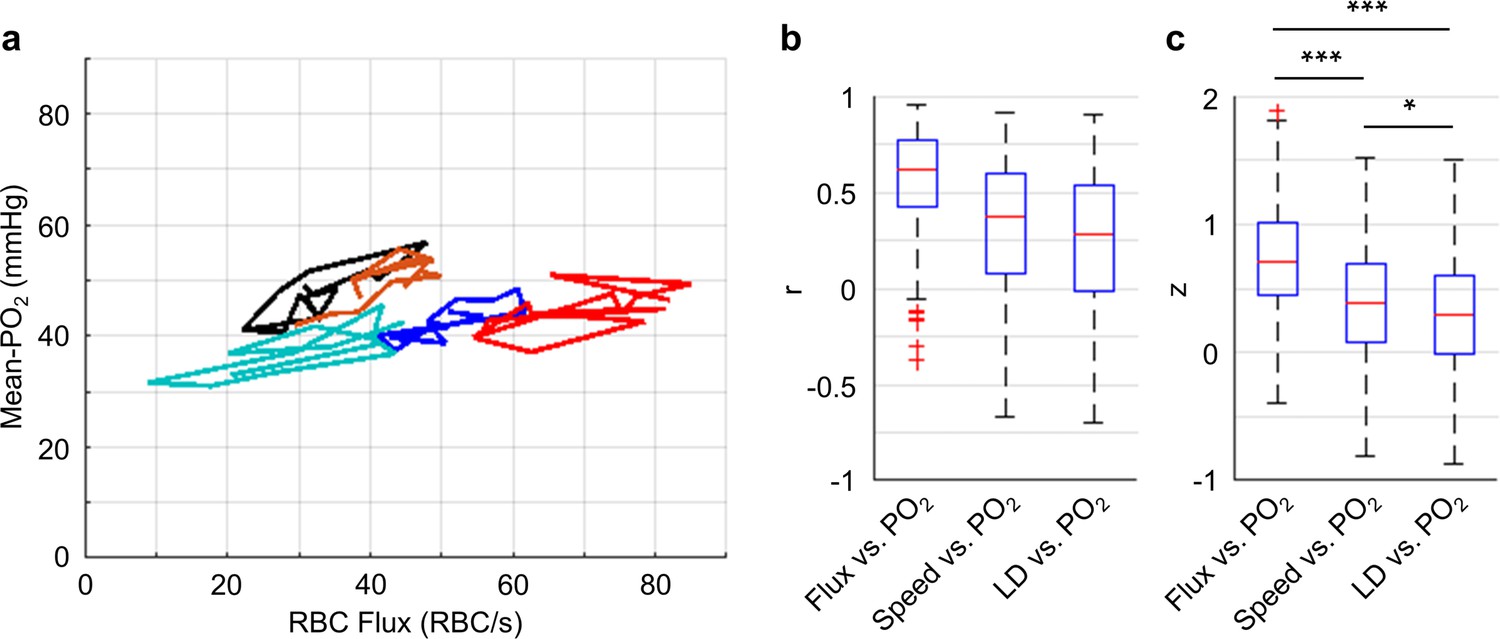
Correlations between the temporal fluctuations of capillary RBC flux, speed, line-density and Mean-PO2.
(a) Temporal evolutions (9-s-long traces with 0.6 s steps) of RBC flux and Mean-PO2 from five representative capillaries. For each capillary, its Mean-PO2 as a function of RBC flux is represented by a different line color; the consecutive time points are connected to illustrate the temporal trajectory of the variation. (b) Boxplots of the pairwise correlation coefficients (r) between the temporal fluctuations of capillary RBC flux, speed, line-density (LD) and Mean-PO2. (c) Boxplots of the Fisher z values calculated based on the r values in b. The analysis in b and c was made with 373 capillaries, collected in cortical layers I-V, across n = 7 mice. Statistical comparisons were carried out using ANOVA followed by Tukey HSD post hoc test. The single-asterisk symbol (*) indicates p<0.05; the triple-asterisk symbol (***) indicates p<0.0001.
Figure 5—figure supplement 1
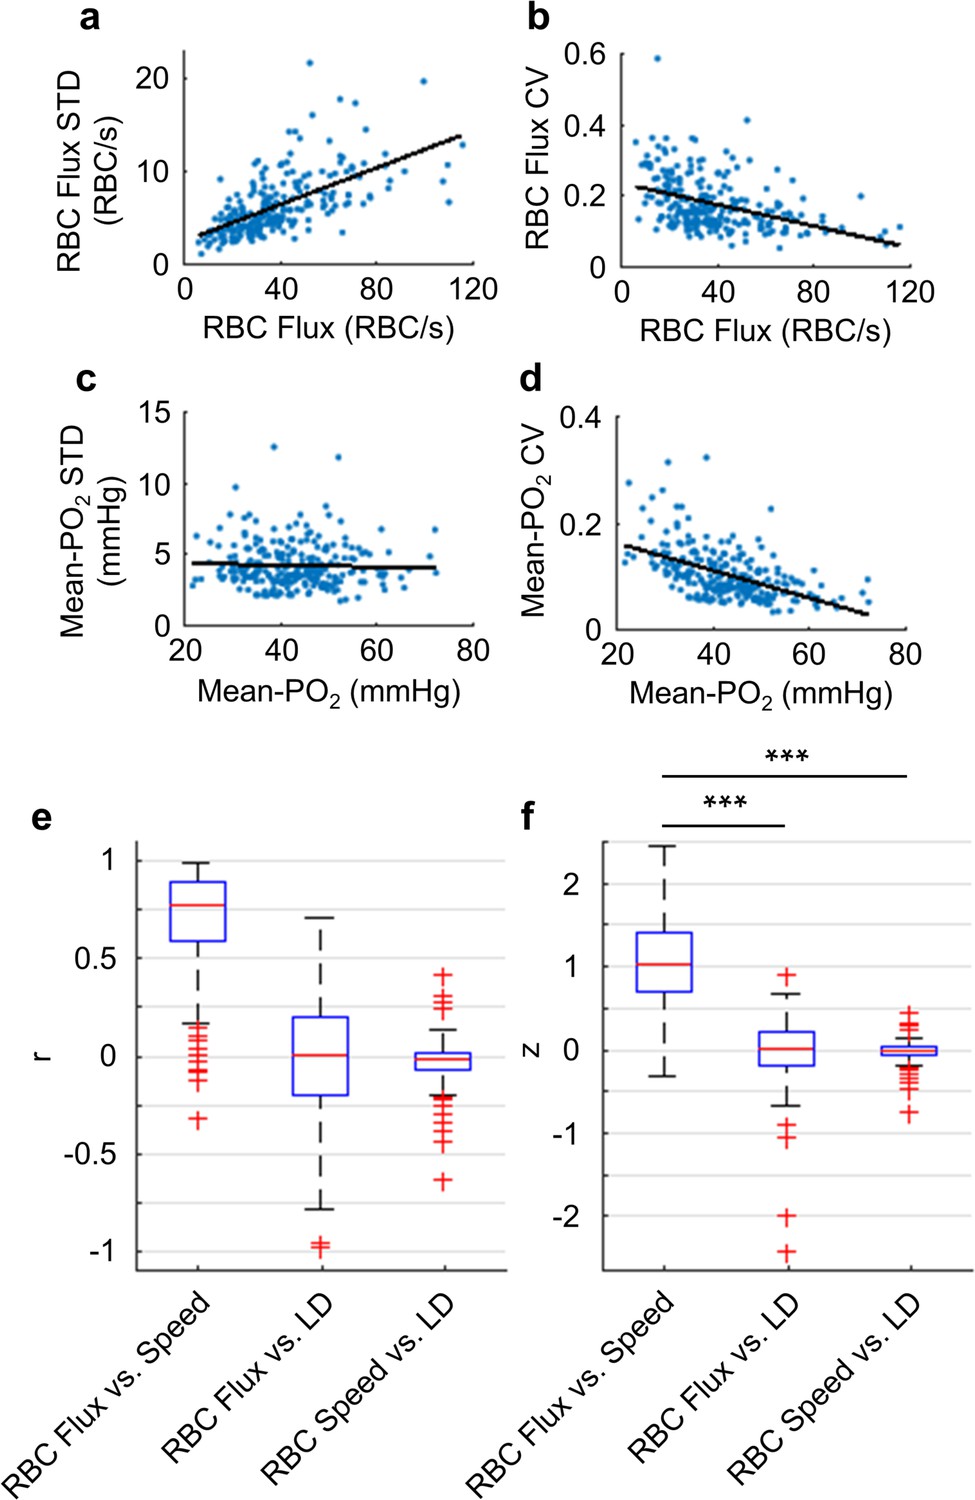
Quantifications of the temporal fluctuations of capillary RBC flux, speed, line-density and Mean-PO2.
(a-d) Correlations between the STDs and CVs of the temporal fluctuations of capillary RBC flux and Mean-PO2 and their mean absolute values, calculated based on the 9-s-long measurements. The data points are represented by the blue dots. The linear regression lines of the correlations are in black. The computed slope (and R2) values of the linear regressions in panels a–d are: 0.1 (R2 = 0.4),–0.002 s∙RBC−1 (R2 = 0.17),–0.01 (R2 = 0.001) and −0.003 mmHg−1 (R2 = 0.3), respectively. (e–f) Pairwise correlations between the temporal fluctuations of RBC flux, speed and line-density (LD). The panel e presents the correlation coefficients (r); the panel f presents the Fisher z values. The analysis in a–f was made with the measurements from 373 capillary segments in cortical layers I-V, across n = 7 mice. Statistical comparisons were carried out using ANOVA followed by Tukey HSD post hoc test. The triple-asterisk symbol (***) indicates p<0.0001.
Figure 6 with 1 supplement
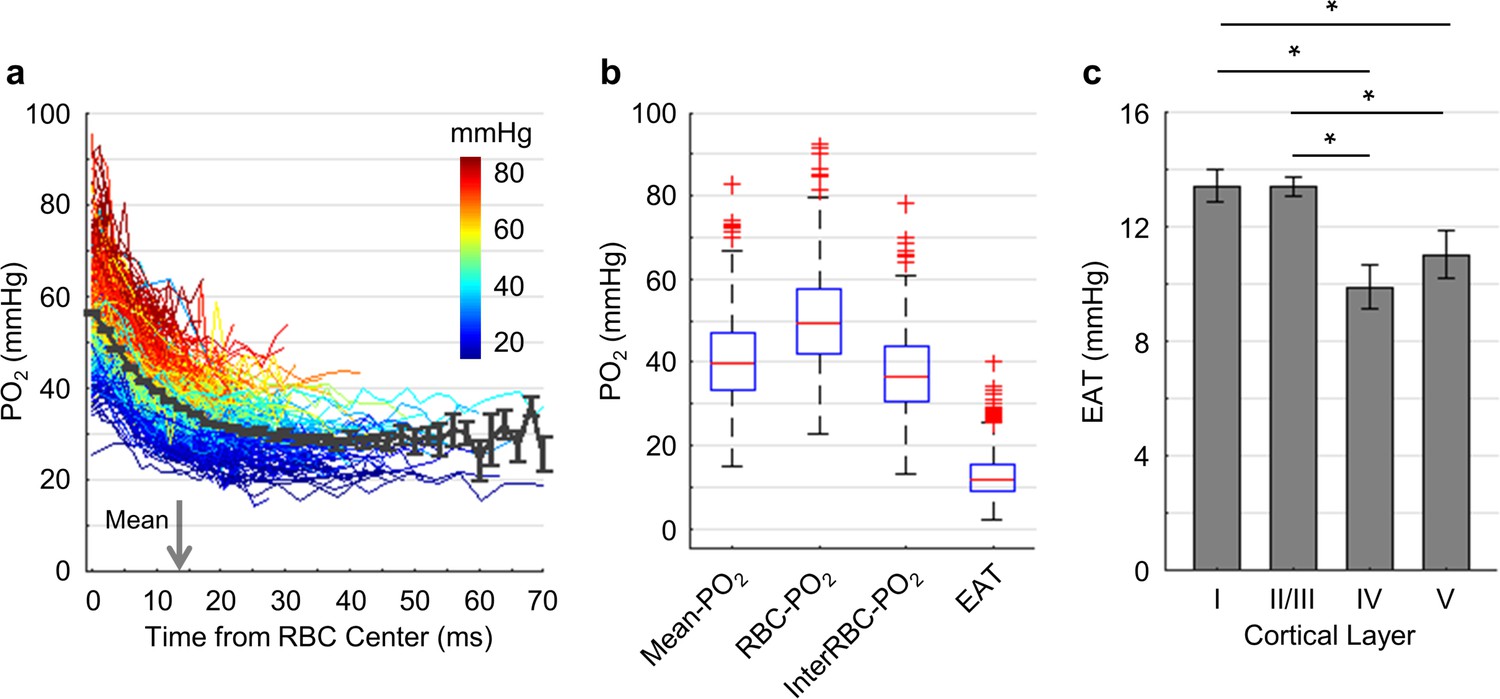
Dependence of EAT on cortical layer.
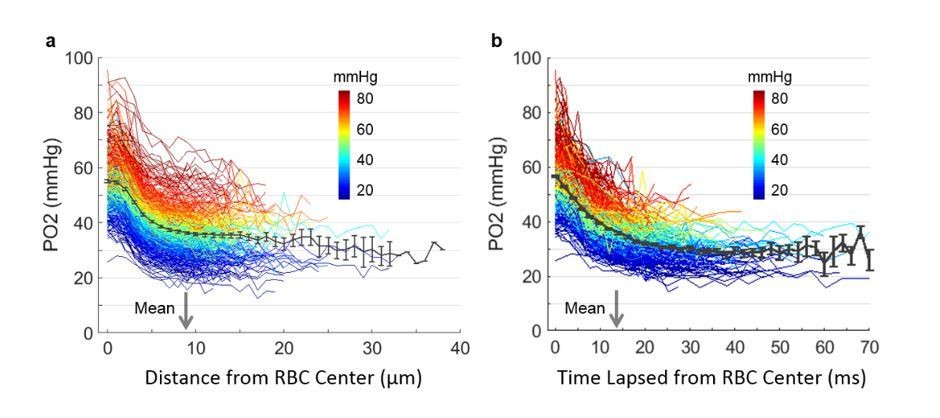
(a) Intracapillary PO2 gradients. The PO2 gradients measured in different capillaries (373 capillaries across n = 7 mice) are color-coded based on their Mean-PO2 values. The black curve represents the average PO2 gradient. The gray arrow denotes the mean half-time-gap between adjacent RBCs (13.5 ms). (b) Boxplots of capillary Mean-PO2, RBC-PO2, InterRBC-PO2 and EAT. (c) Dependence of EAT on cortical layer. The analysis in c was made with 130, 140, 63 and 40 capillaries measured in cortical layers I, II/III, IV and V, respectively, across n = 7 mice. Data are expressed as mean ± SEM. Statistical comparisons were carried out using ANOVA followed by Tukey HSD post hoc test. The single-asterisk symbol (*) indicates p<0.05.
Figure 6—figure supplement 1
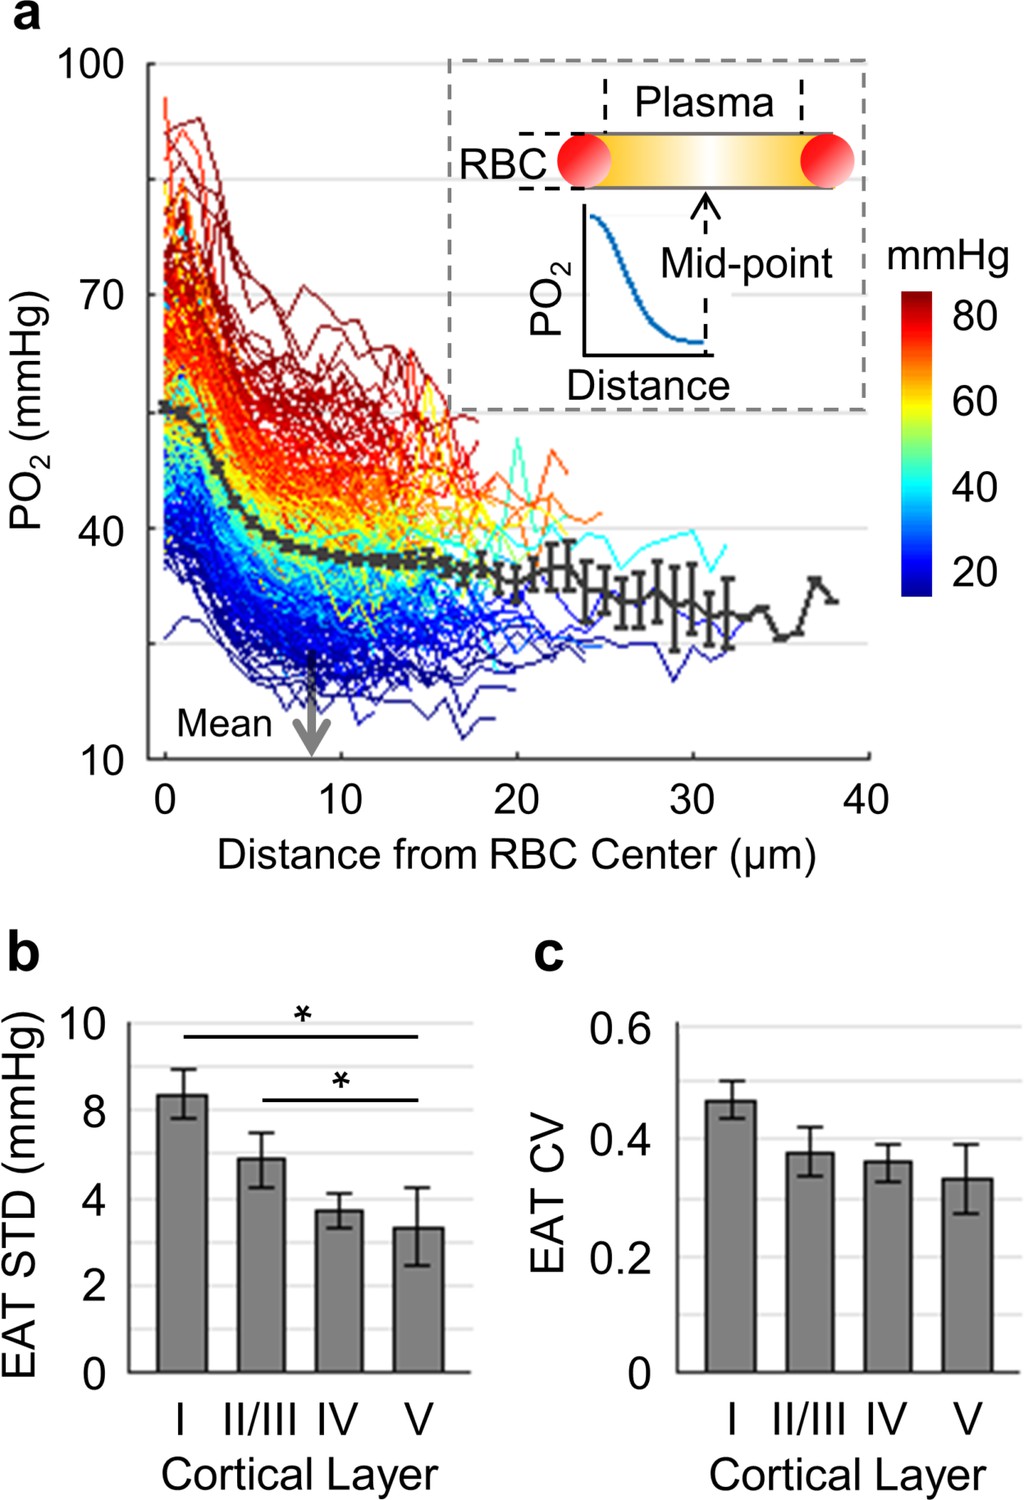
Dependence of EAT STD and CV on cortical layer.
(a) The PO2 gradients were measured in 373 capillaries across n = 7 mice, with imaging penetration down to 600 µm in the cortex. The capillaries are color-coded based on their Mean-PO2 values. The inset schematically illustrates the intracapillary PO2 gradient. Shown in this figure, PO2 in the blood plasma was grouped as a function of distance to the nearest RBC centers. Averaging over all the assessed capillaries, PO2 (black curve) decreased from 55.0 ± 0.6 mmHg at the RBC center to 30.0 ± 7.8 mmHg, 30 µm away from the RBC center, where the PO2 measurements were typically associated with the low-line-density capillaries. However, in most capillaries the half-distance between adjacent RBCs was much smaller than 30 µm. The mean half-distance between adjacent RBCs was estimated to be 8.0 ± 0.7 µm (denoted by the gray arrow). (b and c) Dependence of EAT STD and CV on cortical layer, respectively. The analysis in b and c was made with 130, 140, 63 and 40 capillaries measured in cortical layers I, II/III, IV and V, respectively, across n = 7 mice. Data are expressed as mean ± SEM. Statistical comparisons were carried out using ANOVA followed by Tukey HSD post hoc test. The single-asterisk symbol (*) indicates p<0.05.
Figure 7 with 5 supplements
Capillary flow and oxygenation in the upstream and downstream branches.
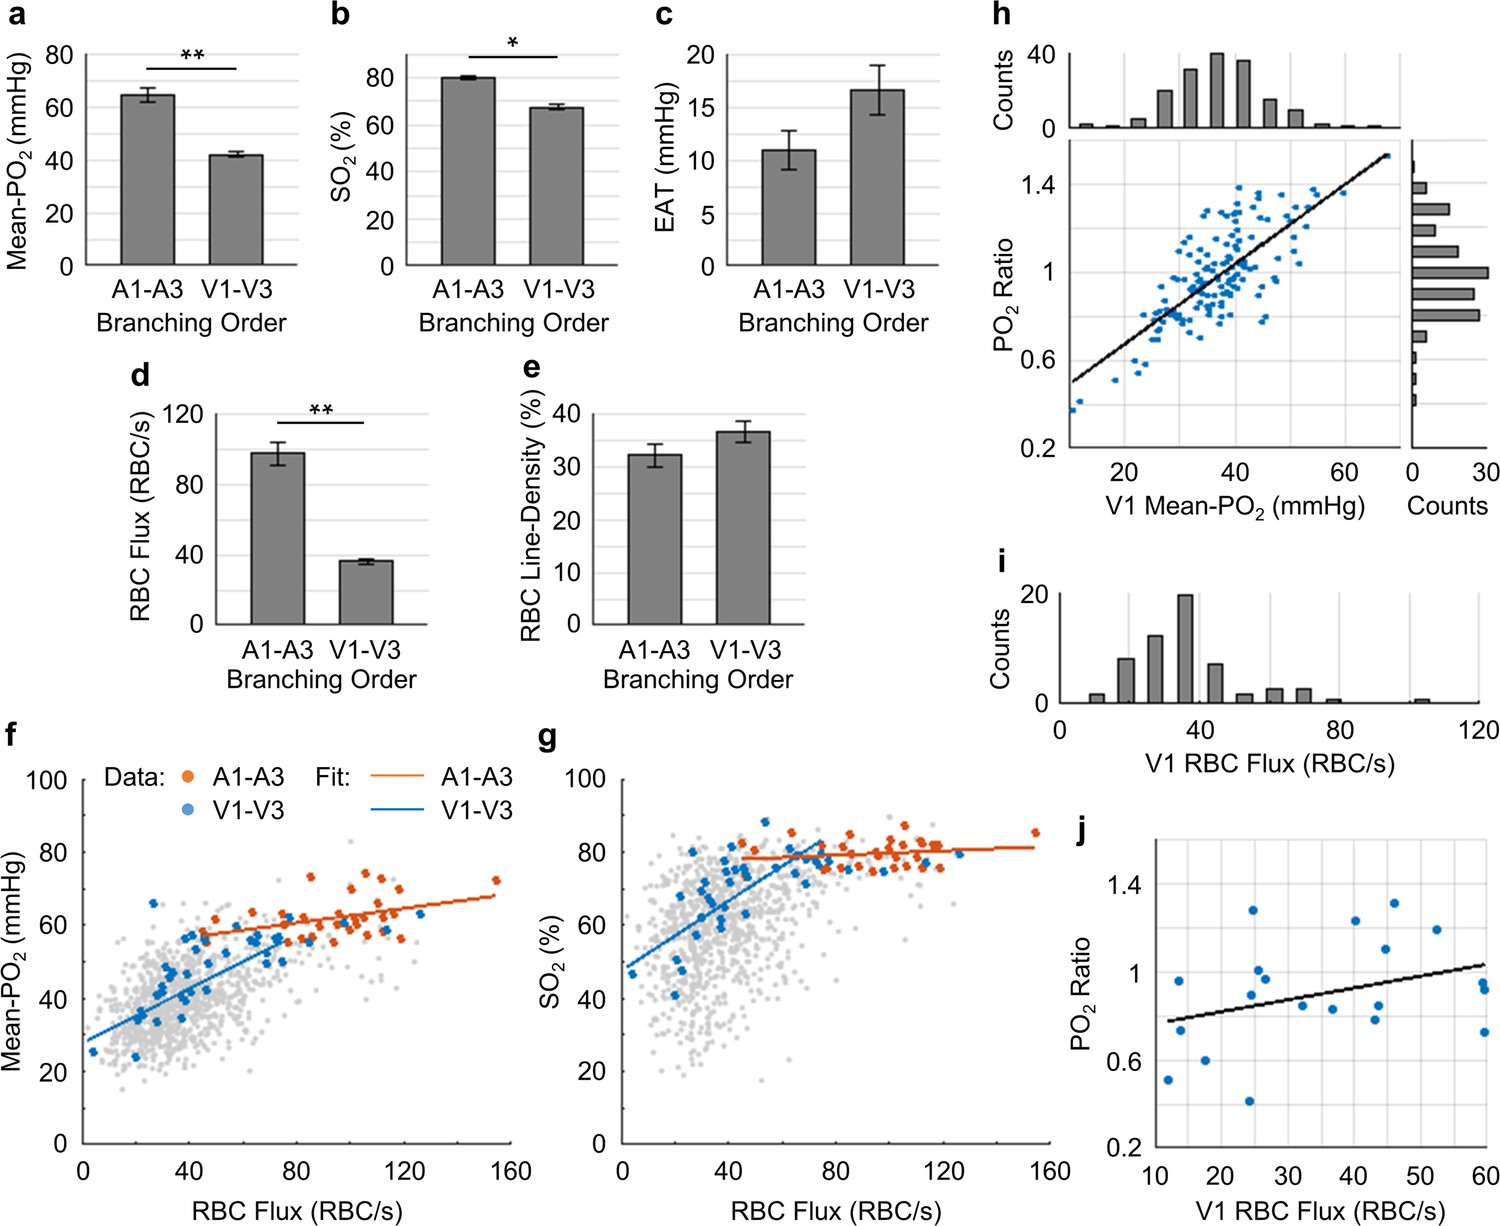
(a-e) Average capillary Mean-PO2, SO2, EAT, RBC flux and line-density, in the upstream (A1–A3) and downstream (V1–V3) capillary branches, across cortical layers I-III. Data are expressed as mean ± SEM. Statistical comparisons were carried out using Student’s t-test. The single-asterisk symbol (*) indicates p<0.05; the double-asterisk symbol (**) indicates p<0.001. (f and g) Correlations between capillary RBC flux and Mean-PO2 (f) and SO2 (g). Data points and regression lines from the A1-A3, V1-V3, and all capillary segments (branching order unassigned) are color-coded red, blue, and gray, respectively. Linear regression slopes in f: V1-V3 slope = 0.37 mmHg∙s∙RBC−1 (R2 = 0.61), A1-A3 slope = 0.1 mmHg∙s∙RBC−1 (R2 ≈ 0.17). Linear regression slopes in g: V1-V3 slope = 0.50 s∙RBC−1 (R2 = 0.52), A1-A3 slope = 0.03 s∙RBC−1 (R2≈0.04). The analysis in a–g was made with 47 upstream and 50 downstream capillaries, across n = 5 mice. (h) Correlation between the PO2 ratio (the V1 capillary Mean-PO2 to the adjacent PCV PO2) and the V1 capillary Mean-PO2. Histograms of the V1 capillary Mean-PO2, and PO2 ratio are at the top and on the right from the main panel, respectively (178 capillaries, across n = 5 mice). (i) Histogram of the V1 capillary RBC flux (65 capillaries, across n = 5 mice). (j) Correlation between the V1 capillary RBC flux and PO2 ratio (20 capillaries, across n = 5 mice). The linear regression slope = 0.01 s∙RBC−1 (R2≈0.12).
Figure 7—figure supplement 1
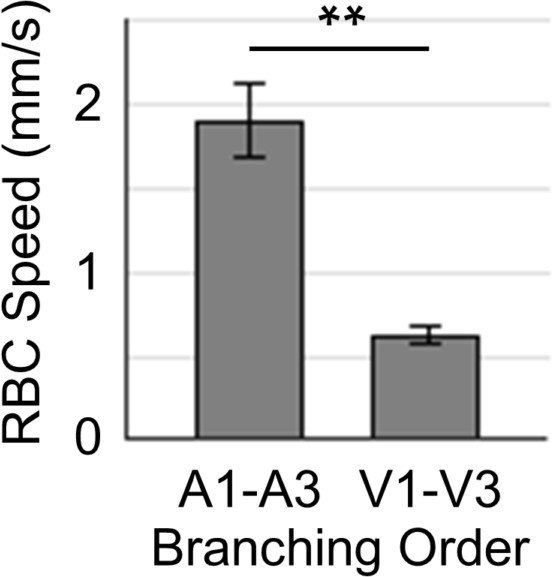
Average capillary RBC speed in the upstream (A1–A3) and downstream (V1–V3) capillary branches, across cortical layers I-III.
Data are expressed as mean ± SEM. Statistical comparisons were carried out using Student’s t-test. The double-asterisk symbol (**) indicates p<0.001. This analysis was made with 47 upstream and 50 downstream capillaries, across n = 5 mice.
Figure 7—figure supplement 2

Pairwise relations between capillary RBC flux, speed, line-density and Mean-PO2.
The analysis in (a–e) was made with the measurements from 978 capillary segments collected in cortical layers I-V, across n = 15 mice. Data are expressed as mean ± SEM. In (c), the slope of the linear regression line was calculated as ~0.02 mm/RBC (R2 =~ 0.84).
Figure 7—figure supplement 3

Relations between capillary RBC line-density, Mean-PO2, flux, speed and EAT.
The analysis in (a–d) was made with the measurements from 373 capillary segments collected in cortical layers I-V, across n = 7 mice. Data are expressed as mean ± SEM.
Figure 7—figure supplement 4
Identification of a capillary segment having stalled RBC flow.
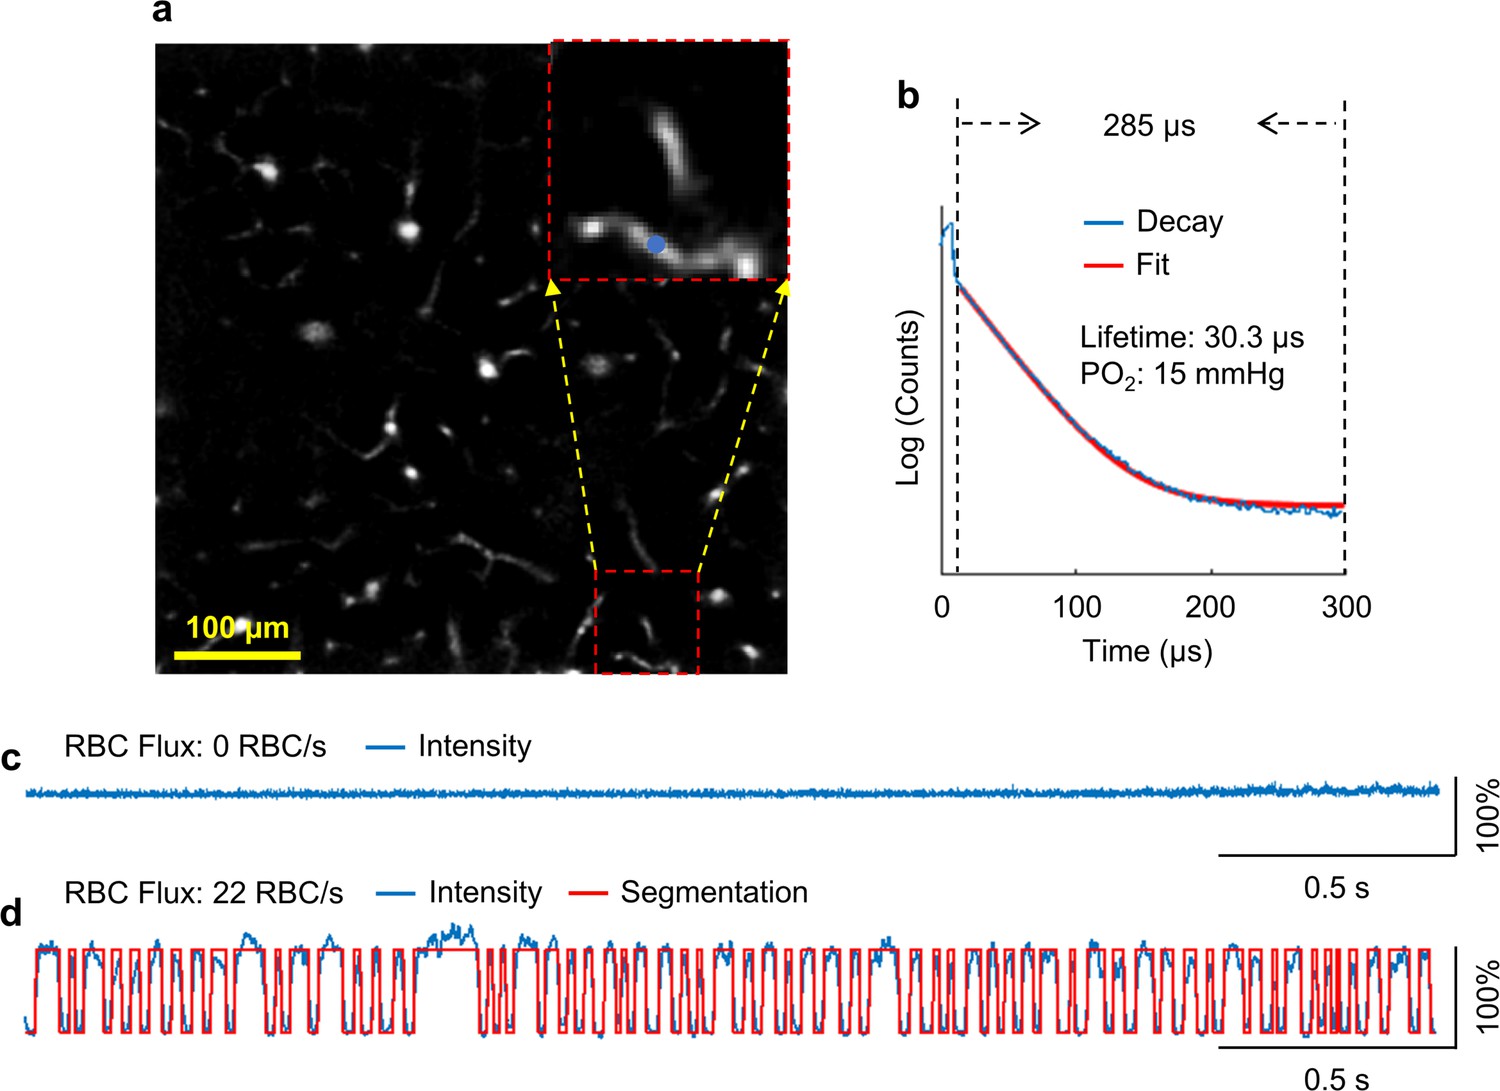
(a) A Sulforhodamine-B labeled mouse cortical microvasculature. The enlarged image includes the stalled capillary segment. The PO2 measurement was performed on the location denoted by the blue dot. (b) The average phosphorescence decay recorded on the measurement location in a. The 285-µs-long phosphorescence decay was used to calculate the phosphorescence lifetime. (c) The associated phosphorescence intensity time course (3 s trace) acquired on the measurement location in a. d. A phosphorescence intensity time course (3 s trace) acquired in an arbitrary non-stalled capillary segment as a comparison.
Figure 7—figure supplement 5
Identification of a suspected thoroughfare capillary.
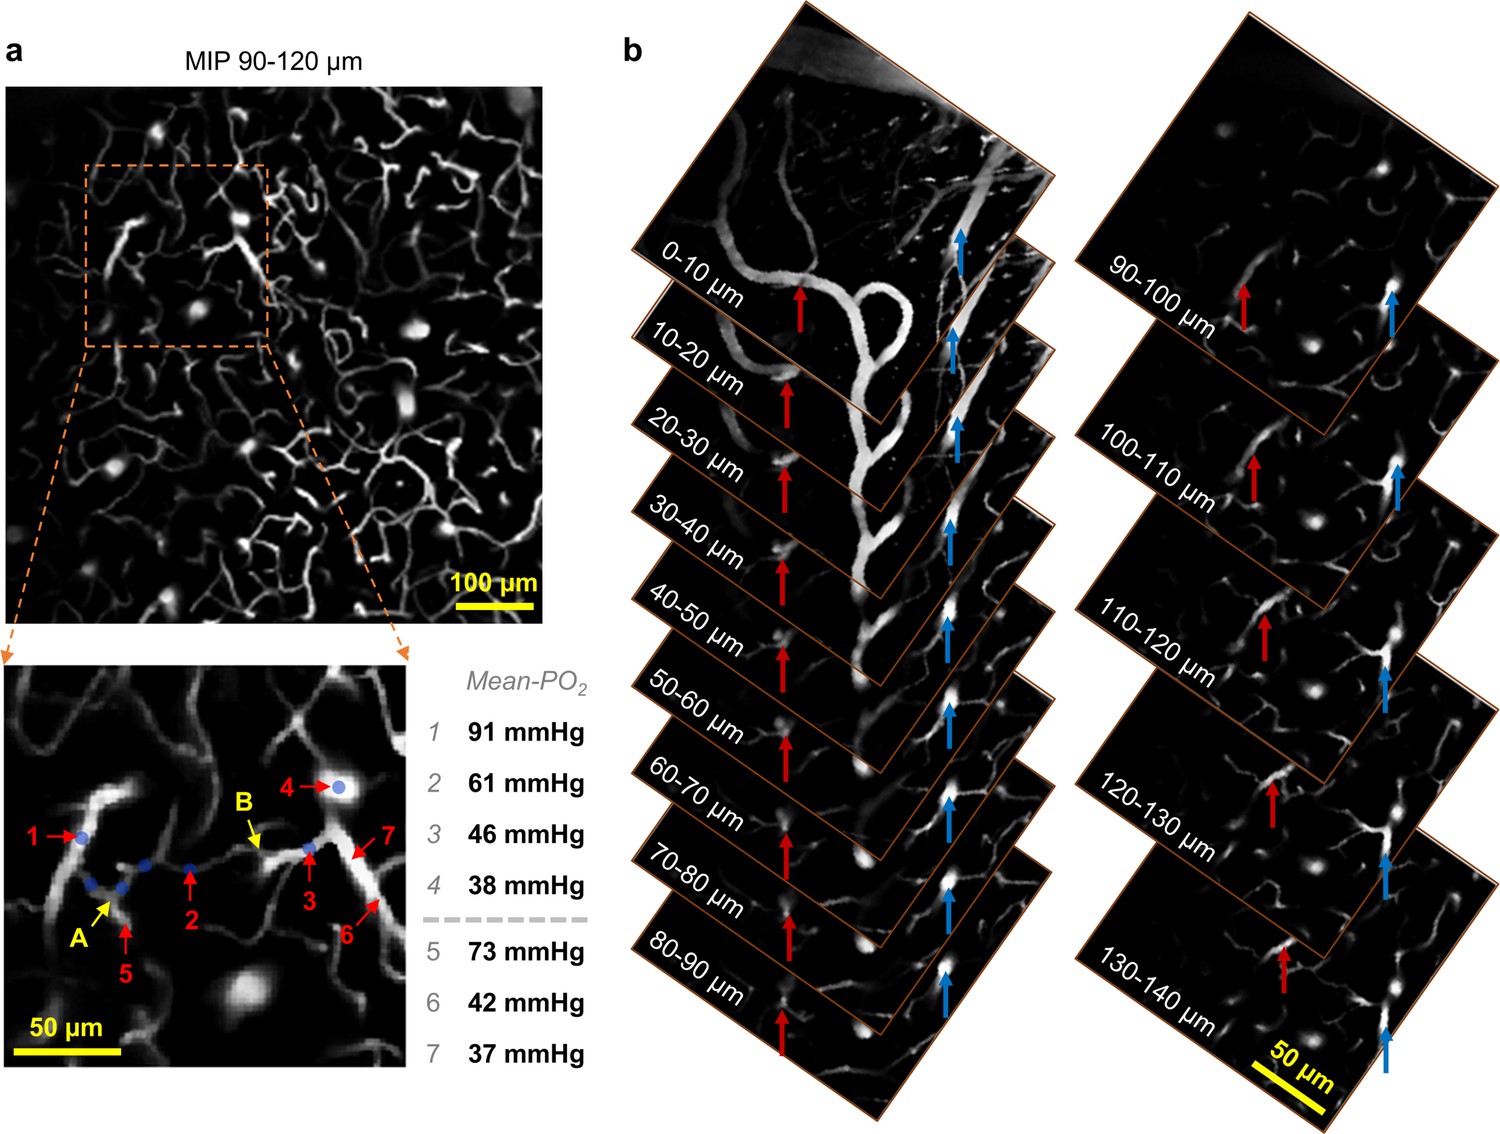
(a) Upper panel: The maximum intensity projection of the vasculature stack (90–120 µm under cortical surface). Lower panel: The enlarged image includes the vascular paths of the suspected thoroughfare capillary. PO2 measurements were performed on the segments labeled with numbers, and their values are shown next to the vascular image. (b) Tracking of the arteriole (#1 in the lower panel in a) indicated by the red arrow and the venule (#4 in the lower panel in a) indicated by the blue arrow, from the cortical depth of 140 μm to the cortical surface. The maximum intensity projection of the Sulforhodamine-B labeled microvascular stack (cortical depth: 90–120 µm) is shown in the upper panel in a). The enlarged image (lower panel in a) includes the vascular paths of the suspected thoroughfare capillary. The vessel types of the vascular segments #1 and #4 were identified as arteriole and venule, respectively, based on their PO2 values and the morphologies of their parent vessels by tracking them with the three-dimensional angiogram to the cortical surface. The complete vascular path, starting from the arteriole (#1) to the venule (#4), consists of the vascular segments marked by the blue dots. PO2 measurements were performed on the locations labeled with numbers, and their PO2 values are shown at right. The three vascular segments from A to B were identified as capillaries, based on their diameters. The Mean-PO2 of the pre-venule capillary (#2) was calculated to be 61 mmHg, much higher than the average capillary Mean-PO2 (45.6 ± 1.4 mmHg; Figure 1—figure supplement 2a). In addition, the vascular path from A to B consists of only three segments; and the physical length from A to B was estimated to be 85 µm. Therefore, this vascular path (A–B) is short in both number of capillary segments and physical length. We thus suspect that the capillary segment #2 is a thoroughfare channel that transported the highly oxygenated blood back to the venule, contributing to the increase in the venous oxygenation towards brain surface.
Author response image 1
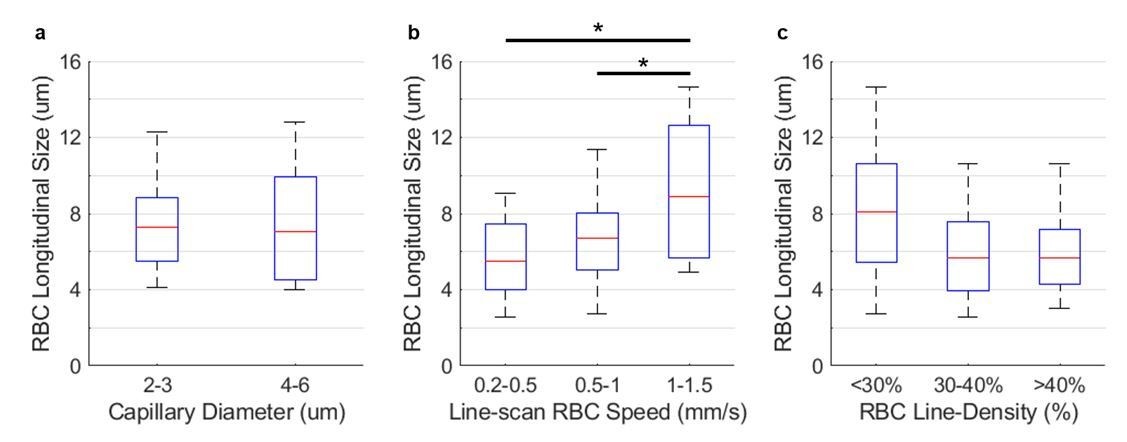
RBC longitudinal size vs. capillary diameter, RBC speed, and line-density, respectively.
The measurements were performed in 58 capillaries in two awake mice, within the cortical depth of 0-200 µm. The statistical comparison in panel a was carried out using Student’s t-test. The statistical comparisons in panels b-c were carried out using ANOVA followed by a Tukey-HSD post-hoc test. The asterisk symbol indicates P<0.05.
Author response image 2
Comparison between the RBC speed measurements by the line-scan and point-scan method.
The measurements were performed in 58 capillaries across two mice within cortical depth of 0-200 µm. The statistical comparison wascarried out using Student’s t-test, but no statistical significance was found.
Author response image 3
Author response image 4

Illustration of the selection of phosphorescence decays for the calculation of InterRBC-PO2.
https://doi.org/10.7554/eLife.42299.028
Author response image 5
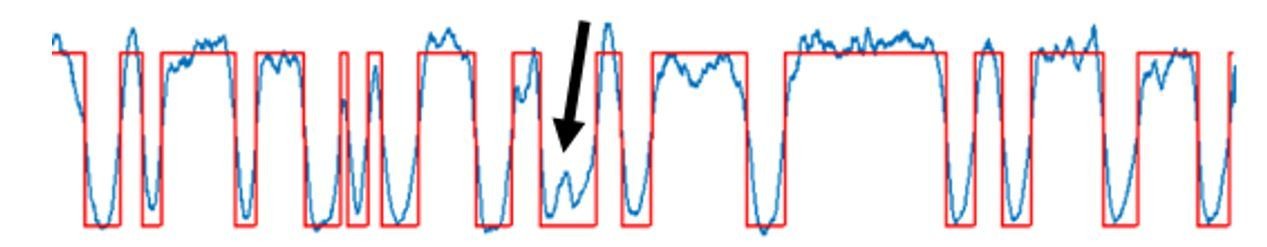
A representative 0.4-s-long recording of the RBC passages.
The blue curve is the experimental time course, and the red curve is the fitted time course. The black arrow points to a small intensity ‘spike’, suggesting that 2 contiguous RBCs passed through the focal volume.
Author response image 6
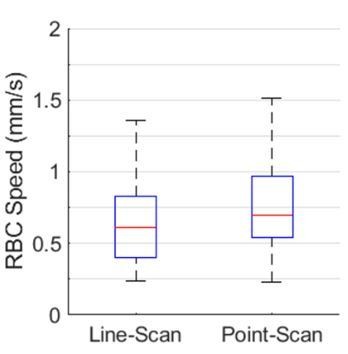
Comparison between the RBC speed measurements by the line-scan and point-scan method.
The individual RBC speed values estimated by two methods from each capillary (green circles) are connected by green lines. Boxplots of the line-scan and point-scan RBC-speed values indicate the median values, 1st and 3rd quartiles, and maximum and minimum values. No statistically significant difference was found between the mean values (Student’s t-test). The regression slope between the paired RBC-speed measurements is 0.87 (not shown). The measurements were performed in 58 capillaries across two mice within the cortical depth range of 0-200 μm.
Author response image 7
Correlation between the line-scan and point-scan RBC-speed values in the capillaries having the diameter of 2-3 µm (left panel) and 3-5 µm (right panel).
https://doi.org/10.7554/eLife.42299.033Tables
Author response table 1
InterRBC-PO2 and EATs dependence on the size of the selection window.
The measurements were acquired in 373 capillaries in n = 7 awake mice. Data are expressed as mean ± SEM.
| Selection window size | InterRBC-PO2 (mmHg) | EATs (mmHg) |
|---|---|---|
| 40% | 38.0 ± 3.7 | 12.0 ± 1.7 |
| 30% | 37.7 ± 3.7 | 12.2 ± 1.7 |
| 20% | 37.4 ± 3.7 | 12.4 ± 1.8 |
| 10% | 37.0 ± 3.6 | 12.7 ± 1.8 |
Author response table 2
Measurement information for the main analysis in Figures 2-7.
https://doi.org/10.7554/eLife.42299.031| Parameters | Depth | Numbers of samples/mice | ||
|---|---|---|---|---|
| Capillaries | Arterioles | Venules | ||
| Mean-PO2 | 0-600 µm | 978/15 | 11/7 | 14/7 |
| RBC Flux | 0-600 µm | 978/15 | N.A. | N.A. |
| Temporal Fluctuation | 0-600 µm | 373/7 | N.A. | N.A. |
| EATs | 0-600 µm | 373/7 | N.A. | N.A. |
| Branching Orders | 0-300 µm | 97/5 | N.A. | N.A. |
Additional files
-
Supplementary file 1
Measurement information for the main analysis in Figures 2–7.
- https://doi.org/10.7554/eLife.42299.022
-
Transparent reporting form
- https://doi.org/10.7554/eLife.42299.023
Download links
A two-part list of links to download the article, or parts of the article, in various formats.
Downloads (link to download the article as PDF)
Open citations (links to open the citations from this article in various online reference manager services)
Cite this article (links to download the citations from this article in formats compatible with various reference manager tools)
More homogeneous capillary flow and oxygenation in deeper cortical layers correlate with increased oxygen extraction
eLife 8:e42299.
https://doi.org/10.7554/eLife.42299


