Specification of diverse cell types during early neurogenesis of the mouse cerebellum
- University of Connecticut, United States
Figures
Figure 1
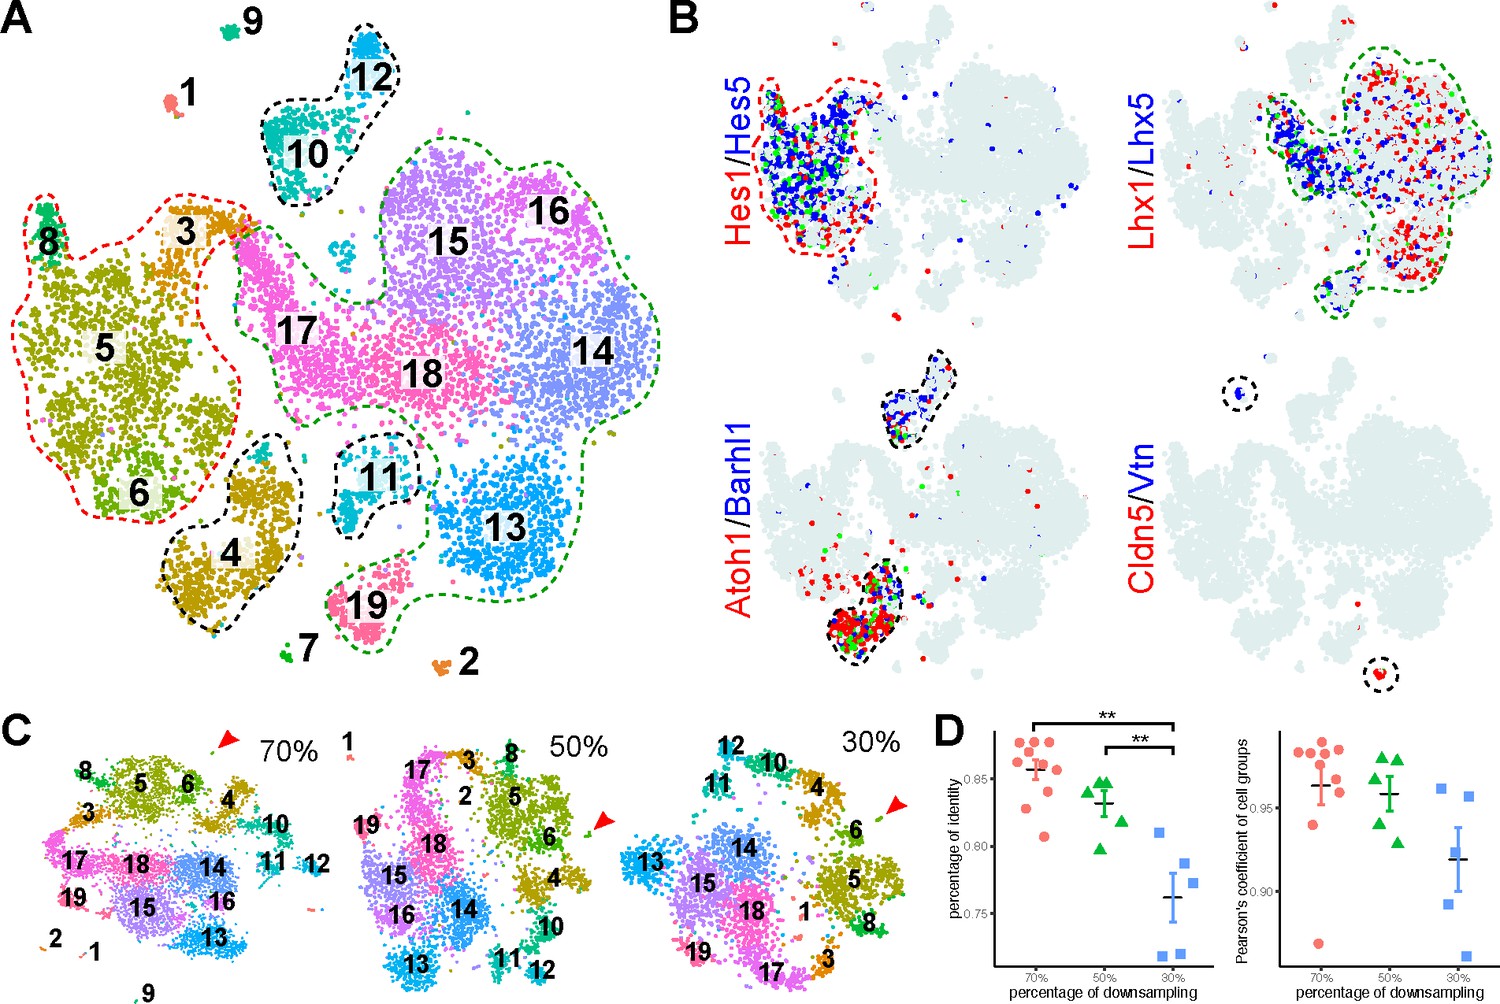
Identification of major cell types in E13.5 mouse cerebella by scRNAseq.
(A) Visualization of 19 classes of cells using t-distributed stochastic neighbor embedding (tSNE). Each dot represents a cell, similar cells are grouped and shown in colors. The colored dashed lines denote the major cell types. (B) Expression of known markers is shown as laid out in A (red and blue, expression of individual markers; green, co-expression; azure, no expression). The marker-expressing cell groups are outlined by dashed lines. (C) tSNE plotting of clustering of randomly downsampled datasets in 70%, 50% and 30% of the original cells. Note that almost the same clusters indicated by number and color are found in the smaller datasets, except for the small cluster shown by the arrowhead. (D) Scatter plots showing the percentage of identity (left, **p < 0.01, one-way ANOVA with post-hoc Tukey HSD test) and Pearson’s coefficient of the cell group proportion (right).
Figure 2 with 2 supplements
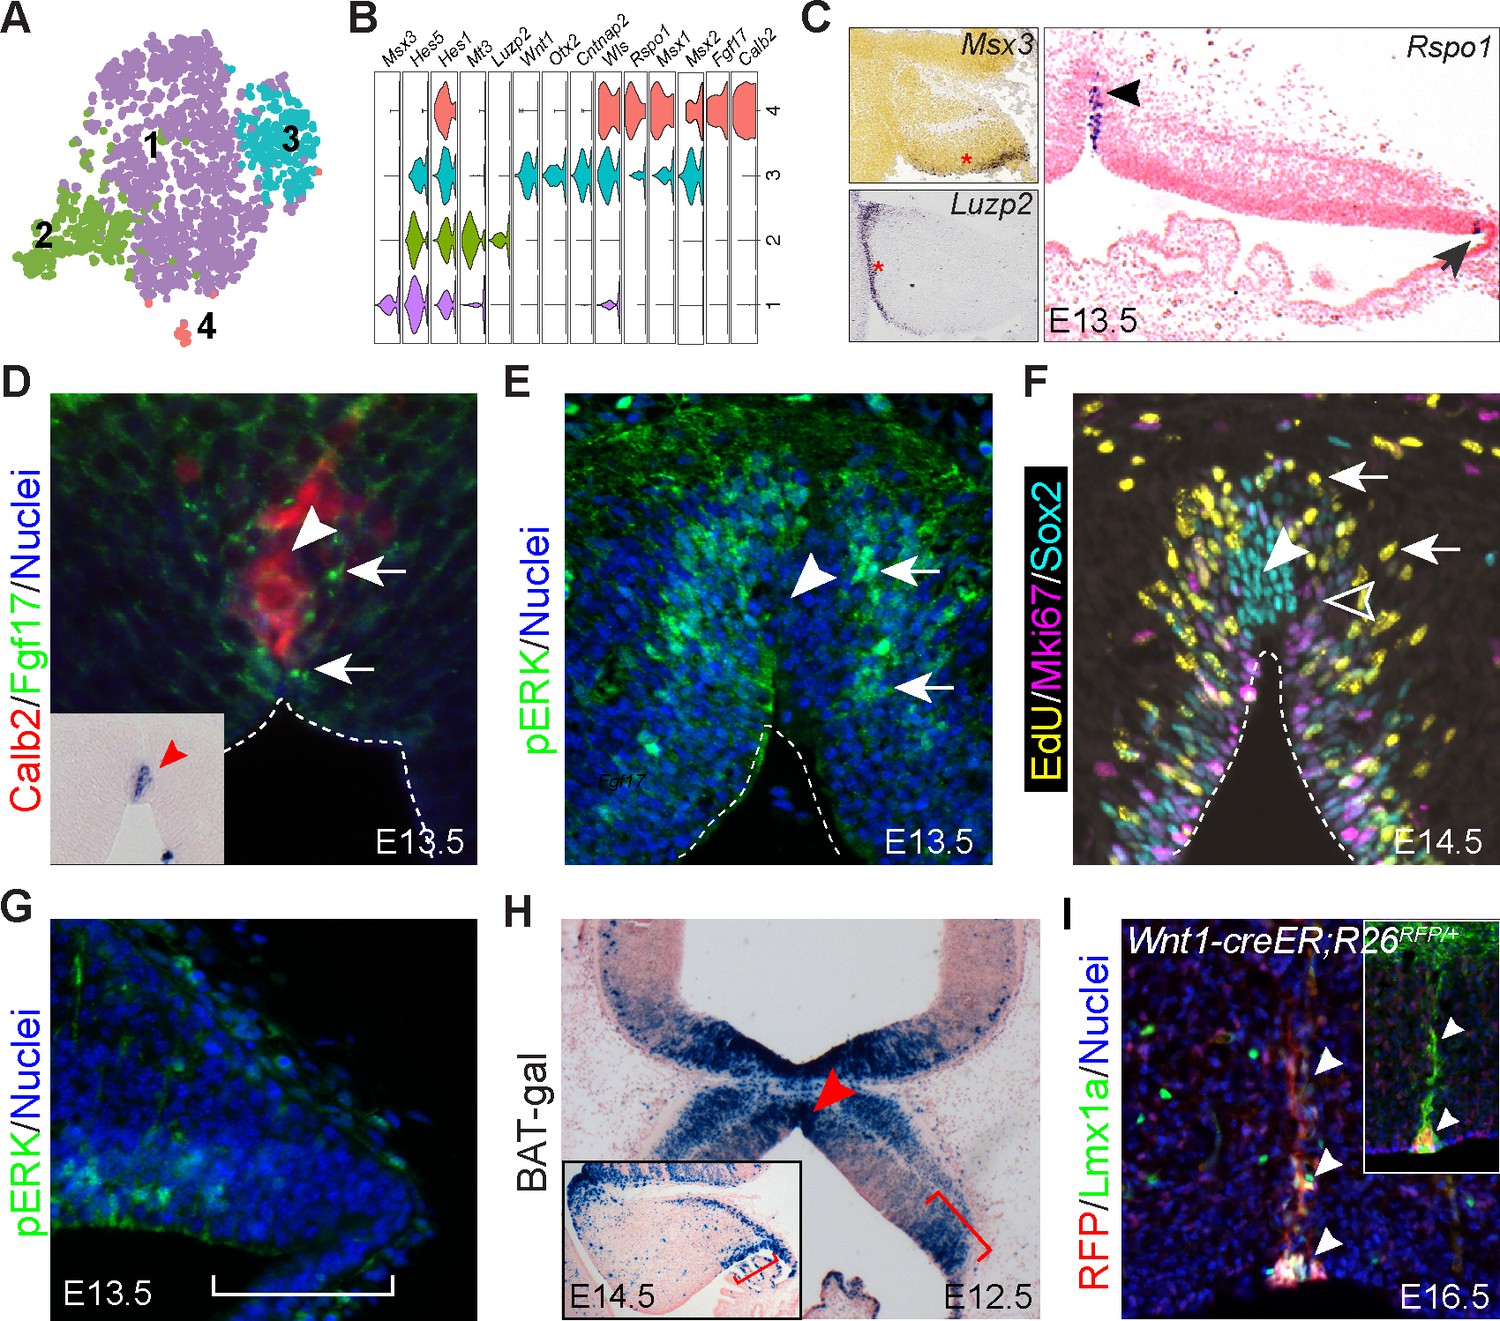
Identification of signaling centers in the cerebellar primordium.
(A) tSNE showing the partition of progenitors in the cerebellar VZ. (B) Violin plots showing cell-specific markers. (C–G) ISH (C) and IHC (D–G) on coronal sections of cerebella at the indicated embryonic stage. The arrowhead and arrow in C indicate the MidO (group 4) and C1 (group 3), respectively; arrows denote Fgf17 (D), pERK signals (E), and EdU+/Mki67- newly born cells (F); the empty arrowhead shows EdU-/Mki67+ cells; the arrowhead denotes the MidO; the bracket in G demarcates the C1 domain. Inset in D showing ISH for Fgf17 on a section adjacent to D. (H) X-gal histochemistry on a coronal section of E12.5 cerebellum carrying the BAT-gal transgene. The inset shows a sagittal section of E14.5 cerebellum; the brackets demarcate C1; the arrowhead indicates the MidO. (I) IHC on a coronal cerebellar section of E16.5 Wnt1-creER;R26RFP/+ embryo that received tamoxifen at E8.5. The arrowheads indicate colocalization of Lmx1a and tdTomato red fluorescent protein (RFP). The inset shows colocalization of Calb2 and RFP on an adjacent section.
Figure 2—figure supplement 1
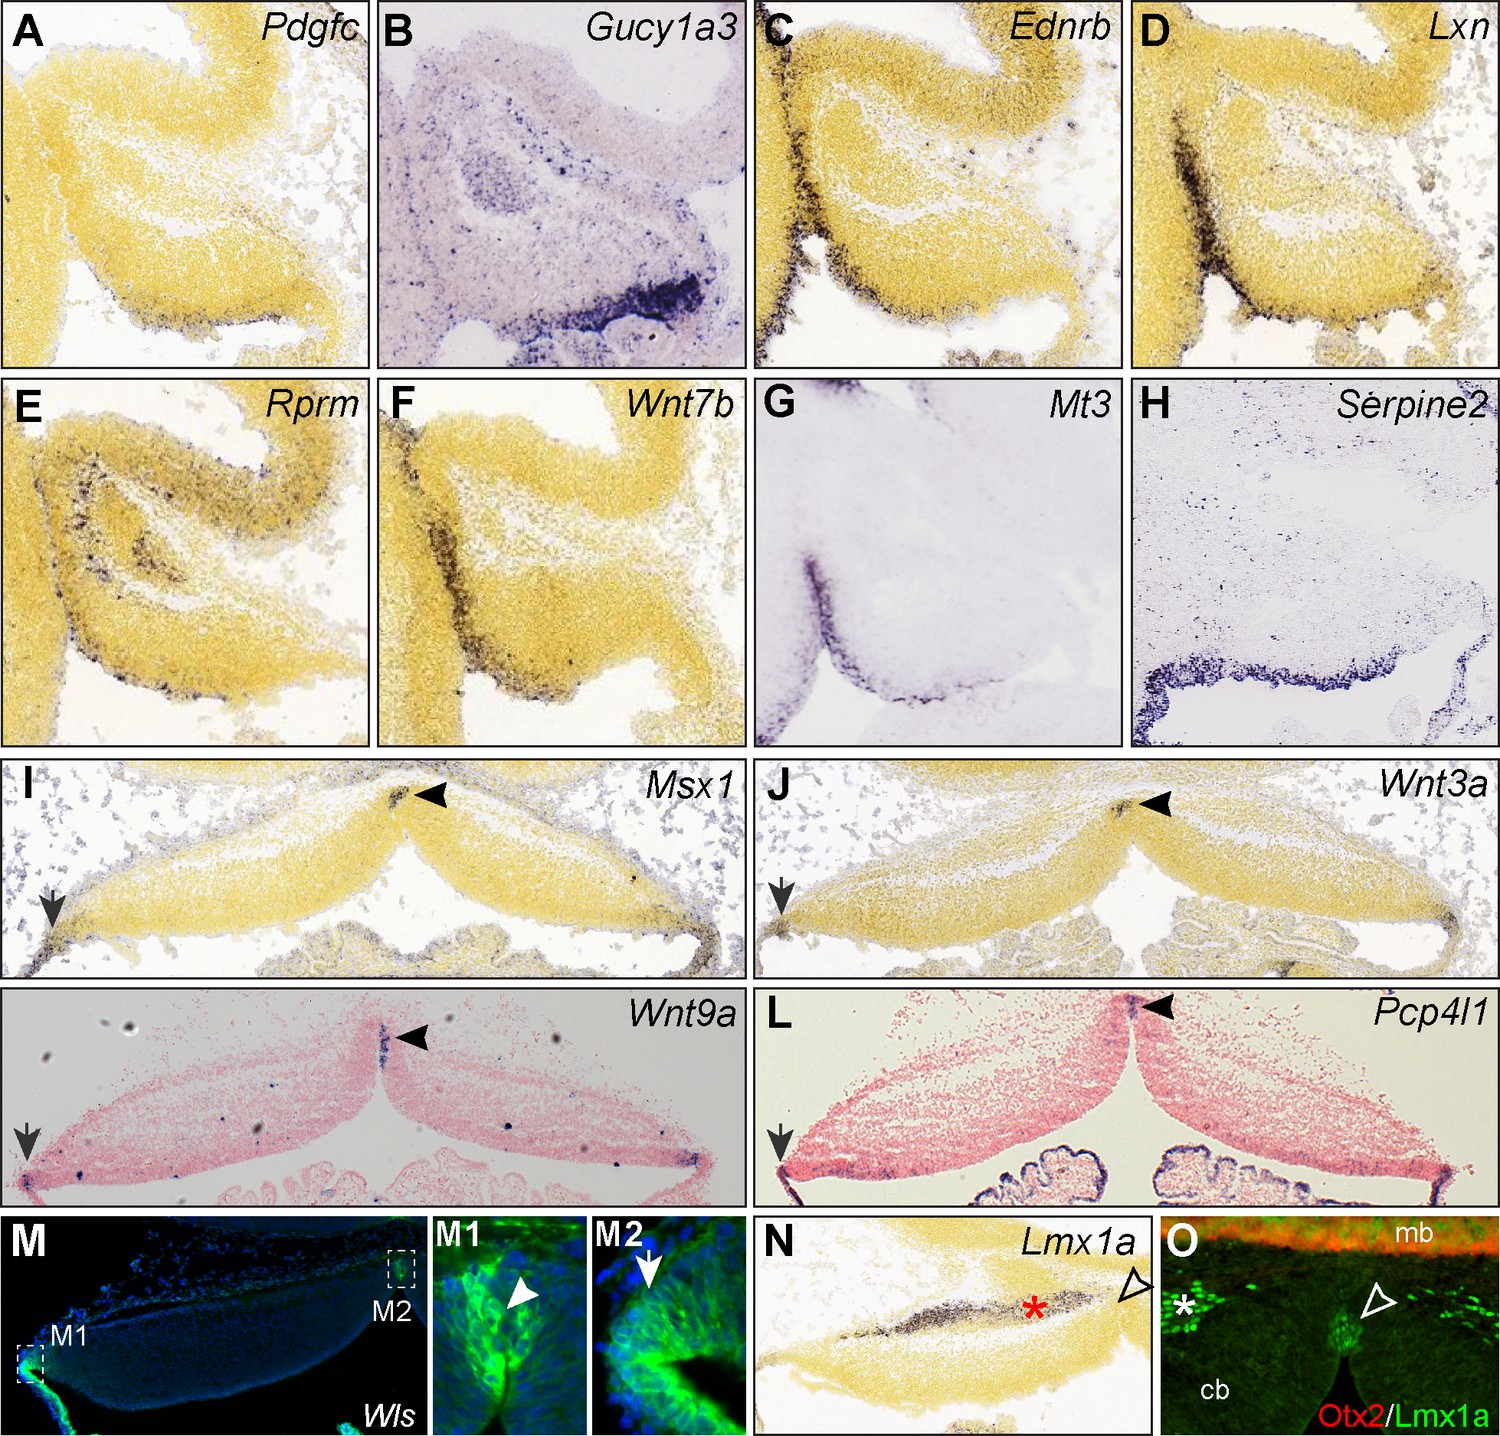
Relating progenitor cell groups to their original positions in the cerebellum.
(A–H) ISH of group 1–2 feature genes on sagittal sections of the cerebellum at E13.5 (A, C-F, from Allen Developing Mouse Brain) and E14.5 (B,G,H from GenePaint). Note that group one feature genes (A, B) are mostly expressed in the posterior part of the VZ, whereas group two feature genes (C–H) are expressed in the anterior part of the VZ. (I–O) ISH and IHC for group 3 and 4 feature genes on coronal sections of E13.5 cerebella (I and J from Allen Developing Mouse Brain Atlas). Note that Lmx1a protein but not its transcript, is present at the midline. The asterisk indicates Lmx1a expression in the prospective medial cerebellar nuclear neurons.
Figure 2—figure supplement 2
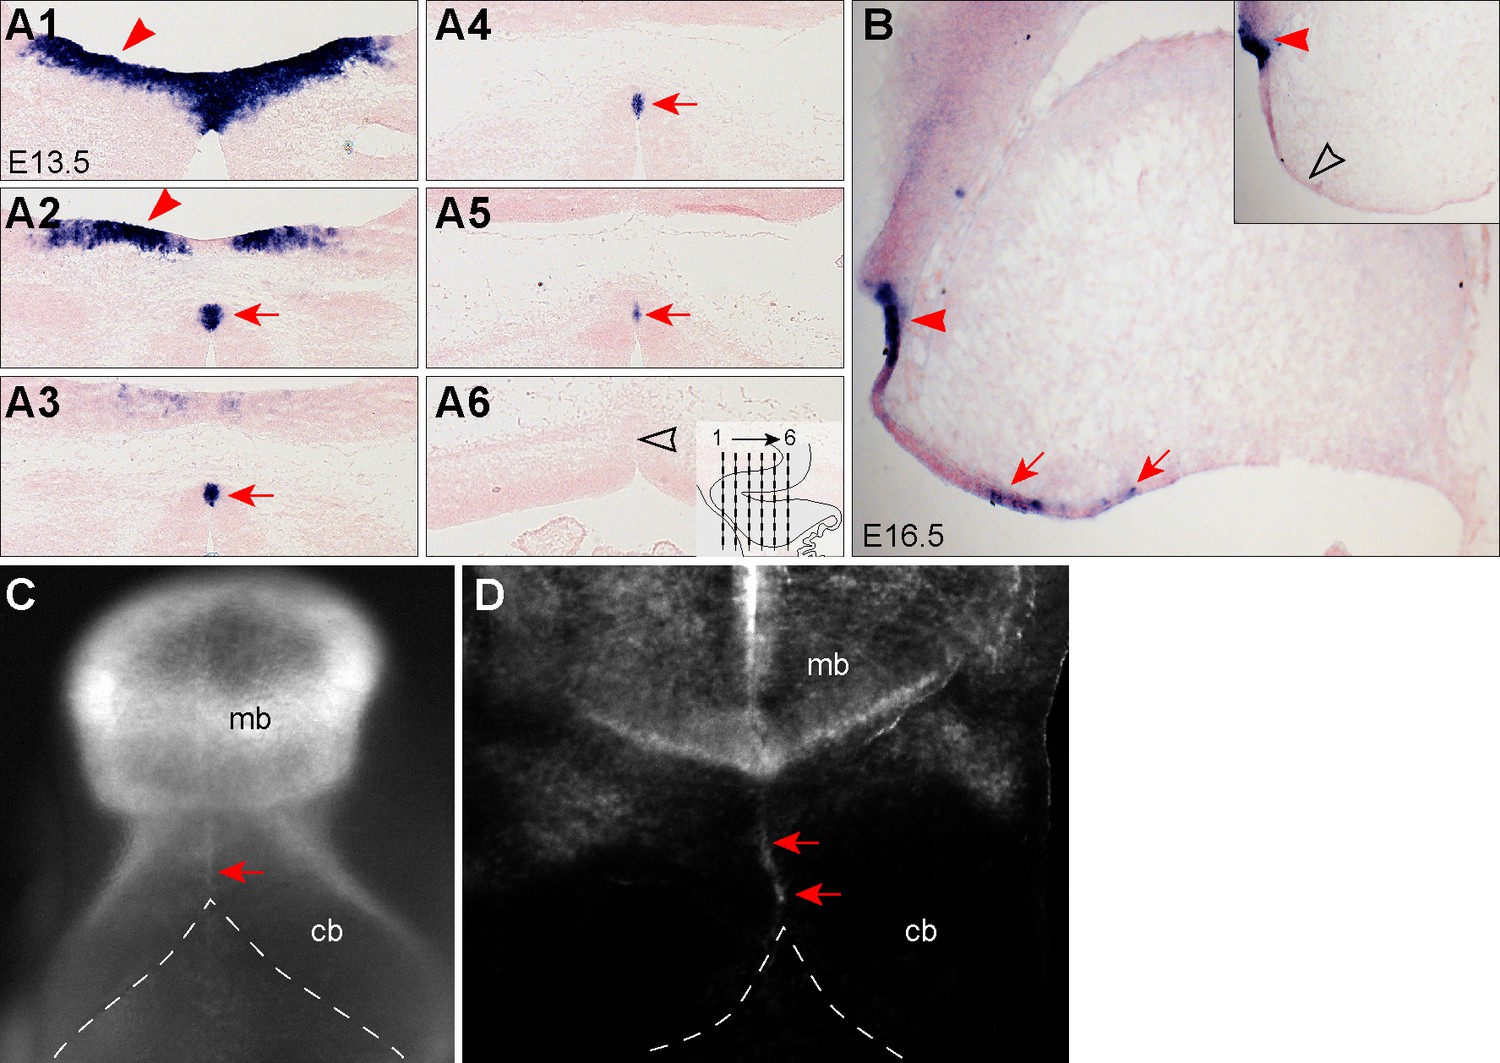
Examination of MidO cells along the dorsal midline of the developing cerebellum.
(A1–A6) ISH for Fgf17 on a serial of coronal sections of the E13.5 cerebellum. The inset in A6 indicates the positions of images A1 to A6. (B) ISH for Fgf17 on a sagittal section along the midline of E16.5 cerebellum. The inset is a parallel section with 120 nm interval from B; the arrowhead and arrow indicate the Fgf17 transcripts in the isthmic organizer (IsO) and MidO, respectively; the empty arrowhead shows that lack of Fgf17 expression. (C,D) The dorsal view of the midbrain (mb) and cerebellum (cb) of E10.5 Wnt1-cre;R26RFP/+ embryo that were administrated with tamoxifen at E8.5. In D, the neural tube was opened along the ventral midline and imaged in a flatmount preparation. The arrows indicate MidO cells, and dashed lines outline the cerebellar anlage.
Figure 3 with 3 supplements
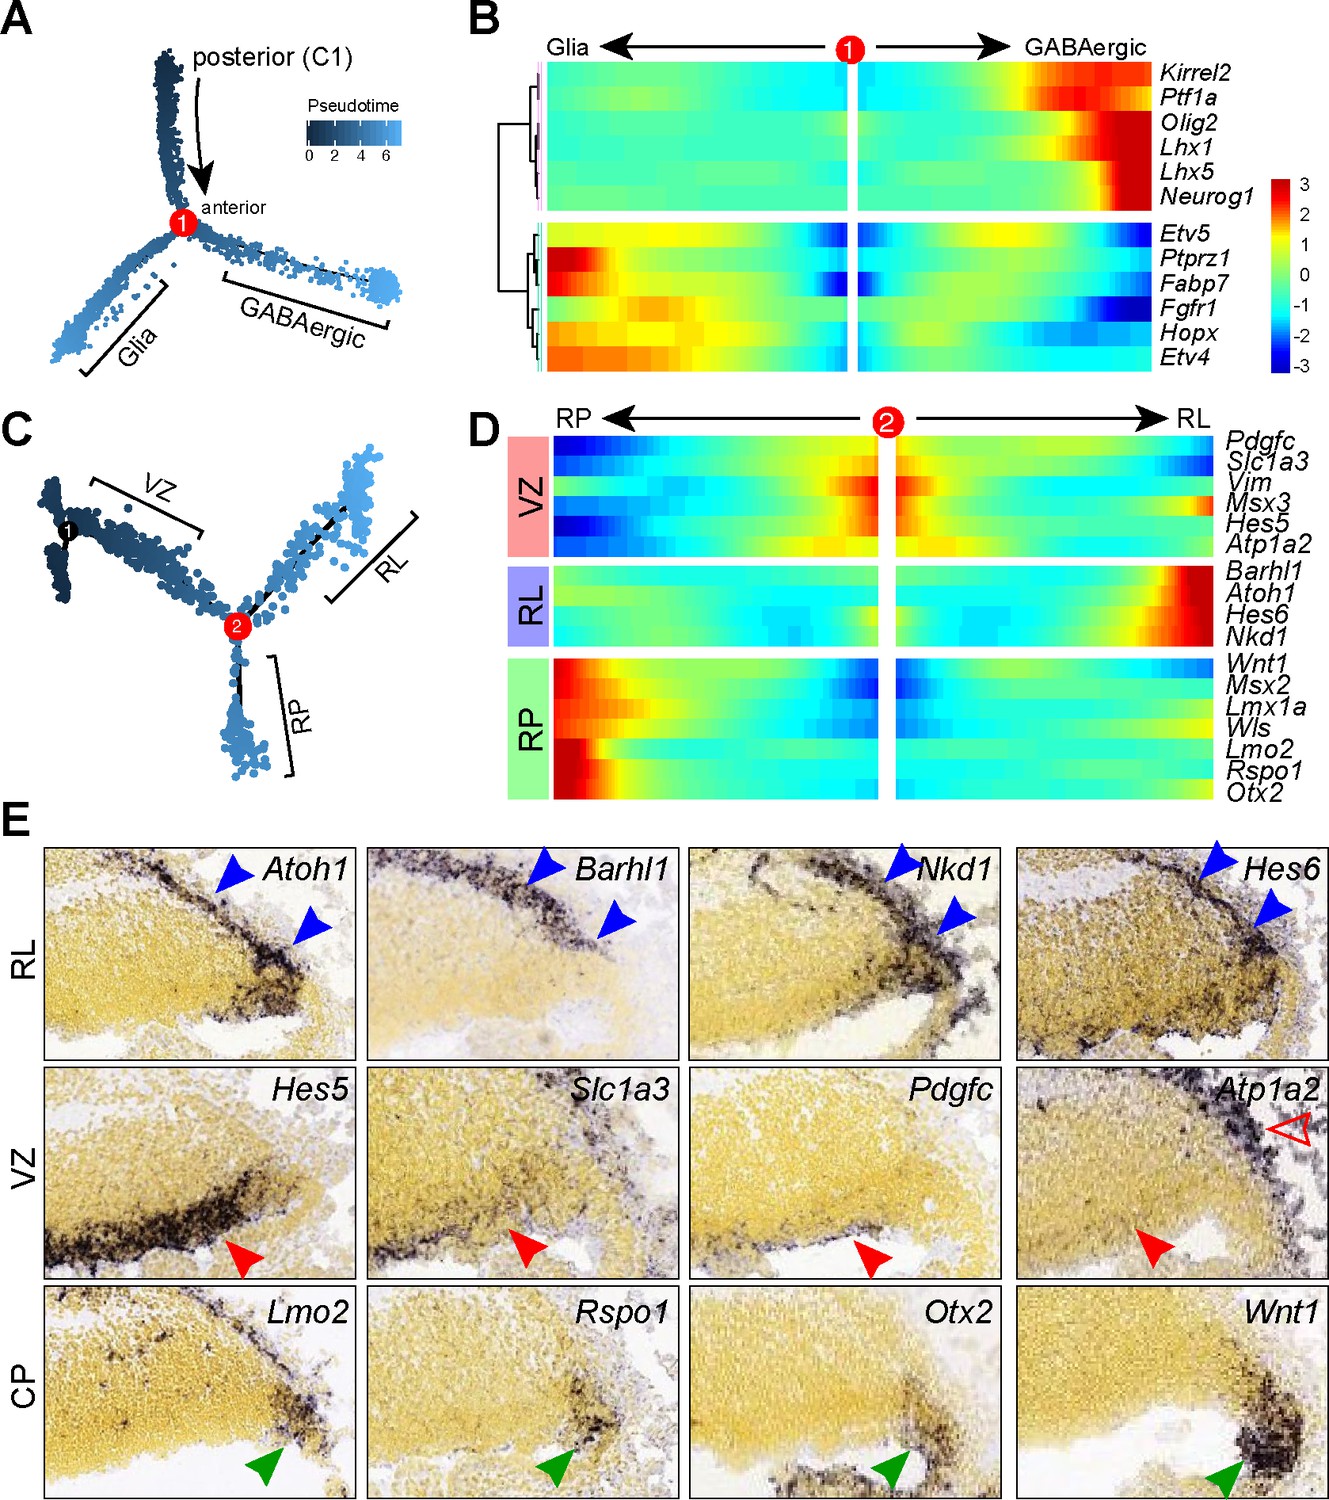
Pseudotemporal analysis reveals developmental trajectories of progenitors in the cerebellar VZ.
(A) Monocle-inferred developmental trajectory. (B) Branched heatmap showing gene expression in Bergmann glial and GABAergic cells. (C) Monocle-inferred developmental trajectory of NPCs before the branchpoint in A. (D) Branched heatmap showing expression of genes that are expressed in the cerebellar ventricular zone (VZ), rhombic lip (RL) and roof plate (RP). (E) ISH on sagittal sections of E13.5 cerebella (from Allen Developing Mouse Brain Atlas). Arrowheads indicate transcripts in the VZ (red), RL and subpial stream (blue), and RP (green). The empty arrowhead shows expression in the meninges.
Figure 3—figure supplement 1
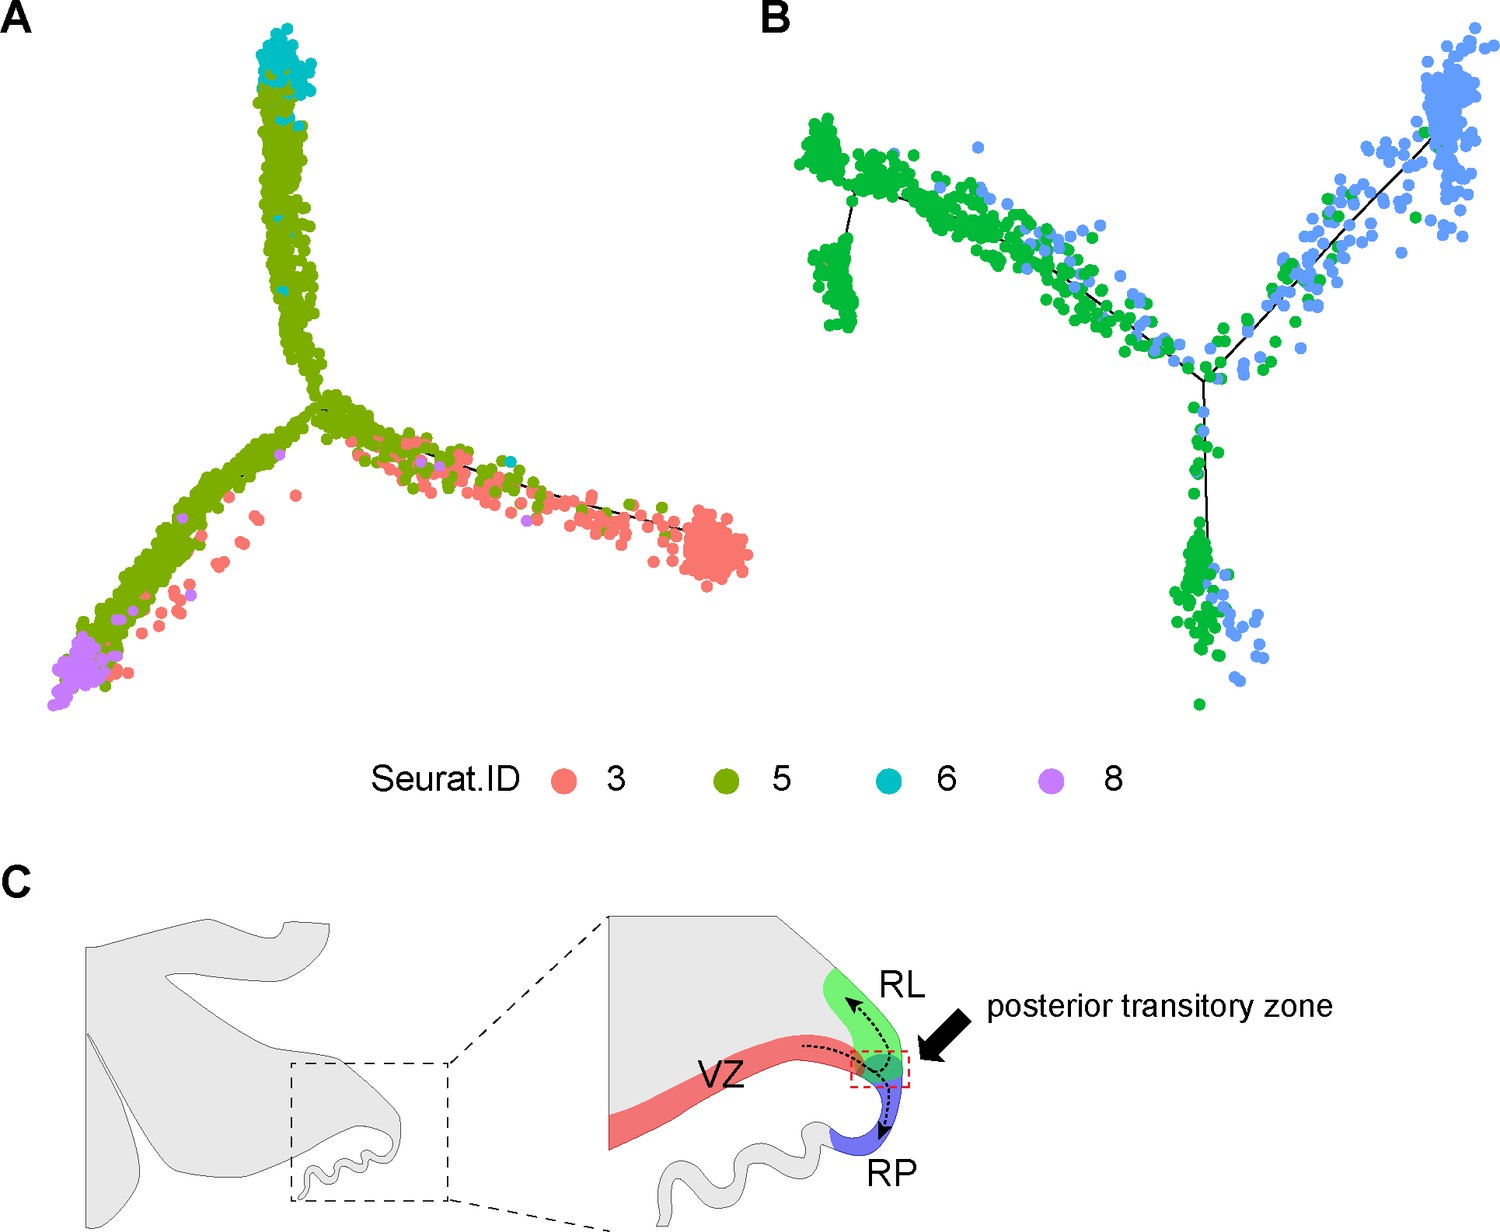
Developmental trajectories of the posterior transitory zone.
(A, B) Distribution of cell groups (cluster ID as in Figure 1A) in the monocle-inferred trajectories. (C) Schematic diagram showing the so-called ‘posterior transitory zone’ at the three-way intersection between the ventricular zone (VZ), rhombic lip (RL), and roof plate (RP).
Figure 3—figure supplement 2

Validation of branch-dependent cascade genes.
(A) Kinetic clusters of branch-dependent genes are functionally enriched for genes that are involved in regulating neurogenesis, gliogenesis, and cell cycle progression, respectively. (B, C) Heatmaps showing dynamic expression changes of transcription factors in the differentiation of GABAergic (B) and glial cells (C).
Figure 3—figure supplement 3
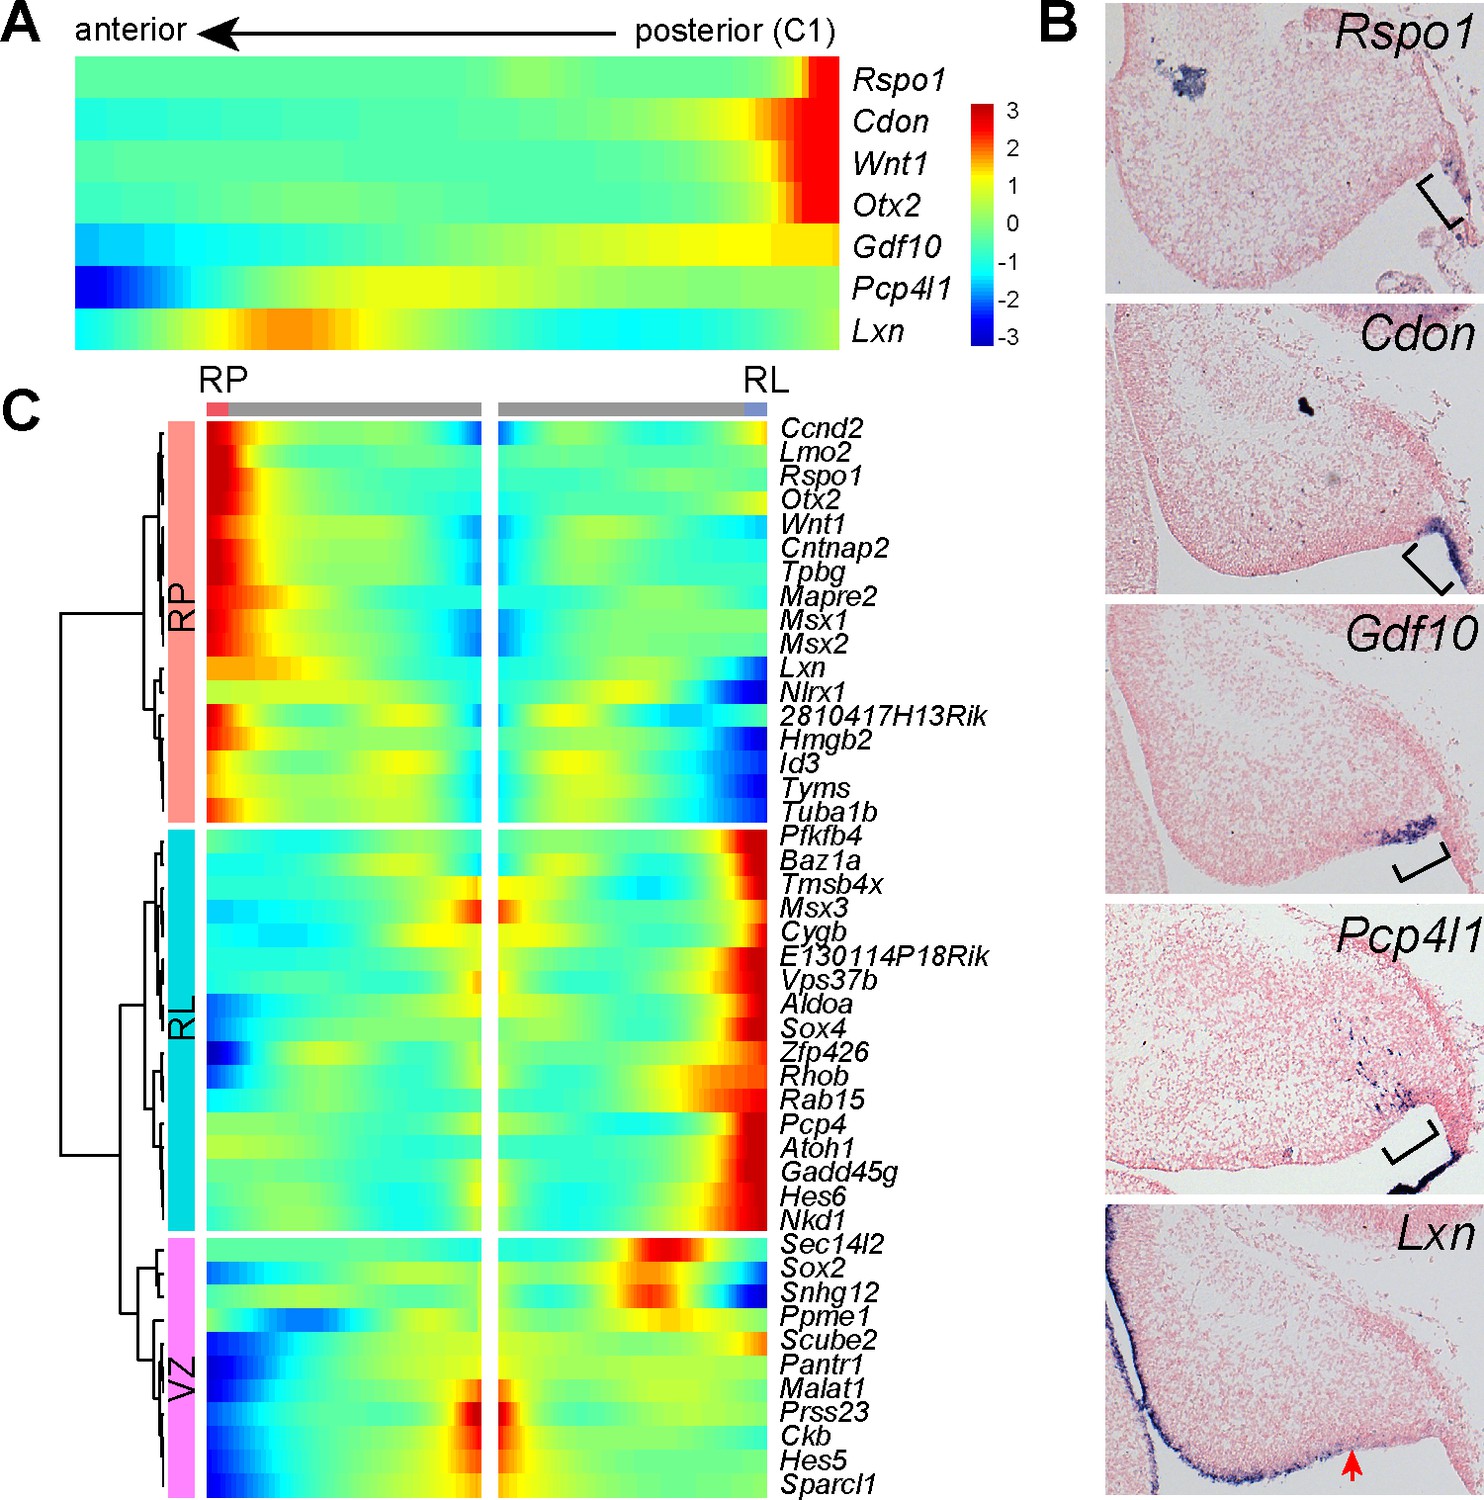
Gene expression in the posterior end of the of cerebellar ventricular zone.
(A) Heatmap showing the Monocle-predicted expression changes in pseudotime-ordered NPCs. (B) ISH on sagittal sections of E14.5 cerebella. The bracket demarcates the area where the indicated gene is expressed; the arrow indicates the posterior limit of Lxn expression. Note that the spatial expression pattern of the selected genes in B is in good agreement with the Monocle-predicted pattern in A. (C) Clusters of branch-dependent genes in the Monocle-inferred trajectory tree in Figure 3C.
Figure 4 with 1 supplement

Identification of molecular features of different PC subgroups.
(A) tSNE showing different cell groups of the cerebellar GABAergic lineage. (B) Violin plots showing cell-specific markers. (C) Schematic presentation of division of the cerebellar VZ at E12.5 (Zordan et al., 2008). (D) Heatmap showing average gene expression among PC subgroups. The known PC-subtype markers are shown in red. (E) ISH on coronal sections of E13.5 cerebella (from Allen Developing Mouse Brain Atlas). Red and green arrowheads indicate Foxp1 and Etv1 mRNAs. The overlay with pseudo-color images is shown on the bottom. (F, G) IHC on sagittal (F) and coronal (G) cerebellar sections of the indicated stages. The brackets in F indicate the complementary expression of Sox2, Nrgn, and Foxp1; the asterisk shows PCs with a lower level of Foxp2; the arrowhead denote the Purkinje cell plate with robust Foxp2 and Dab1 expression. (H) Schematic summary of Foxp2+ PC clusters based on the combination of Calb1, Dab1, Ebf, Foxp1, and Nrgn. Note that the anti-Ebf antibody may react to Ebf1-4 proteins.
Figure 4—figure supplement 1
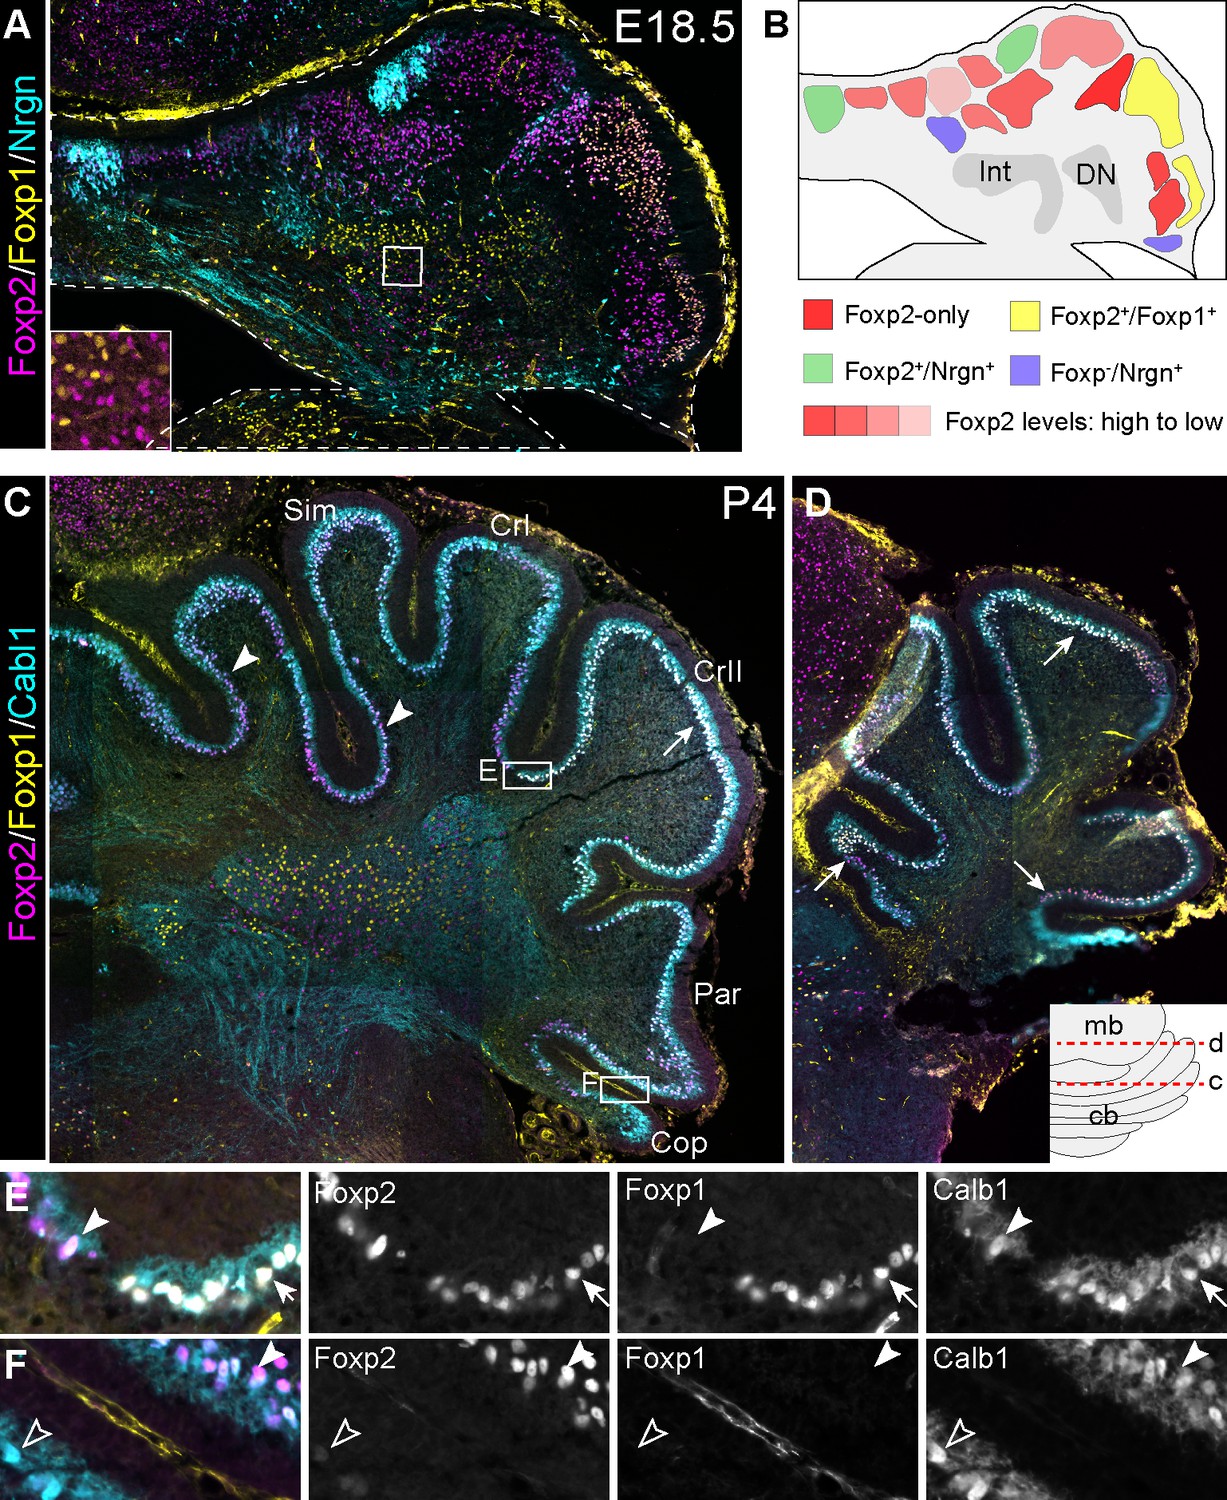
Subgroups of Purkinje neurons express different levels of Foxp2 and/or different combinations of Foxp2 and Foxp1.
(A) IHC on a coronal section of the E18.5 cerebellum. Non-overlapping expression of Foxp1 and Foxp2 in cerebellar nuclear region is boxed and enlarged in the inset. (B) Schematic summary of PC clusters based on the combination of Foxp2, Foxp1, and Nrgn as shown in A. (C–F) IHC on coronal sections of the P4 cerebellum. The inset shows the position of C and D; the boxed areas in C are enlarged in E and F; the arrow indicates Foxp1+/ Foxp2+ PCs; arrowhead, Foxp1–/Foxp2+ PCs; empty arrowhead, Foxp1–/Foxp2– PCs. Abbreviations: Cop, copula pyramidis; CrI and CrII, Crus I and II of the ansiform lobule; DN, dentate nucleus; Int, interposed nucleus; Par, paraventral lobule; Sim, Simple lobule.
Figure 5
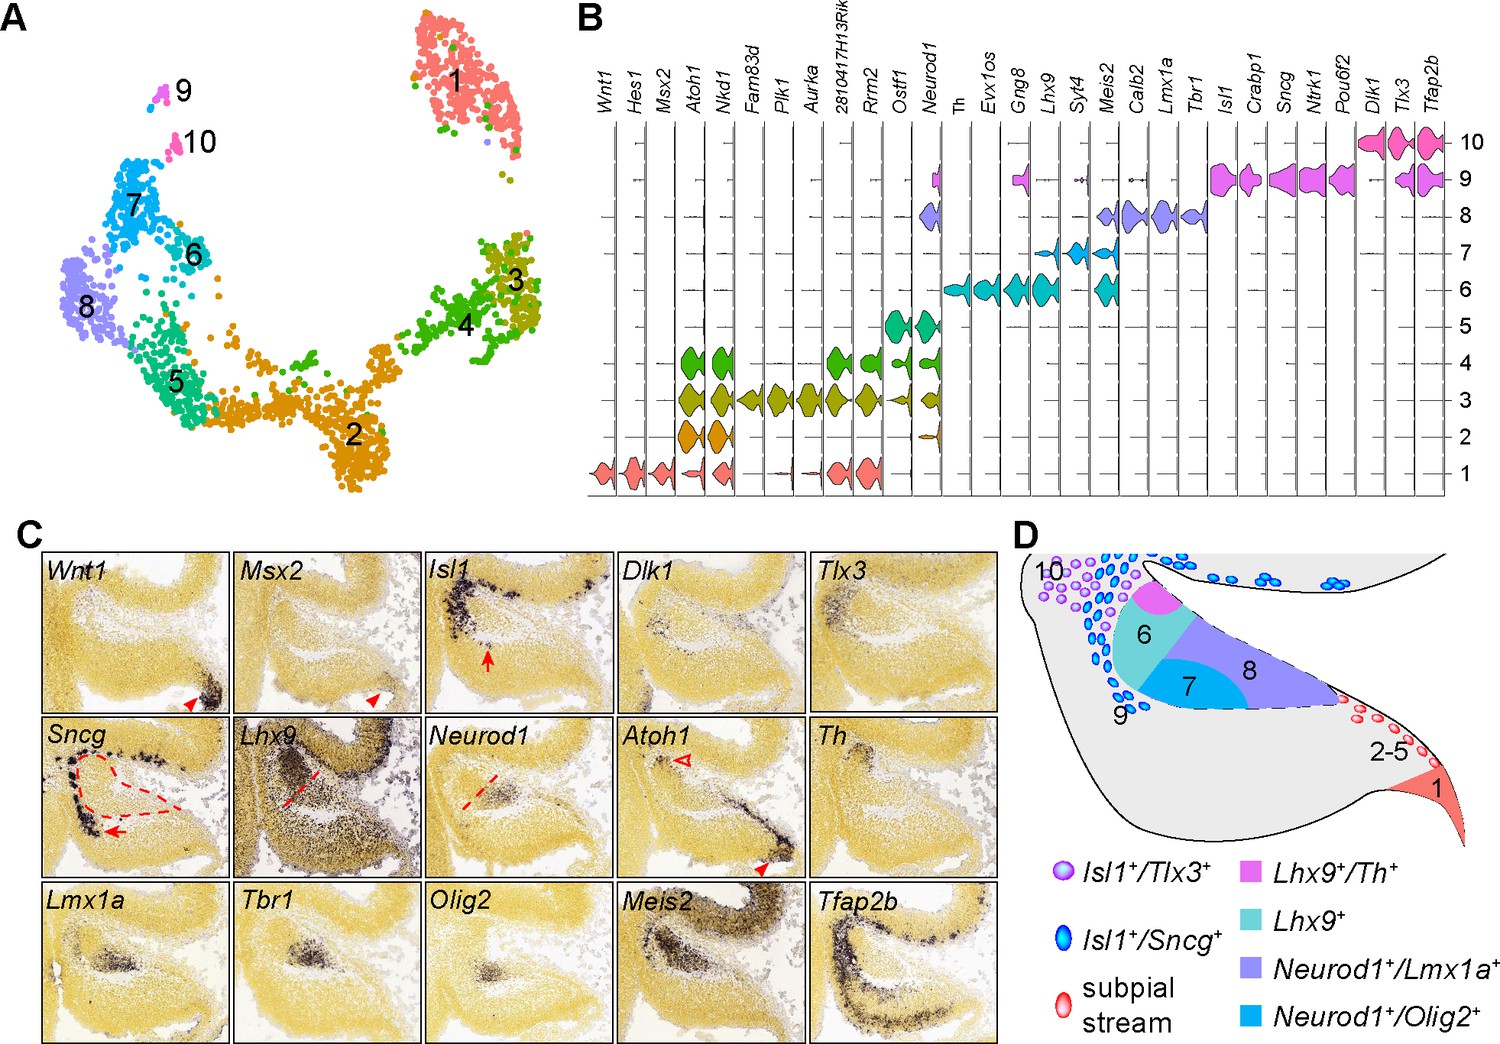
Identification of the molecular features of different cell groups that are presumably derived from the RL.
(A) Visualization of 10 cell groups using uniform manifold approximation projection (UMAP). (B) Violin plots showing cell-specific markers. (C) ISH on sagittal section of E13.5 cerebella (from Allen Developing Mouse Brain Atlas). Arrowheads indicate mRNAs in the C1/RL; the empty arrowhead shows the second Atoh1+ domain at the isthmus; arrows denote Isl1+/Sncg+ + ventral to the NTZ (outlined by dashed line); the straight dashed line delineates the anterior and posterior compartments of the NTZ. (D) Schematic summary of the spatial distribution of the cell groups identified by scRNAseq.
Figure 6 with 1 supplement

Multiple origins of cells in the anterior part of the cerebellar anlage.
(A–F) IHC on sagittal sections of E13.5 brains with tdTomato red fluorescent protein (RFP) fate-mapped cells. The genotype, tamoxifen-administration stage and the antibodies used are indicated on the top and upper right corner of the image, respectively. The NTZ is outlined with dashed lines; empty arrowheads indicate the RL and subpial stream cells; arrows denote colocalization between Isl1 and Otx2 (B), between Meis2 and Lmx1a (D), or between RFP and Th (F); arrowheads indicate Isl1+ cells anterior and ventral to the NTZ; in inset of D, the double arrow indicates cells in the anterior and posterior compartments of the NTZ express different levels of Meis2. (G and G’) Serial sagittal sections of E16.5 Isl1creER/+;R26RFP embryo that was given tamoxifen at E12.5. (H) IHC for Meis2 and Sox2 on a coronal section of E18.5 Isl1creER/+;R26RFP embryo that received tamoxifen at E13.5. Note that RFP fate-mapped cells (arrows) are present in the superior medullary velum, but not in cerebellar nuclei, which are marked by Meis2. Arrowheads indicate the Sox2+ cells overlaying the ventricle. (I) Illustrations indicating the relative position of images in this figure.
Figure 6—figure supplement 1
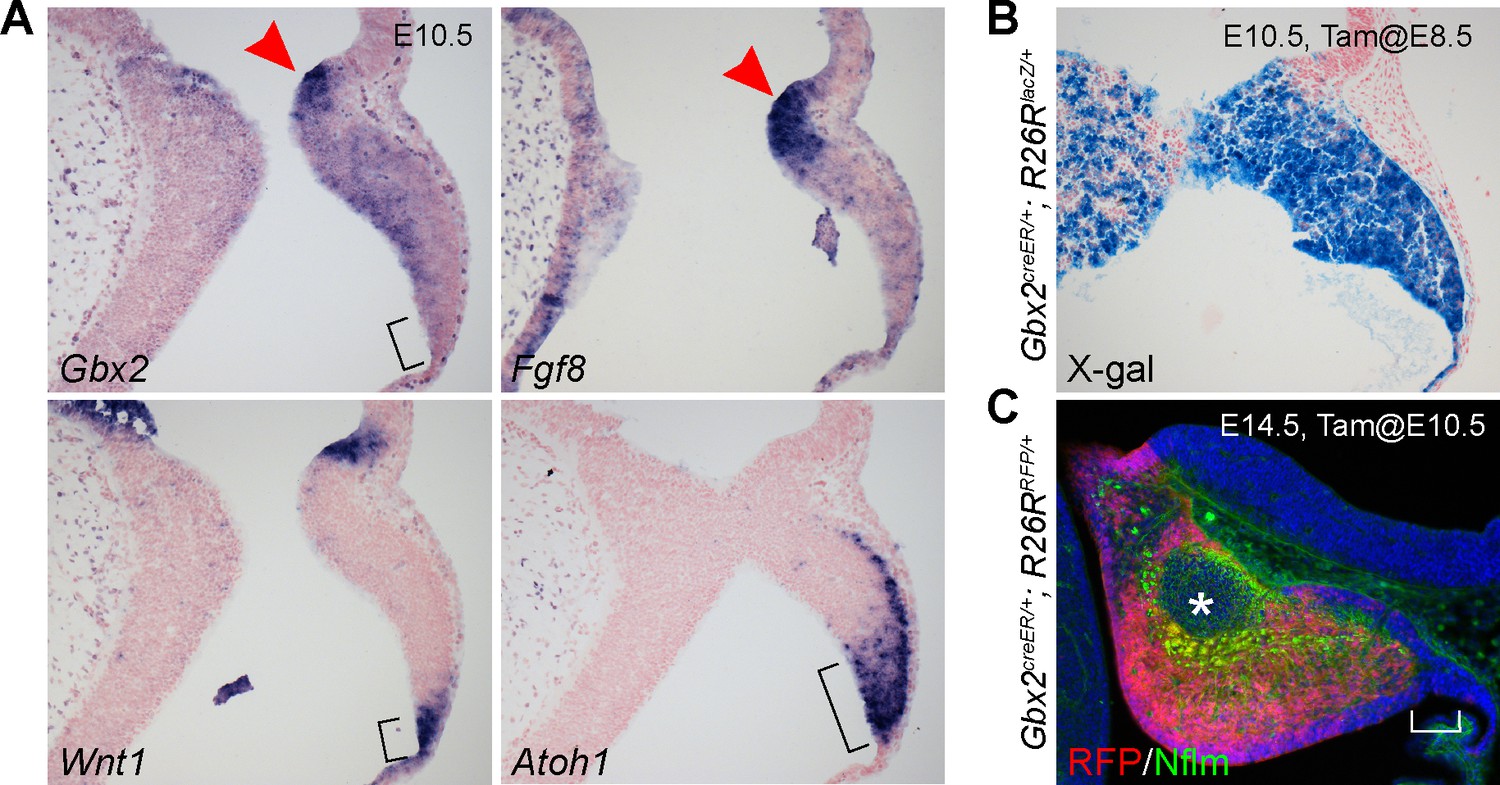
The Gbx2 expression domain is excluded from the posterior end of the cerebellar ventricular zone by E10.5.
(A) ISH on sagittal sections of E10.5 mouse cerebellar anlage. The bracket demarcates posterior-end of the cerebellar VZ in which Wnt1 and Atoh1, but not Gbx2, are expressed; the arrowhead indicates the isthmus. (B and C) Inducible genetic fate mapping of Gbx2-expressing cells at E8.5 (B) or E10.5 (C). The asterisk and bracket indicate the absence of RFP-labeled Gbx2 lineage in the NTZ and the RL, respectively.
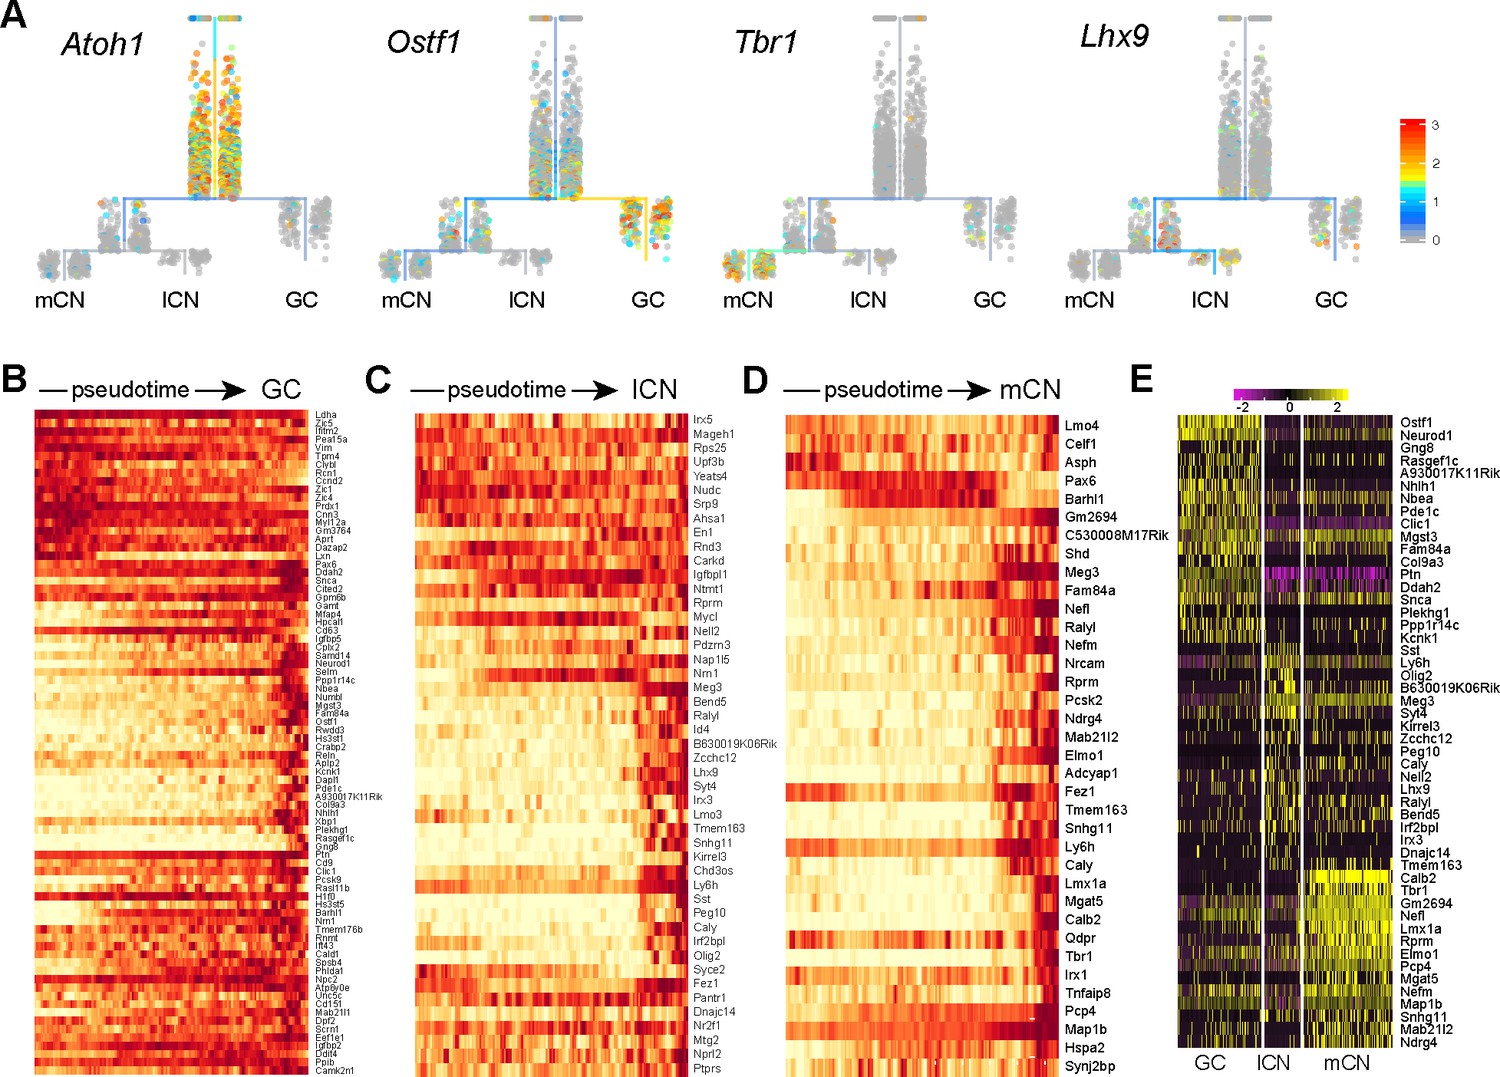
Figure 7 with 1 supplement
Pseudotemporal analysis reveals developmental trajectories of RL derivatives.
(A) URD-inferred developmental trajectories. (B–D) Heatmap showing the dynamic expression changes of transcriptional regulators in pseudotime-ordered cells destined for lateral cerebellar nuclei (lCN), medial cerebellar nuclei (mCN), and granule neurons (GC). The transcription factors that have previously been linked to a particular trajectory are shown in red.
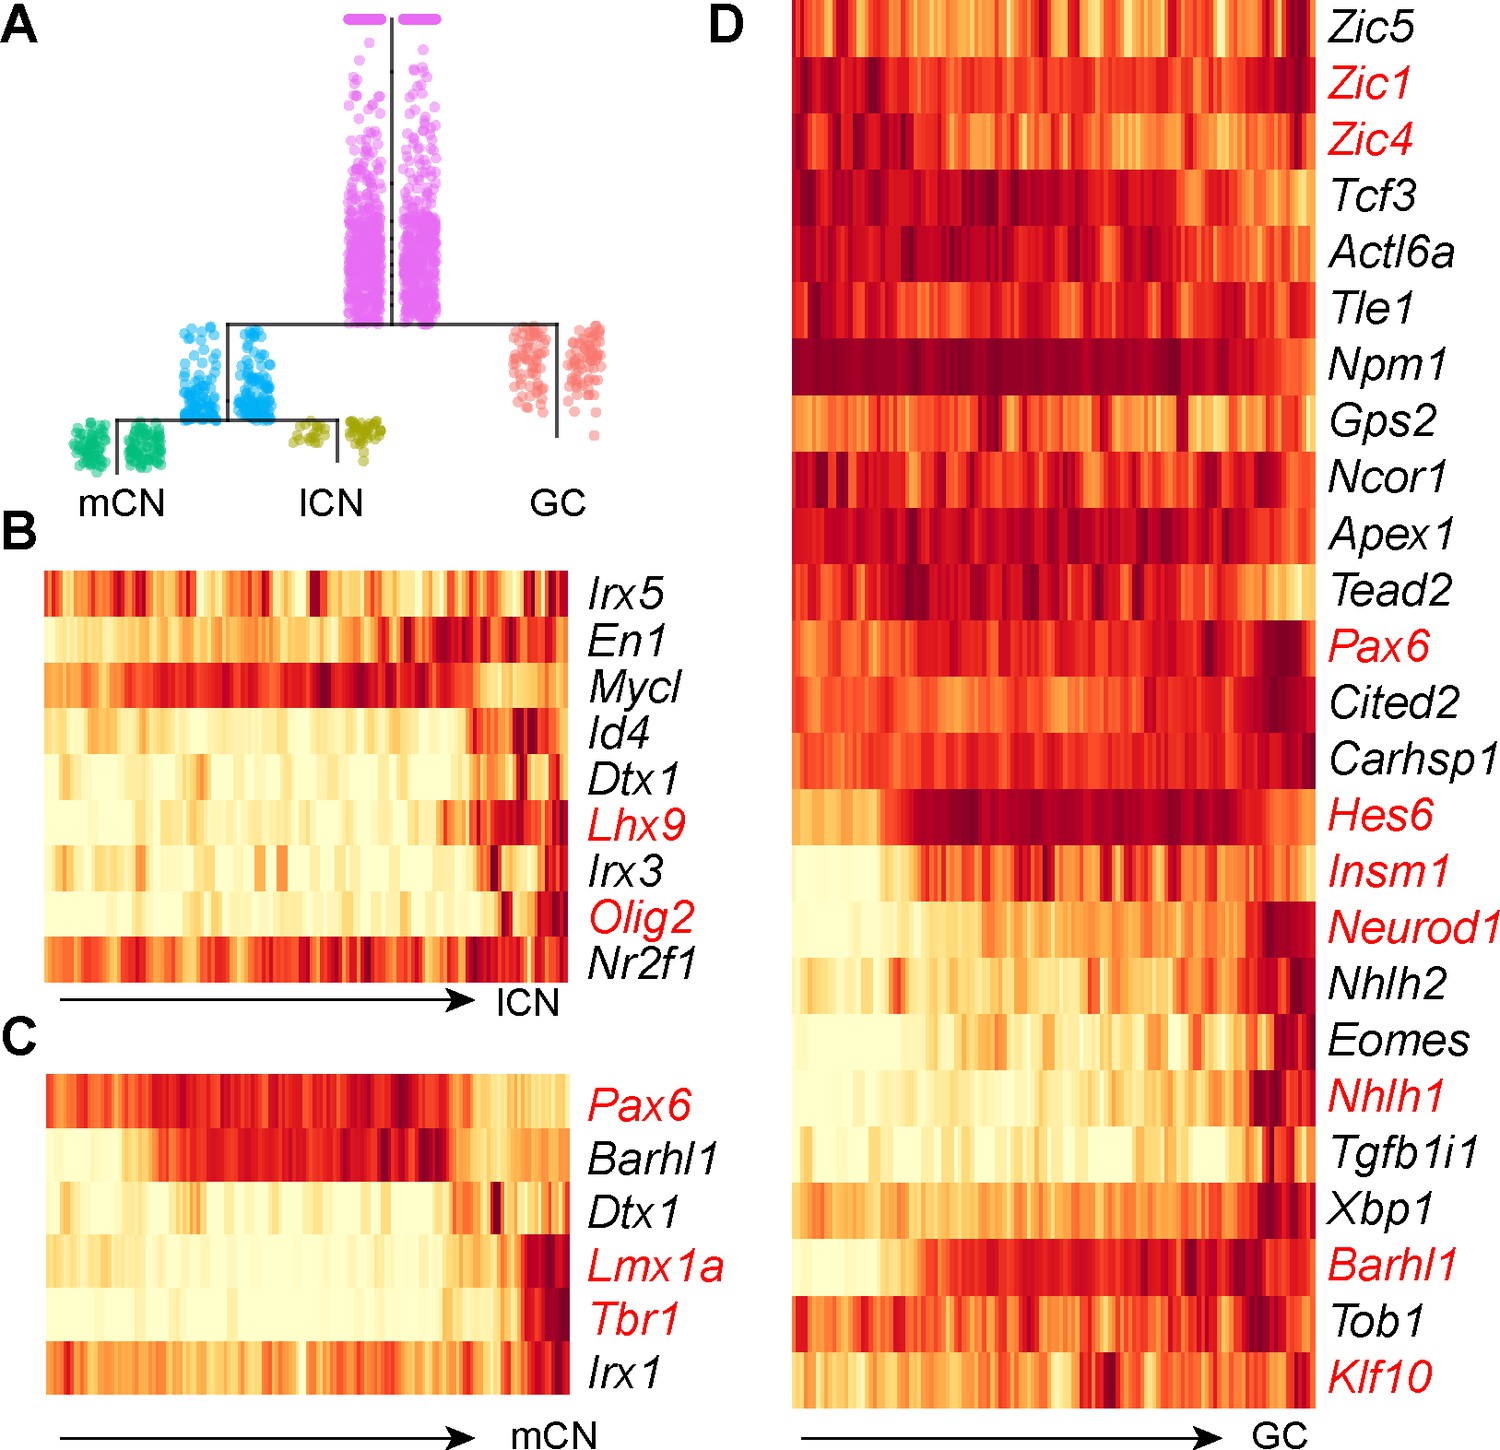
Figure 7—figure supplement 1
Distinct gene expression in the derivatives of the rhombic lip.
(A) Expression of marker genes in URD-inferred trajectories of RL derivatives. (B–D) Heatmaps showing the expression cascades of differentially expressed genes along the developmental trajectory identified by URD. (E) Heatmap showing the expression of cell-specific markers among granule cells (GC), medial cerebellar nuclei (mCN), and lateral cerebellar nuclei (lCN).
Figure 8

Integration of scRNAseq data from different embryonic stages.
(A) Annotation of 22 cell groups recovered from the E13.5 scRNAseq dataset. (B) Integration of scRNAseq data from E13.5, E14.5, E15.5, and E16.5, with a total of 29,006 cells. The last three datasets are from published data (Carter et al., 2018). (C and D) UMAP visualization of cell groups in the integrated (C) and individual datasets (D). (E) Histogram showing the percentage of cell groups recovered by scRNAseq at different embryonic stages. Abbreviations: AS, astrocyte; BG, Bergmann glia; Endo, endothelium; EGL/EGL.M/EGL.S/EGL.Pvalb, external granule layer cells in different cycle phases or those with strong Pvalb expression; Eryth, erythrocyte; GABA.pro, GABAergic progenitor; GABA.pre/GABA.pre1, GABAergic precursors; IN, GABAergic interneurons; IsN, isthmic nuclear neurons; mCN, medial cerebellar nuclei; lCN, lateral cerebellar nuclei; NPC/NPC.M/NPC.S, neural progenitor cell and NPC at the mitotic or synthesis phase; GC1/GC2, granule cells; MidO, midline organizer cells; Micro, microglia; PC.Cck/PC.Cdh9/PC.Etv1/PC.En1/PC.Foxp1/PC.Nrgn, Purkinje cell subtype that are defined by robust Cck, Cdh9, Etv1, Foxp1 and Nrgn, respectively; Peri, pericyte; PTZ, posterior transitory zone; Isl1/Tlx3, Isl1+ and Tlx3+ cells found in the anterior cerebellum.
Additional files
-
Supplementary file 1
Molecular features of the identified cell clusters.
Results of differential expression analysis of identified clusters of all cells (first spreadsheet), neural progenitor cells (second spreadsheet), GABAergic neurons and the precursors (third spreadsheet), and glutamatergic neurons and their precursors (forth spreadsheet).
- https://doi.org/10.7554/eLife.42388.018
-
Supplementary file 2
Functional and pathway enrichment analyses of feature genes of NPC clusters.
Results of functional and KEGG pathway enrichment analysis.
- https://doi.org/10.7554/eLife.42388.019
-
Supplementary file 3
List of antibodies, primers used in the current study.
Lists of primary and secondary antibodies used in the current study.
- https://doi.org/10.7554/eLife.42388.020
-
Transparent reporting form
- https://doi.org/10.7554/eLife.42388.021
Download links
A two-part list of links to download the article, or parts of the article, in various formats.
Downloads (link to download the article as PDF)
Open citations (links to open the citations from this article in various online reference manager services)
Cite this article (links to download the citations from this article in formats compatible with various reference manager tools)
Specification of diverse cell types during early neurogenesis of the mouse cerebellum
eLife 8:e42388.
https://doi.org/10.7554/eLife.42388


