Retinal direction selectivity in the absence of asymmetric starburst amacrine cell responses
- University of Victoria, Canada
Figures
Figure 1

Parallel ‘core’ mechanisms generating direction selectivity in DSGCs
(A) A cross section of the functional circuitry underlying direction selectivity in ON-OFF DSGCs. DSGCs receive glutamatergic inputs from ON and OFF bipolar cells, and inputs from mirror symmetric populations of ON and OFF GABAergic/cholinergic starburst amacrine cells. In this study, the stimuli used emphasized the ON responses. Preferred-side starbursts (p-starburst) provide mainly cholinergic excitation, while null-side starbursts (n-starburst) provide cholinergic excitation and a dominant GABAergic inhibition (Lee et al., 2010; Yonehara et al., 2011). Thus, GABAergic/cholinergic signals mediated by starbursts are differentially transmitted to the DSGC. (B) Schematic depicting the asymmetric anatomical connectivity between starbursts and DSGCs (top view). Bona fide ‘wrap-around’ synaptic connections (circled in red) are made largely by null-side starbursts, enabling DS dendrites of starbursts to mediate a ‘null’ inhibition (Briggman et al., 2011). This contrasts with the symmetrical functional cholinergic connectivity depicted in (A). Paracrine or ‘volume’ transmission could make cholinergic signals agnostic to the specific synaptic connectivity (Briggman et al., 2011; Brombas et al., 2017). (C) In conventional models, direction selectivity in DSGCs is largely shaped by asymmetric postsynaptic GABAergic inhibition. Asymmetric inhibition is contingent on the DS release of GABA from dendrites of starbursts; and on the asymmetric wiring (B). By contrast, excitation is non-directional, mainly mediated by glutamate released from bipolar cells (Park et al., 2014; Yonehara et al., 2013). In this model, the cholinergic receptive field is co-extensive with the glutamatergic receptive field. ACh is usually thought to play a non-directional role (Ariel and Daw, 1982; Amthor et al., 1996; Chiao and Masland, 2002; Park et al., 2014), although some studies note amplitude differences between preferred and null-evoked cholinergic currents (as shown here) suggesting that ACh may directly contribute to direction selectivity (Lee et al., 2010; Pei et al., 2015). (D) In the revised model proposed here, cholinergic excitation is directional by virtue of its timing with GABAergic inhibition rather than by its response amplitude (C). The differences in the functional connectivity of GABA and ACh (A) predict that for preferred-direction motion, excitation would lead inhibition; and for null-direction motion, E/I would be activated together. In this study, the central hypothesis is that E/I offsets contribute to a parallel DS mechanism, which does not necessarily rely on the modulation of the peak amplitude of GABA or ACh inputs (in contrast to the model shown in C).
Figure 2
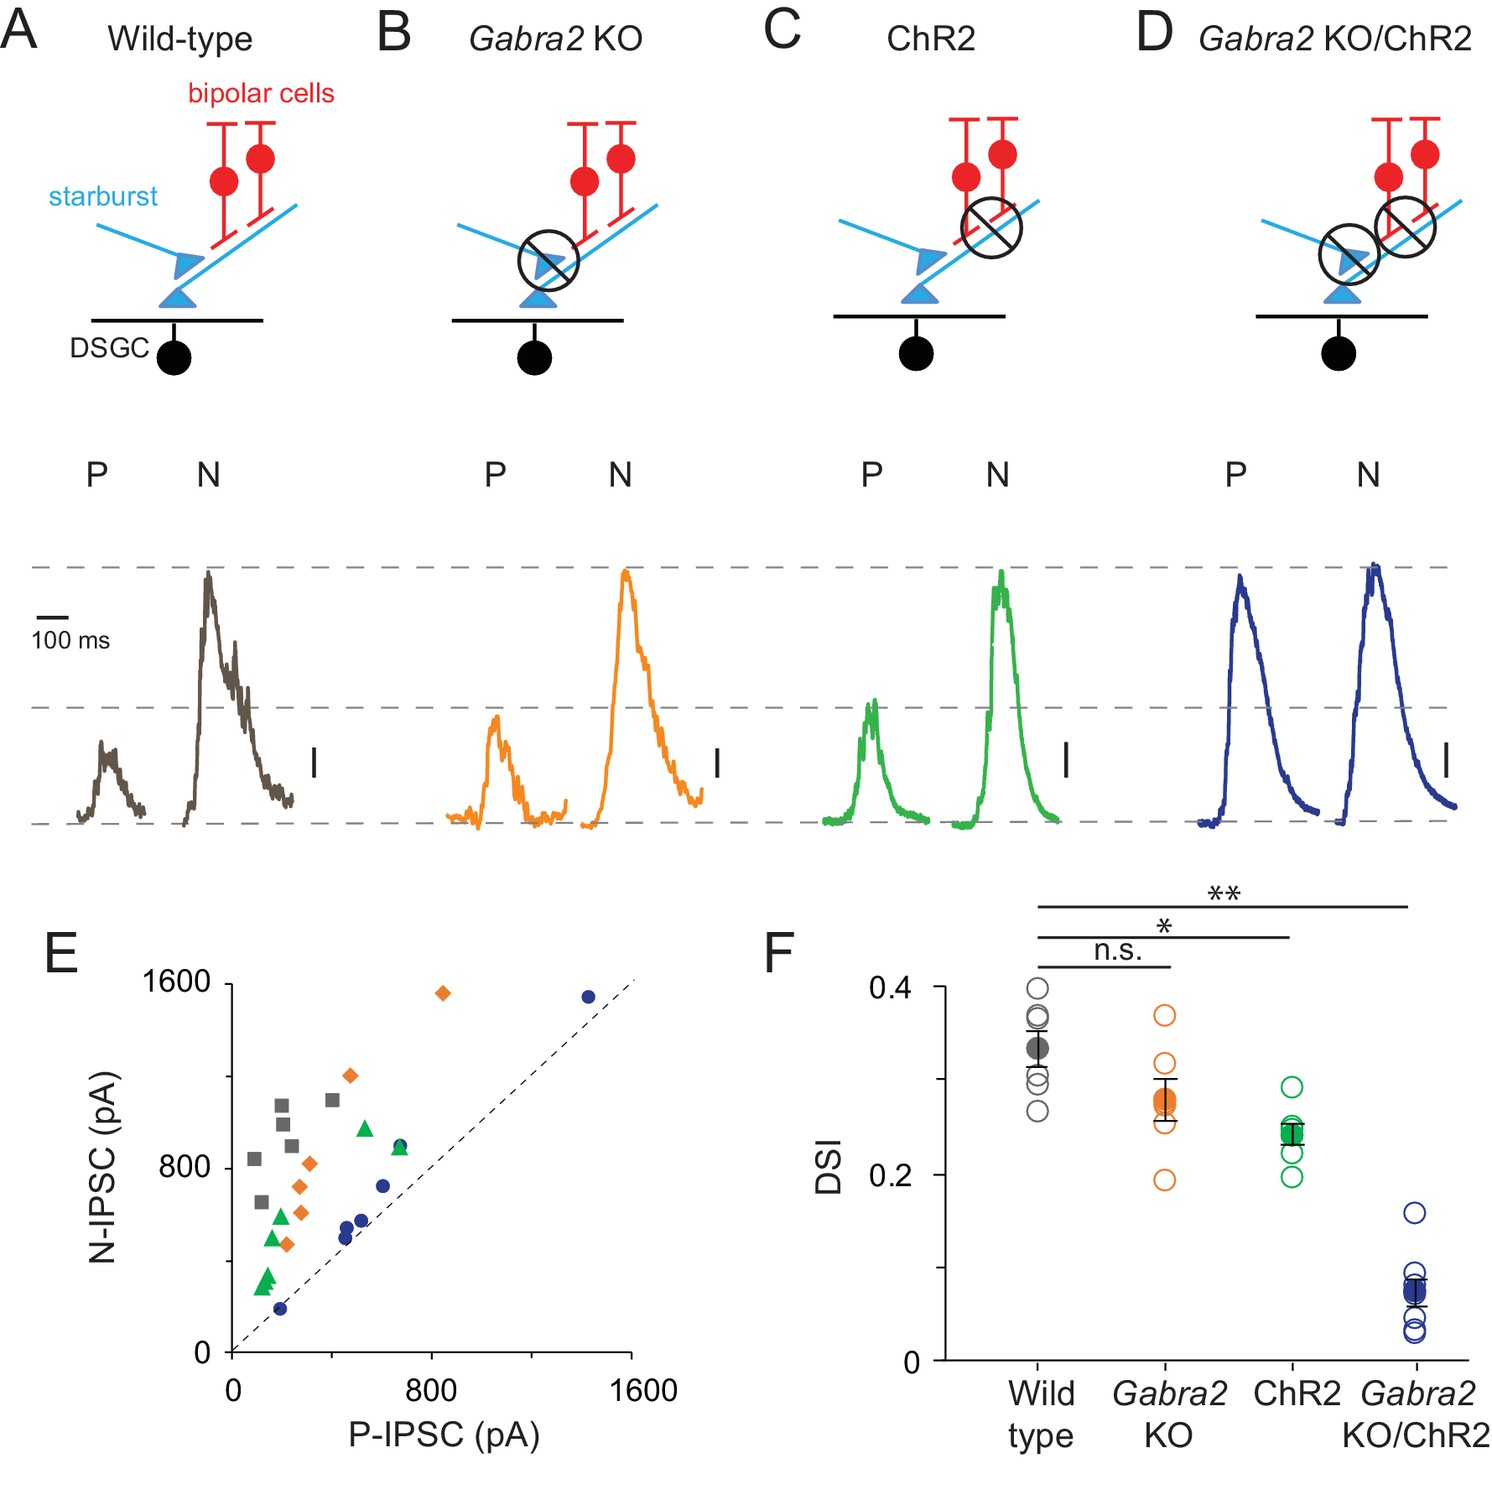
Direction selectivity in starburst dendrites relies on both excitatory and inhibitory network mechanisms
(A–D) Starburst output monitored as IPSCs in voltage-clamped DSGCs (VHOLD ~0 mV) in a variety of mouse lines (as indicated). For simplicity, only ON IPSCs are shown for stimulus motion in the DSGC’s preferred (P) or null-direction (N) under conditions in which (A) all synaptic inputs are intact; (B) mutual inhibition between starbursts is selectively disrupted using the conditional Gabra2 KO; (C) bipolar cell inputs are blocked and ChR2-expressing starbursts are directly stimulated; (D), both mutual inhibition and bipolar cell inputs are blocked. Vertical scale bar = 100 pA (A–C) or 200 pA (D). Responses are averaged over three trials. (E) The peak amplitudes of the IPSCs evoked during preferred- and null-direction motion are plotted against each other for the conditions noted in (A–D). A reference line with slope = 1 (dashed line) is shown to facilitate comparisons. n = 6 for wild type, Gabra2 KO and ChR2; n = 7 for Gabra2 KO/ChR2. (F) The average direction-selectivity index (DSI) computed from the normalized vector sum of the peak amplitude of IPSCs evoked by stimuli moving in eight directions, for the conditions in (A–D) (See Materials and methods for DSI calculation; DSI = 0 indicates non-directional responses; DSI = 1 indicates strongly tuned responses). Pooled data are represented as mean ± SEM (Solid circles), while single cell responses are denoted by open circles. Statistical significance was estimated by unpaired t-tests, where *, ** or n.s. indicate p=0.0026, 0.0001 and 0.1068, respectively.
-
Figure 2—source data 1
Included is an exccel file containing the data presented in Figure 2A-F.
- https://doi.org/10.7554/eLife.42392.004
Figure 3
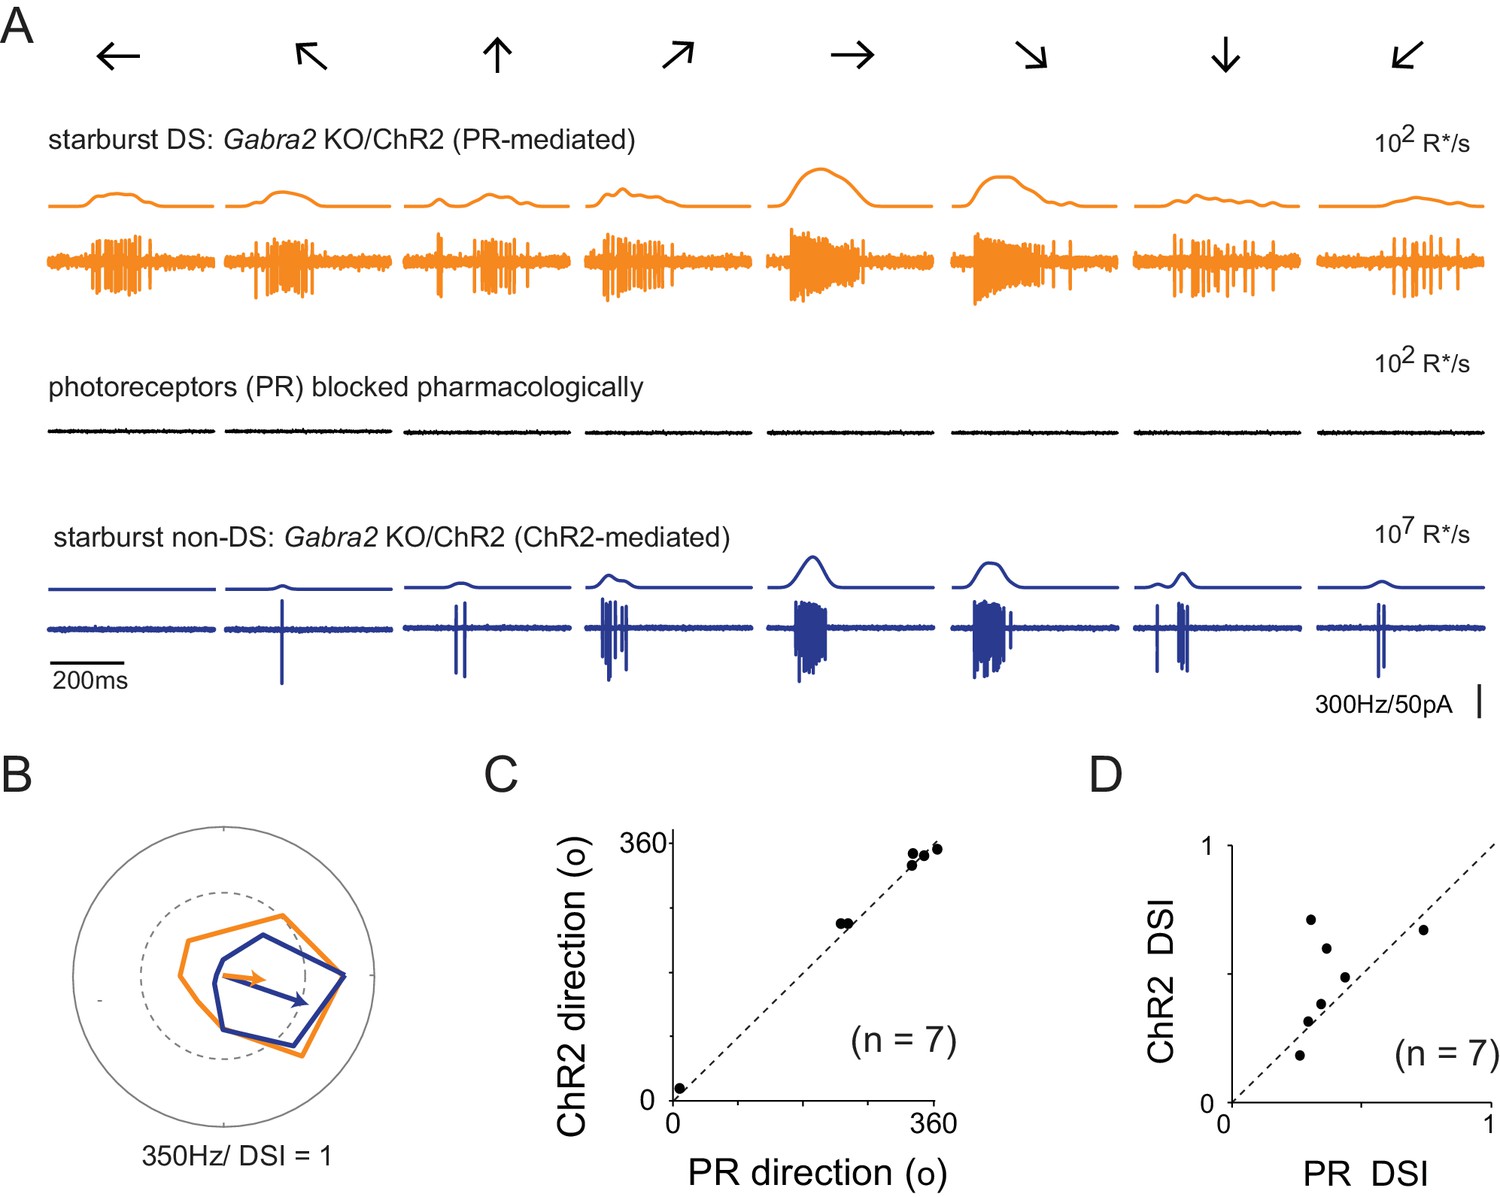
Retinal direction selectivity in the absence of asymmetric starburst amacrine cell responses
(A) Spiking responses from a DSGC in the Gabra2 KO/ChR2 mouse line measured under conditions when photoreceptor (PR) output is intact (top), when photoreceptor synapses are blocked pharmacologically (50 µM DL-AP4, 10 µM UBP310 and 20 µM CNQX (middle)), and subsequently, when stimulus intensity is increased to directly activate starbursts using ChR2 (bottom). This enables a direct comparison of direction selectivity in a DSGC under conditions in which starburst output is DS (top) or non-DS (bottom). Stimuli were moved in eight directions indicated by the arrows at a velocity of 1200 μm/s. The smooth traces on top of each spike train indicates the average spike rate estimated by low-pass filtering the spike train via convolution with a Gaussian kernel (σ = 25 ms). (B) Polar plots of the peak spike rates for the responses in the two conditions shown in (A). The arrow indicates the DSGC’s preferred direction, scaled to the DSI. (C–D) A comparison of the preferred direction (C) and DSI (D) of the responses evoked during ChR2 stimulation, and during intact photoreceptor stimulation in the Gabra2 KO/ChR2 mouse line (n = 7).
-
Figure 3—source data 1
Included is an exccel file containing the data presented in Figure 3A-D.
- https://doi.org/10.7554/eLife.42392.006
Figure 4
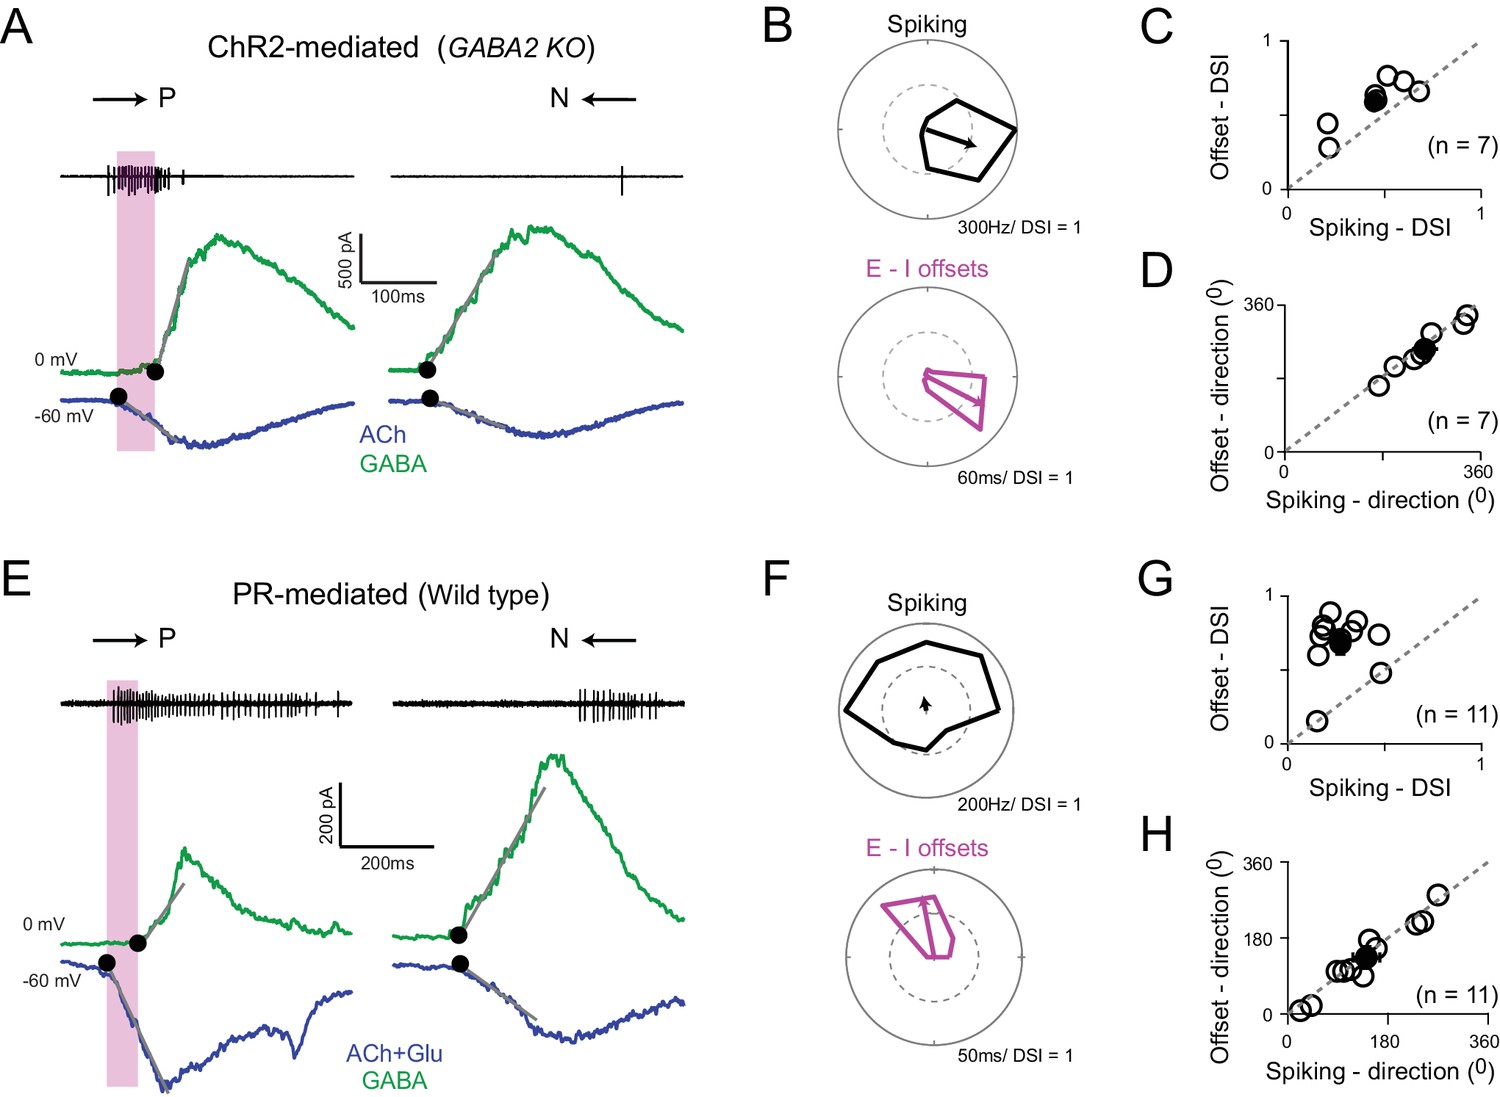
Directionally tuned E/I temporal offsets maintain direction selectivity in DSGCs in the absence of asymmetric starburst responses
(A) Optogenetically evoked spikes, EPSCs and IPSCs recorded in succession from the same DSGC in the Gabra2 KO/ChR2 mouse line (in the absence of photoreceptor input). The onset of excitation and inhibition (indicated by ●), was estimated by back extrapolating the lines of best fit of the initial response (grey lines; see Materials and methods). The shaded box indicates the E/I temporal offset window during which a large fraction of the spikes appear to be generated. (B) Polar plots of the peak firing rates (top) and E/I temporal offsets (bottom) for optogenetic responses (depicted in A) to eight stimulus directions. C–D, A comparison of the DSI (C) and direction coded (D) estimated from the peak firing rates or E/I temporal offsets (as shown in B) across 7 cells (open circles). Pooled data (closed circles) are represented as mean ± SEM. (E–H) Similar to A–D but for responses measured under physiological conditions i.e. responses driven by photoreceptors in the wild-type retina (n = 11). The DSI of the E/I temporal offsets was higher than the DSI of spiking (p<0.001). Pooled data are represented as mean ± SEM.
-
Figure 4—source data 1
Included is an exccel file containing the data presented in Figure 4A-D.
- https://doi.org/10.7554/eLife.42392.008
-
Figure 4—source data 2
Included is an exccel file containing the data presented in Figure 4E-H.
- https://doi.org/10.7554/eLife.42392.009
Figure 5 with 1 supplement
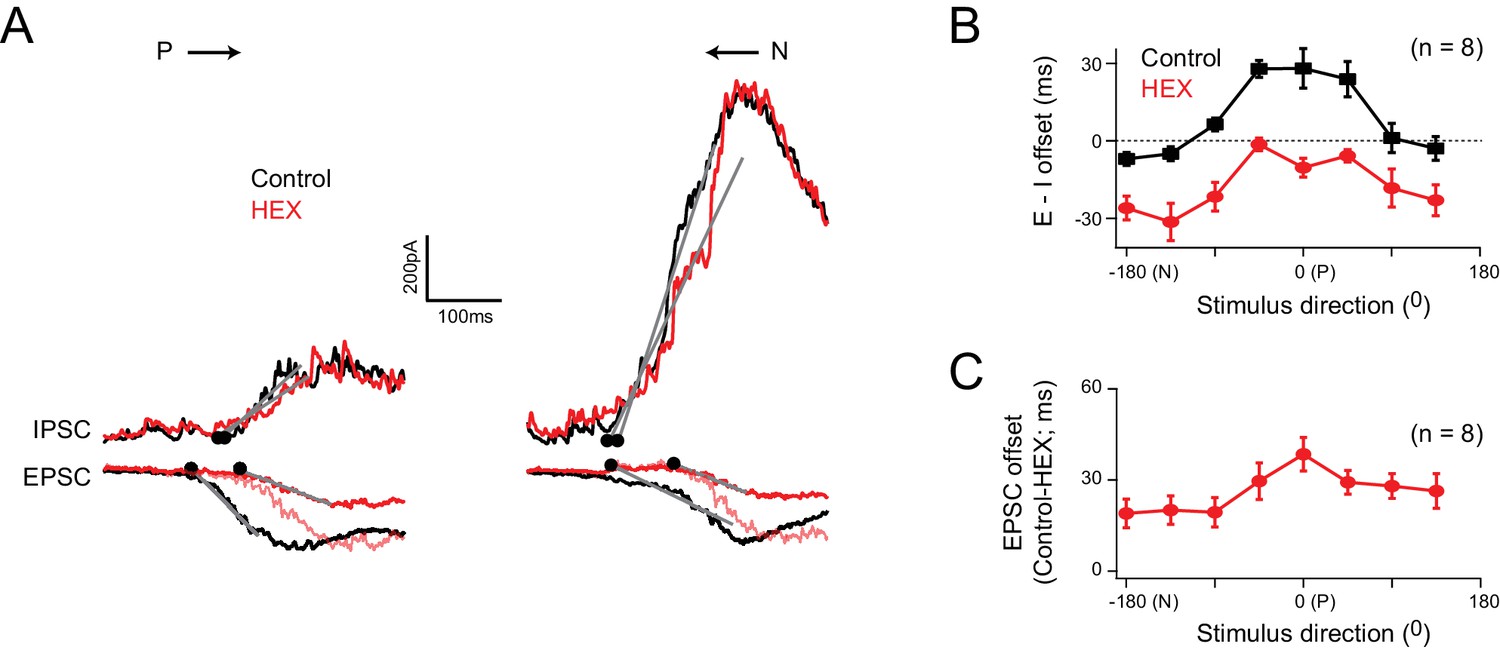
Cholinergic excitation shapes temporal E/I temporal offsets under physiological conditions
(A) The EPSCs and IPSCs elicited in a DSGC for preferred and null stimuli, in control (black), and in the presence of a nicotinic acetylcholine receptor antagonist (hexamethonium, HEX; red traces). A normalized version of the EPSC measured in HEX (light red trace) is illustrated to emphasize the delay in excitation that occurs when cholinergic receptors are blocked. (B) The directional tuning of the E/I temporal offsets in control and HEX averaged across 8 cells. The offsets were aligned to the preferred direction (P) of the spike responses, which were measured in the same DSGC before performing the whole cell recording. HEX significantly reduced the E/I temporal offsets across all directions (p<0.01). Data are represented as mean ± SEM. (C) The directional tuning of the timing delay of the EPSC in HEX relative to control (n = 8). Data are represented as mean ± SEM. The increased onset latency observed in HEX continued to be observed when inhibition was blocked, indicating that they cannot be accounted for by large voltage–clamp errors associated with inhibitory conductances (Figure 5—figure supplement 1).
-
Figure 5—source data 1
Included is an exccel file containing the data presented in Figure 5.
- https://doi.org/10.7554/eLife.42392.016
Figure 5—figure supplement 1
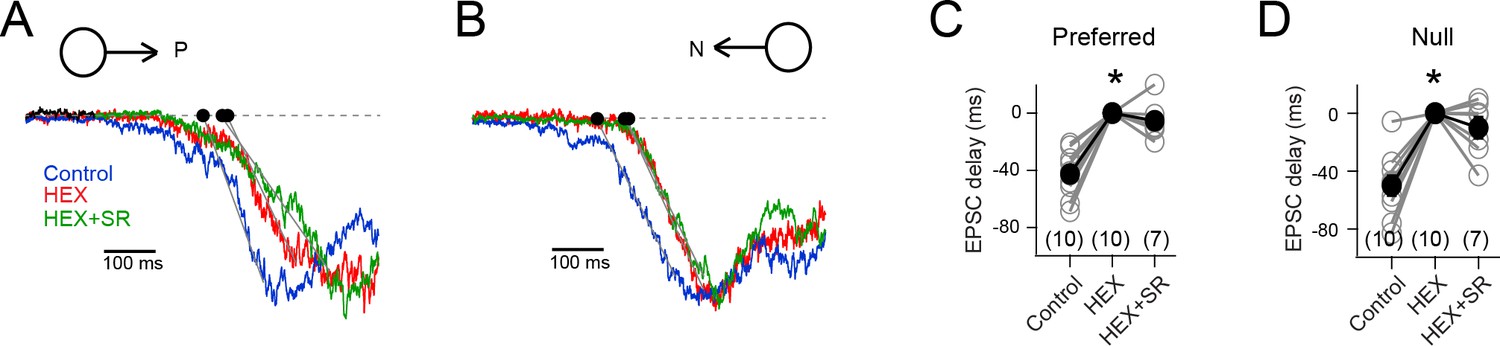
The EPSC timing delay in HEX is independent of inhibition.
(A – B) The EPSCs elicited in a DSGC to preferred (A) and null stimuli (B), in control, HEX (to block nicotinic acetylcholine receptors), and HEX + SR-95531 (to block GABAA receptors). Note that the responses have been normalized to show that the timing of the EPSCs is altered upon addition of HEX, but not upon further addition of SR. (stimulus velocity = 600 μm/s) (C–D) The onset of the preferred (C) and null EPSCs (D) in control (n = 10), HEX (n = 10), and HEX +SR (n = 7) shown relative to HEX. The EPSCs in HEX were significantly delayed to control (*p<0.001). But further addition of SR did not alter the timing. Pooled data are represented as mean ± SEM.
Figure 6
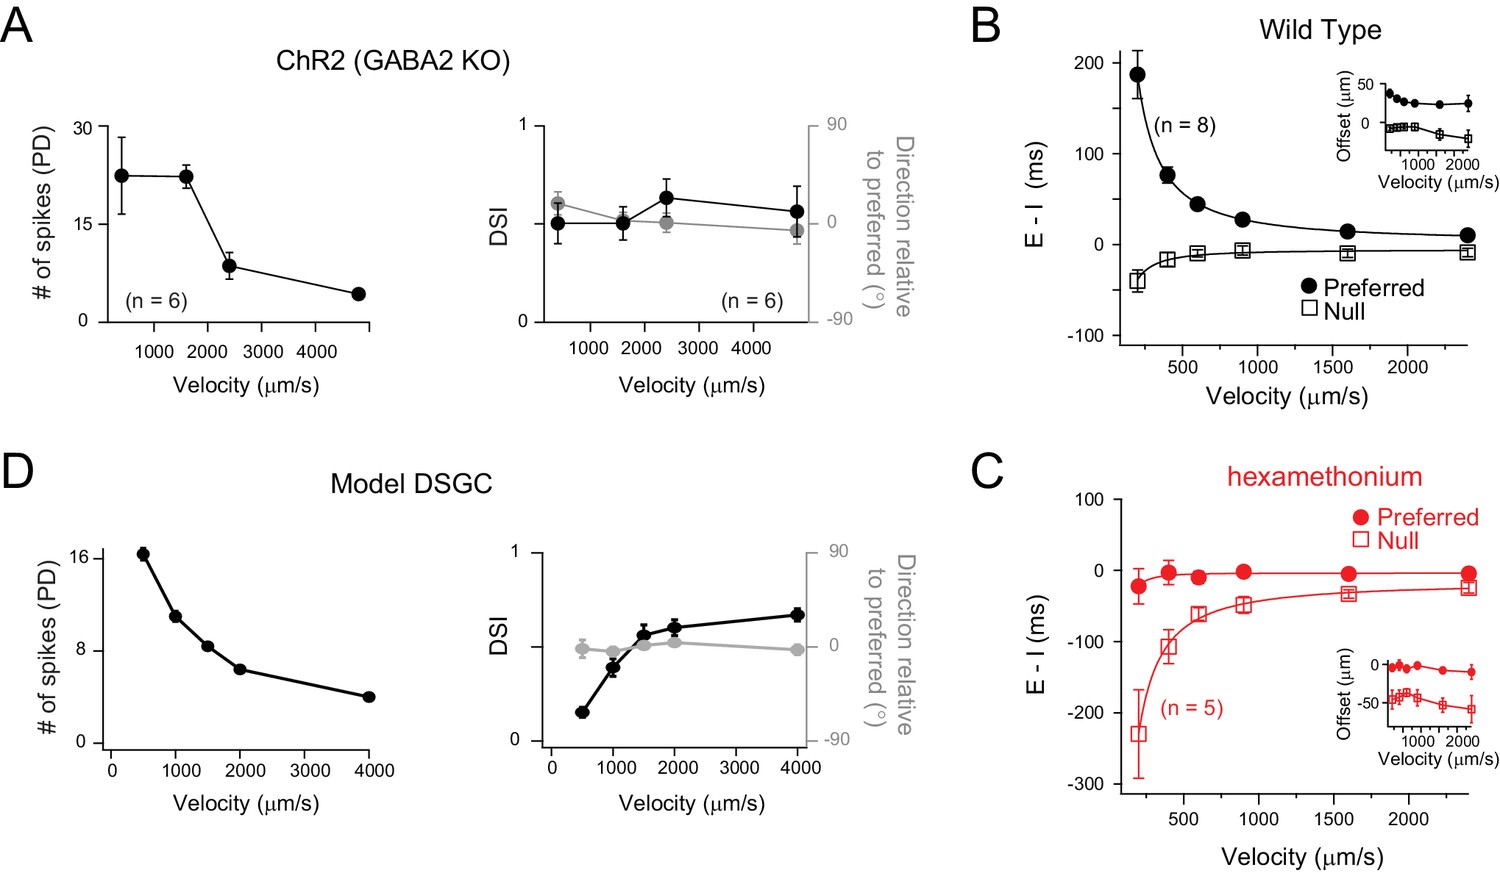
Velocity tuning of E/I temporal offsets in DSGCs.
(A) A plot of the average number of ChR2-evoked spikes for preferred direction motion as a function of stimulus velocity (left panel; n = 6), measured from DSGCs in the Gabra2 KO/ChR2 mouse line. The average DSI and preferred direction remains stable across velocity (right panel; n = 6). Data are represented as mean ± SEM. (B–C) The E/I temporal offsets measured from DSGCs in the wild-type retina, for both preferred and null directions as a function of velocity (B); n = 8). The offsets during preferred direction motion were significantly larger than those for null direction motion for all velocities (p<0.001). The temporal offsets correspond to a relatively fixed spatial offset (calculated by velocity x E/I temporal offsets) across a range of velocities tested (inset). The effects of blocking cholinergic transmission (hexamethonium) on E/I temporal offsets is shown in C). Data are represented as mean ± SEM. (D) Spike output of a computer simulated model DSGC in which the E/I ratio was fixed (1/2) but the E/I temporal offsets were varied according to measurements in B). E/I temporal offsets alone could generate robust DS across a range of velocities, except of the lowest velocity tested (see text for details).
-
Figure 6—source data 1
Included is an exccel file containing the data presented in Figure 6B-C.
- https://doi.org/10.7554/eLife.42392.018
Figure 7 with 2 supplements
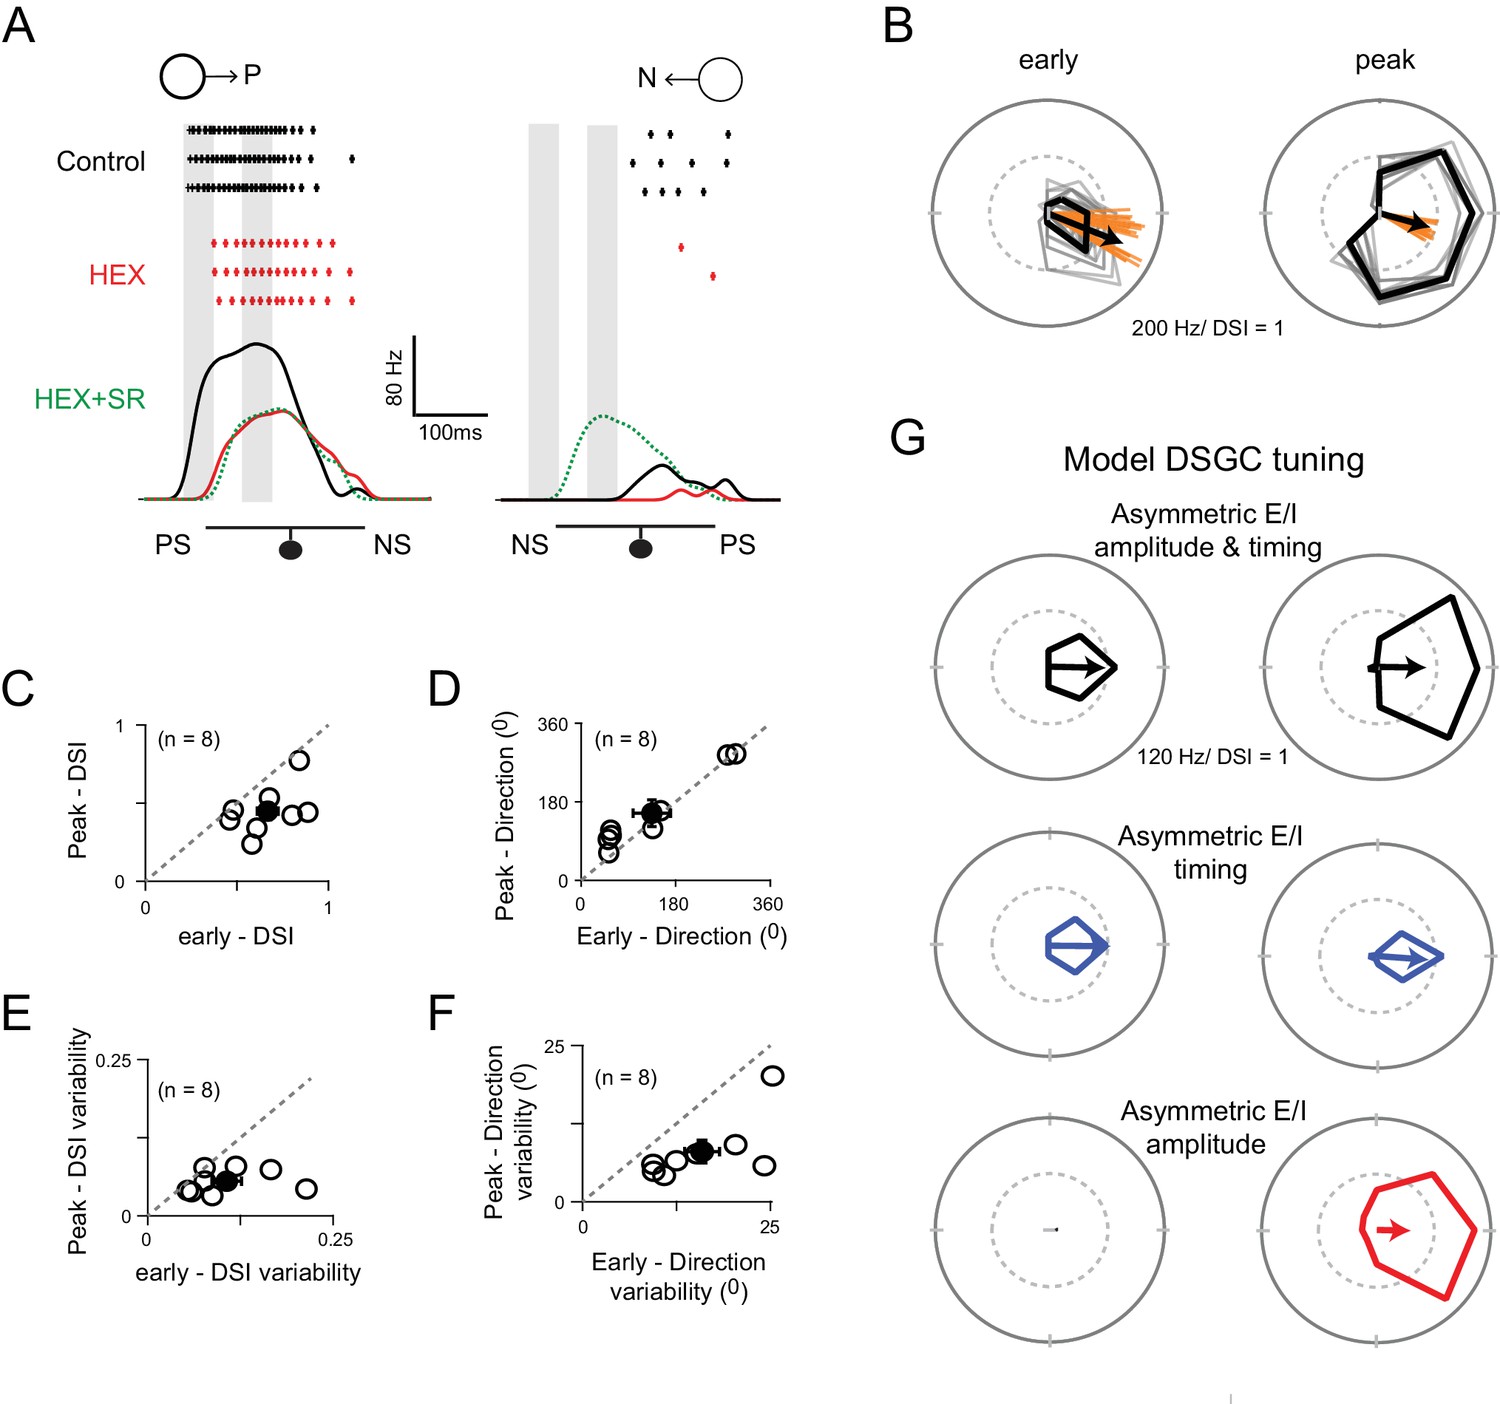
Two ‘core’ DS mechanisms are engaged during different phases of the DSGC response.
(A) Spike rates during stimulus motion in the preferred or null directions in control conditions (black), after cholinergic excitation is blocked by HEX (red), and in the added presence of a GABA receptor blocker (5 μM SR-95531; green) to isolate the glutamate receptive field. Preferred and null responses could be accurately aligned, temporally, based on the glutamatergic receptive field measurement, which was important in estimating the temporal evolution of the DS tuning shown in (B–G). The effects of HEX on the response latency were reversible, and not observed when responses were weakened by blocking NMDA receptors (see Figure 7—figure supplement 1). PS and NS indicates the preferred- and null-sides of the DSGC. (B) Polar plots of a DSGC’s early (left) and peak (right) spike responses (the 50 ms shaded regions in A) over 29 trials. The mean response is shown in black, while the individual trials are shown in grey. Note early responses are more sharply tuned but provide a less reliable indication of the direction (i.e. the direction encoded is more variable; orange lines) compared to the peak response. (C–D) A comparison of the average DSI (C) and preferred direction (D) calculated from the early and peak spike responses for individual cell (n = 8). The DSI of the early responses was significantly higher than the peak responses (p<0.01), while the direction encoded in both phases were near identical. Pooled data are represented as mean ± SEM. (E–F) A comparison of the trial-to-trial variability of the DSI (E) and preferred direction (F) of the early and peak responses (n = 8). Trial-to-trial variability was estimated by the standard deviation of DSI/preferred direction across trials within each cell (minimum 10 trials). The variability was higher for early responses for both DSI (p<0.05) and preferred direction (p<0.005). Pooled data are represented as mean ± SEM. (G) Tuning properties of a computer simulated model DSGC in which both E/I temporal offsets and amplitude asymmetries (top), only E/I temporal offsets (middle) or only E/I amplitude asymmetry (bottom) were implemented. E/I temporal offsets alone resulted in a sharper tuning similar to the early responses in B), but the tuning became broader when E/I ratios were intact, similar to the peak responses in B) (see Figure 7—figure supplement 2 for synaptic currents and spiking responses measured in the model). Responses were averaged over 20 trials.
-
Figure 7—source data 1
Included is an exccel file containing the data presented in Figure 7.
- https://doi.org/10.7554/eLife.42392.013
Figure 7—figure supplement 1
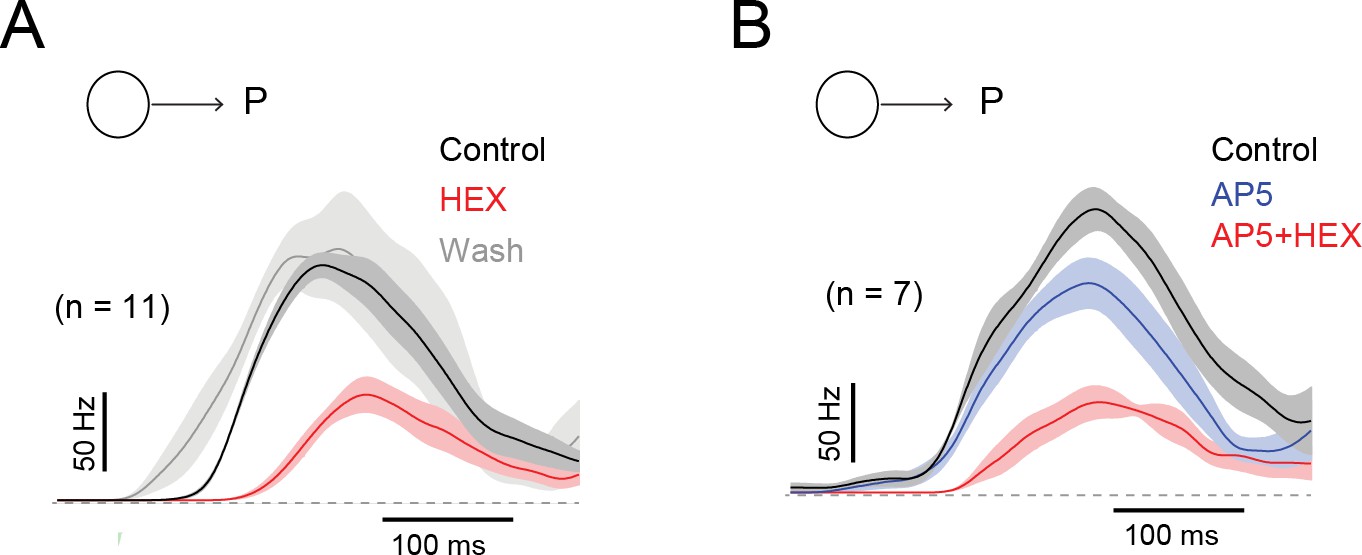
The effects of blocking nACh receptors on the latency of the DSGC response is reversible, and contrasts with the effects of NMDA receptor antagonists.
(A) The average ON spiking responses, convolved with a Gaussian kernel (σ = 25 ms), measured in control (black), in the presence of a nicotinic ACh receptor antagonist (50 µM hexamethonium; HEX, red) and in wash conditions (grey). HEX increased the spiking latency by 51 ± 7 ms. Traces depict the mean (solid line)± SEM (shaded region). (B) The average spiking responses measured in control (black), in the presence of a NMDA receptor antagonist (50 µM D-AP5, blue) and in the added presence of HEX (red). AP5 did not alter the spike latency (2 ± 4 ms), while further addition of HEX increased the latency (45 ± 11 ms).
Figure 7—figure supplement 2
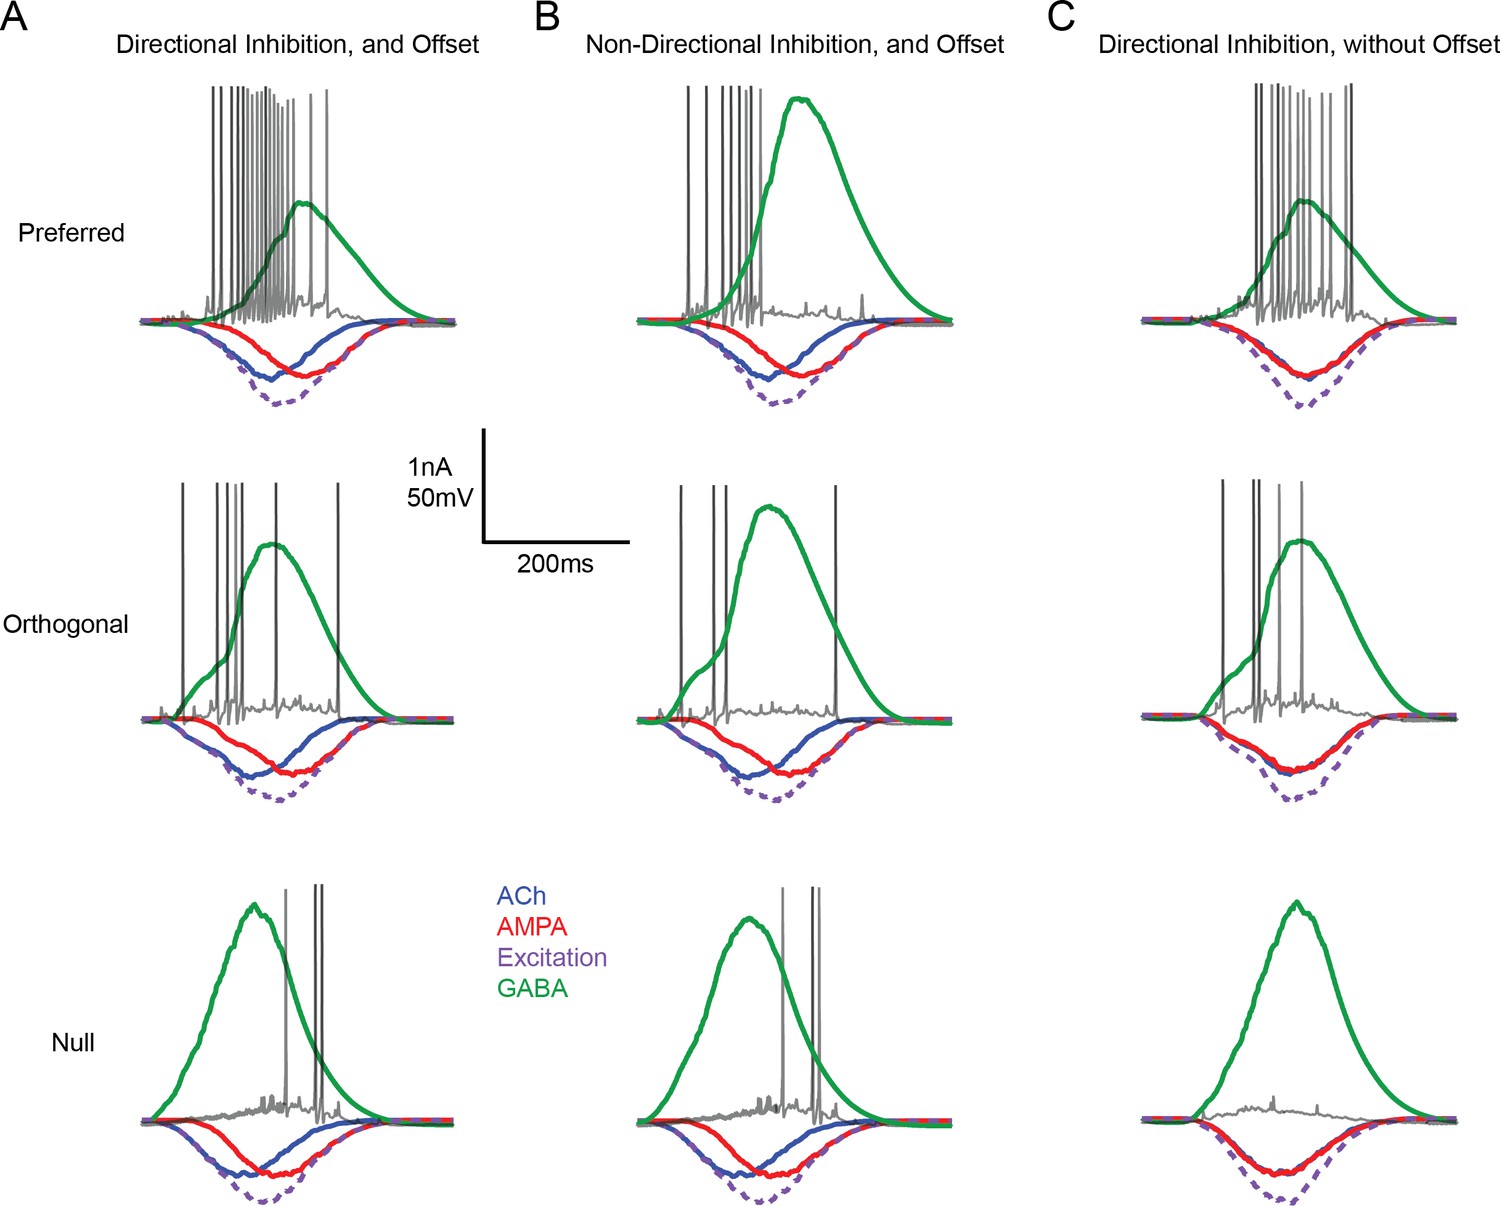
Input/output measured in a model DSGC in which responses are driven by directional changes in inhibition and/or E/I temporal offsets
(A) Single representative spike trains in a model DSGC are overlaid over the underlying EPSCs and IPSCs (averaged over 20 trials) for preferred (top), orthogonal (middle) and null direction motion (bottom) under conditions in which both E/I ratios (directional inhibition) and E/I temporal offsets were present. Note that the spiking responses in the null direction were delayed compared to the preferred direction spiking, resulting in changes in direction selectivity over the time-course of the response. (B) As in (A) but only E/I temporal offsets were used to drive DS. The strength of inhibition is non-DS. (C) As in (A) but only directionally tuned inhibitory charge was used to drive DS. All E/I timing offsets were removed. This simulation illustrates the workings of conventional models of DS. The spiking onset was delayed compared to (A and B), but DS did not evolve over time.
Additional files
-
Transparent reporting form
- https://doi.org/10.7554/eLife.42392.019
Download links
A two-part list of links to download the article, or parts of the article, in various formats.
Downloads (link to download the article as PDF)
Open citations (links to open the citations from this article in various online reference manager services)
Cite this article (links to download the citations from this article in formats compatible with various reference manager tools)
Retinal direction selectivity in the absence of asymmetric starburst amacrine cell responses
eLife 8:e42392.
https://doi.org/10.7554/eLife.42392


