DNA translocation mechanism of an XPD family helicase
- Imperial College London, United Kingdom
Figures
Figure 1 with 3 supplements
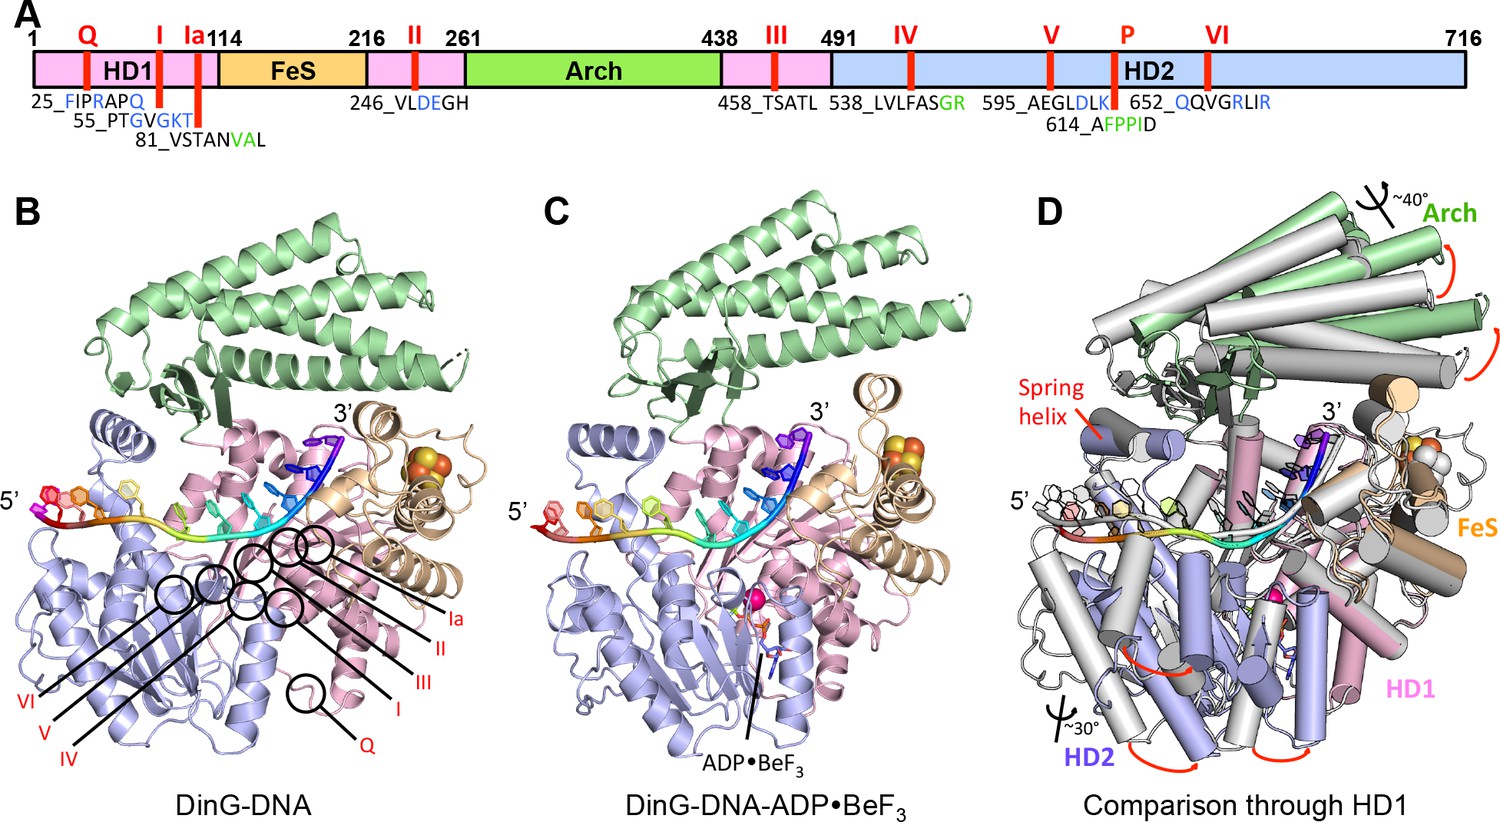
Structures of the DinG/ssDNA binary and ternary complexes.
(A) The domain arrangement of DinG. The HD1, HD2, 4FeS and Arch domains are coloured in pink, lilac, wheat and green, respectively. Conserved motifs are labelled and listed. Residues labelled in blue participate in ATP hydrolysis, and those in green participate in DNA binding. (B) Cartoon view of the DinG binary complex with ssDNA coloured as in (A). (C) Cartoon view of the DinG ternary complex with ssDNA and ADP•BeF3, coloured as in (A). (D) Superposition of the two structures based on the HD1 domain to illustrate the conformational changes between the structures. The binary complex is in grey and the ternary complex is coloured by domains as in (A).
Figure 1—figure supplement 1
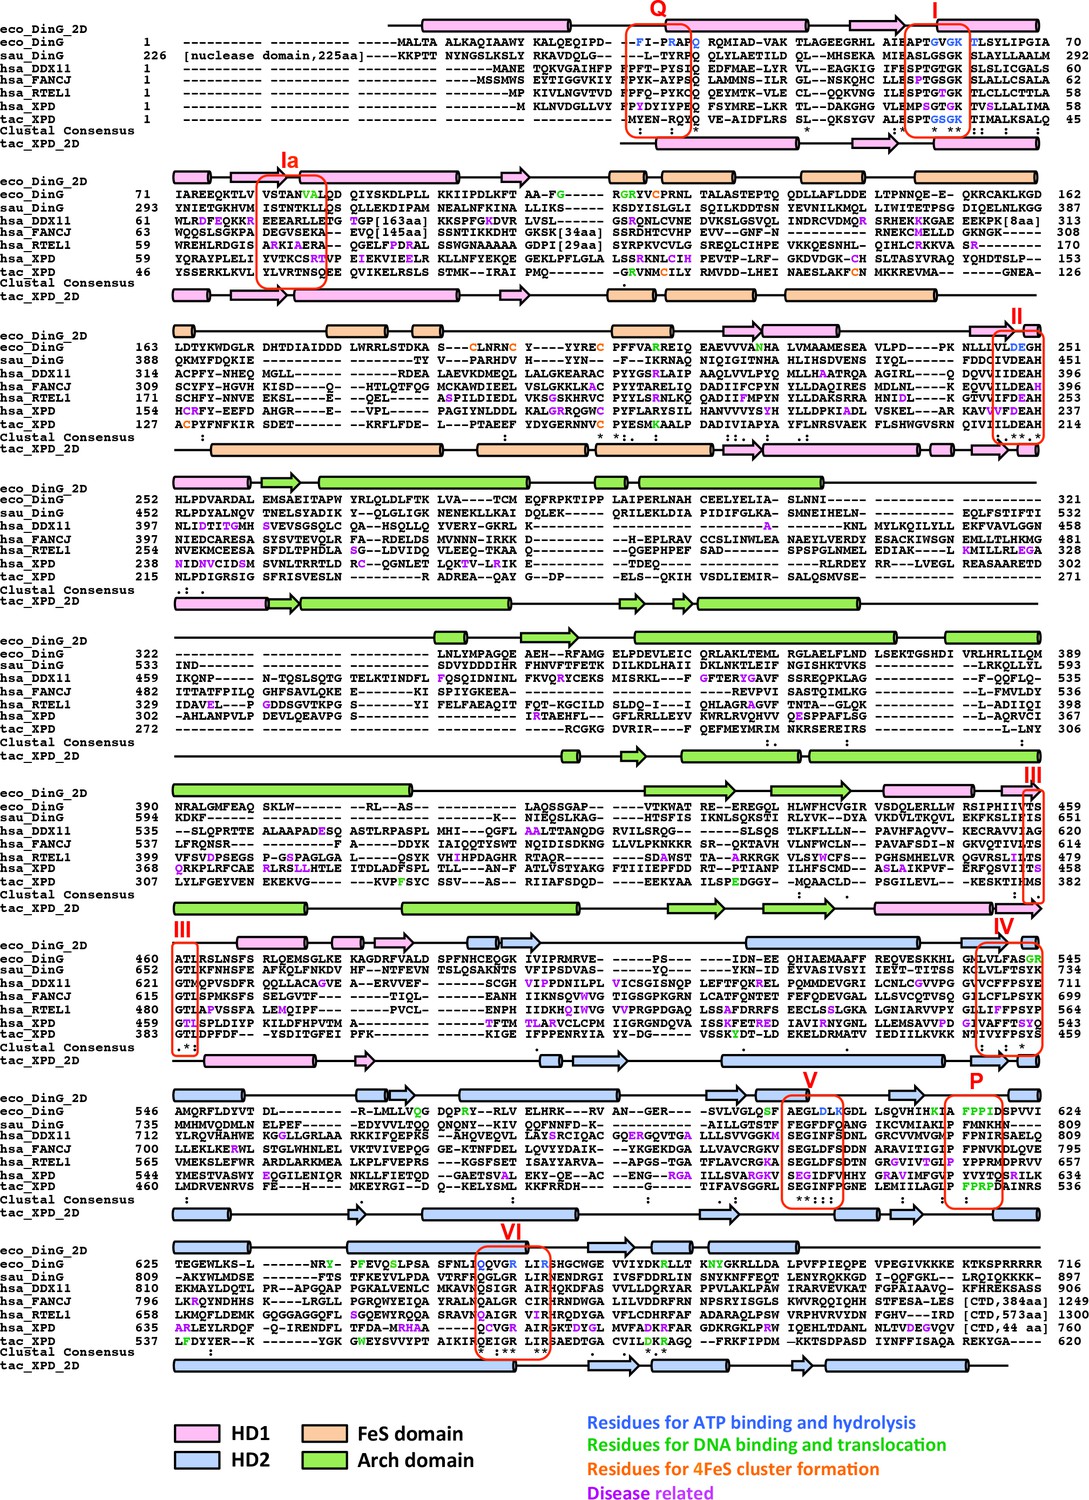
Sequence and structural alignment of DinG/XPD family members.
Sequence alignment was conducted with the Cluster Omega program (https://www.ebi.ac.uk/Tools/msa/clustalo) with manual adjustments to keep the integrity of the secondary structural elements observed from ecDinG and taXPD. 2D structural elements of ecDinG and taXPD are shown by rods for α-helices and arrows for β-strands. These elements are coloured according to domains (HD1 in light pink, HD2 in light blue, 4FeS domain in wheat and arch domain in pale green). Amino acid sequences for conserved helicase motifs Q, I, Ia, II-VI are labelled. Residues identified for 4FeS cluster formation (in this study or reported previously) are highlighted in orange. Residues identified for ecDinG and taXPD ATP binding/hydrolysis (in this study or reported previously) are highlighted in blue. Residues identified for ecDinG and taXPD DNA binding/translocation (in this study or reported previously) are highlighted in green. Disease-causing mutations of human DDX11, FANCJ, RTEL1 and XPD are highlighted in purple. Regions that are not conserved across sequences are omitted and shown by numbers in square brackets instead.
Figure 1—figure supplement 2
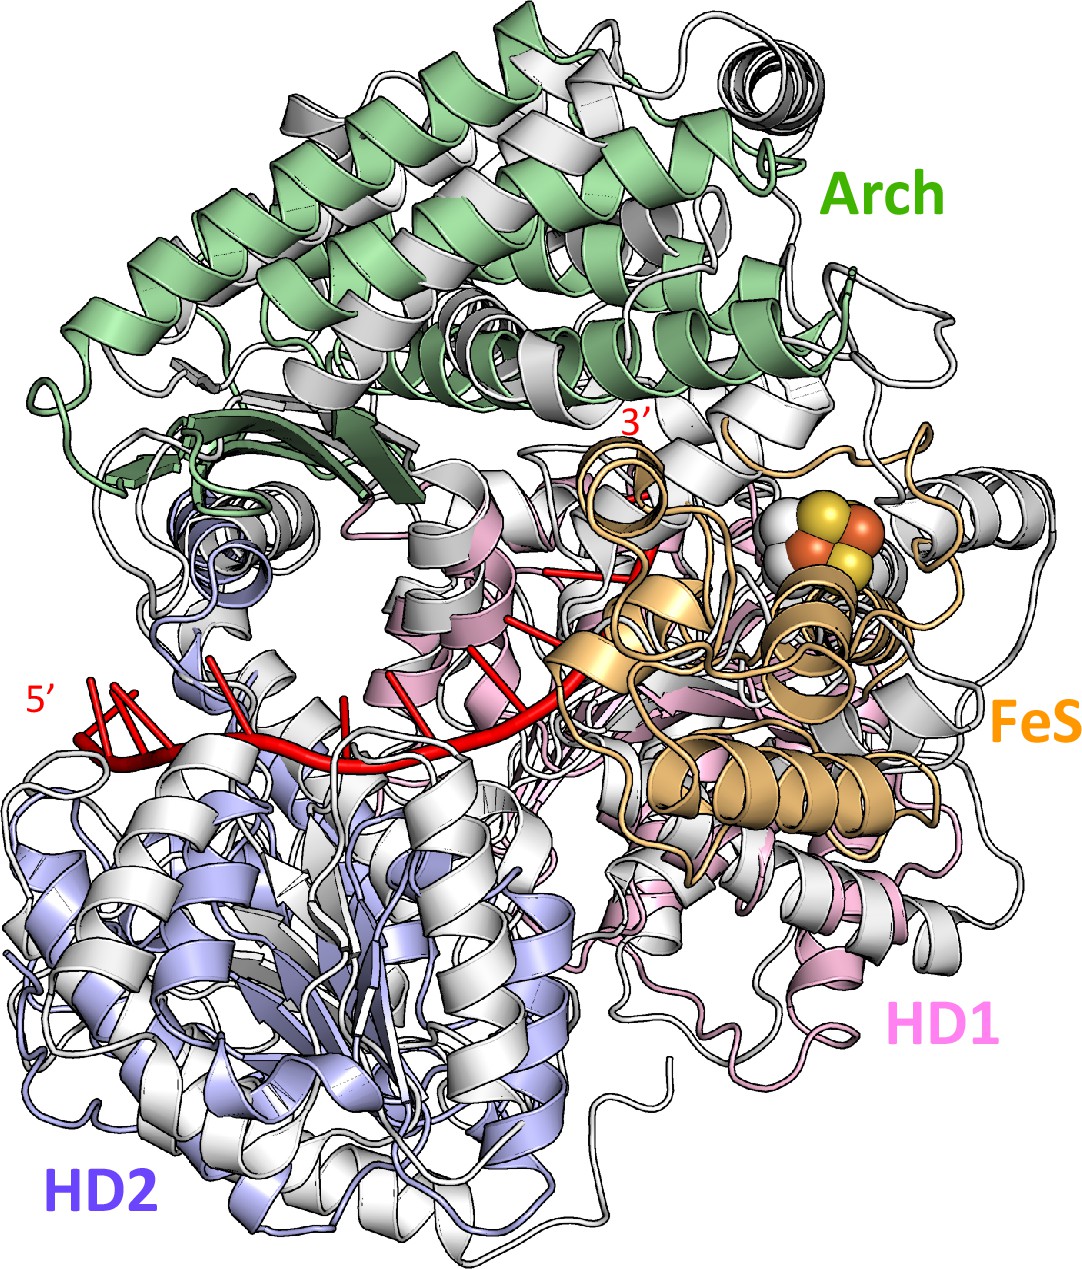
Superimposition of DinG binary structure and human XPD structure from the TFIIH complex.
Comparison of DinG and hsXPD (taken from PDB 5OF4) structures is shown on the right. ssDNA in the DinG complex is coloured in red.
Figure 1—figure supplement 3
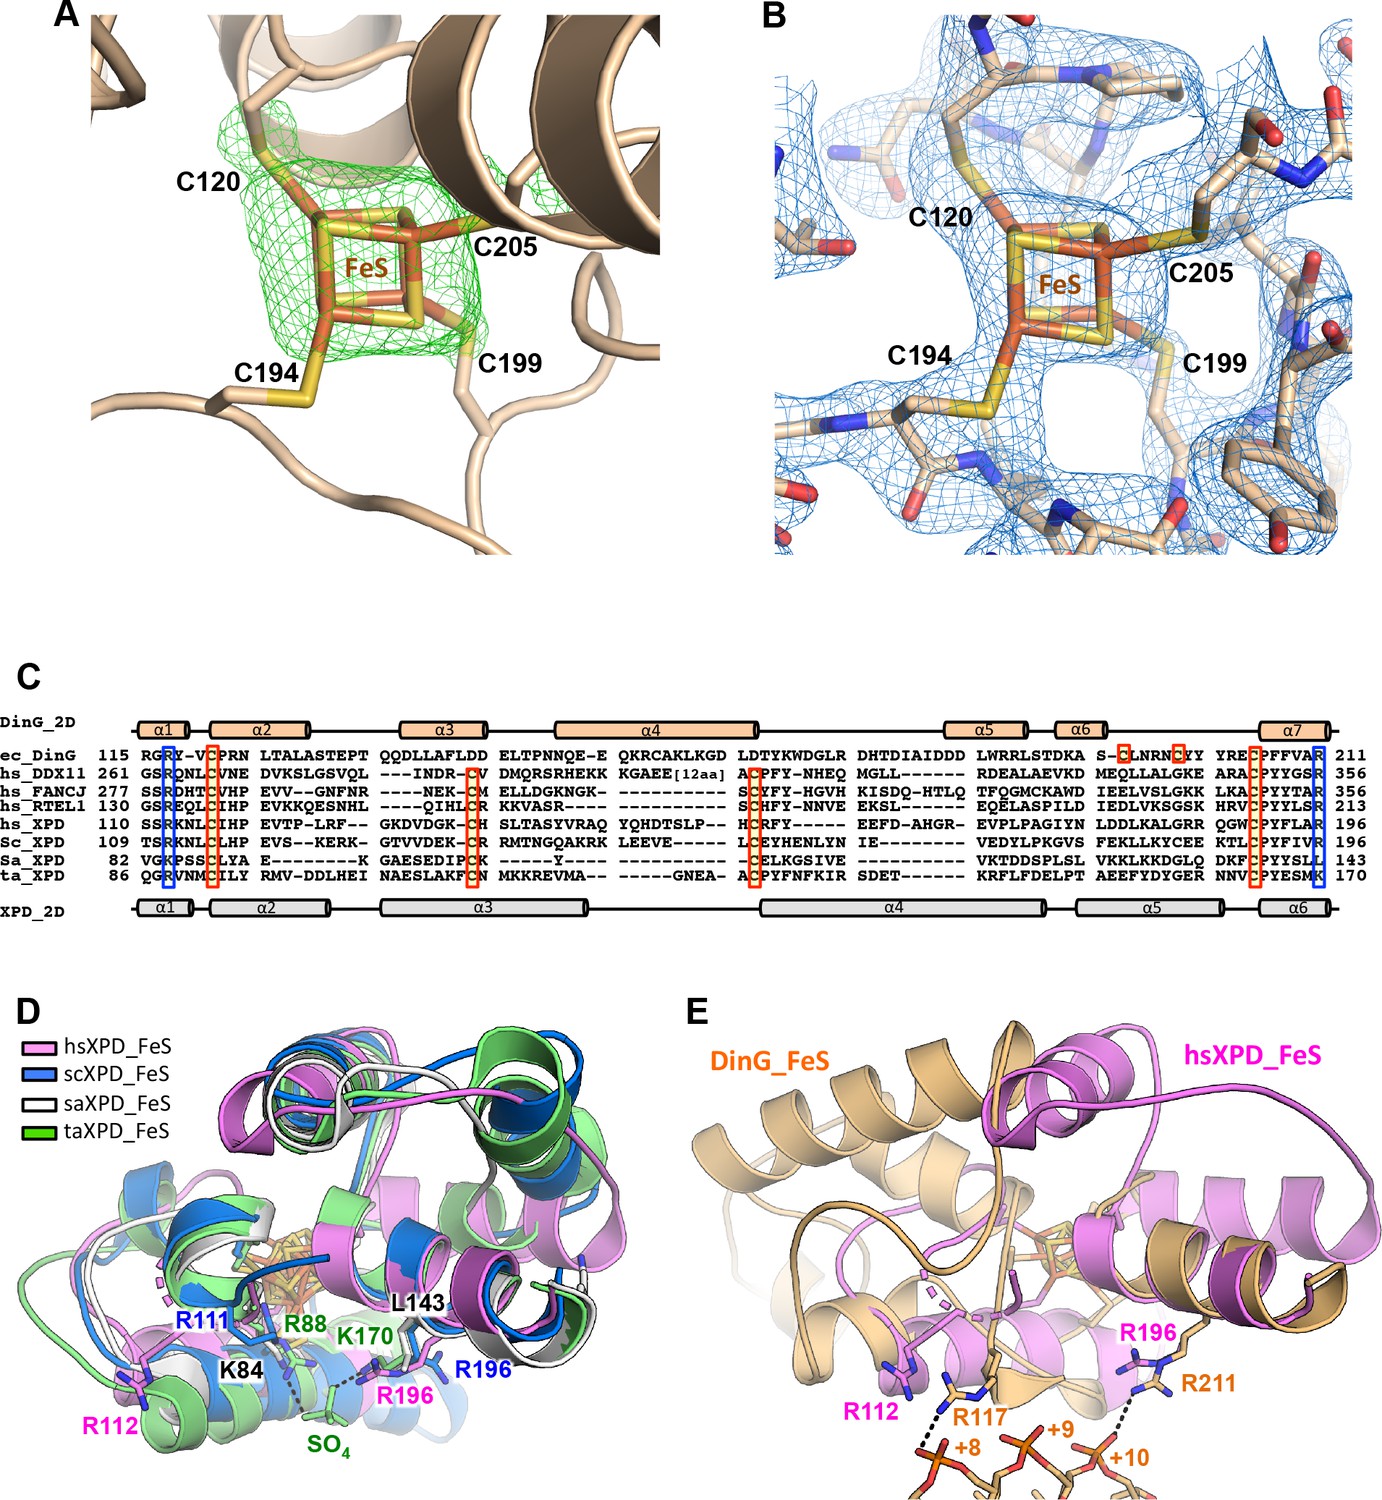
The FeS (iron-sulphur cluster) domain.
(A) Fo-Fc electron density maps for the FeS cluster. The map was calculated before inclusion of the cluster in the model, and contoured at 3σ in green mesh. (B) Simulated annealing omit density (2Fo−Fc) contoured at 1.0σ in blue mesh around the FeS cluster and the related residues. (C) Sequence alignment of the FeS cluster domain of XPD family members. (D) Superposition of FeS cluster domains of XPD enzymes. (E) Superposition of DinG and hsXPD FeS cluster domains showing the location of two arginine residues (R117 and R211) that interact with the bound ssDNA in DinG which have equivalent residues in hsXPD.
Figure 2 with 5 supplements

Details of the ssDNA-binding site.
(A) The DNA-binding site for the binary (above) and ternary (below) complexes. The side chains of residues participating in DNA binding are shown as sticks, coloured according to the domains from which they originate (HD1 in pink, HD2 in pale blue). The nucleotides of the bound ssDNA are rainbow coloured in the 5’ (red) to 3’ (blue) direction. The colour scheme for the bases is the same in all figures. (B) Cartoon representation of the same views detailing the contacts between the protein and DNA in each complex.
Figure 2—figure supplement 1
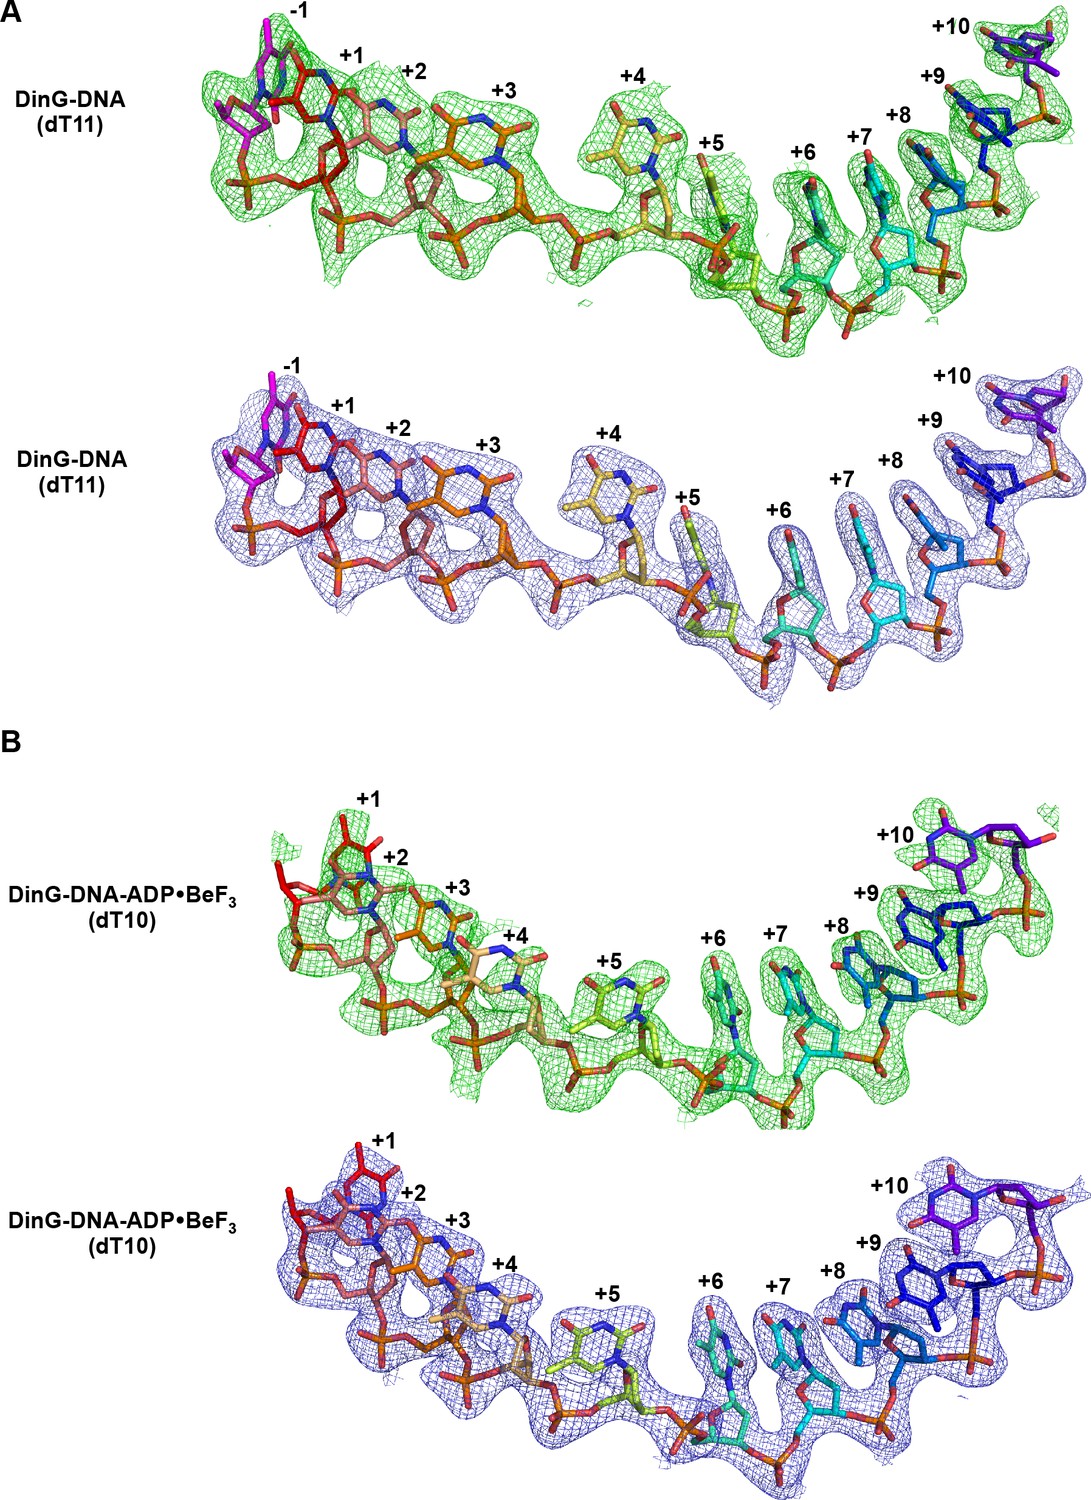
Electron density corresponding to bound ssDNA.
Electron density corresponding to bound ssDNA in binary (A) and ternary (B) complex structures. Fo-Fc electron density maps were calculated before inclusion of the ssDNA strand in the complex, contoured at 2σ and shown in green mesh. 2Fo-Fc simulated annealing composite omit electron density was calculated in Phenix, contoured at 1.0 σ and shown in blue mesh.
Figure 2—figure supplement 2
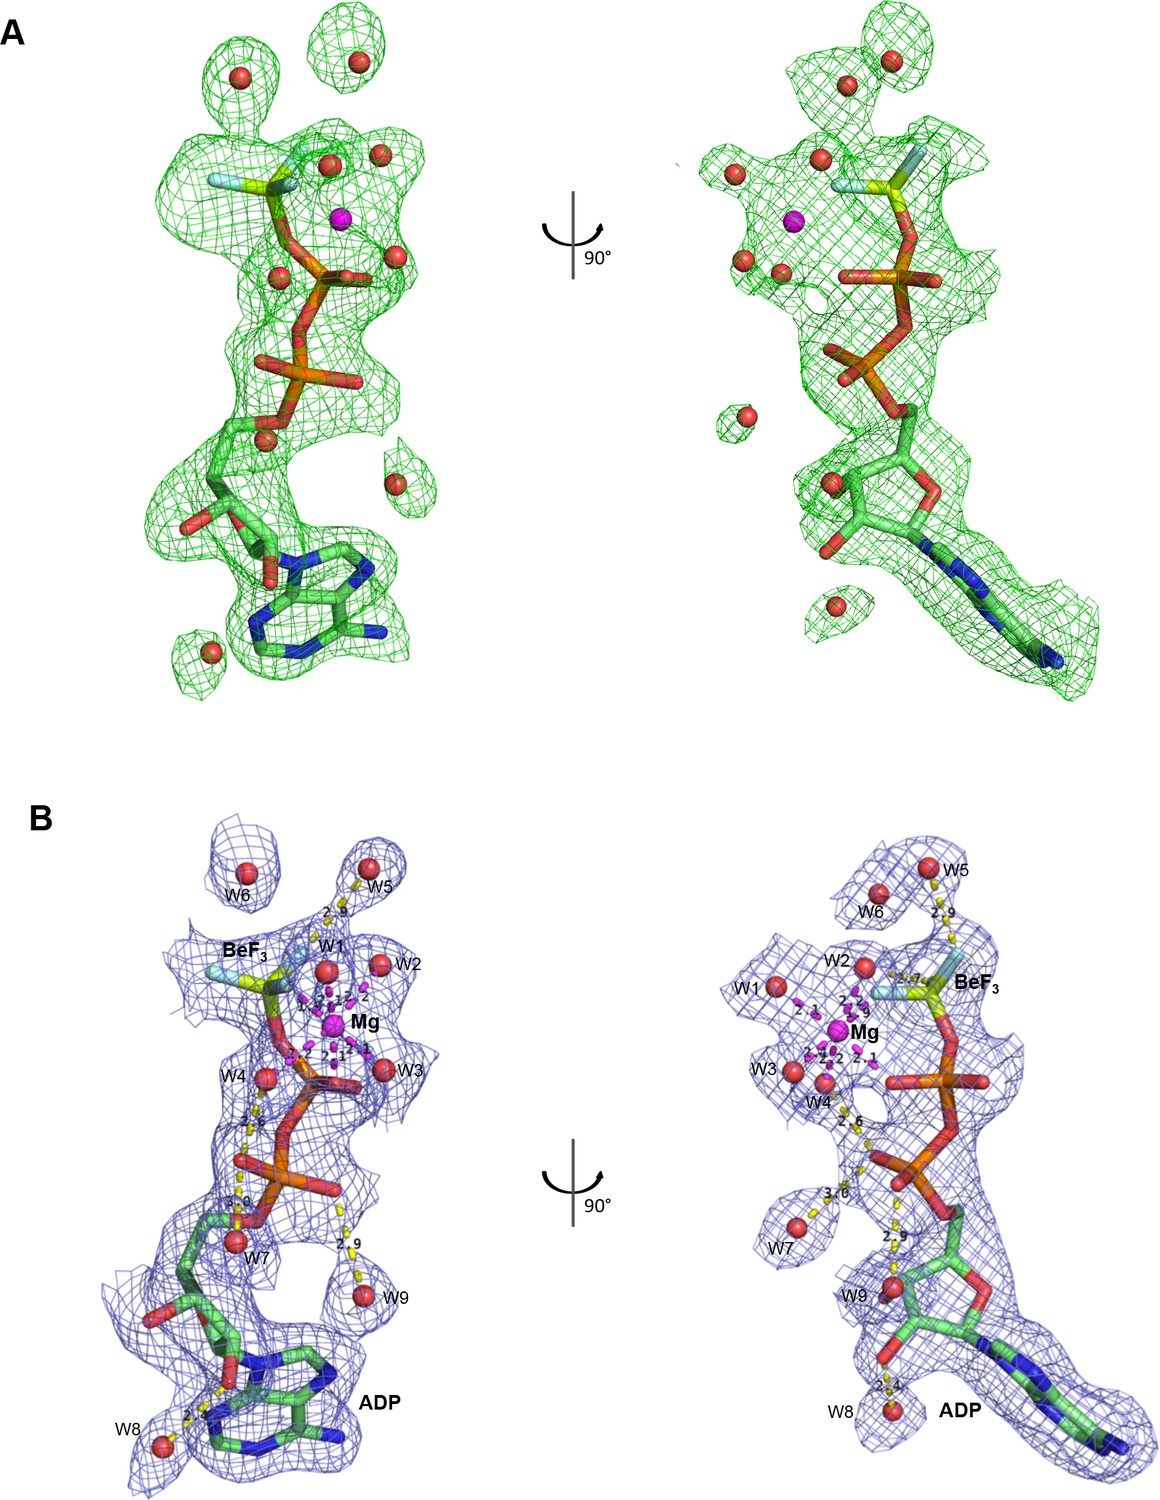
Electron density corresponding to bound nucleotide.
(A) A Fo-Fc electron density map calculated before adding ligand from the refined DinG-DNA-ADP•BeF3 structure, and is contoured at 2σ in green mesh. (B) A 2Fo-Fc simulated annealing composite omit electron density calculated in Phenix is contoured at 1.0σ around the ADP•BeF3 with water molecules in blue mesh.
Figure 2—figure supplement 3
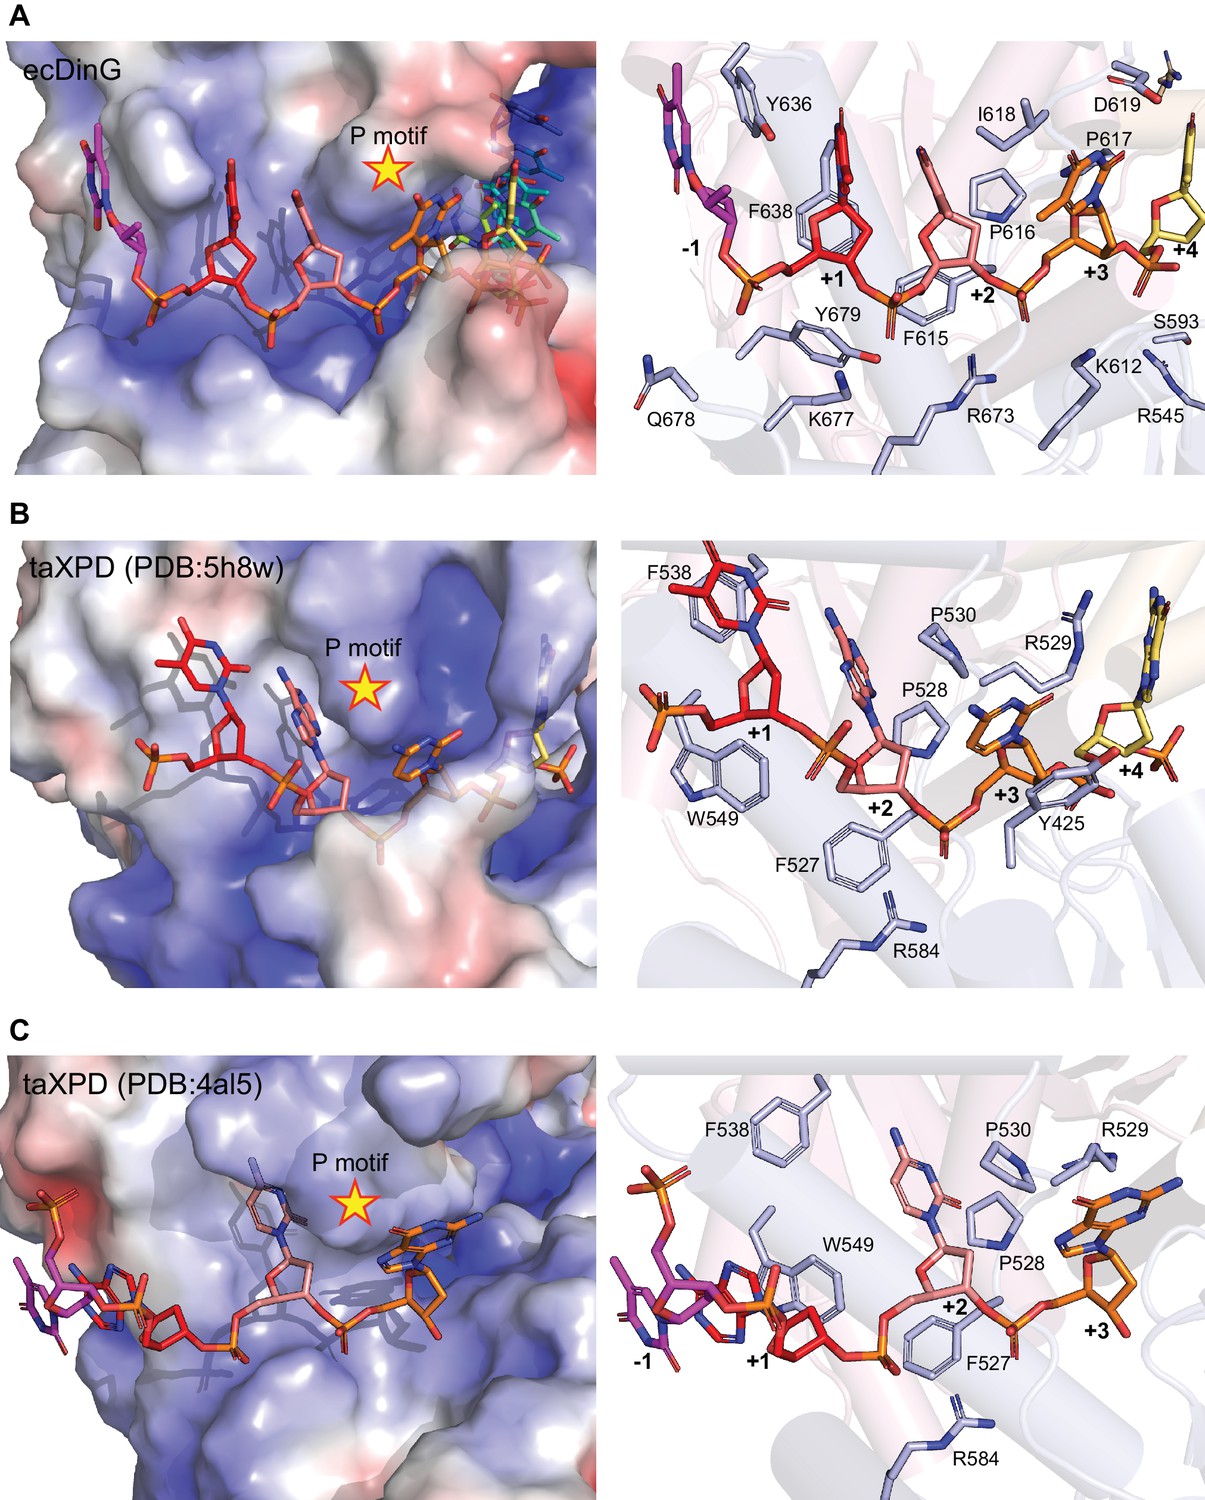
Comparison of 5’ DNA-binding in DinG and XPD.
The 5’ end of the ssDNA-binding sites are compared between (A) DinG, (B) XPD (PDB code: 5H8W) and (C) XPD (PDB code: 4AL5). Left, views of electrostatic potential of the ssDNA-binding surface. The potential was determined using the Adaptive Poisson-Boltzmann Solver (APBS) and shown as solvent excluded surface (range=±5) by PyMOL. The ssDNA strand was omitted from the calculations but is overlaid as sticks. Right, cartoon views of the binding sites. The side chains of residues involved in DNA binding and translocation are represented by sticks, and labelled with single-letter codes. Residues are coloured according to their domains (HD1: light pink, HD2: light blue) and elements. P motifs are labelled with a star.
Figure 2—figure supplement 4
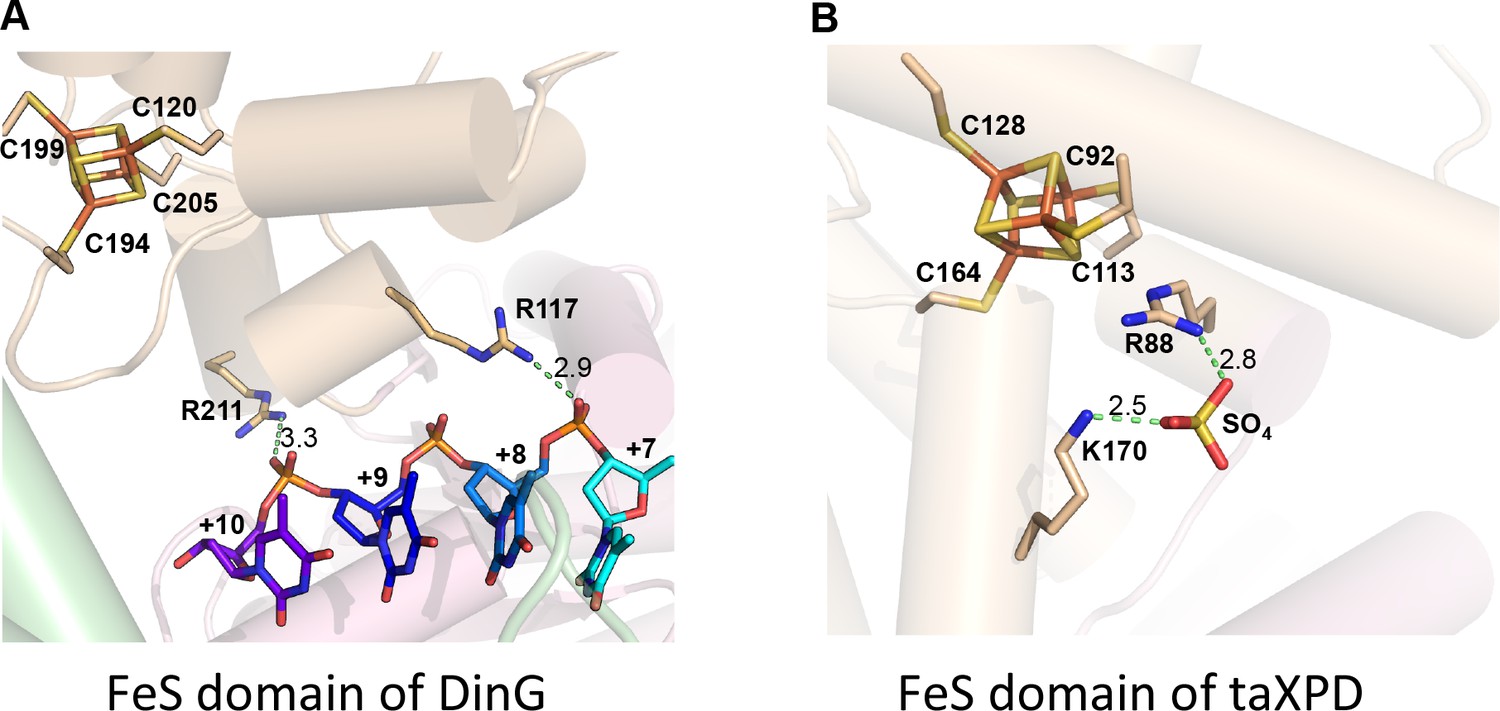
DNA binding sites on DinG and XPD FeS domain.
Comparison of (A) DinG and (B) taXPD (PDB code: 4A15) (potential) ssDNA-binding residues in FeS domain. The FeS clusters, DNA strand (in DinG), and a bound sulphate molecule (in taXPD) are shown in sticks. Key residues are labelled and interaction distances are shown.
Figure 2—figure supplement 5
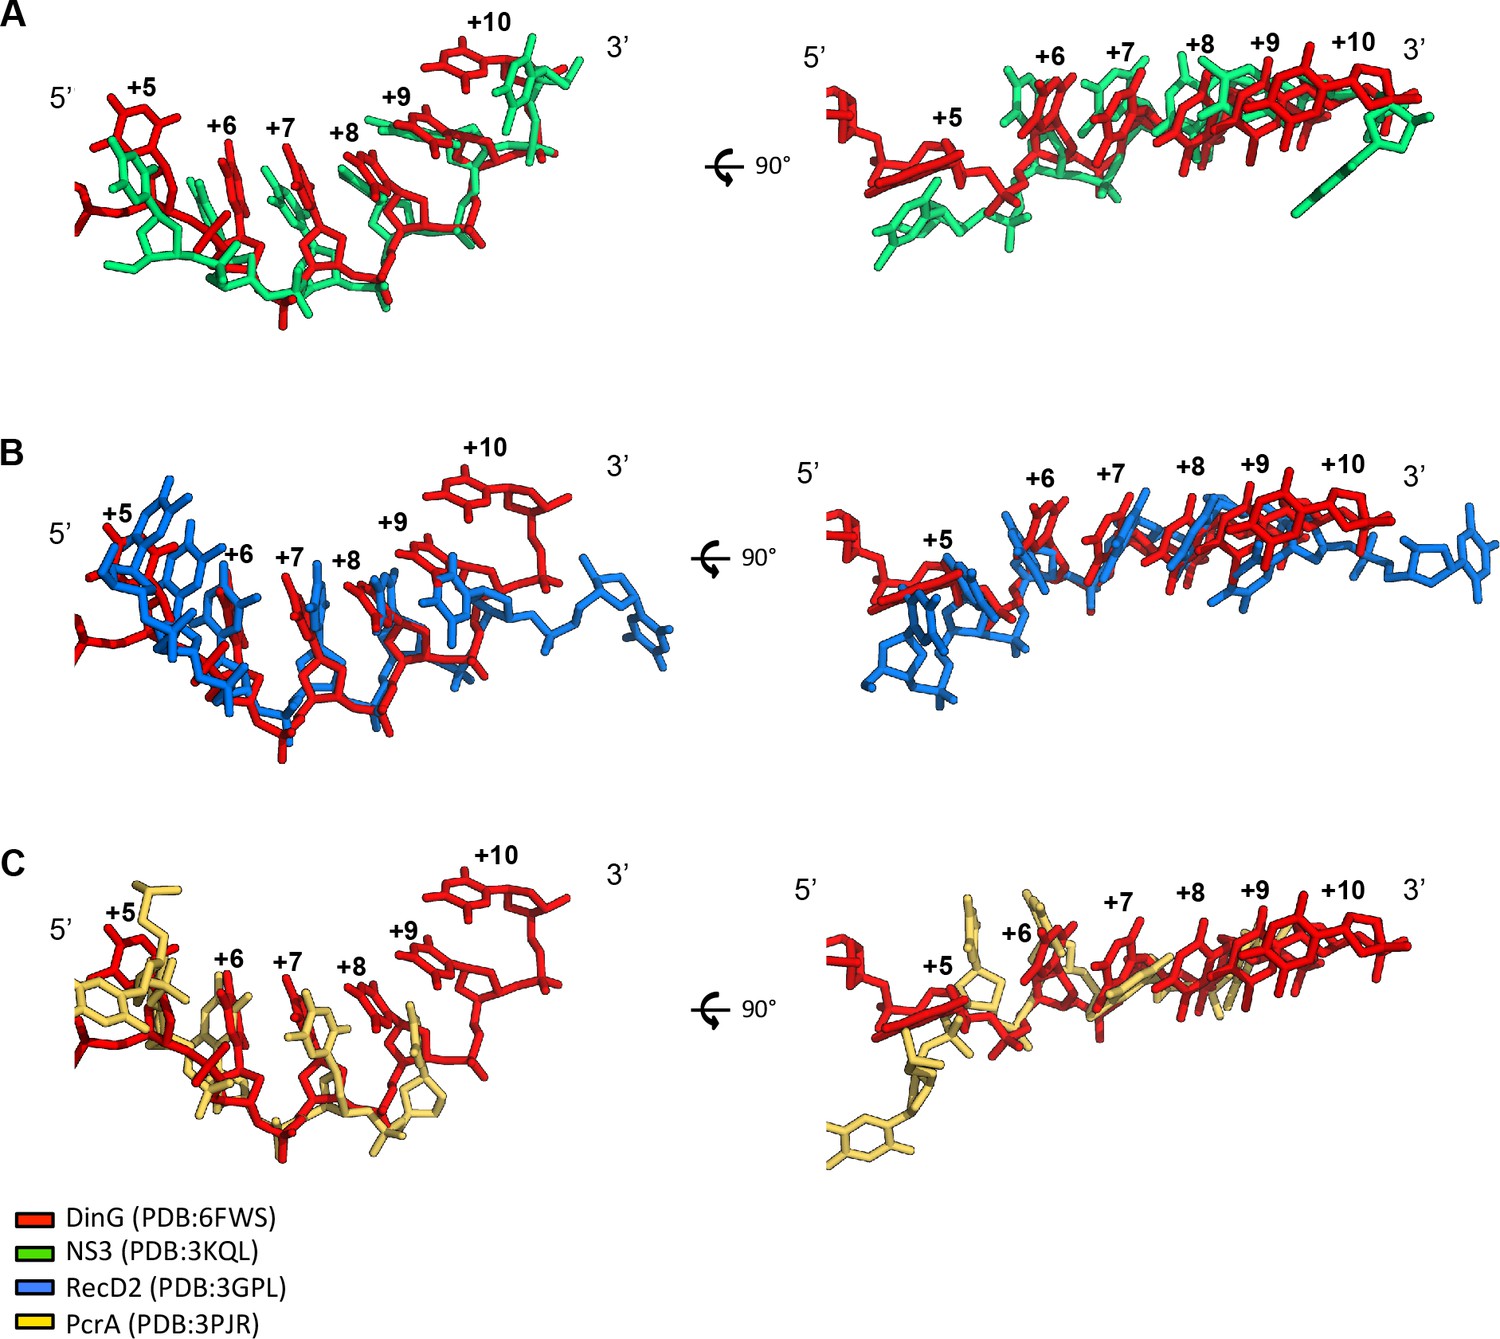
ssDNA conformation in SF1 and SF2 helicases.
The ssDNA bound to exemplar SF1 and SF2 helicases. Structures were initially superimposed based on the ATP (or analogue) bound states of the proteins. Then small manual adjustments were made to best fit the phosphodiester backbones of the ssDNA across equivalent residues. The ssDNA from the DinG ternary complex is shown in red in all panels. (A) Comparison with SF2 3’−5’ helicase NS3. The backbone is less curved and several bases are displaced compared to DinG. (B) SF1 5’−3’ helicase, RecD2. The backbone is kinked and several bases are displaced compared to DinG. (C) SF1 3’−5’ helicase PcrA. The backbone is also kinked (but differently) and several bases are displaced compared to DinG.
Figure 3 with 1 supplement

A proposed mechanism for 5’−3’ translocation.
Cartoons depicting the conformational changes and events during DNA translocation at (A) the domain level, (B) detailed interactions between the bases of the bound ssDNA with the HD1 +FeS and HD2 domains during a translocation cycle. Dotted lines shown contacts between the protein and DNA. (C) cartoon showing how the HD1 and HD2 domains alter grip on the bound ssDNA at different steps in the translocation. Further details are provided in the text.
Figure 3—figure supplement 1
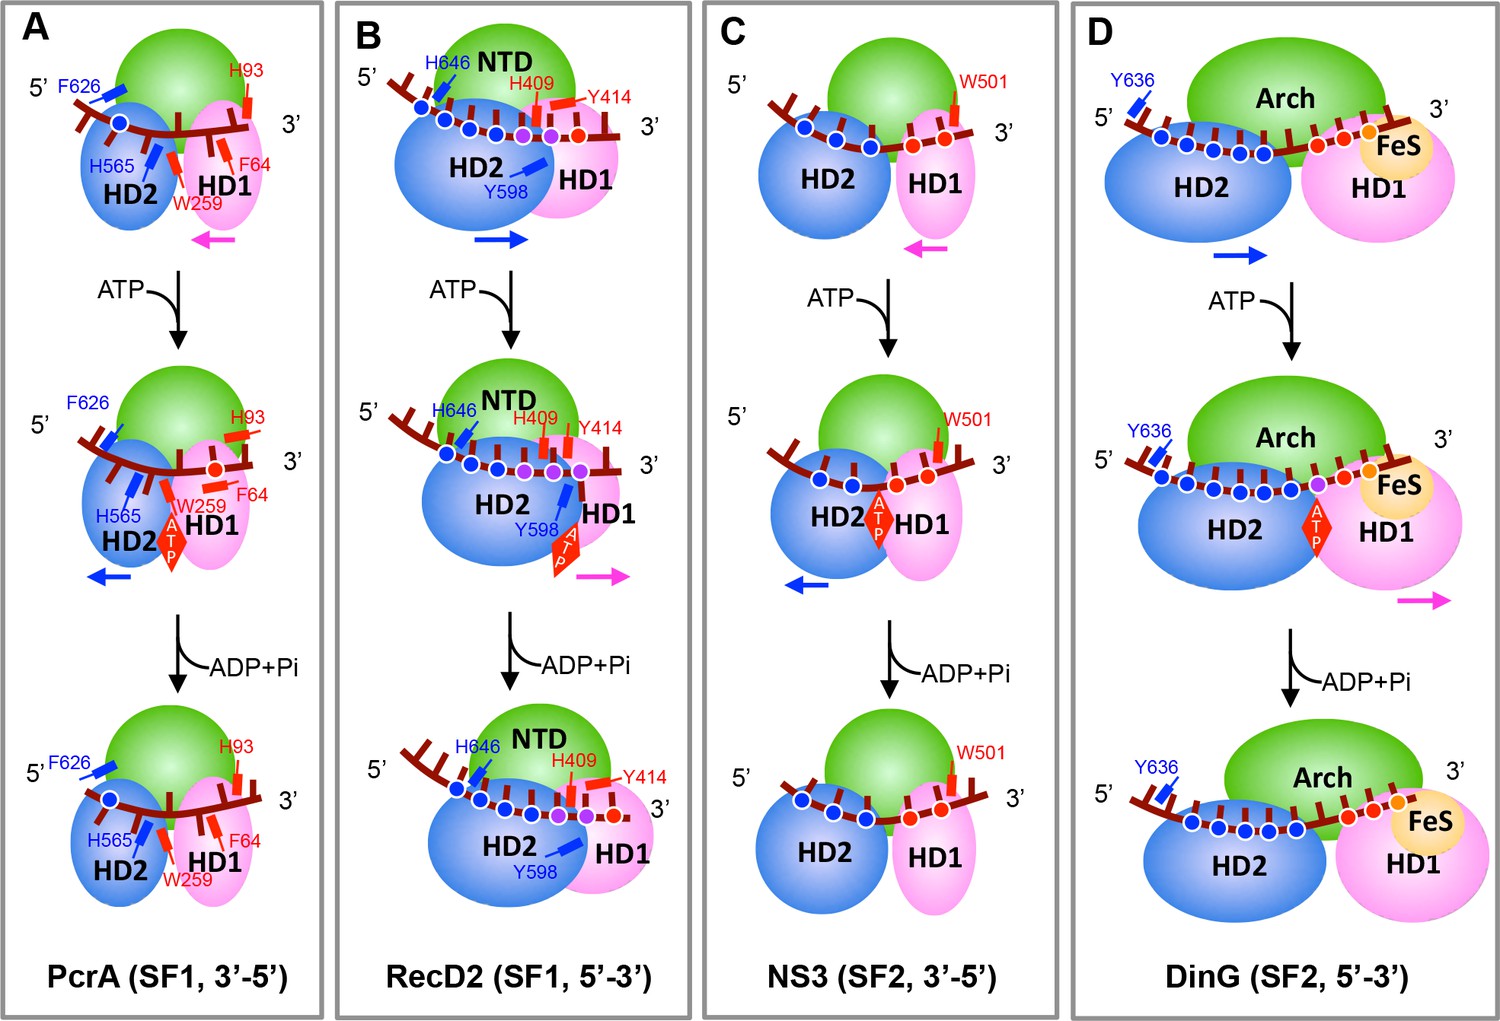
Translocation mechanisms for SF1 and SF2 helicases.
The panels highlight the features of helicase translocation for the (A) PcrA SF1 3′−5′ DNA helicase, (B) RecD2 SF1 5′−3′ DNA helicase, (C) NS3 SF2 3′−5′ DNA/RNA helicase and (D) DinG 5′−3′ SF2 DNA helicase. The red, blue, or yellow dots represent the HD1, HD2, or FeS domain interactions with the DNA backbone, respectively. The purple dots represent interactions with both the HD1 and HD2 domains. The major aromatic residues involved in stacking interactions are labelled and coloured according to domains (HD1 in red and HD2 in blue). (A) PcrA interacts mainly with DNA bases that stack in hydrophobic pockets on the enzyme surface. Prior to ATP-binding, HD2 has a tighter grip on the ssDNA than does HD1. ATP binding induces a series of conformational changes that force ssDNA to slide by one base across the surface of HD1 and involves bases flipping in and out of pockets across the surface. In the ATP-bound state, HD1 has a tighter grip than HD2 so when ATP hydrolyses and the protein relaxes, the ssDNA now slides across the surface of the HD2 domain, again involving bases flipping in and out of pockets. Details are provided in Velankar et al. (1999). (B) RecD2 interact mainly with the ssDNA backbone with the exception of a base that flips in and out of an open pocket in response to ATP binding and hydrolysis. Initially, ssDNA is bound more tightly by HD1 than HD2 so that when ATP drives domain closure, the ssDNA slides across HD2 - the reverse of PcrA so translocation is in the opposite direction. ATP hydrolysis allows domain opening and the ssDNA slides across the HD1 domain. Details are provided in Saikrishnan et al. (2009). (C) Most interactions are with the DNA backbone but two residues (W501, V432) intercalate between the bases to act as ‘bookends’ that enclose 5 bases of DNA. The ssDNA is bound more tightly by HD2 than HD1. Upon ATP binding, the HD1 and HD2 domains undergo the canonical domain closure seen in all SF1 and SF2 enzymes reducing the distance between V432 and W501, causing to a base to flip across the W501 side chain so that now just four bases are capped by these residues and the ssDNA has slid across the surface of HD1. ATP hydrolysis allows relaxation of the HD1 and HD2 domains and a base flips over V432 as the protein opens and ssDNA slides across HD2. Details are provided in Gu and Rice (2010). (D) Details are provided in this work.
Figure 4 with 1 supplement
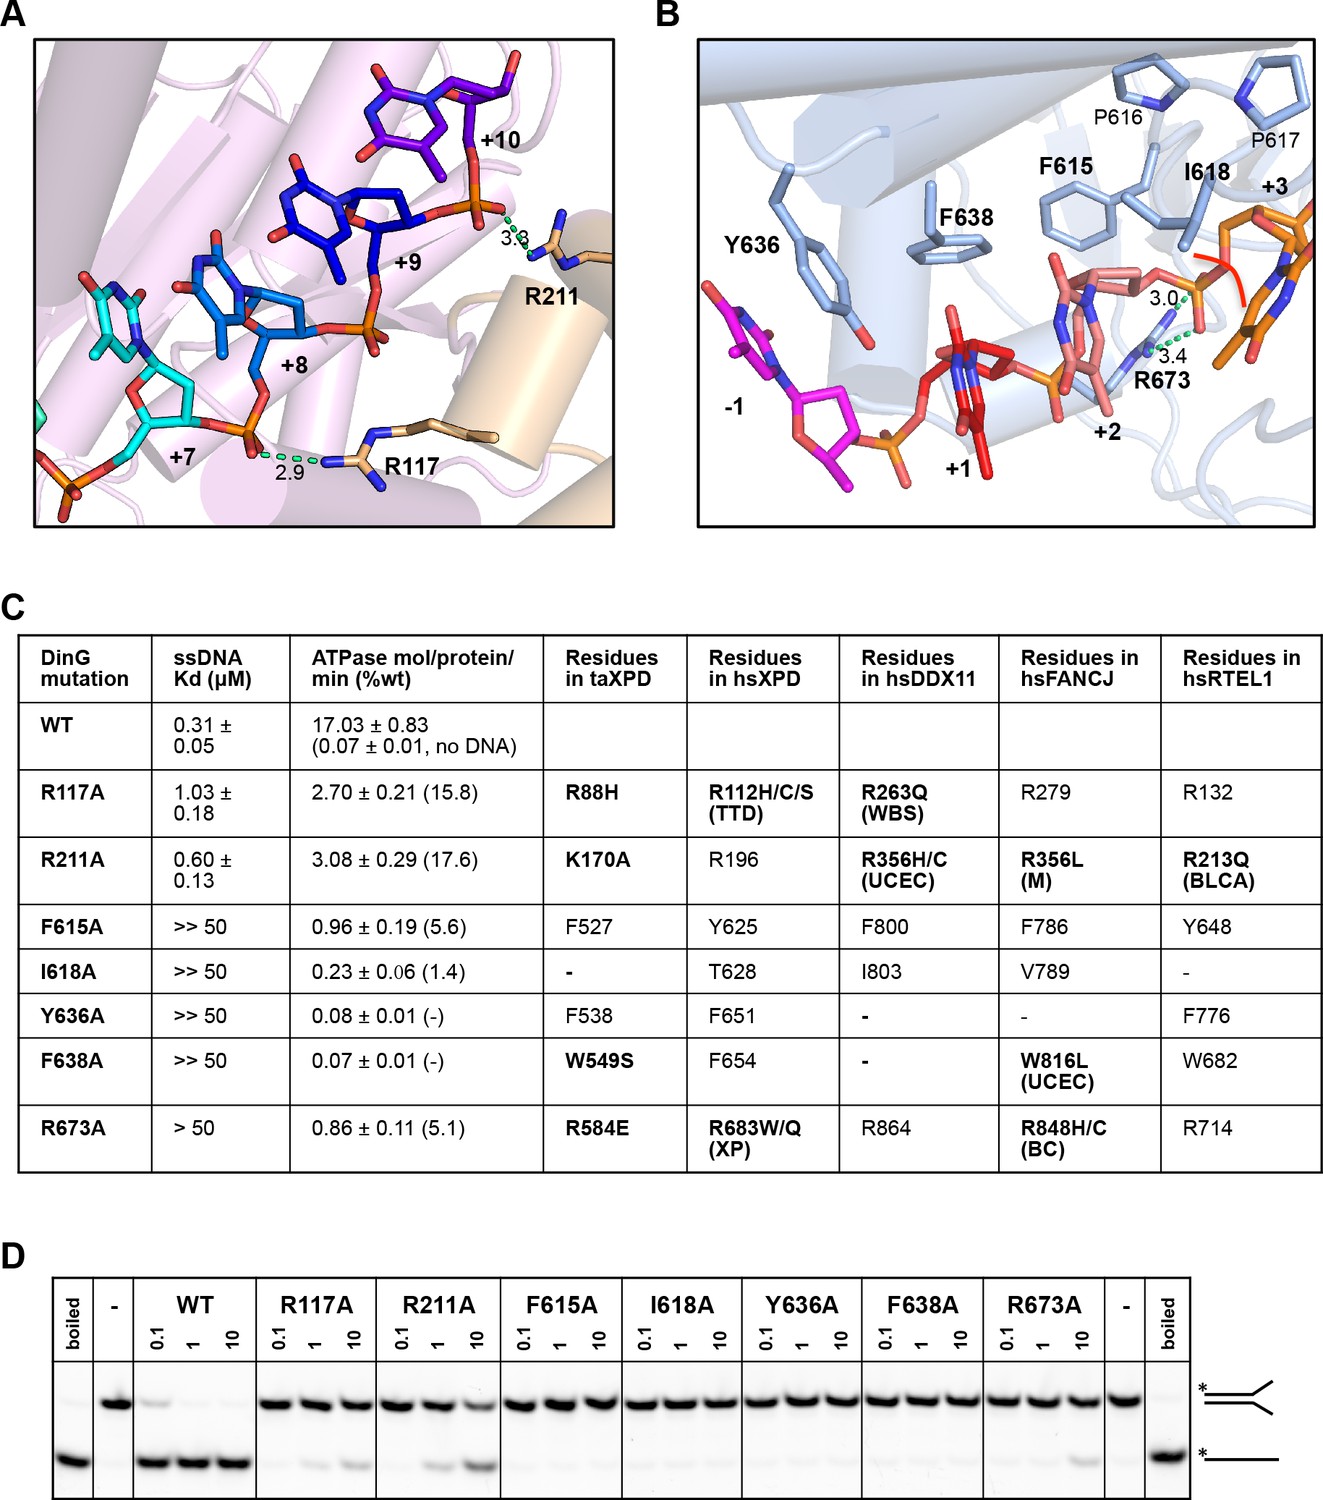
Biochemical data for mutant proteins.
Residues contacting the 3’-end (A) or the 5’-end (B) of the bound ssDNA that were mutated. (C) Table showing ssDNA binding constants and ssDNA-dependent ATPase activity for wildtype DinG and mutants. The equivalent residues in T. acidophilus XPD (taXPD), human XPD (hsXPD), human DDX11 (hsDDX11), human FANCJ (hsFANCJ) and human RTEL1 (hsRTEL1) are listed and those highlighted in bold are directly linked to human disease. Residues in bold have been found to be mutated and confirmed important for protein function or diseased related (for human XPD, DDX11, FANCJ and RTEL1, the related disease is shown in brackets, ‘TTD’, Trichothiodystrophy, ‘XP’, Xeroderma Pigmentosum, ‘WBS’, Warsaw Breakage Syndrome, ‘UCEC’, Uterine Corpus Endometrial Carcinoma, ‘M’, Mixed cancer types, ‘BC’, Breast cancer, ‘BLCA’, Bladder Urothelial Carcinoma). This information was obtained from Krassowski et al. (2018) and Cerami et al. (2012). (D) Comparison of helicase activities of wildtype and mutant DinG proteins. Forked DNA substrate (50 nM) was incubated at various concentrations (0.1, 1 and 10 μM) of enzyme and the products were analysed on 12% native-PAGE. Heat-denatured substrate was run as a positive control.
Figure 4—figure supplement 1
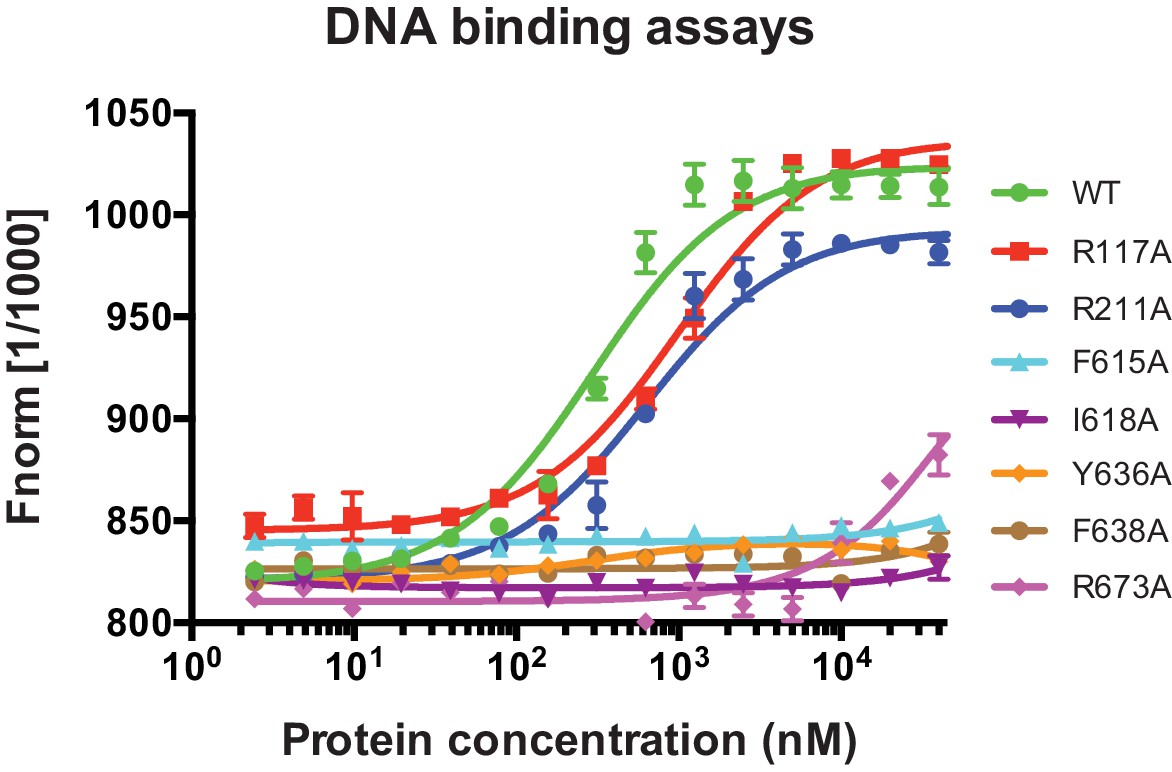
ssDNA-binding data for DinG mutants.
The raw data curve from MST assays used for Kd determinations. 10 nM ssDNA was incubated with various concentrations (0 ~ 40000 nM) of wild type or mutant DinG.
Figure 5 with 1 supplement
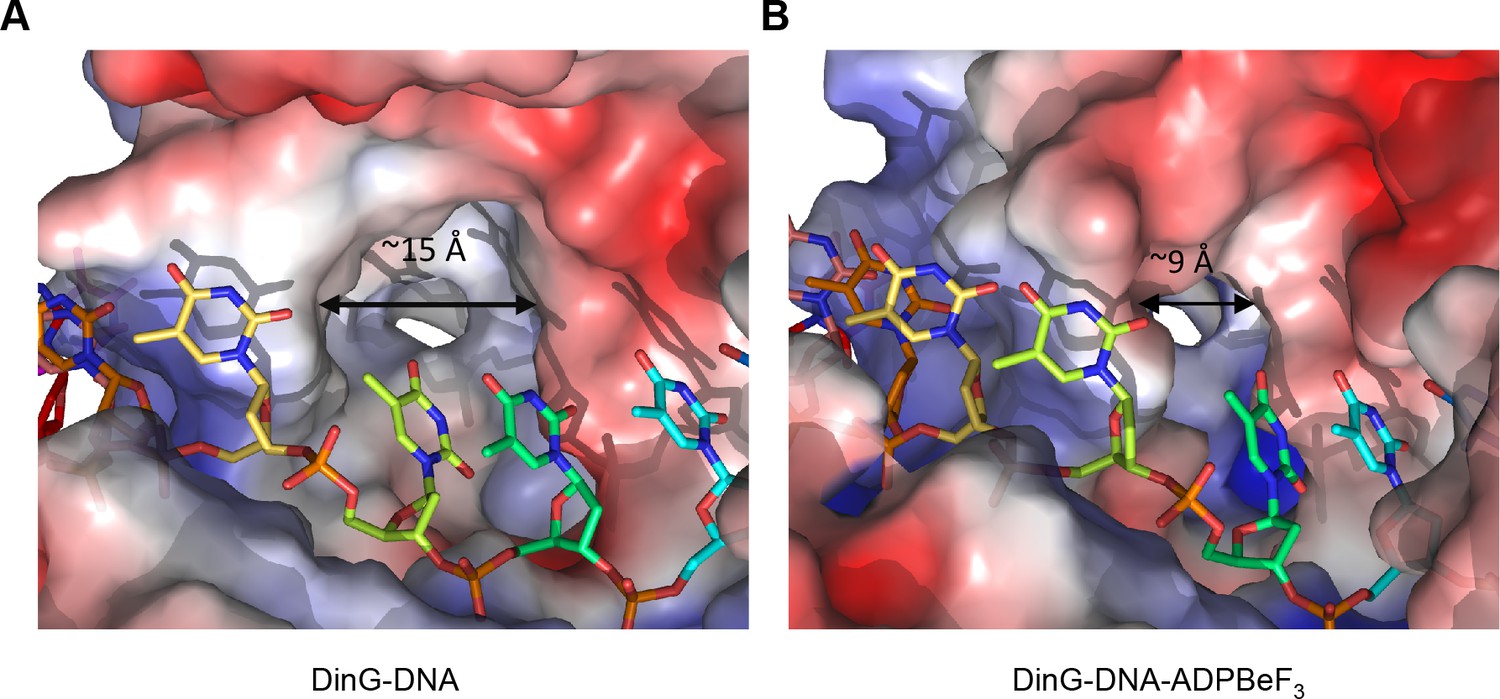
A pocket underneath the ssDNA binding site.
The molecular surface of (A) the binary complex and (B) the ternary complex, coloured by electrostatic charge (negative in red, positive in blue). In the binary complex, a large hydrophobic pocket is present between the ATPase domains, beneath the ssDNA binding site that becomes restricted when ATP binds to the enzyme. The open pocket in the binary complex could accommodate much larger DNA lesions (e.g. cyclopyrimidine dimers) that could not be accommodated in the ternary complex, suggesting that binding of large lesions in this pocket would prevent ATP-induced conformational changes and thereby block translocation. Protein contact potential was calculated in PyMOL and shown as a surface with negative potential coloured in red and positive in blue. The ssDNA strand was omitted from the calculations but is overlaid as sticks.
Figure 5—figure supplement 1
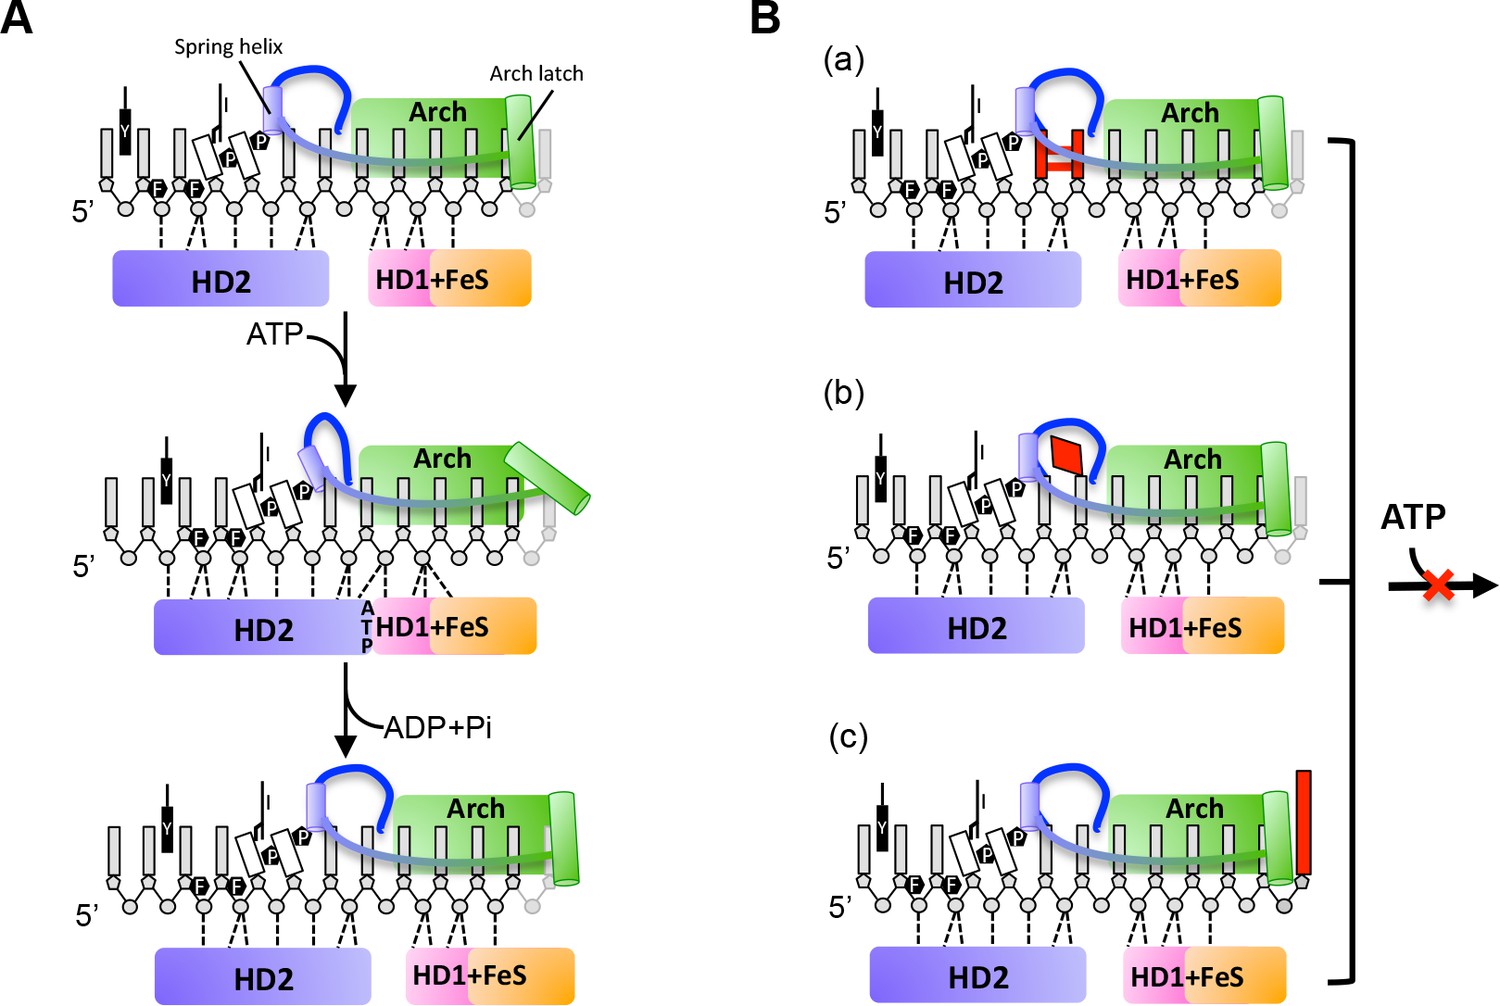
A proposed mechanism for 5’−3’ translocation and potential DNA lesion checkpoints.
(A) 5’−3’ translocation mechanism. Cartoons depict the detailed interactions between the bases of the bound ssDNA with the HD1 +FeS and HD2 domains during a translocation cycle. (B) Three possible DNA lesion checkpoints. a, cross-linked bases such as CPD can be blocked by P motif and hence stop the translocation. b, Some damaged DNA bases can be recognized and bound by a hydrophobic pocket, and block the protein translocation. c, FeS cluster join in DNA bulky recognition and large DNA bulky can be directly blocked outside of the DNA entrance. Further details are provided in the text.
Videos
Video 1
Conformational changes associated with ATP binding.
A morph between the two structures showing how ssDNA is translocated across the surface of the protein in response to ATP binding.
Tables
Table 1
Statistics from crystallographic analysis.
https://doi.org/10.7554/eLife.42400.012| Complex | Se-DinG-DNA | DinG-DNA | DinG-DNA-ADPBeF3 | |
|---|---|---|---|---|
| PDB ID | - | - | 6FWR | 6FWS |
| Data collection | ||||
| Source | I04 | I04 | I04-1 | |
| Wavelength (Å) | 0.9795 (peak) | 0.9860 (remote) | 0.9795 | 0.9159 |
| Resolution (Å) | 59–2.6 (2.64–2.6) | 56.2–3.4 (3.46–3.4) | 79.59–2.5 (2.54–2.5) | 63.37–2.5 (2.54–2.5) |
| Space group | P21212 | P21212 | P21212 | P212121 |
| Cell dimensions: a, b, c | 99.11, 134.47, 59 | 99.11, 134.47, 59 | 98.97, 133.87, 58.86 | 109.77, 119.75, 126.74 |
| Obeservation | 274170 (12271) | 124833 (6193) | 166828 (8129) | 266197 (13044) |
| Unique reflections | 24842 (1169) | 11591 (559) | 27857 (1351) | 58152 (2827) |
| Rmerge (%) | 12.3 (51.7) | 15.5 (43.7) | 10.9 (50.3) | 11.9 (54.1) |
| I/σI | 25.8 (4.7) | 13.7 (4.9) | 12.3 (3.3) | 9.6 (2.6) |
| Completeness (%) | 99.2 (95.3) | 99.5 (96.7) | 100 (98) | 99.5 (98) |
| Redundancy | 11 | 10.8 | 6.0 | 4.6 |
| Refinement statistics | ||||
| Resolution (Å) | - | - | 79.95–2.5 (2.54–2.5) | 63.37–2.5 (2.54–2.5) |
| Rfactor (%)/Rfree (%) | - | - | 21.08/24.57 | 21.91/25.57 |
| rmsd bonds (Å)/angles (°) | - | - | 0.008/1.134 | 0.008/1.080 |
| Ramachandran plot: Favored (%) | - | - | 97.4 | 96.2 |
-
The numbers in parentheses refer to the last shell.
Rfactor = Σ||F(obs)- F(calc)||/Σ|F(obs)|.
-
Rfree = R factor calculated using 5.0% of the reflection data randomly chosen and omitted from the start of refinement.
Key resources table
| Reagent type (species) or resource | Designation | Source or reference | Identifiers | Additional information |
|---|---|---|---|---|
| Gene (E. Coli, strain K12) | DinG | NA | NCBI-GeneID: 945431 | |
| Strain, strain background (E. coli BL21 (DE3)) | E. coli BL21 (DE3) | NEB | C2527H | |
| Recombinant DNA reagent | Plasmid pET28-HMT -DinG (encoding full length E.coli DinG, fused with N-terminal 6 × His tag, MBP-tag and a TEV protease recognition site) | This study | ||
| Commercial assay or kit | QuikChangeTM Site-Directed Mutagenesis Kit | Stratagene, La Jolla, CA | La Jolla, CA | |
| Chemical compound, drug | PEG4000 | sigma | ||
| Chemical compound, drug | PEG3350 | sigma | ||
| Chemical compound, drug | BeCl3 | sigma | ||
| Chemical compound, drug | phosphoenolpyruvate | sigma | ||
| Chemical compound, drug | pyruvate kinase | sigma | ||
| Chemical compound, drug | lactate dehydrogenase | sigma | ||
| Chemical compound, drug | ATP | sigma | ||
| Chemical compound, drug | ADP | sigma | ||
| Software, algorithm | COOT | (Emsley et al., 2010) | https://www2.mrc-lmb.cam.ac.uk/personal/pemsley/coot/ | |
| Software, algorithm | Phenix | (Adams et al., 2010) | https://www.phenix-online.org/documentation/reference/real_space_refine.html | |
| Software, algorithm | Refmac | (Murshudov et al., 1997) | NA | |
| Software, algorithm | Xia2 | (Winter et al., 2013) | NA | |
| Software, algorithm | PyMOL | Schrodinger, LLC | https://pymol.org/2/ | |
| Software, algorithm | NT Analysis software (NanoTemper) | NA | https://nanotempertech.com/monolith/ |
Additional files
-
Supplementary file 1
Primers used for cloning and mutagenesis.
- https://doi.org/10.7554/eLife.42400.020
-
Transparent reporting form
- https://doi.org/10.7554/eLife.42400.021
Download links
A two-part list of links to download the article, or parts of the article, in various formats.
Downloads (link to download the article as PDF)
Open citations (links to open the citations from this article in various online reference manager services)
Cite this article (links to download the citations from this article in formats compatible with various reference manager tools)
DNA translocation mechanism of an XPD family helicase
eLife 7:e42400.
https://doi.org/10.7554/eLife.42400


