Respiratory syncytial virus co-opts host mitochondrial function to favour infectious virus production
- University of Melbourne, Australia
- Monash University, Australia
- University of Canberra, Australia
- Baker Heart and Diabetes Institute, Australia
- The University of Sydney, Australia
- La Trobe University, Australia
- University of Newcastle, Australia
Figures
Figure 1 with 6 supplements
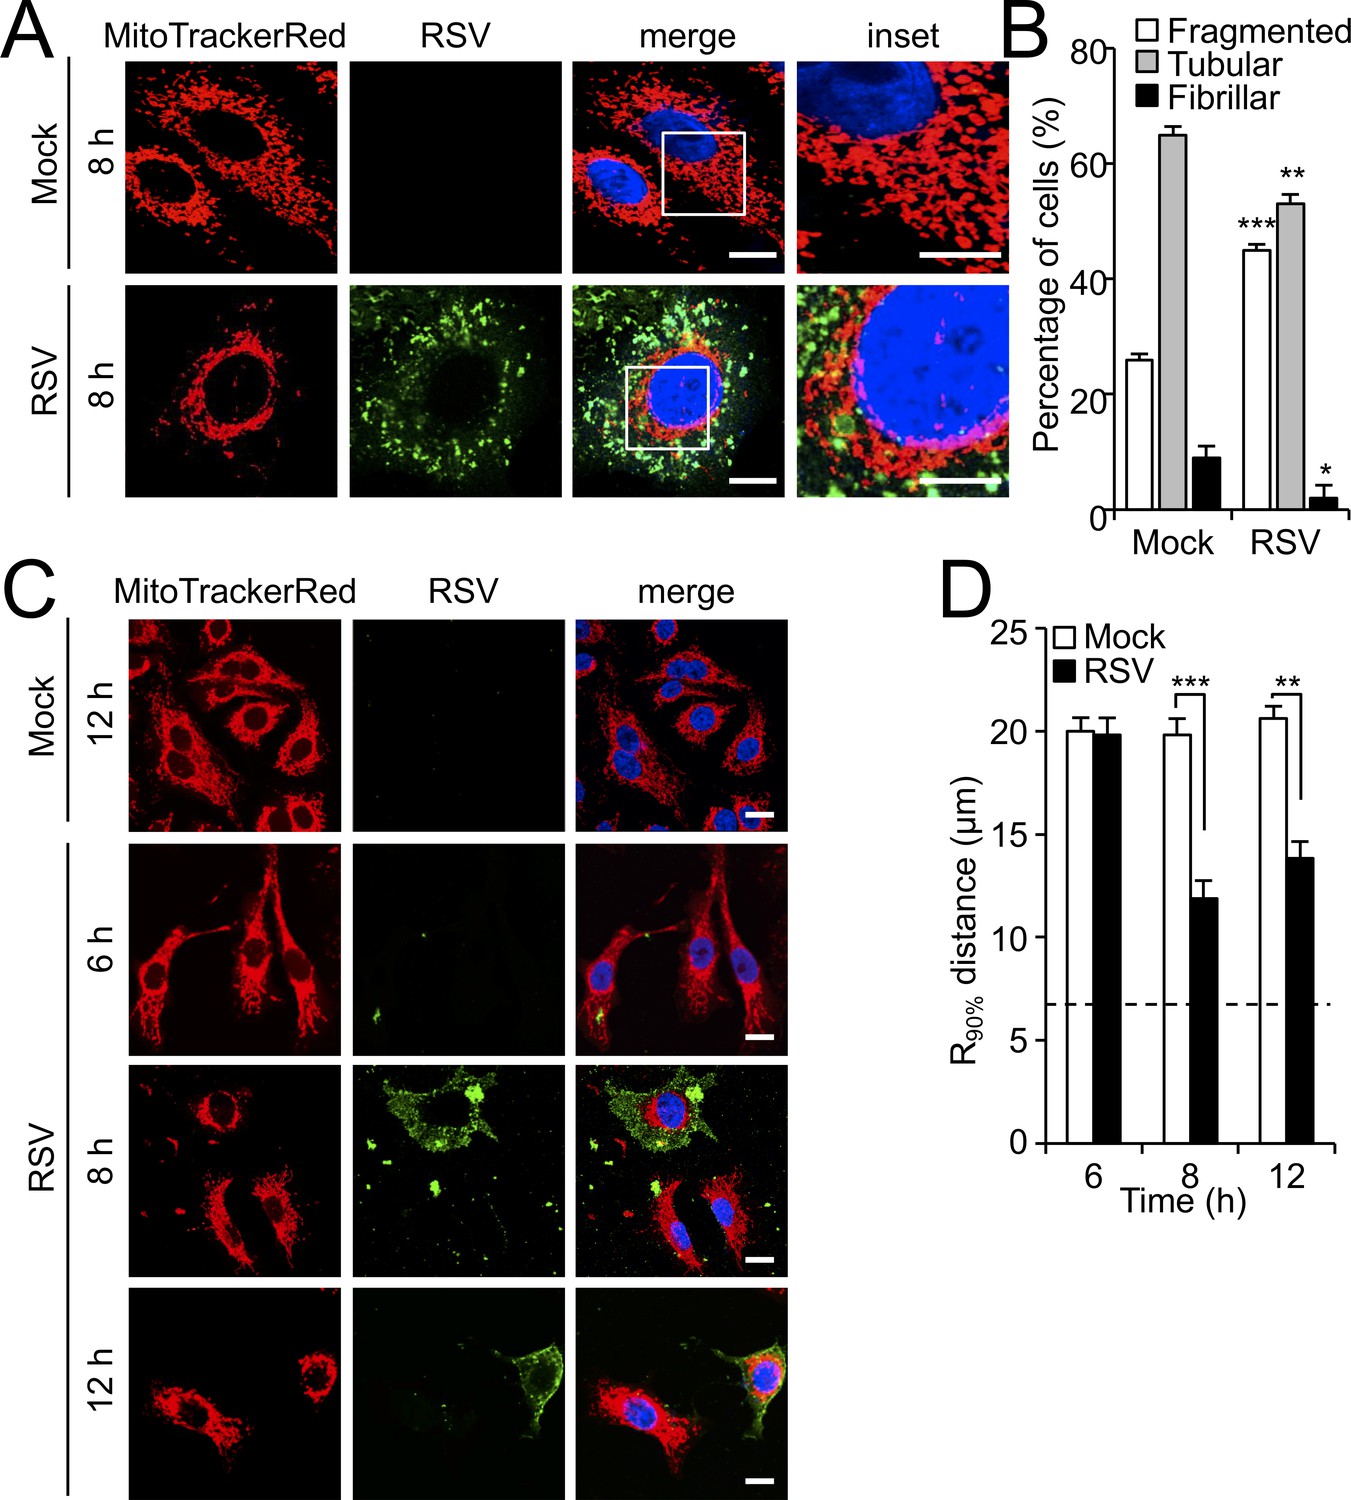
RSV infection induces mitochondrial perinuclear clustering early in infection.
A549 cells were mock- or RSV-infected (MOI 1) for the times indicated, followed by staining for mitochondria (MitoTrackerRed), RSV infection (RSV antibody, green) and nuclei (DAPI, blue). (A) Cells were imaged by Airyscan super-resolution CLSM. Merge panels overlay all three stains; inset (right panels) corresponds to the boxed regions. Scale bar = 5 µm. (B) Quantification of mitochondrial morphologies following RSV infection. Cells with predominantly fragmented, tubular or fibrillar mitochondrial morphologies, defined by width/length ratios of 1:1, 1:3 and 1:10 respectively (Hu et al., 2013) were scored by assessing 25–30 cells per condition on three independent occasions. Data represent the mean ± SEM; ***p<0.001, **p<0.01, *p<0.05 relative to the mock. (C and D) Cells were imaged by CLSM. (C) Merge panels overlay all three stains. Scale bar = 10 µm. (D) Perinuclear radial distribution of mitochondria (R90%; see Materials and methods) was calculated from images such as those in C). Results represent the mean ± SEM for n = 3 independent experiments, each of which analysed 25–30 cells per sample; ***p<0.001, **p<0.01. The dashed line represents the average nuclear radius.
Figure 1—figure supplement 1
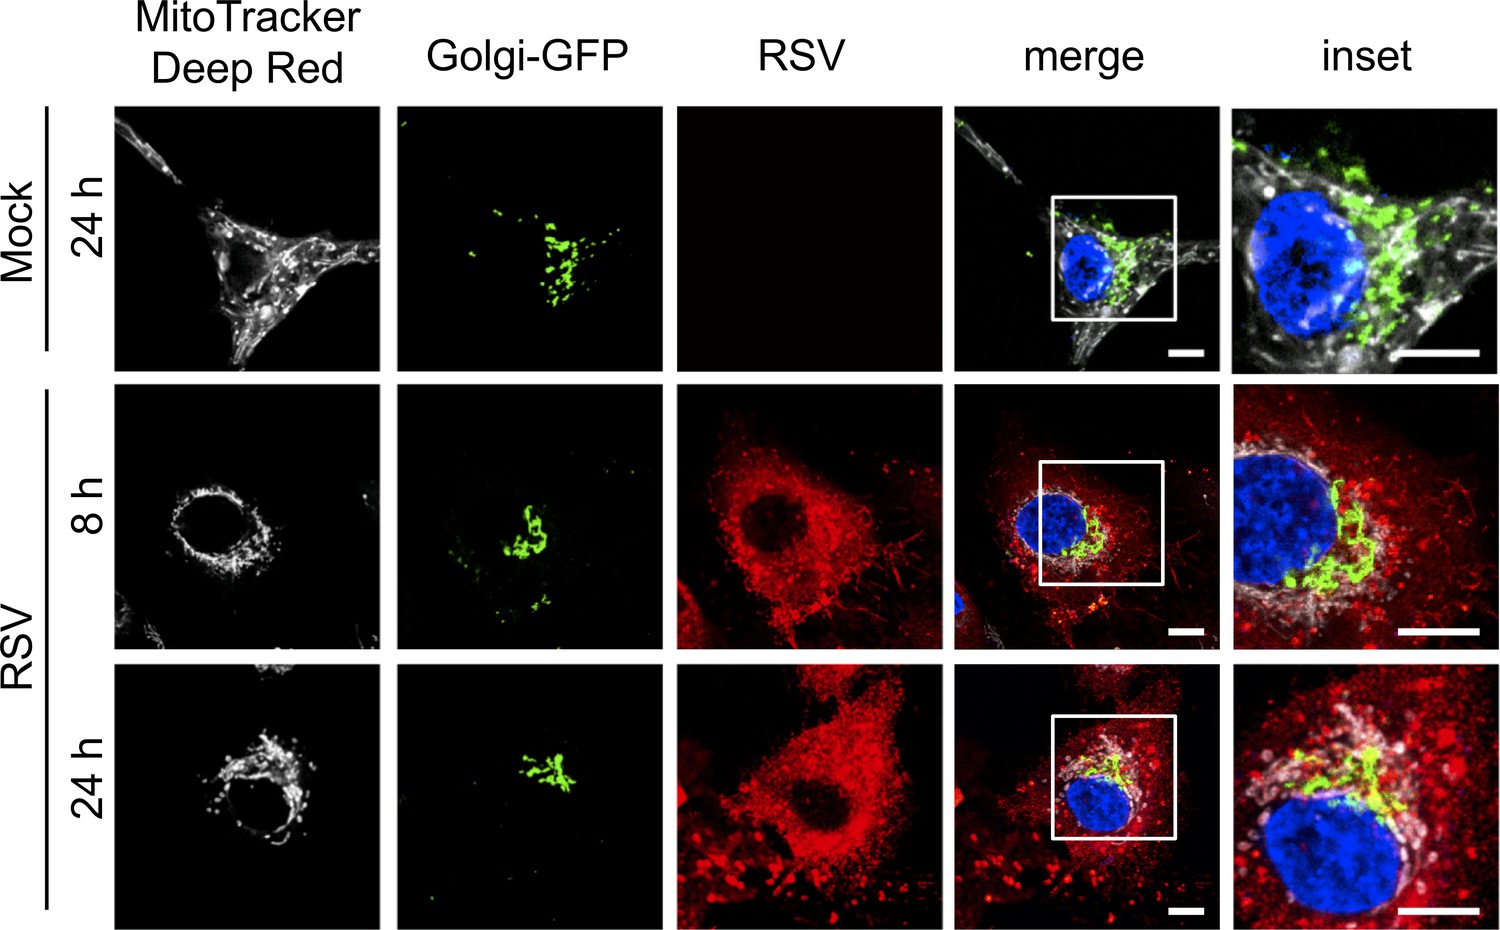
Lack of impact of RSV infection on the Golgi apparatus.
A549 cells were transfected for 24 hr with the baculovirus-based CellLight Golgi-GFP *BacMam 2.0* expressing a GFP-tagged N-acetylagalactosaminyltransferase two specific for the Golgi apparatus (Green), and then mock- or RSV-infected (MOI 3) for the times indicated, followed by staining for mitochondria (MitoTracker Deep Red, white), RSV infection (RSV antibody, red) and nuclei (DAPI, blue). Cells were imaged by CLSM. Merge panels overlay all four stains; inset (right panels) corresponds to the boxed regions. Images are representative of 3 independent experiments. Scale bar = 5 µm.
Figure 1—figure supplement 2
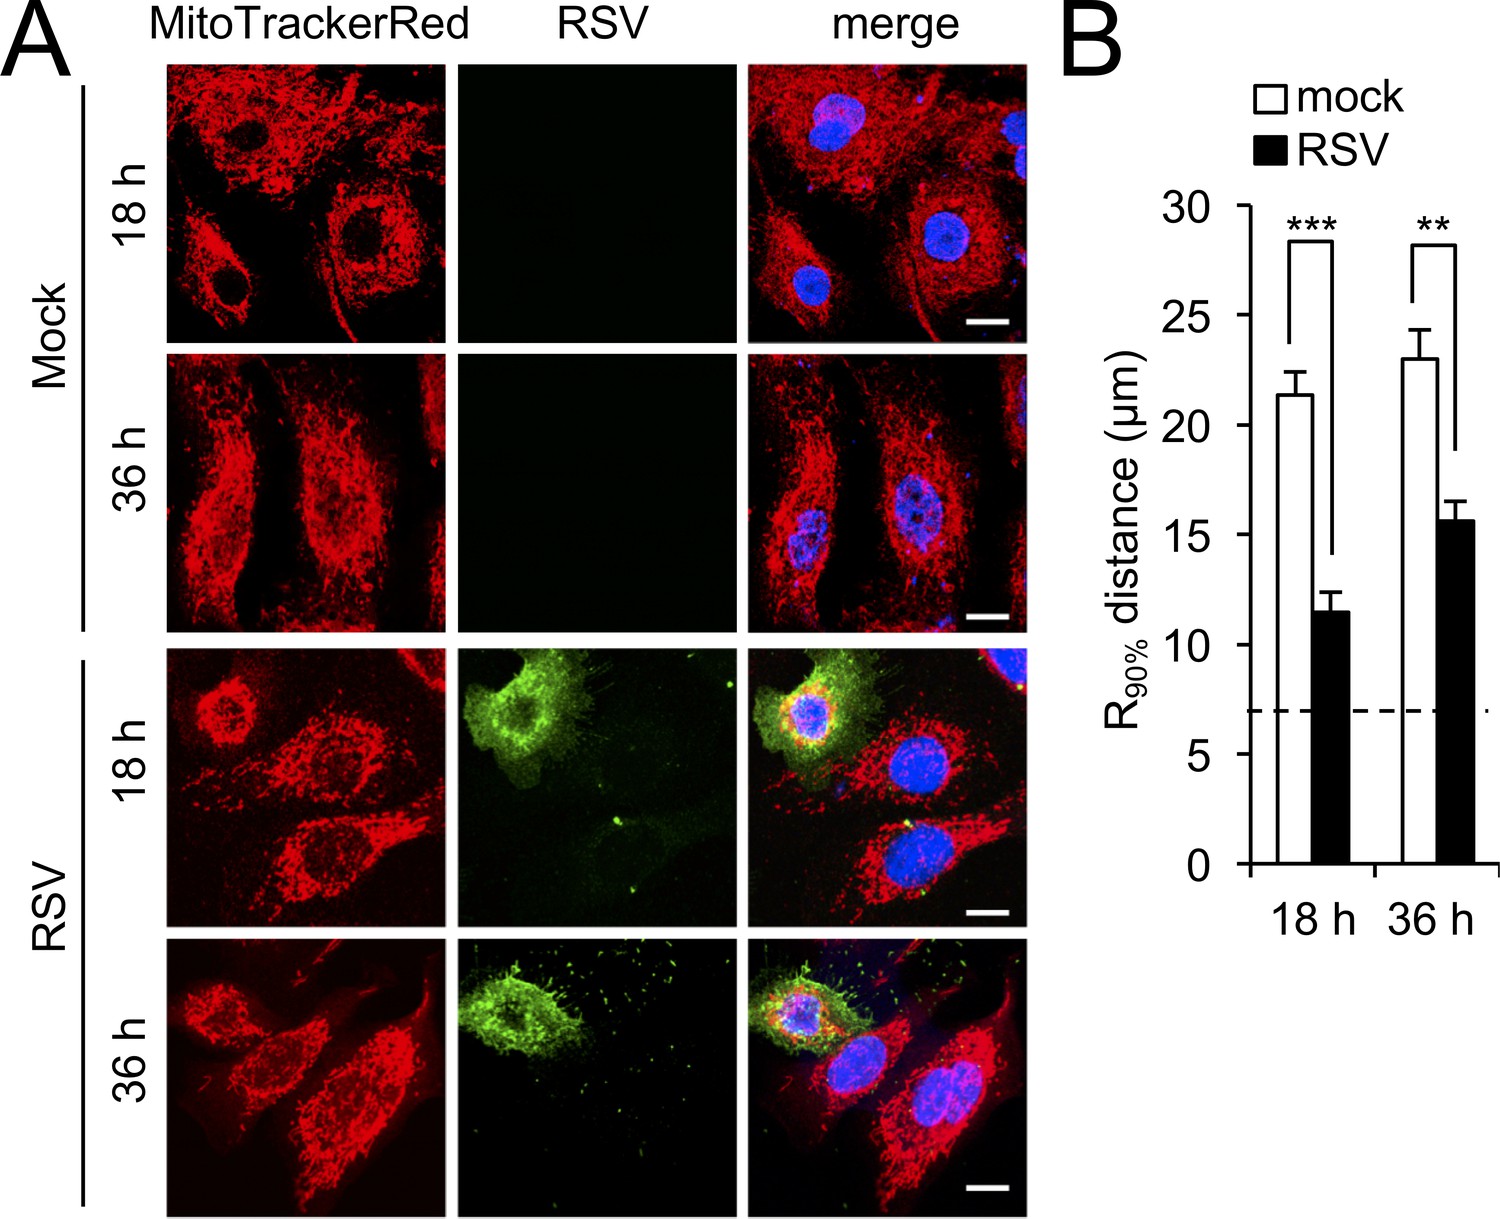
RSV infection induces mitochondrial perinuclear clustering in immortalised human airway progenitor-like basal cells.
BCi-NS1 (Walters et al., 2013) were mock- or RSV-infected (MOI 1) for the times indicated, followed by staining for mitochondria (MitoTrackerRed), RSV infection (RSV antibody, green), and nuclei (DAPI, blue). (A) Cells were imaged by CLSM. Merge panels overlay all four stains. Scale bar = 10 µm. (B) Perinuclear radial distribution of mitochondria (R90%; see Materials and methods) was calculated from images such as those in A. Results represent the mean + SEM for n = 3 independent experiments, each of which analysed 25–30 cells per sample; ***p<0.001, **p<0.01. The dashed line represents the average nuclear radius.
Figure 1—figure supplement 3
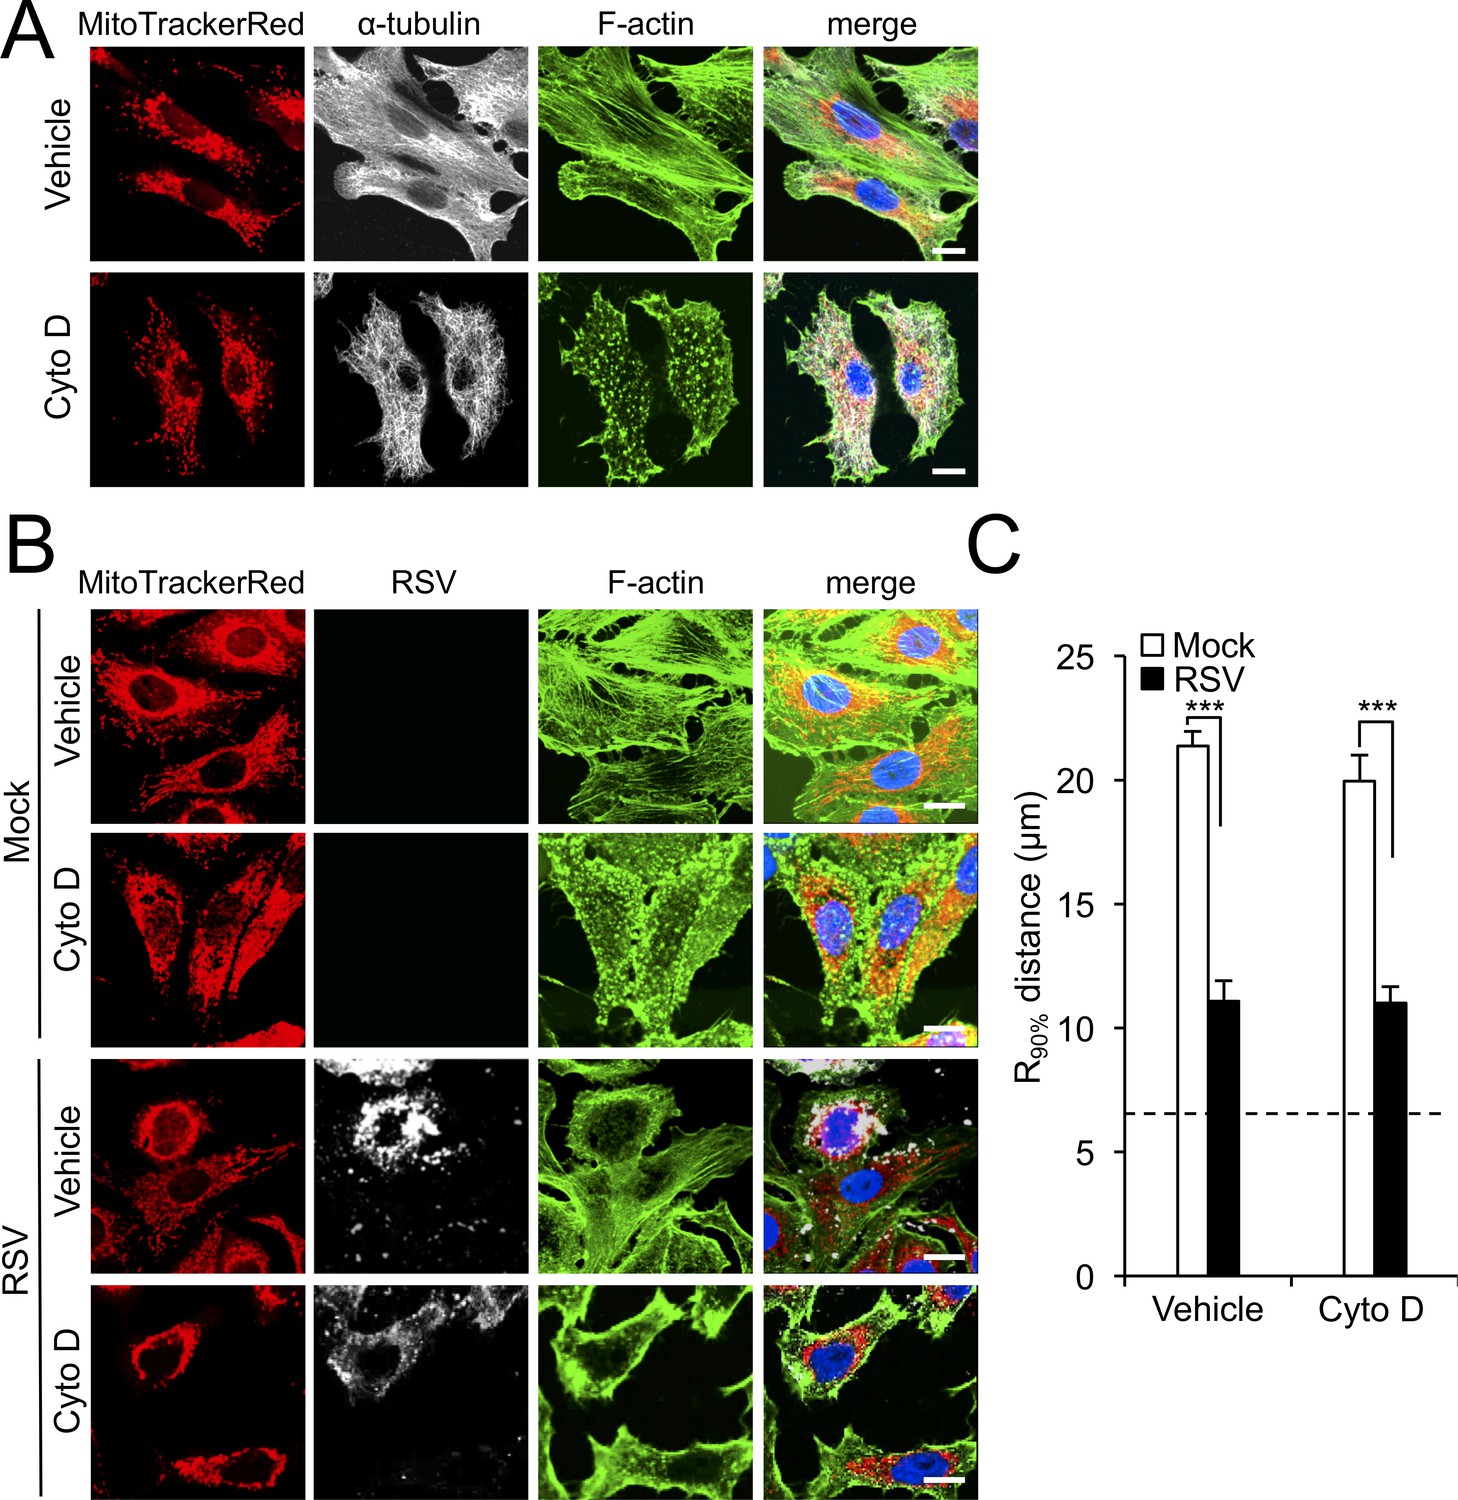
RSV-induced mitochondrial perinuclear clustering is independent of actin filaments.
A549 cells were (A) treated with the actin-depolymerizing drug cytochalasin D (Cyto D, 2 µM) or DMSO as vehicle for 2 hr; (B) mock- or RSV-infected (MOI 3) for 8 hr with the addition of Cyto D (2 µM) or DMSO as vehicle over the last 2 hr. Cell were stained for mitochondria (MitoTrackerRed), α-tubulin (white, panel A) or RSV infection (RSV antibody, white, panel B), F-actin (phalloidin antibody, green) and nuclei (DAPI, blue). Cells were imaged by CLSM. (C) Perinuclear radial distribution of mitochondria R90%, was calculated as per Figure 1D, ***p<0.001). In all panels, scale bar = 10 µm.
Figure 1—video 1
Mitochondrial dynamics in mock-infected cells.
A549 cells were transfected with CellLight Mitochondria-RFP *BacMam 2.0* for mitochondria (Red), and then mock-infected. Live cell imaging was performed for 6-8 h p.i. by resonant scanning CLSM at 8 kHz with 32 times frame averaging, with frames acquired every 10 min (video rate of 6 frames/sec).
Figure 1—video 2
RSV infection induces perinuclear mitochondrial clustering.
A549 cells were transfected with Mitochondria-RFP as per Figure 1—video 1, and then infected with eGFP-rRSV (MOI 3). Imaging was performed for 6-8 h p.i. as per Figure 1—video 1.
Figure 1—video 3
Nocodazole blocks perinuclear mitochondrial clustering induced by RSV infection.
A549 cells were transfected with Mitochondria-RFP as per S1 Movie, and infected with eGFP-rRSV as per S2 Movie, except that the microtubule-depolymerizing agent nocodazole (17 µM) was added at 6 h p.i. Imaging was performed for 6–8 h p.i. as per Figure 1—videos 1 and 2.
Figure 2
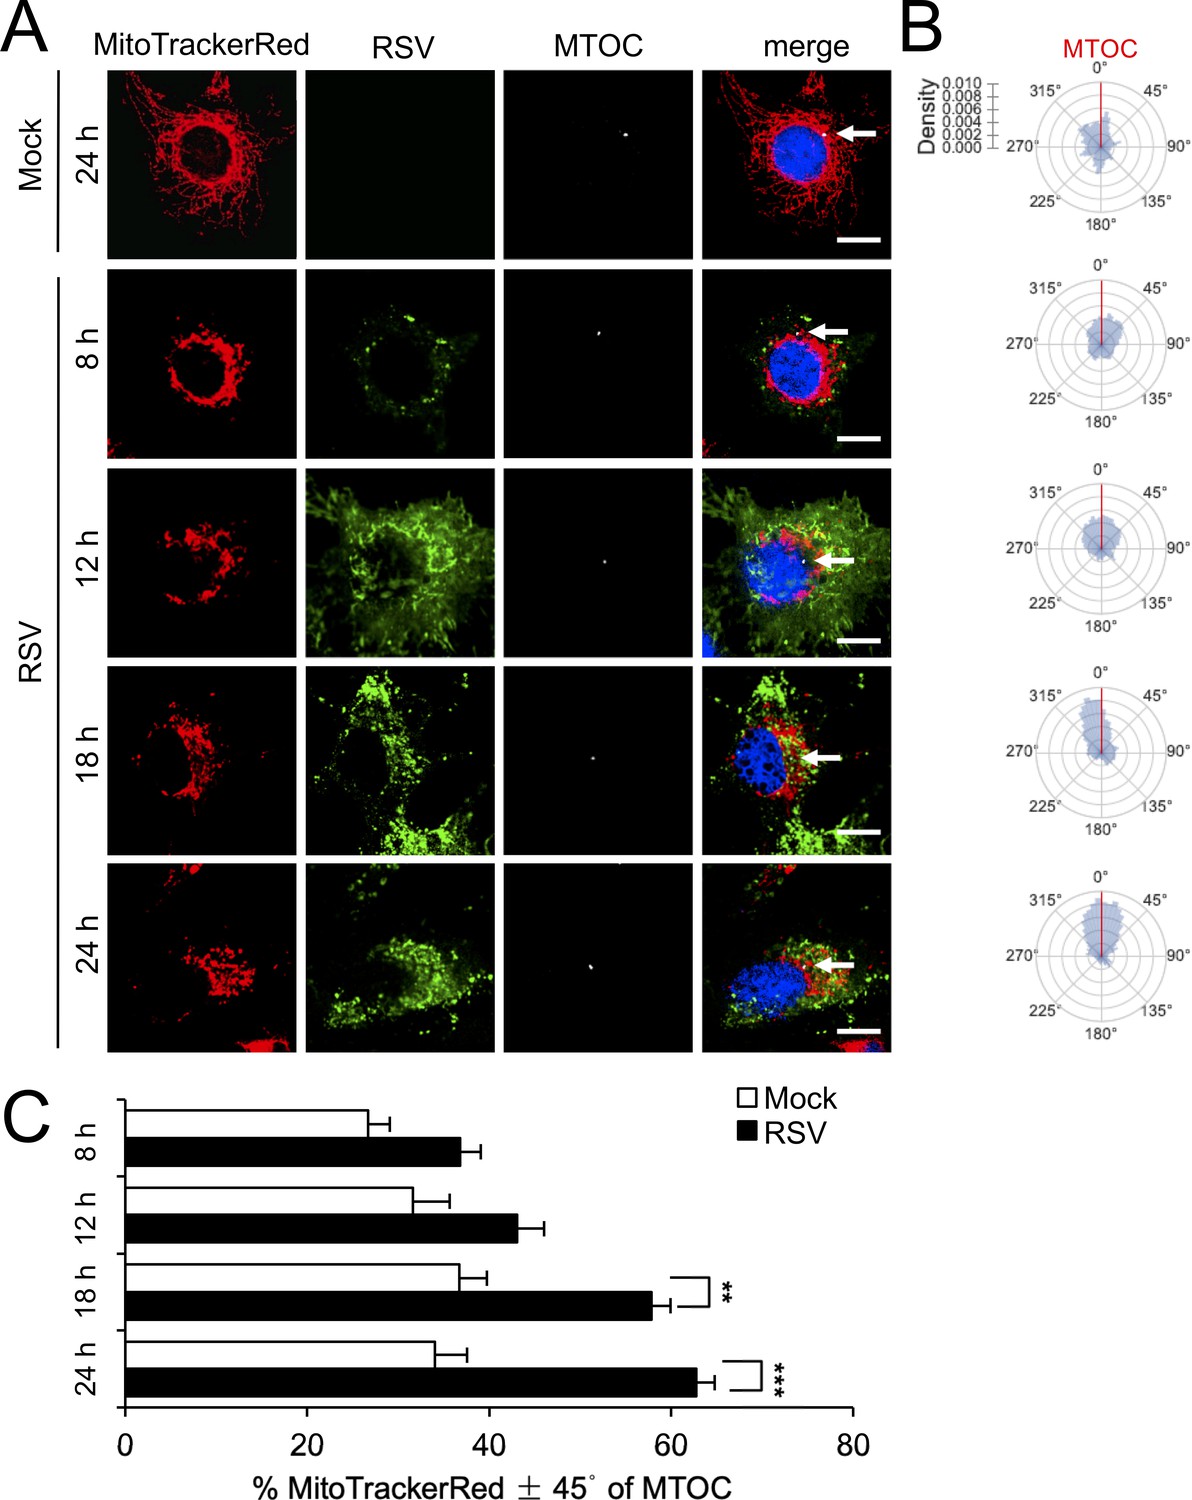
RSV infection induces asymmetric distribution of mitochondria close to the MTOC later in infection.
A549 cells were mock- or RSV-infected (MOI 1) for 8–24 hr, as indicated, and then stained for mitochondria (MitoTrackerRed), RSV infection (RSV antibody, green), MTOC (γ-tubulin antibody, white) and nuclei (DAPI, blue). Cells were imaged by CLSM. (A) Merge panels overlay all four stains; arrows indicate MTOC. In all panels, scale bar = 5 µm. (B and C) Mitochondrial distribution relative to γ-tubulin staining was estimated from images such as those in A. (B) Polar kernel density plot showing the frequency of angles of mitochondria-stained pixels from the centre of the nucleus, normalised to the position of the MTOC (red line). (C) Proportion of mitochondrial signal detected within 45° either side of the MTOC was quantitated. Results represent the mean ± SEM for n = 3 independent experiments, each of which analysed 25–30 cells per sample; **p<0.01, ***p<0.001.
Figure 3
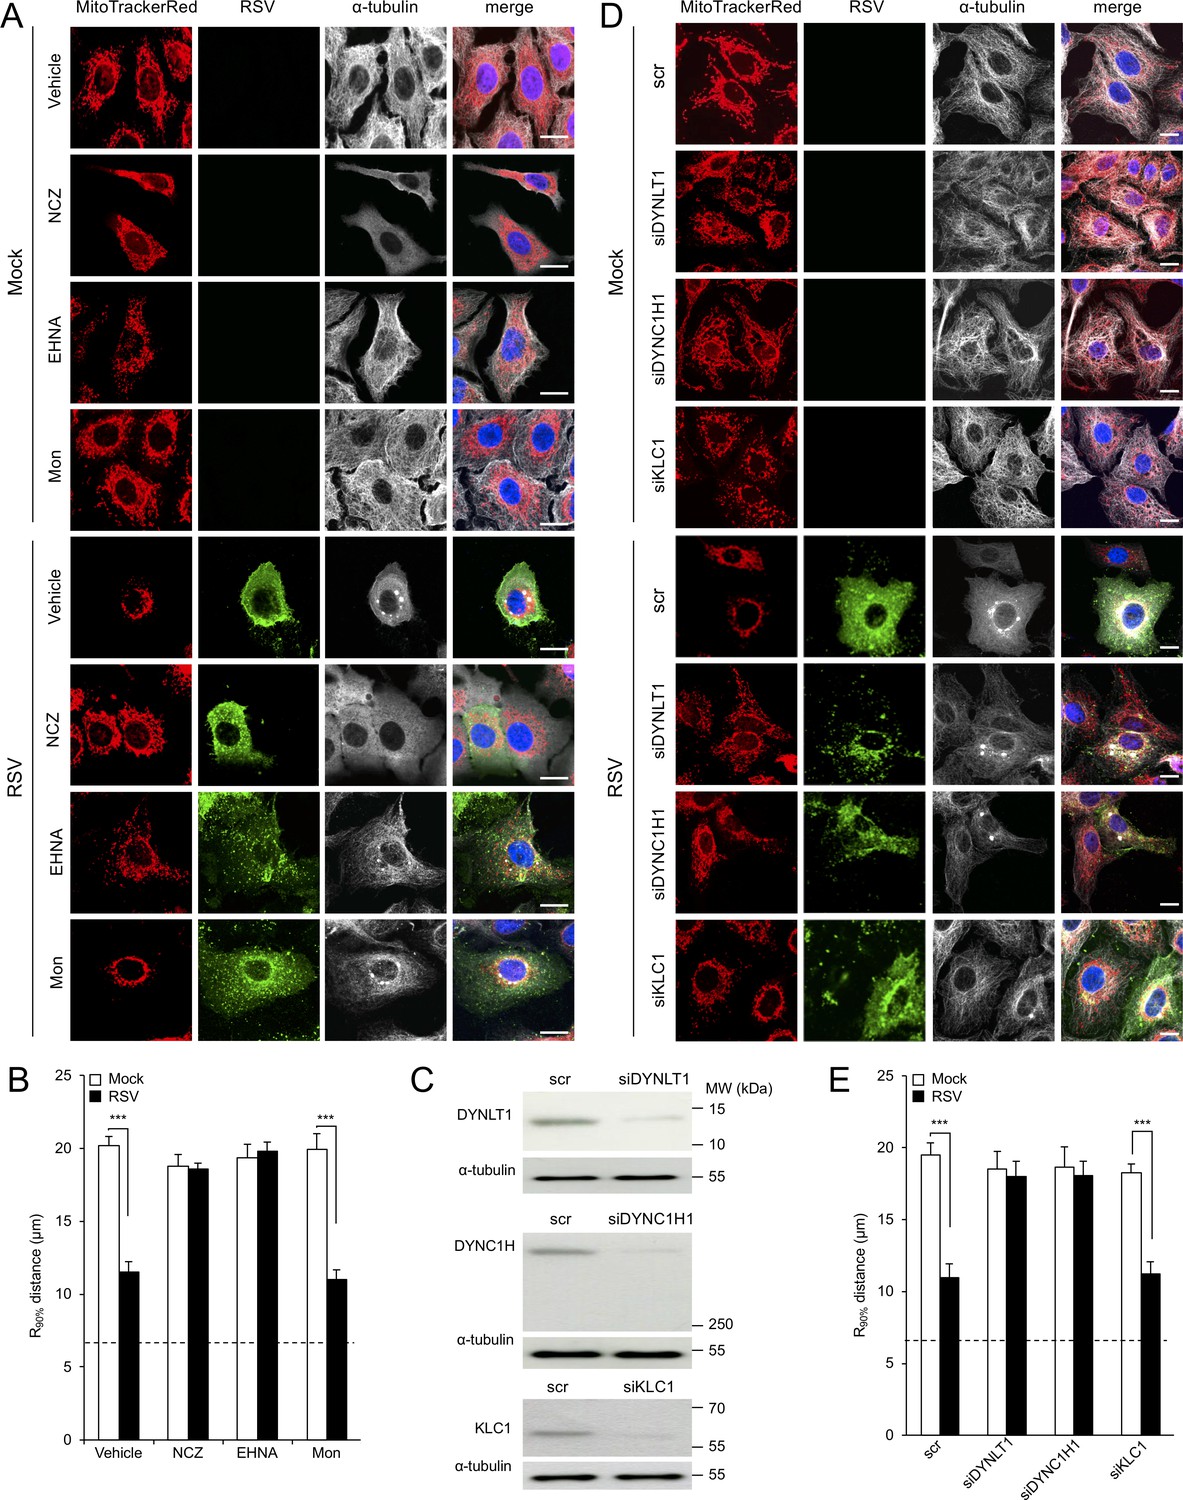
RSV-induced mitochondrial perinuclear clustering is microtubule- and dynein-dependent.
A549 cells were mock- or RSV-infected (MOI 3) for 8 hr with the indicated agents added in the last 2 hr: (A and B) the microtubule-depolymerizing agent nocodazole (NCZ, 17 µM), the dynein inhibitor EHNA (200 µM), the kinesin inhibitor monastrol (Mon, 50 µM), or DMSO as a vehicle control. Cells were then stained for mitochondria (MitoTrackerRed), RSV (RSV antibody, green), α-tubulin (white) and nuclei (DAPI, blue), and cells imaged by CLSM. (A) Merge panels overlay all four stains. (B) The perinuclear radial distribution of mitochondria (R90%) was calculated as per Figure 1D, ***p<0.001. (C–E) A549 cells were pretreated (48 hr) with siRNA (50 nM) for dynein light chain Tctex-type 1 (DYNLT1), dynein cytoplasmic 1 heavy chain 1 (DYNC1H1), kinesin light chain 1 (KLC1), or scrambled control (scr). (C) Immunoblot analysis for DYNLT1, DYNC1H1, KLC1, or the control α-tubulin, as indicated (40 µg cell lysate protein/lane). (D and E) RSV infection, immunostaining, and R90% analysis were as per (A and B). In all panels, scale bar = 10 µm.
Figure 4
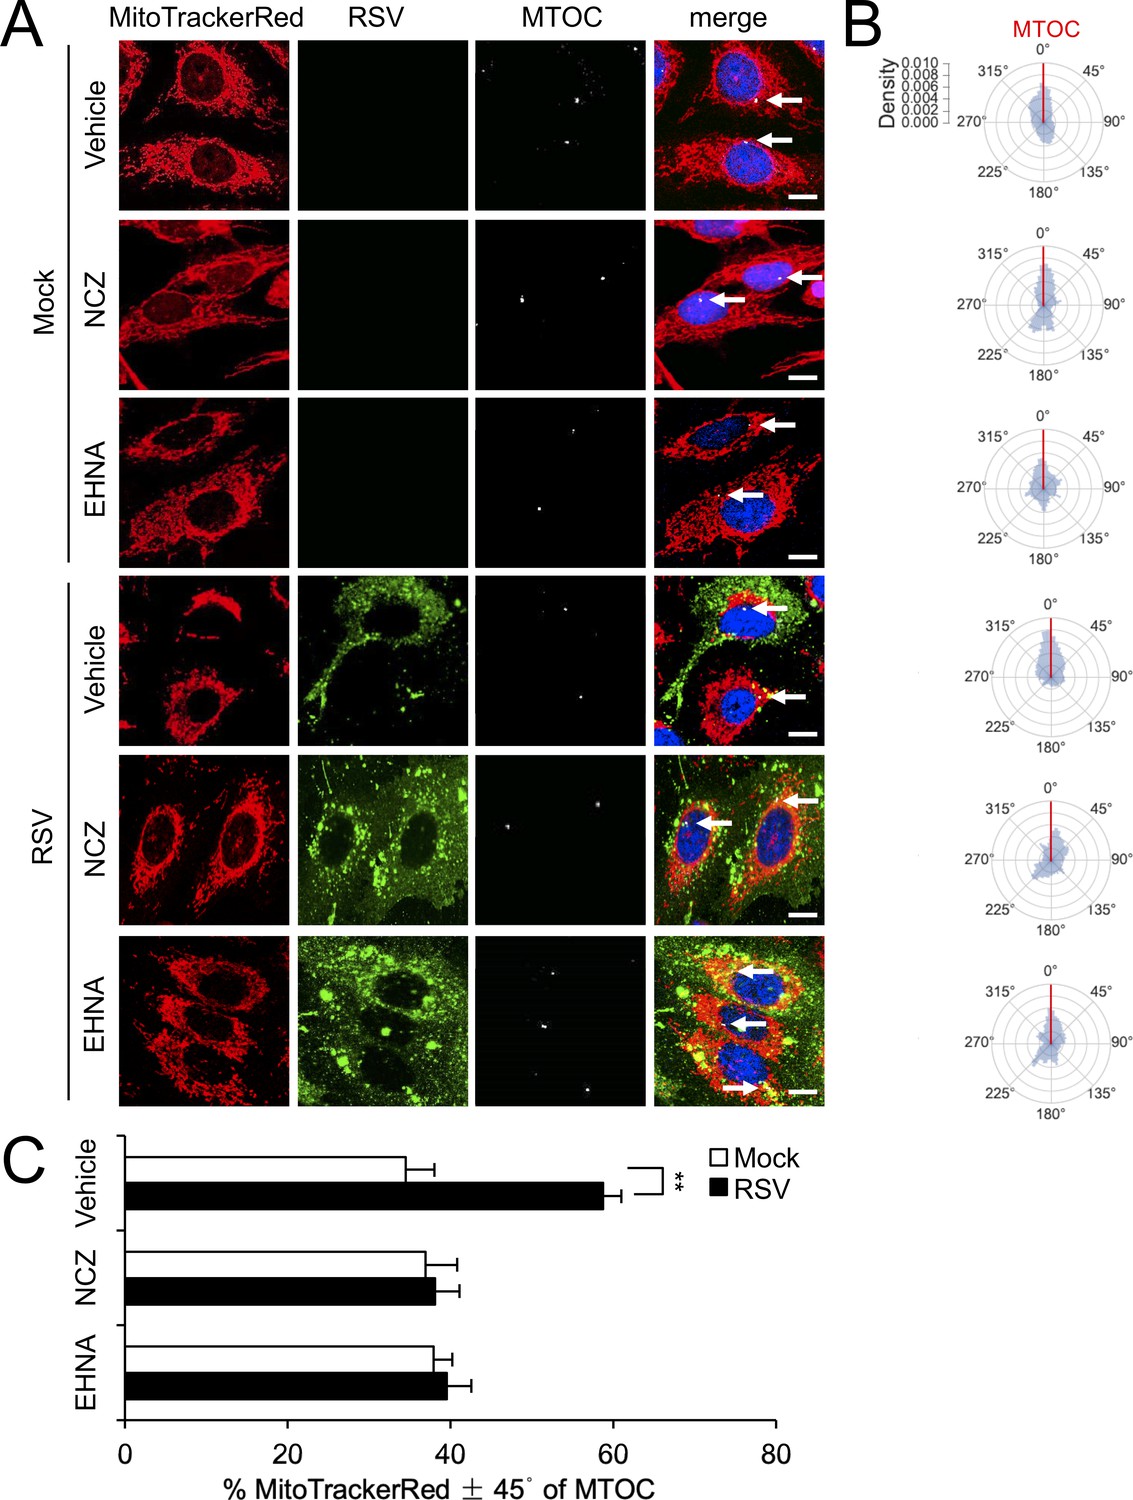
RSV-induced asymmetric distribution of mitochondria is microtubule- and dynein-dependent.
(A–C) A549 cells were mock- or RSV-infected (MOI 1) for 18 hr with the indicated treatments over the last 2 hr as per Figure 3AB, followed by staining for mitochondria, RSV, MTOC and nuclei as per Figure 2A, and imaging by CLSM. (A) Merge panels overlay all four stains; arrows indicate the MTOC. In all panels, scale bar = 10 µm. (B and C) Polar kernel density of mitochondrial distribution relative to the MTOC analysed as per Figure 2BC. (C) Proportion of mitochondrial signal detected within 45° either side of the MTOC was quantitated. Results represent the mean ± SEM for n = 3 independent experiments, each of which analysed 25–30 cells per sample. **p<0.01.
Figure 5 with 1 supplement

RSV infection inhibits host mitochondrial respiration in dynein/microtubule-dependent fashion.
Cellular bioenergetic analysis was performed using the Seahorse XF96 Extracellular Flux Analyser. A549 cells were (A and B) mock-infected for 24 hr or RSV-infected (MOI 1) for 6–24 hr or (C) RSV-infected (MOI 1) for 18 hr with additions of the microtubule-depolymerizing agent nocodazole (NCZ, 17 µM), or the dynein ATPase-inhibitor EHNA (200 µM) over the last 2 hr. (A) An example of a typical oxygen consumption rate (OCR) obtained in these experiments. OCR was measured in real time upon sequential additions of ATP synthase inhibitor oligomycin (Oligo, 1 µM), proton ionophore FCCP (1 µM), mitochondrial complex III inhibitor antimycin A (Anti, 1 µM) and mitochondrial complex I inhibitor rotenone (Rot, 1 µM). Inset: Correlation of OCR, a measure of mitochondrial respiration and extracellular acidification rate (ECAR), an indicator of glycolysis (R2 = 0.9745). (B and C) Mitochondrial respiration function parameters of basal, ATP-linked, maximal and non-mitochondrial respiration were determined as per Figure 5—figure supplement 1B. Results represent the mean ± SEM for n = 3 independent experiments, each performed in triplicate. ***p<0.001, **p<0.01, *p<0.05 compared to the mock-infected cells.
Figure 5—figure supplement 1
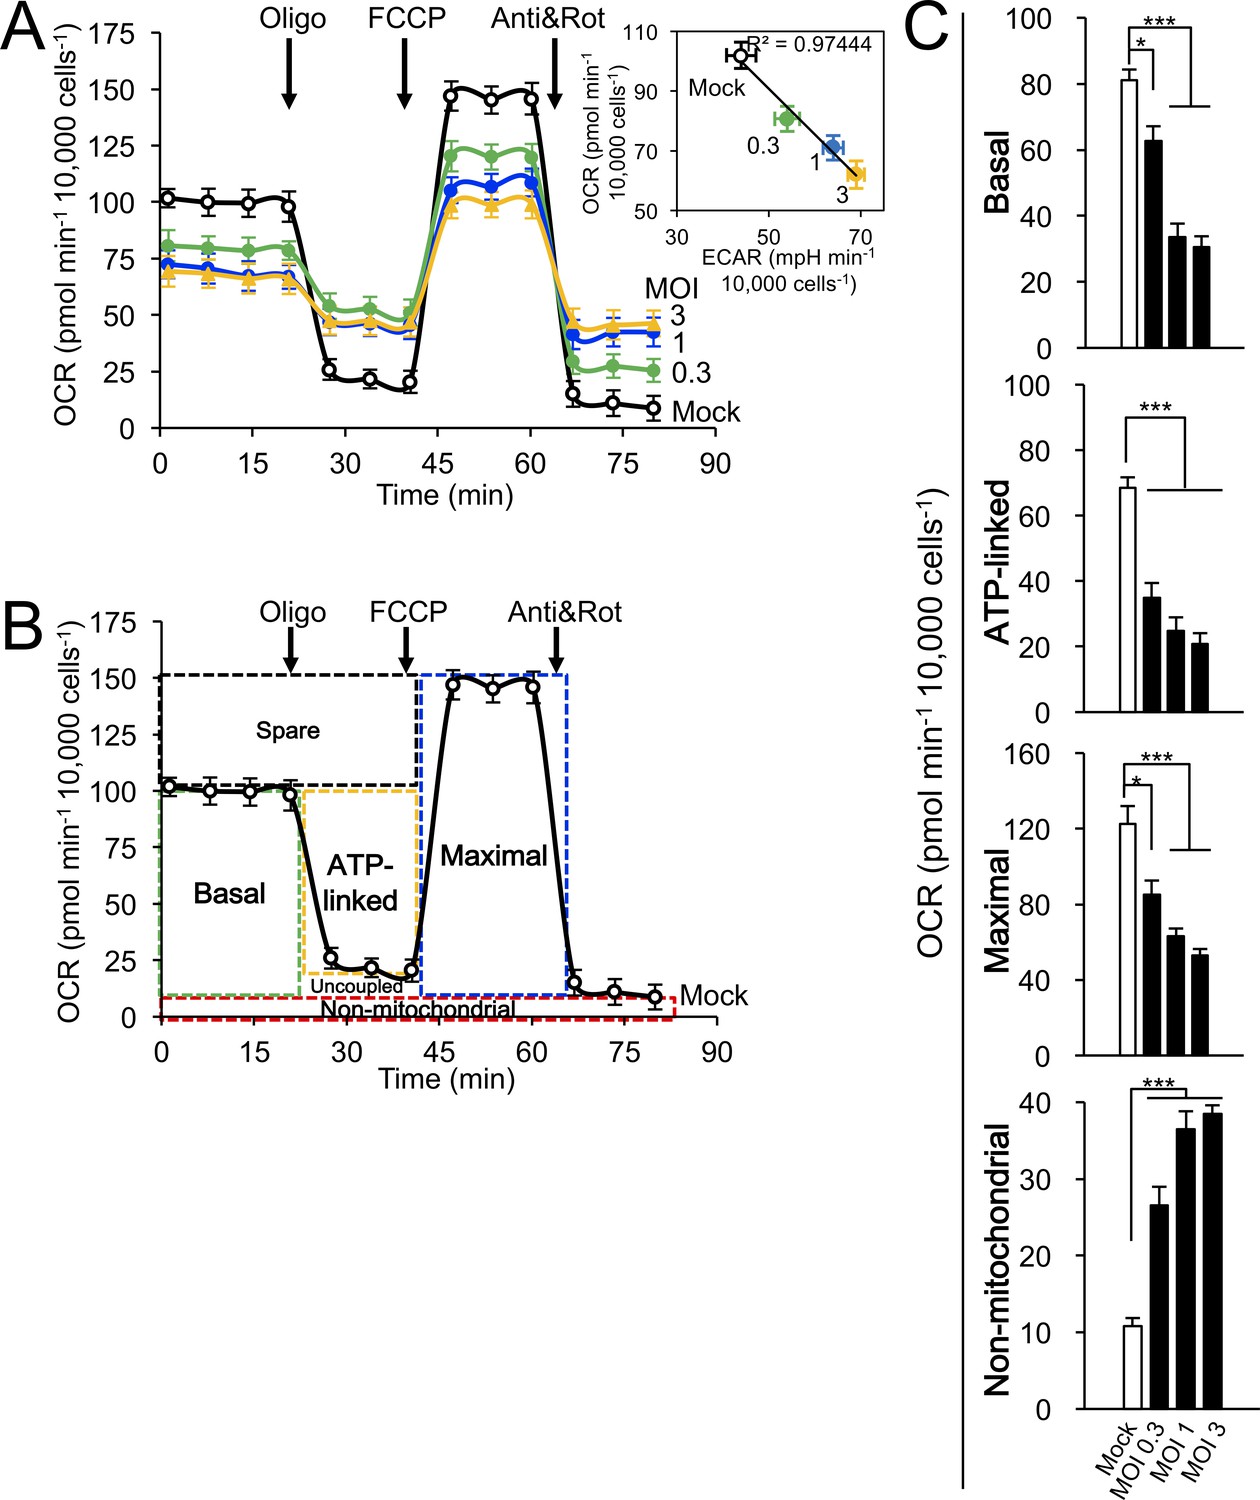
Correlation of multiplicity of infection (MOI) and effects on host cell mitochondrial respiration.
Cellular bioenergetic analysis was performed using the Seahorse XF96 Extracellular Flux Analyser. (A–C) A549 cells were mock- or RSV-infected (MOI 0.3–3) for 24 hr. (A) Measurements/analysis were performed as per Figure 5A. Inset: Correlation of OCR and ECAR by linear regression (R2 = 0.97444). (B) Schematic representation depicting the calculation of the basal, ATP-linked, maximal and non-mitochondrial respiration parameters. (C) Pooled results were calculated as per Figure 5B. ***p<0.001, *p<0.05 compared to the mock-infected cells.
Figure 6 with 1 supplement

RSV infection disrupts maintenance of mitochondrial membrane potential (Δψm).
A549 cells were infected without (mock) or with eGFP-rRSV (MOI 1) for 6–24 hr, as indicated, followed by treatment with DMSO as vehicle or FCCP (5 µM, 10 min). In all cases, the Δψm-sensitive dye tetramethylrhodamine ethyl ester (TMRE, red; 50 nM) was included for the final 15 min. (A) Cells were imaged live by CLSM. Merge panels overlay TMRE and GFP. Arrows indicate the eGFP-rRSV-infected cells. In all panels, scale bar is 5 µm. (B) Integrated intensity for TMRE fluorescence was quantified using Fiji software. Results represent the mean ± SEM for n = 3 independent experiments, each of which analysed 15–20 cells per sample ***p<0.001 compared to the mock-infected cells.
Figure 6—figure supplement 1
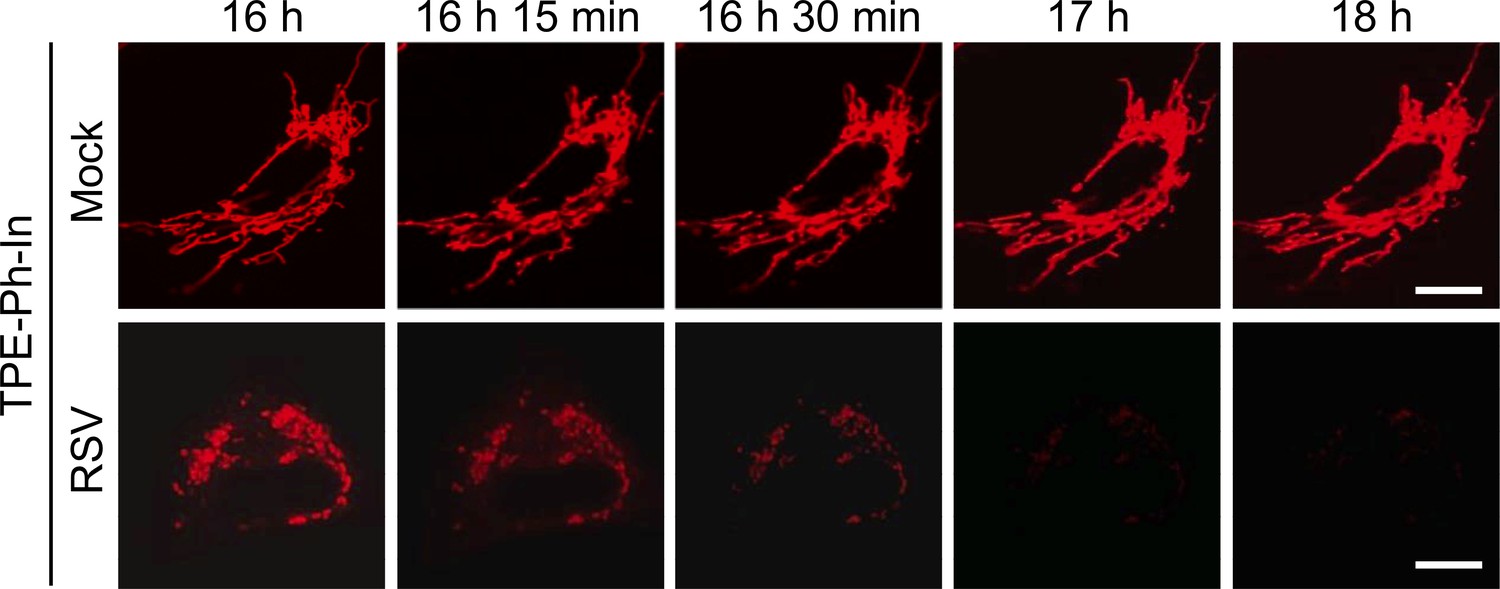
RSV infection impairs mitochondrial membrane potential (Δψm).
A549 cells were mock- or RSV-infected (MOI 3) for 15.5 hr before addition of TPE-Ph-In (red; 2 µM), followed by imaging by resonant scanning CLSM from 16 h p.i. Images are representative of 3 independent experiments. In all panels, scale bar = 5 µm.
Figure 7 with 1 supplement
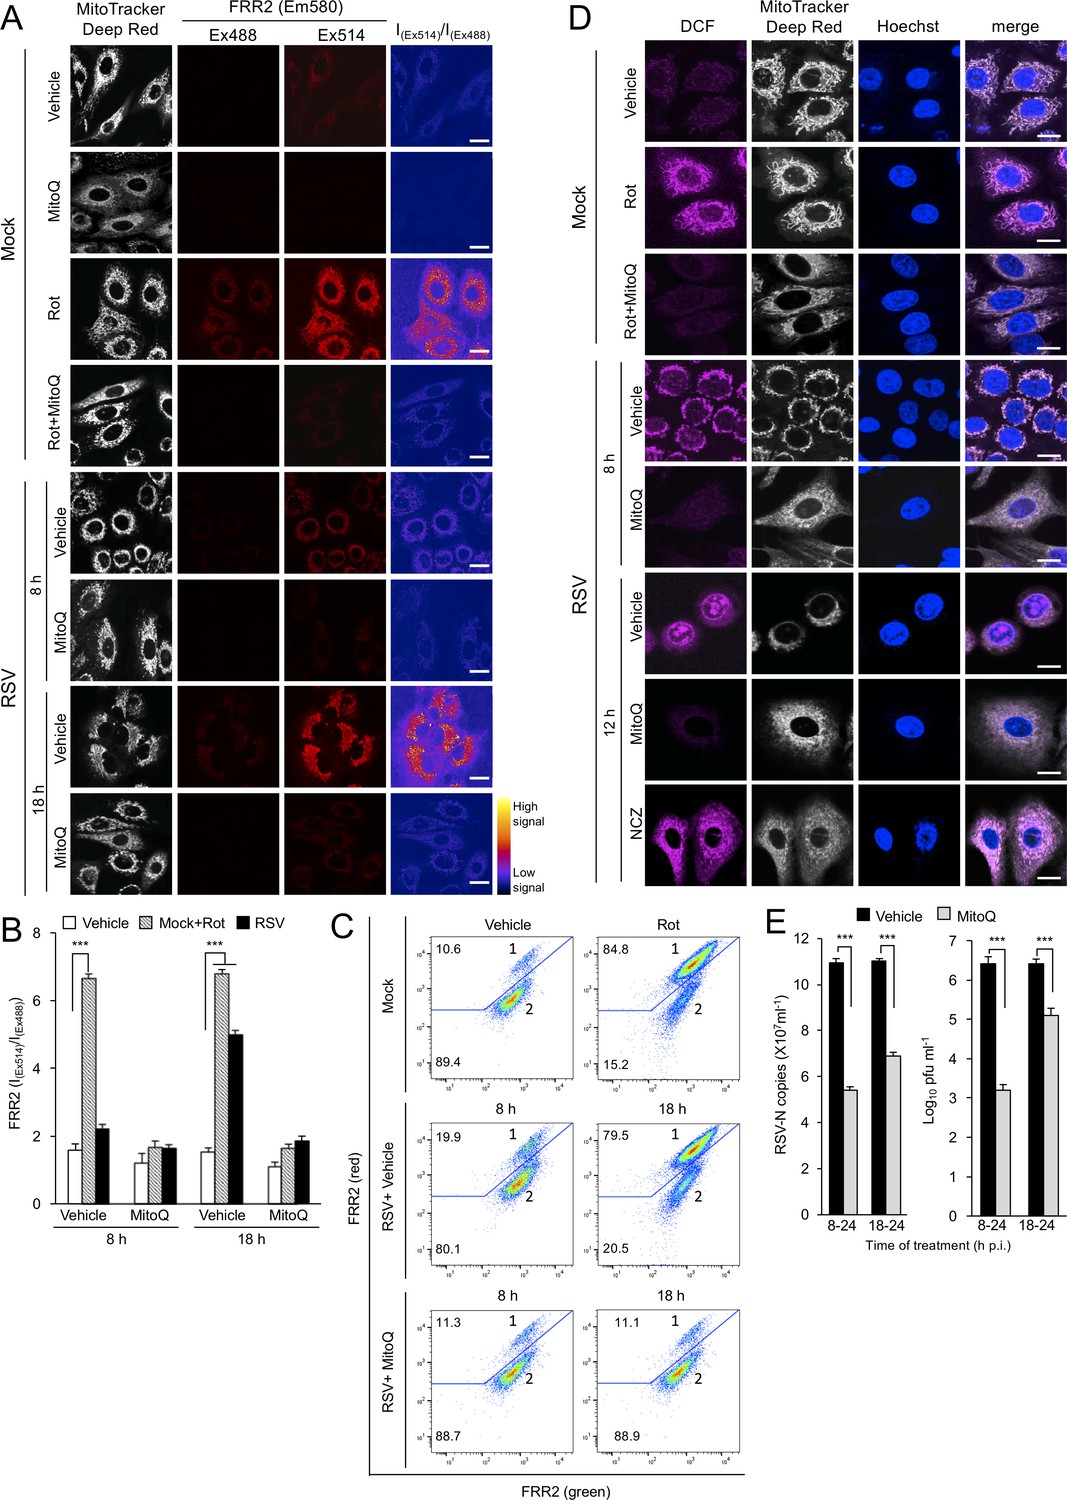
RSV infection enhances mitochondrial reactive oxygen species (ROS) generation, which favours virus production.
(A–D) A549 cells were mock-infected or RSV-infected (MOI 3) for 8, 12 or 18 h p.i., with the the additions as indicated for the final 2 hr prior to staining: the mitochondrial complex I inhibitor rotenone (Rot, 0.5 µM), the mitochondria-specific ROS scavenger mitoquinone mesylate (MitoQ, 1 µM), NCZ (17 µM) or DMSO as a vehicle; in the case of dual Rot/MitoQ addition (Rot + MitoQ), Rot was added 4 hr before staining. (A) Cells were stained for Mitotracker Deep Red (white; 100 nM, 15 min) and the mitochondria-specific ROS probe flavin-rhodamine redox sensor 2 (FRR2, red; 2 µM, 15 min prior to imaging). Colocalization for FRR2 staining at either Ex488 or Ex514 and Mitotracker Deep Red was >85% (Pearson correlation coefficient; Costes et al., 2004) across all samples (25–30 cells/sample). The ratiometric output images of I(Ex514)/I(Ex488) (far right) were calculated by pixelwise division of FRR2 emission (580 ± 20 nm) images acquired using excitation at 514 nm (third column) or 488 nm (second column), and are represented in pseudo-colour (intensity colour key displayed lower right). Live cell imaging was performed by resonant scanning CLSM. Results are typical of 3 independent experiments. In all panels, scale bar = 10 µm. (B) FRR2 (I(Ex514)/I(Ex488)) was calculated for the mitochondrial regions defined by Mitotracker Deep Red staining in the I(Ex514)/I(Ex488) images such as those in (A) using a custom CellProfiler pipeline (see Materials and methods). Results represent the mean ± SEM for n = 3 independent experiments, where each experiment analysed 25–30 cells per sample, ***p<0.001. (C) FACS analysis from single-cell suspensions stained with FRR2. Green (540/30 nm) and red (585/42 nm) fluorescence was excited at 488 nm. The percentages of cells (50,000/sample) in populations 1 (high red emission) and 2 (low red emission) determined using FlowJo are indicated. Results were typical of 3 independent experiments. (D) Cells were stained with Mitotracker Deep Red as for (A), Hoechst nucleic acid dye (blue; 5 µg/ml) and the cellular ROS indicator 2’,7’-dichlorodihydrofluorescein diacetate (DCF, magenta; 2.5 µM) over the last 5 min before live cell imaging by CLSM. Merge panels overlay all three stains. In all panels, scale bar = 10 µm. (E) Mock or RSV-infected (MOI 1) A549 cells were treated with MitoQ (1 μM) for the times indicated, followed by cell lysate preparation, with qPCR and plaque assay performed to determine viral RNA copy number and infectious virus (plaque forming units pfu ml−1) respectively. Results shown represent the mean ± SEM from three independent experiments assayed in triplicate. ***p<0.001.
Figure 7—figure supplement 1
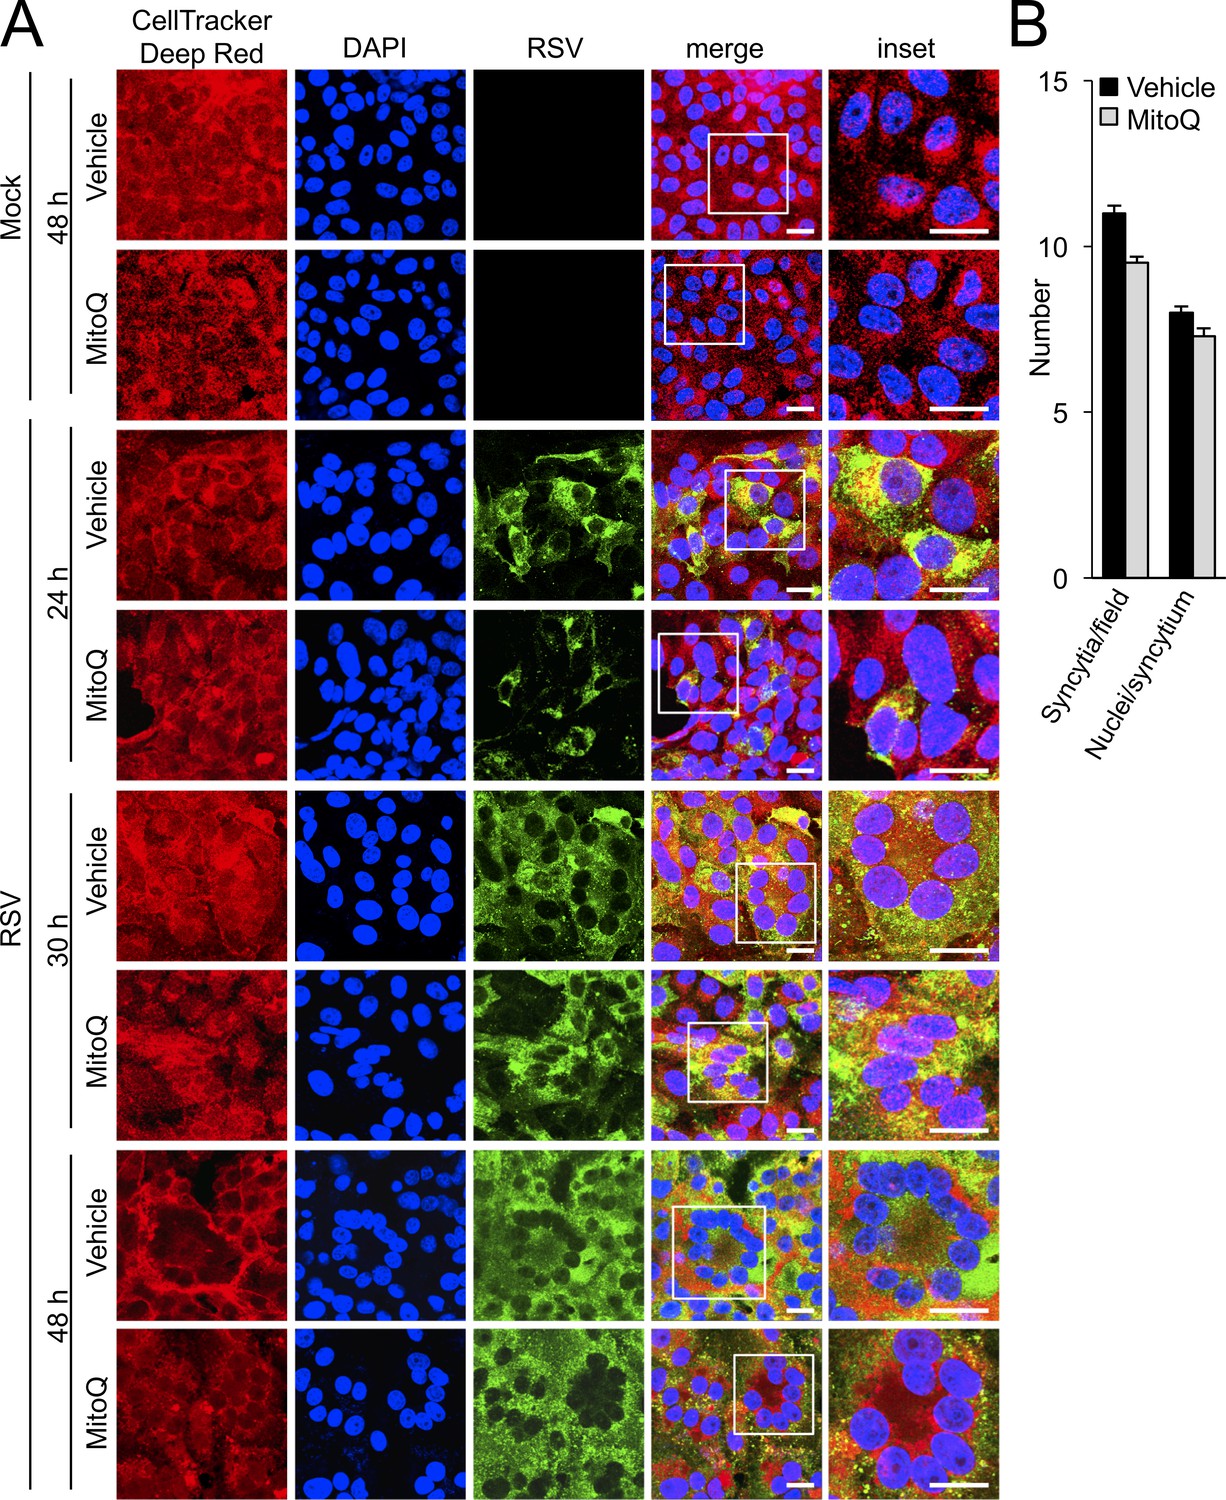
The mitochondria-targeted antioxidant MitoQ suppresses RSV replication but not virus spread.
(A–B) Vero cells were mock- or RSV-infected (MOI 0.3) and treated with a mitochondrial ROS scavenger MitoQ (0.5 μM) or DMSO (Vehicle) for the last 12 hr before staining for cell morphology (CellTracker Deep Red, red), RSV infection (RSV antibody, green) and nuclei (DAPI, blue) for the times indicated. (A) Cells were imaged by CLSM (X64 objective). Merge panels overlay the three stains. Inset (far right panels) corresponds to the boxed regions. Scale bar = 20 µm. (B) Syncytia with more than three nuclei fused together at 48 h p.i. were quantified from images such as those in A). Results for the density of syncytia (number per field) and size of syncytia (number of nuclei/syncytium) represent the mean ± SEM for three independent experiments, each of which analysed 10 fields.
Figure 8 with 3 supplements
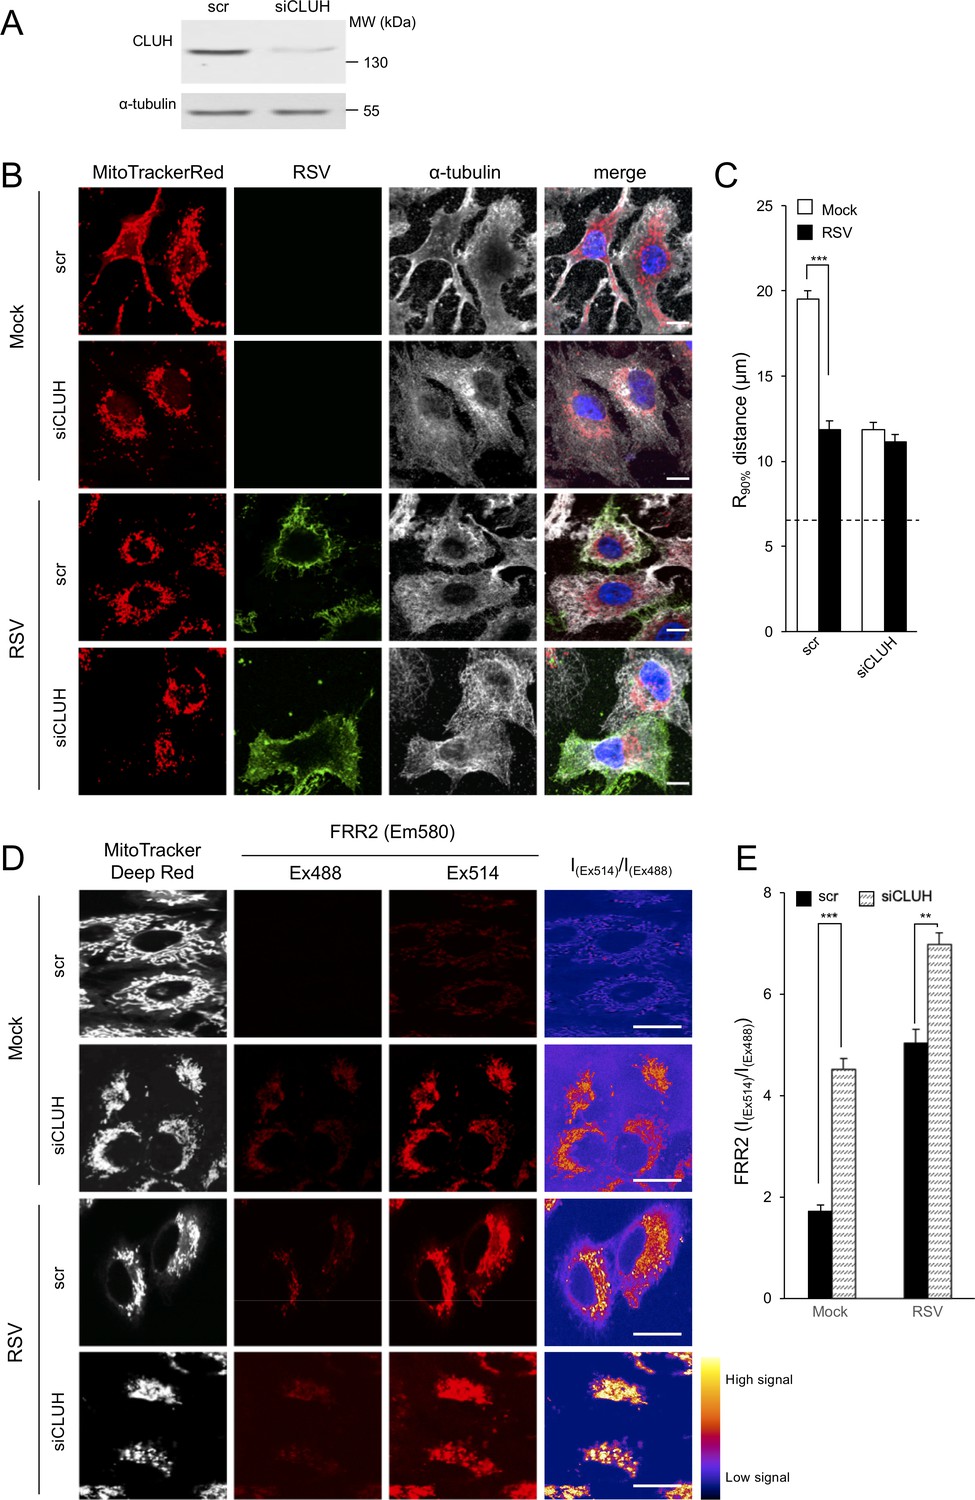
Knockdown of the clustered mitochondria homolog (CLUH) elicits perinuclear mitochondrial redistribution, elevated mitochondrial ROS generation, and enhances RSV virus production.
(A–E) A549 cells were pretreated (48 hr) with siRNA (50 nM) for clustered mitochondria homolog (CLUH), or scrambled siRNA control (scr) followed by infection with RSV (MOI 1) for another 24 hr. (A) Immunoblot analysis for CLUH, or the control α-tubulin, as indicated (40 µg cell lysate protein/lane). (B and C) Immunostaining and R90% analysis were as per (Figure 1C and D). In all panels, scale bar = 10 µm. Results represent the mean ± SEM for n = 3 independent experiments, where each experiment analysed 25–30 cells per sample; ***p<0.001. (D) Cells were stained with Mitotracker Deep Red and the mitochondria-specific ROS probe FRR2 as per Figure 7A. The ratiometric output images of I(Ex514)/I(Ex488) were calculated as per Figure 7A. (E) FRR2 (I(Ex514)/I(Ex488)) was calculated for the mitochondrial regions defined by Mitotracker Deep Red staining in the I(Ex514)/I(Ex488) images such as those in D) using a custom CellProfiler pipeline as per Figure 7B. Results represent the mean ± SEM for n = 3 independent experiments, where each experiment analysed 25–30 cells per sample, ***p<0.001, **p<0.01.
Figure 8—figure supplement 1
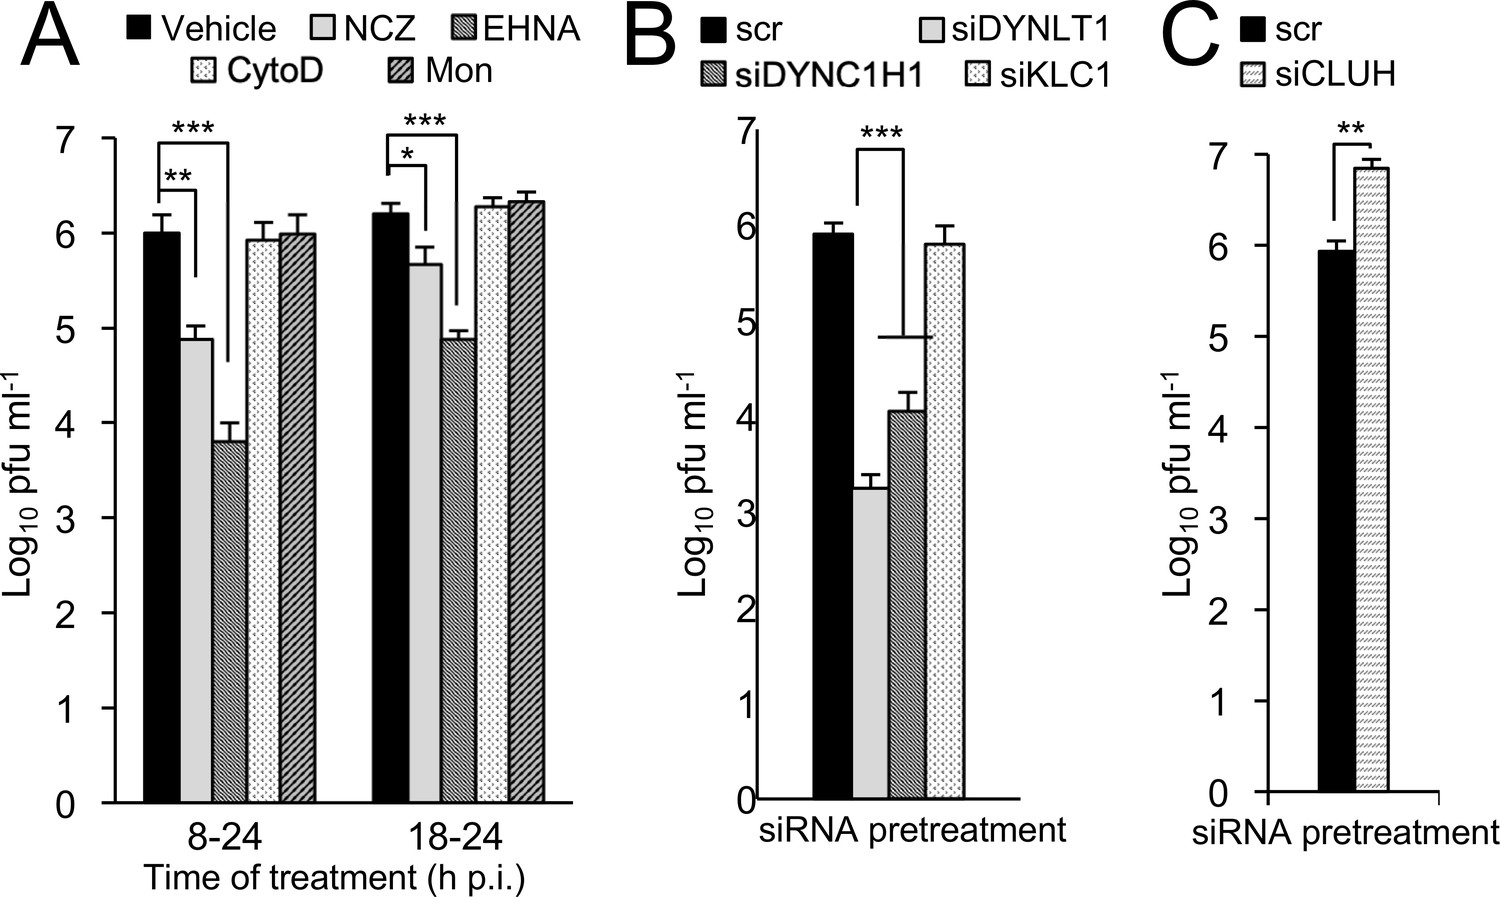
Microtubule/dynein-dependent mitochondrial redistribution favours RSV virus production.
Infectious virus (plaque forming units pfu ml−1) was quantitated following infection of A549 cells with RSV (MOI 1). (A) A549 cells were infected for 24 hr with the additions for the last 6 or 16 hr as indicated: NCZ (17 µM), EHNA (200 µM), CytoD (2 µM), Mon (50 µM), or DMSO as vehicle. (B–C) A549 cells were pretreated (48 hr) with siRNA (50 nM) for scrambled control (scr), (B) DYNLT1, DYNC1H1, KLC1, or (C) CLUH followed by RSV infection. Results shown represent the mean ± SEM from three independent experiments assayed in triplicate. ***p<0.001, **p<0.01, *p<0.05.
Figure 8—figure supplement 2
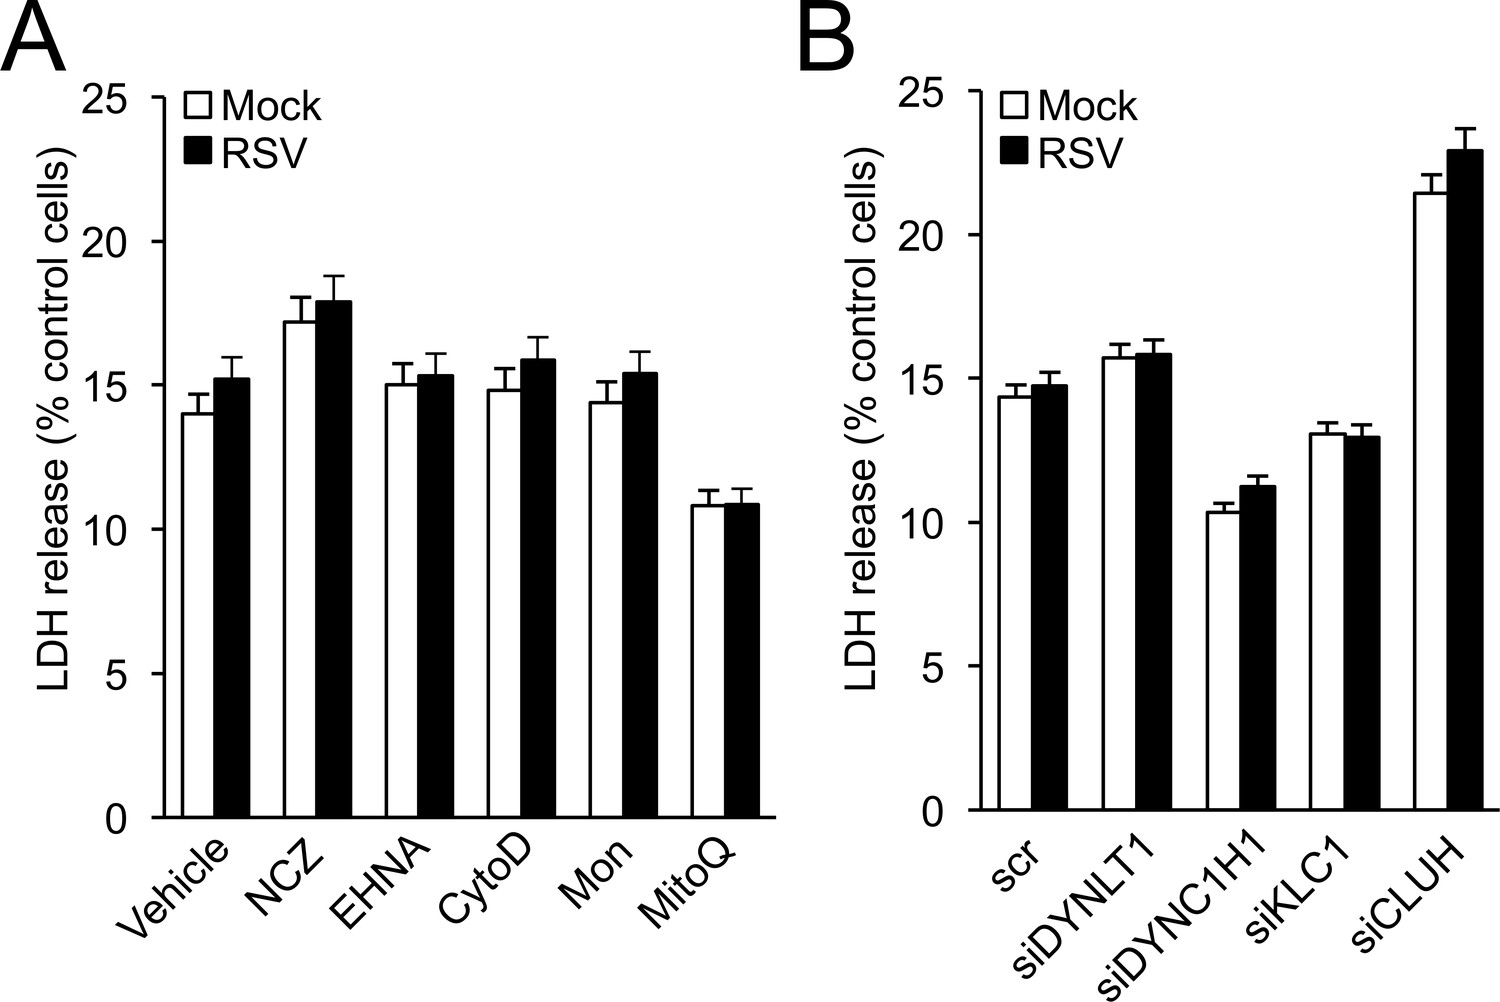
Lack of effect of drug (A) and siRNA (B) treatments used in this study on cell viability.
A cytotoxicity detection kit (LDH Release Assay, Roche Applied Science) was used to analyse cell death on the basis of the amount of LDH (lactate dehydrogenase) released into the medium upon plasma membrane damage. A549 cells cultured in 96-well plates were (A) infected with RSV (MOI 1, 24 hr) with the indicated additions for the last 16 hr: NCZ (17 μM), EHNA (200 μM), CytoD (2 μM), Mon (50 μM), or MitoQ (0.5 μM), with DMSO as the vehicle, or (B) pre-treated (48 hr) with the indicated siRNAs (50 nM) followed by RSV (MOI 1, 24 hr) infection. The LDH assay was then carried out as previously (Hu et al., 2013). Results represent the mean ± SEM (n = 3).
Figure 8—figure supplement 3
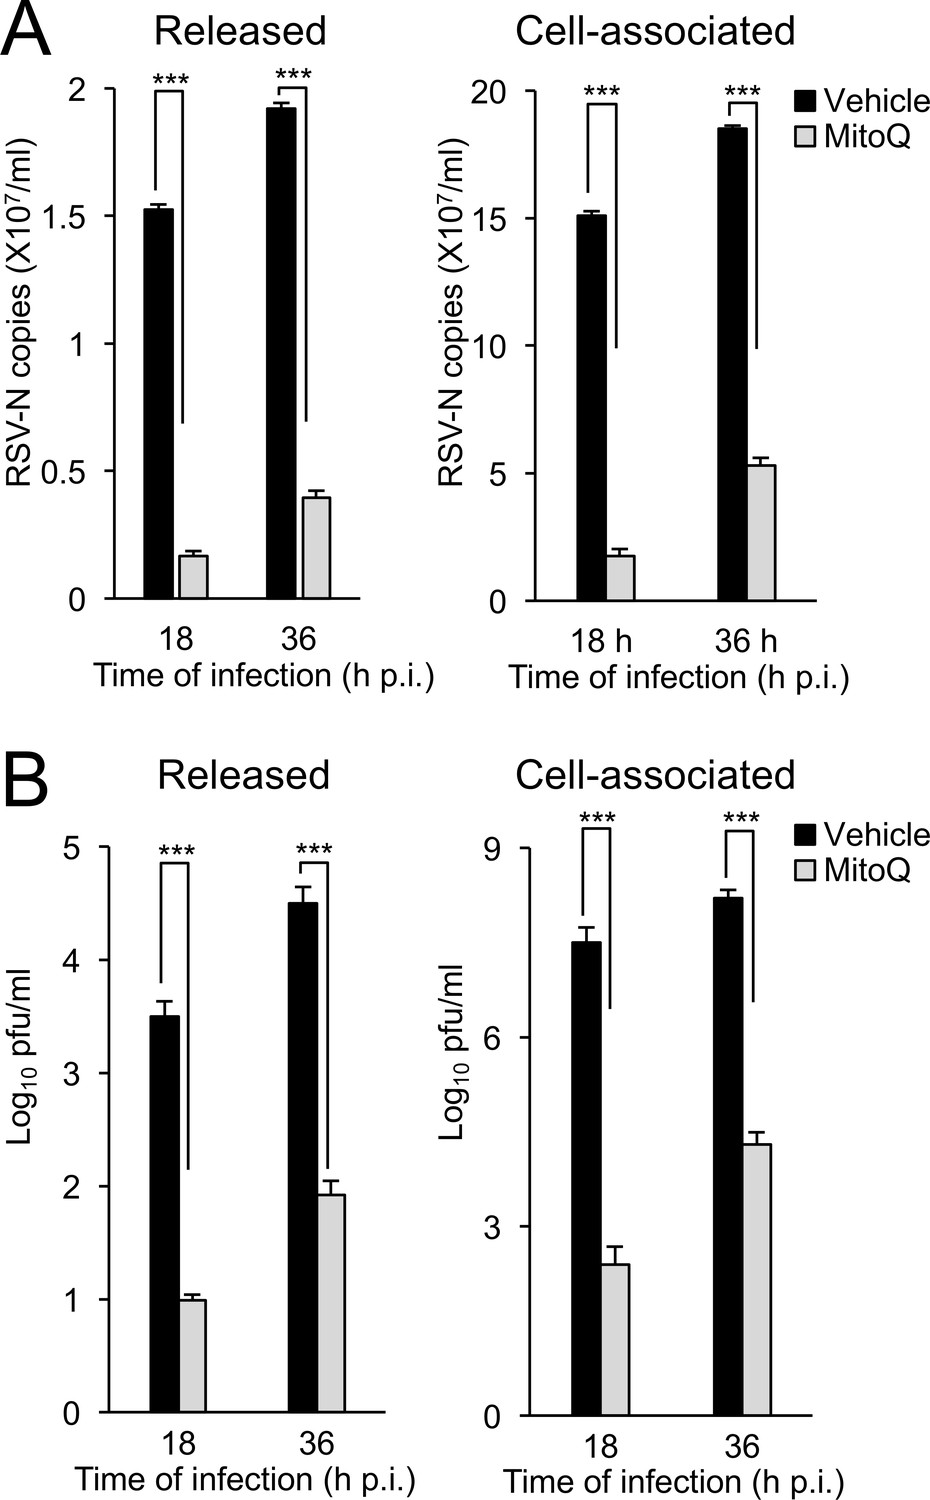
Mitochondrial ROS-dependent Effects on RSV Viral replication and infectious virus production in primary human bronchial epithelial cells (pBECs).
pBECs were infected with RSV (MOI 1) for the times indicated, followed by the addition of the mitochondria-specific ROS scavenger MitoQ (1 µM) or DMSO (vehicle) for 18 hr prior to analysis for apically released (Left) or cell-associated virus (Right) by (A) qPCR and (B) plaque assays. Results are for the mean ± SEM (n = 3). ***p<0.001.
Figure 9
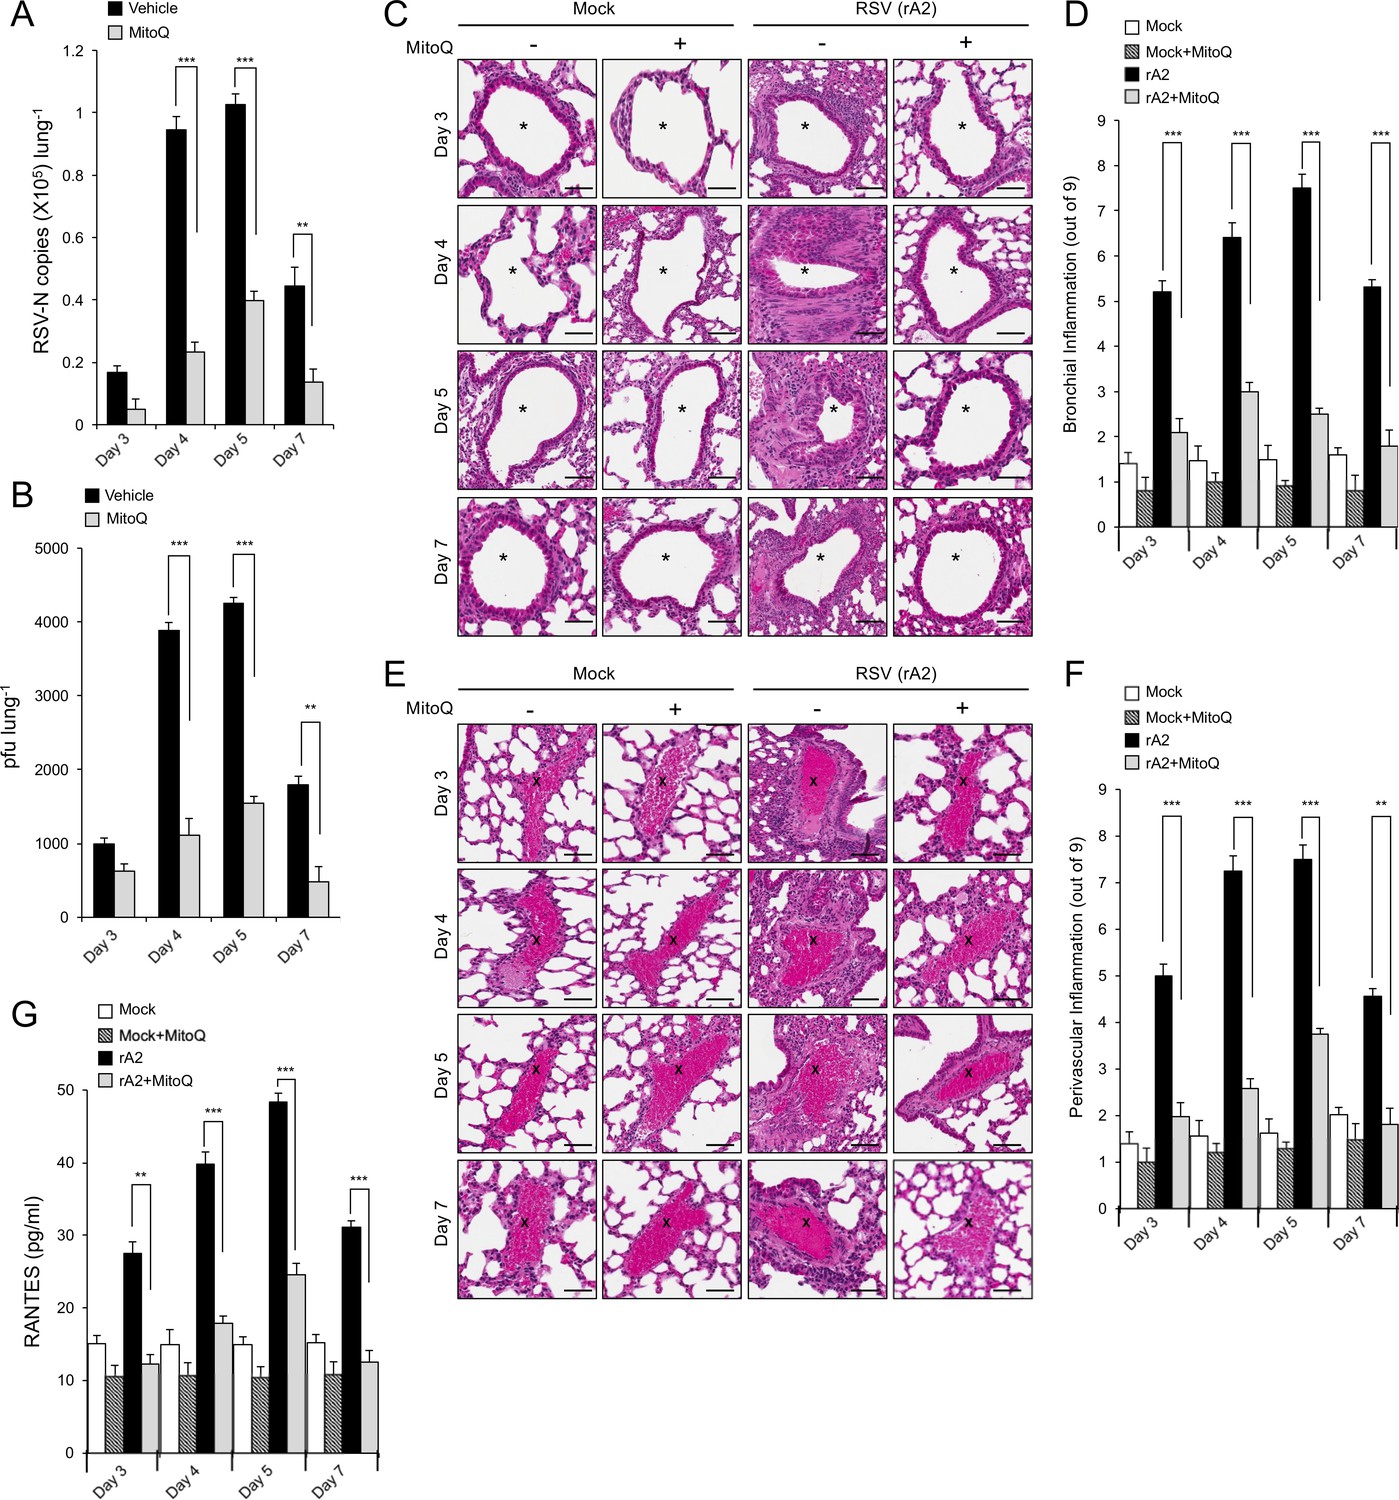
The mitochondrial ROS scavenger MitoQ reduces RSV virus production in mice, concomitant with reduced inflammation.
BALB/c mice were intranasally inoculated with 50 μl of 2.5 × 10⁵ pfu of rRSV or an equivalent volume of diluent at day 0 and given water containing MitoQ (500 μM) or fresh water ad libitum each day. five mice from each treatment group (total of 20 mice) were euthanased on the days p.i. indicated, and samples collected for analysis. (A and B) One lung from each animal was put into 1 mL of diluent with steel beads and frozen at −80°C. Lungs were subsequently homogenised in a tissue-lyser, debris removed by centrifugation and the supernatant used immediately for (A) virus genome analysis by qPCR and (B) quantification of infectious virus (plaque forming units or pfu/lung) by plaque assay. (C–F) The other lung was fixed in formalin, embedded in paraffin, sectioned and stained with haemotoxylin and eosin (H and E). (C and E) Representative images (enlarged 400X) are from whole lung sections scanned using Aperio ScanScope slide scanner. Scale bar = 100 µm. Inflammatory cell infiltrate surrounds the bronchial airway (marked by asterisks, (C) or the blood vessels (marked by crosses, (E) in rRSV-infected samples. Each lung was scanned at three different depths. (D and F) Pooled data for scoring the extent of (D) bronchial and (F) perivascular inflammation. The intensity of inflammation was quantitated double-blind according to the schema described in Materials and methods (0–9 scale). Quantitation was performed on multiple lung lobes from three different depths of sectioned tissue. Results represent the mean ± SEM (n = 15). (G) Blood was collected by cardiac puncture. Systemic inflammation was determined by ELISA for RANTES as described in Materials and methods. Results represent the mean ± SEM (n = 5). ***p<0.001, **p<0.01.
Figure 10
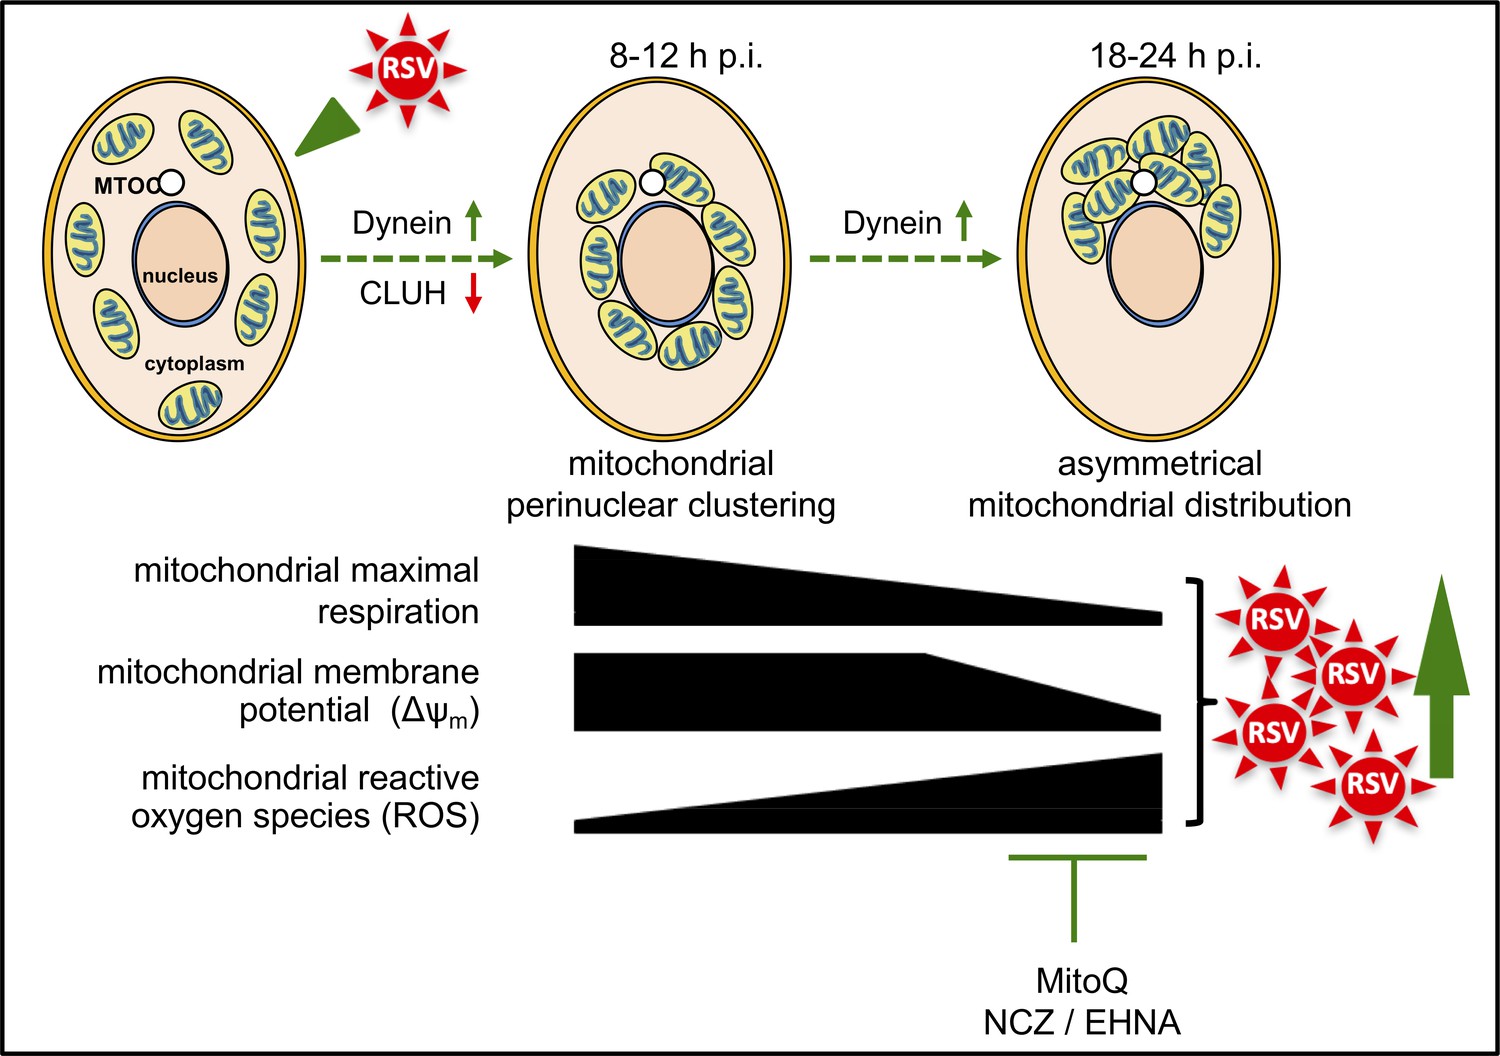
Schematic representation of the progressive host cell changes that favour RSV infection.
RSV infection induces changes in mitochondrial organization with mitochondrial perinuclear clustering early in infection (8–12 h p.i.), followed by asymmetric distribution of mitochondria close to the MTOC later in infection (18–24 h p.i.); both phases of mitochondrial redistribution (top) are dependent on dynein components (inhibited by siRNAs directed at DYNLT1 or DYNC1H1), with perinuclear clustering limited by CLUH (siRNA directed at CLUH increases perinuclear clustering, as well as mitochondrial ROS production and RSV virus production). Accompanying these changes, RSV infection inhibits host mitochondrial respiration, disrupts maintenance of mitochondrial membrane potential (Δψm) and enhances mitochondrial reactive oxygen species (ROS) generation. These events favour RSV infection as indicated by fact that RSV infectious virus production is decreased by disrupting microtubule organization using nocodazole (NCZ), by inhibiting the dynein-motor with EHNA, or using the mitochondrially-targeted antioxidant MitoQ.
Tables
Key resources table
| Reagent type (species) or resource | Designation | Source or reference | Identifiers | Additional information |
|---|---|---|---|---|
| Strain (Respiratory Syncytial Virus) | RSV A2 strain | PMID: 27464690 | ||
| Strain, Strain background (Respiratory Syncytial Virus) | eGFP-rRSV | PMID: 24418538 | Gift from Michael N Teng, University of South Florida | |
| Mouse strain, (M. musculus) | BALB/c | The Jackson Laboratory | #: 000651 | |
| Genetic reagent (H. sapiens) | DYNLT1 (siRNA) | GE Dharmacon, SMART pool | #: 6993 | Used for transfection (50 nM) |
| Genetic reagent (H. sapiens) | DYNC1H1 (siRNA) | GE Dharmacon, SMART pool | #: 1778 | Used for transfection (50 nM) |
| Genetic reagent (H. sapiens) | KLC1 (siRNA) | GE Dharmacon, SMART pool | #: 3831 | Used for transfection (50 nM) |
| Genetic reagent (H. sapiens) | CLUH (siRNA) | GE Dharmacon, SMART pool | #: 23277 | Used for transfection (50 nM) |
| Cell line (H. sapiens) | A549 | ATCC | CCL-185 | Mycoplasma tested and/or STR profiled |
| Cell line (Chlorocebus sp.) | Vero | ATCC | CCL-81 | |
| Cell line (H. sapiens) | BCi-NS1 | PMID: 24298994 | Provided by Alan Hsu, Philip M Hansbro, and Peter AB Wark, University of Newcastle | |
| Primary Cells (H. sapiens) | pBECs | PMID: 15781584 | Provided by Alan Hsu, Philip M Hansbro, and Peter AB Wark, University of Newcastle | |
| Antibody | Goat polyclonal anti-RSV | Abcam | Cat. #: ab20745, RRID:AB_777677 | IF (1:400) |
| Antibody | Mouse monoclonal anti-γ-tubulin | Proteintech | Cat. #: 66320–1-Ig | IF (1:300) |
| Antibody | Mouse monoclonal anti-α-tubulin | Santa Cruz | Cat. #: sc-5286, RRID: AB_628411 | IF (1:100), WB (1:5000) |
| Antibody | Rabbit polyclonal anti-Goat IgG, Secondary Antibody, Alexa Fluor 488 | ThermoFisher Scientific | Cat. #: 11078 RRID: AB_2534122 | IF (1:1000) |
| Antibody | Donkey polyclonal anti-Mouse IgG, Secondary Antibody, Alexa Fluor 647 | ThermoFisher Scientific | Cat. #: A-31571, RRID: AB_162542 | IF (1:1000) |
| Antibody | Alexa Fluor 488 phalloidin | ThermoFisher Scientific | Cat. #: A12379, RRID: AB_2315147 | IF (1:1000) |
| Antibody | Mouse monoclonal anti-DYNC1H (C-5) | Santa Cruz | Cat. #: sc-514579 | WB (1:500) |
| Antibody | Mouse monoclonal anti-DYNLT1 (H-11) | Santa Cruz | Cat. #: sc-365567, RRID: AB_10841719 | WB (1:1000) |
| Antibody | Mouse monoclonal anti-KLC1 (L2) | Santa Cruz | Cat. #: sc-58776, RRID: AB_784214 | WB (1:1000) |
| Antibody | Rabbit polyclonal anti-CLUH | ThermoFisher Scientific | Cat. #: PA5-71324, RRID: AB_2690757 | WB (1:1000) |
| Antibody | Goat polyclonal anti-Mouse IgG, HRP Conjugate Antibody | Promega | Cat. #: W4021, RRID: AB_430834 | WB (1:10,000) |
| Recombinant DNA reagent | CellLight Golgi-GFP *BacMam 2.0* | ThermoFisher Scientific | Cat. #: C10592 | |
| Recombinant DNA reagent | CellLight Mitochondria-RFP *BacMam 2.0* | ThermoFisher Scientific | Cat. #: C10601 | |
| Commercial assay or kit | Mouse RANTES ELISA Kit | RayBiotech Inc | Cat. #: ELM-RANTES | |
| Commercial assay or kit | LDH Cytotoxicity Detection Kit | Roche Applied Science | Cat. #: 11644793001 | |
| Commercial assay or kit | TMRE ΔψmAssay Kit | Abcam | Cat. #: ab113852 | Live-cell IF (50 nM) |
| Chemical compound, drug | Oligomycin | Seahorse XF Cell Mito Stress Test Kit | Cat. #: 103015–100 | SBA (1 μM) |
| Chemical compound, drug | FCCP | Seahorse XF Cell Mito Stress Test Kit | Cat. #: 103015–100 | SBA (1 μM) |
| Chemical compound, drug | Antimycin A | Seahorse XF Cell Mito Stress Test Kit | Cat. #: 103015–100 | SBA (1 μM) |
| Chemical compound, drug | Rotenone | Seahorse XF Cell Mito Stress Test Kit | Cat. #: 103015–100 | SBA (1 μM) |
| Chemical compound, drug | MitoQ | Health Manufacturing, New Zealand | Gift from Health Manufacturing, New Zealand | PA (0.5 μM), IF (1 μM) |
| Chemical compound, drug | Nocodazole | Sigma | Cat. #: M1404 | PA and IF (17 μM) |
| Chemical compound, drug | EHNA | Sigma | Cat. #: E114 | PA and IF (200 μM) |
| Chemical compound, drug | Monastrol | Sigma | Cat. #: M8515 | PA and IF (50 μM) |
| Chemical compound, drug | Cytochalasin D | Sigma | Cat. #: C8273 | PA and IF (2 μM) |
| Software, algorithm | Application Suite Advanced Fluorescence Lite | Leica | RRID:SCR_013673 | Version: 2.8.0, Build: 7266 |
| Software, algorithm | ZEN 2 | Zeiss | RRID:SCR_013672 | Blue edition |
| Software, algorithm | Fiji | Fiji (https://fiji.sc/) | RRID:SCR_002285 | Version 2.0.0-rc-64, Build: e0512e3c19 |
| Software, algorithm | Custom Scripts for Quantitative Analysis of Mitochondrial Distribution | Programmed in Python | This paper | Quantitative analyses of mitochondrial organization can be accessed via https://gitlab.erc.monash.edu.au/mmi/mito (Schulze, 2018; copy archived at https://github.com/elifesciences-publications/mito) |
| Software, algorithm | FlowJo | Tree Star, Inc (http://www.flowjo.com) | RRID:SCR_000410 | Version 10.5.3 |
| Software, algorithm | GraphPad Prism | GraphPad Prism (https://graphpad.com) | RRID:SCR_015807 | Version 6 |
| Software, algorithm | CellProfiler | Broad Institute Inc (http://cellprofiler.org/) | RRID:SCR_007358 | Version 3.1.8 |
| Other | DAPI stain | Sigma | Cat. #: 10236276001 | IF (1:15000) |
| Other | MitoTrackerRed CMXRos | ThermoFisher Scientific | Cat. #: M7512 | IF (100 nM) |
| Other | Hoechst stain (33342) | ThermoFisher Scientific | Cat. #: H3570 | Live-cell IF (1:2000) |
| Other | TPE-Ph-In | PMID: 26264419 | Gift from Yuning Hong, La Trobe University | Live-cell IF (1:2 μM) |
| Other | DCF | ThermoFisher Scientific | Cat. #: D399 | Live-cell IF (2.5 µM) |
| Other | Mitotracker Deep Red | ThermoFisher Scientific | Cat. #: M22426 | Live-cell IF (100 nM) |
| Other | FRR2 | PMID:26865422 | Gift from Jacek L Kolanowski and Elizabeth J New, the University of Sydney | Live-cell IF (2 μM) |
| Other | Biomeda Gel Mount | ProSciTech | Cat. #: EMS17985-11 | |
| Other | DharmaFECT siRNA transfection reagent | GE Dharmacon | Cat. #: T-2001–04 |
-
IF - immunofluorescence, PA- plaque assay, SBA - Seahorse Bioenergetics Analysis, WB - Western blot.
Additional files
-
Transparent reporting form
- https://doi.org/10.7554/eLife.42448.024
Download links
A two-part list of links to download the article, or parts of the article, in various formats.
Downloads (link to download the article as PDF)
Open citations (links to open the citations from this article in various online reference manager services)
Cite this article (links to download the citations from this article in formats compatible with various reference manager tools)
Respiratory syncytial virus co-opts host mitochondrial function to favour infectious virus production
eLife 8:e42448.
https://doi.org/10.7554/eLife.42448


