Light-based tuning of ligand half-life supports kinetic proofreading model of T cell signaling
- University of California, San Francisco, United States
Figures
Figure 1 with 4 supplements
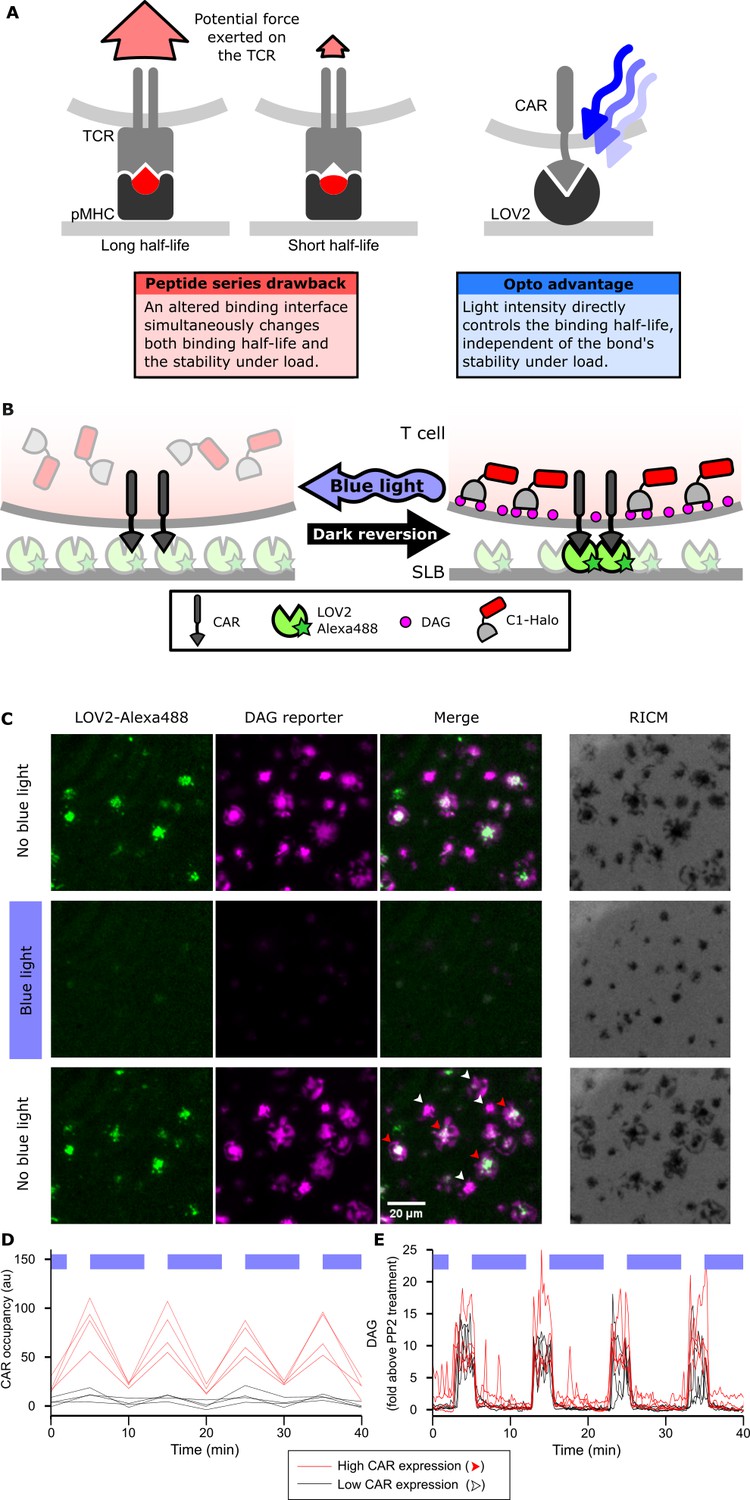
Strategy for testing kinetic proofreading with optogenetic tools.
(A) Conventional methods of mutating the pMHC to alter the binding half-life also change the binding interface, which changes several parameters at once. By contrast, optogenetic control allows light intensity to control ligand binding half-life while keeping the binding interface constant. Therefore, no other aspects of the receptor-ligand interaction change. Red and blue lines highlight the binding interfaces. (B) Schematic of experimental setup. Jurkat cells expressing a live cell DAG reporter and a Zdk-CAR are exposed to an SLB functionalized with purified, dye-labeled LOV2. In the dark, LOV2 binds to and accumulates under the receptor, and stimulates DAG production, recruiting the reporter to the plasma membrane. Blue light excites LOV2, inducing its dissociation from the receptor to terminate signaling. (C) Montage from a time course in which cells were alternately stimulated in the presence or absence of blue-light. White arrows highlight cells with low to undetectable receptor occupancy, and red arrows highlight cells with high receptor occupancy. (D and E) Cells with very different levels of receptor occupancy (D), can have similar DAG levels (E), suggesting that receptor occupancy is not a good predictor of DAG levels. Top blue bars indicate the presence of blue light.
Figure 1—figure supplement 1
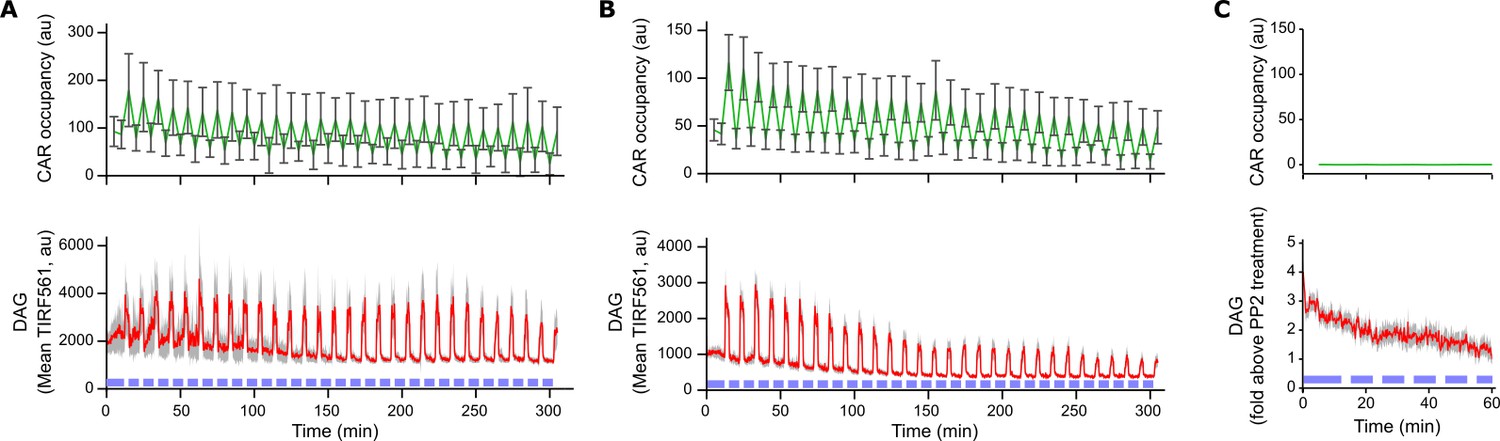
Light-based control of T cell signaling is durable for hours.
(A) Clonal Jurkat cells expressing both the Zdk-CAR and DAG reporter were exposed to periodic pulses of blue-light (blue bars near the x-axis) for five hours while on SLBs functionalized with LOV2. Plotting data from cells that were signaling at the end of the time course shows no apparent diminishment in the per-cell activity of ligand binding or DAG signaling over time. (B) Plotting data from all cells in the time course shows a modest reduction in ligand binding and DAG signaling. This was driven mostly by gradual cell contraction and withdrawing from contact with the SLB. Note that all experimental time courses in the paper are no longer than 60 min, a duration over which no appreciable decrease in ligand binding or DAG signaling is observed. DAG levels reported as mean TIRF561 instead of fold-above PP2 background, as cells were not treated with PP2 after the time course. (C) Cells adhered to SLBs without LOV2 show no light-dependent changes in either CAR occupancy or DAG levels upon blue light illumination. Cells were passively adhered to the SLB with a biotinylated anti-β2 microglobulin antibody. Error bars for CAR occupancy are too small to be visible. The full time course is shown in Video 4. All plots are mean with a 95% CI (two-sided Student’s t-test).
Figure 1—figure supplement 2
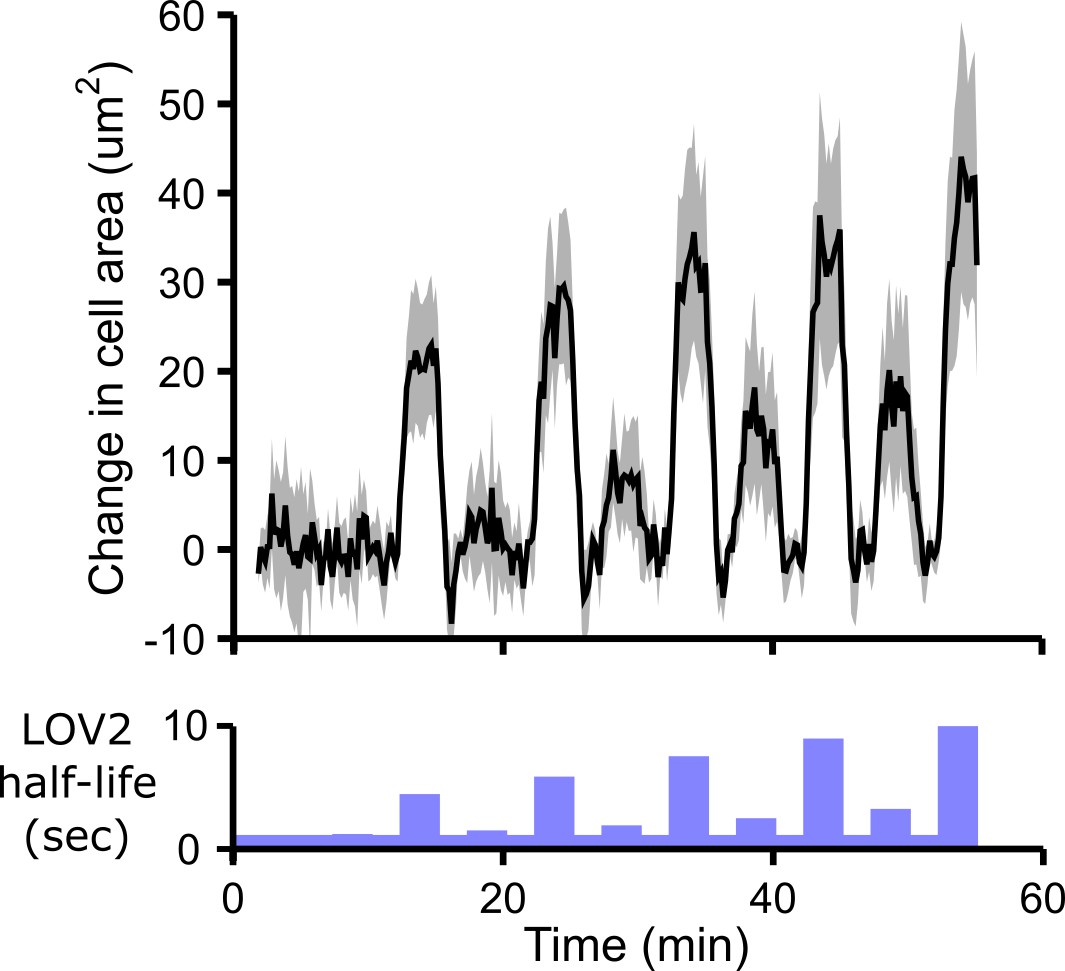
Cells spread in response to blue-light illumination.
In addition to increasing DAG production, antigen stimulation leads to increased cell spreading in T cells. We observe similar cell spreading following optogenetic stimulation of the CAR. Cell area was measured over time using reflection interference contrast microscopy (RICM). Cells show larger increases in cell area in response to longer LOV2 binding half-lives, providing another indicator of cell stimulation in addition to DAG production. Because cells slowly contract over the imaging time course, we show the change in cell area during each pulse of blue light. The baseline drift was measured by measuring the absolute cell area during the strong ‘control’ pulses of blue light regularly spaced throughout the time course (see Figure 2—figure supplement 2). This baseline drift was subtracted from the absolute cell area to yield the change in cell area. See Video 5 for the complete animated time course. n = 31 cells. Mean with 95% CI (two-sided Student’s t-test).
Figure 1—figure supplement 3
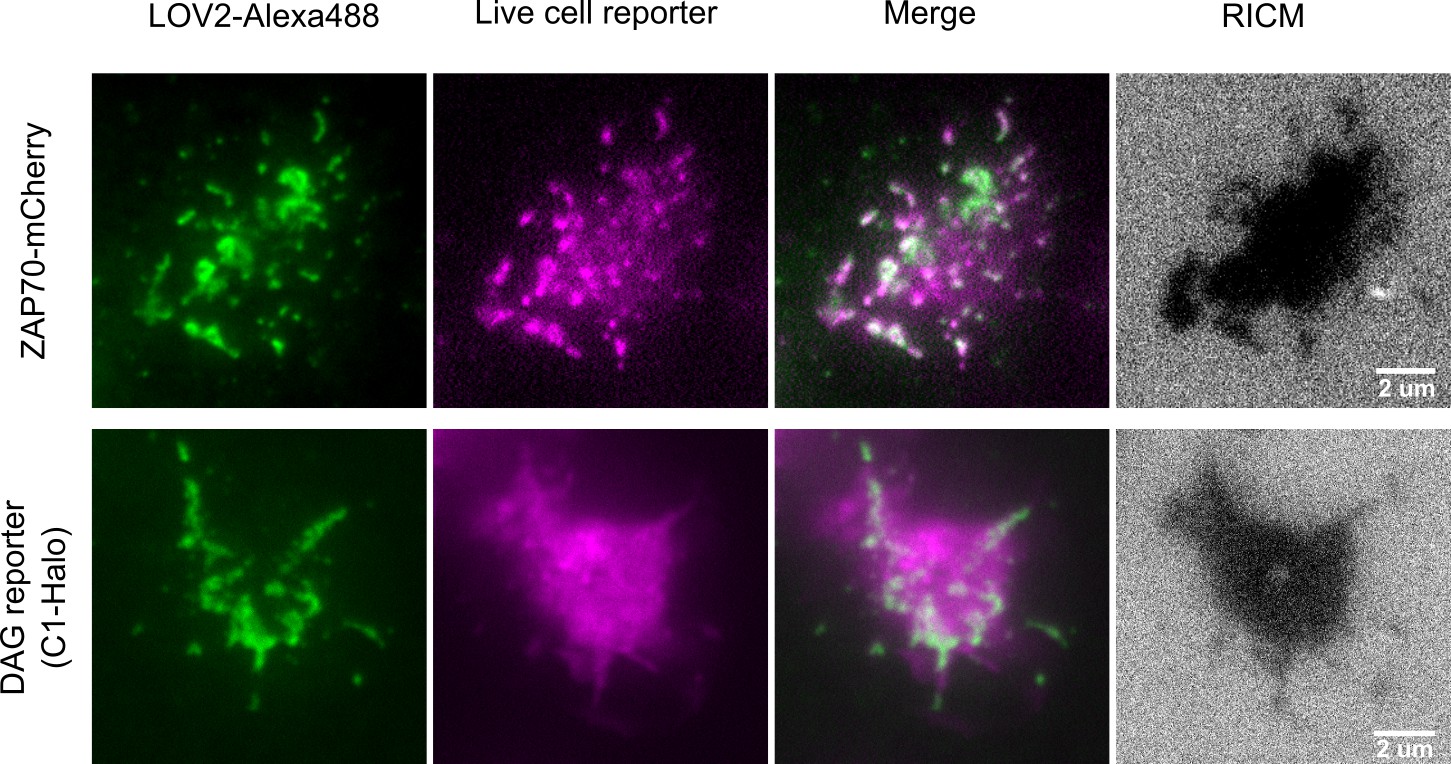
Colocalization of ligand binding and downstream signaling.
Higher magnification TIRF images show how ligand binding to the CAR spatially relates to downstream signaling reporters. Jurkat cells expressing the CAR and either a ZAP70-mCherry or DAG reporter were imaged on supported lipid bilayers functionalized with LOV2. All LOV2-Alexa488 molecules are revealed by TIRF, however brighter green regions indicate where LOV2 accumulates because of binding the CAR. A ZAP70-mCherry reporter (purple) colocalizes well with sites of LOV2 binding, which is expected as ZAP70 directly binds the phosphorylated ITAMs of the CAR. The DAG reporter (purple) shows a roughly diffuse localization throughout the cell which is consistent with DAG diffusing away from sites of production. The LOV2-CAR interactions and reporter activities are only observed within the cell footprint (RICM). Imaged with a Nikon 1.49NA 100x Apo TIRF objective.
Figure 1—figure supplement 4
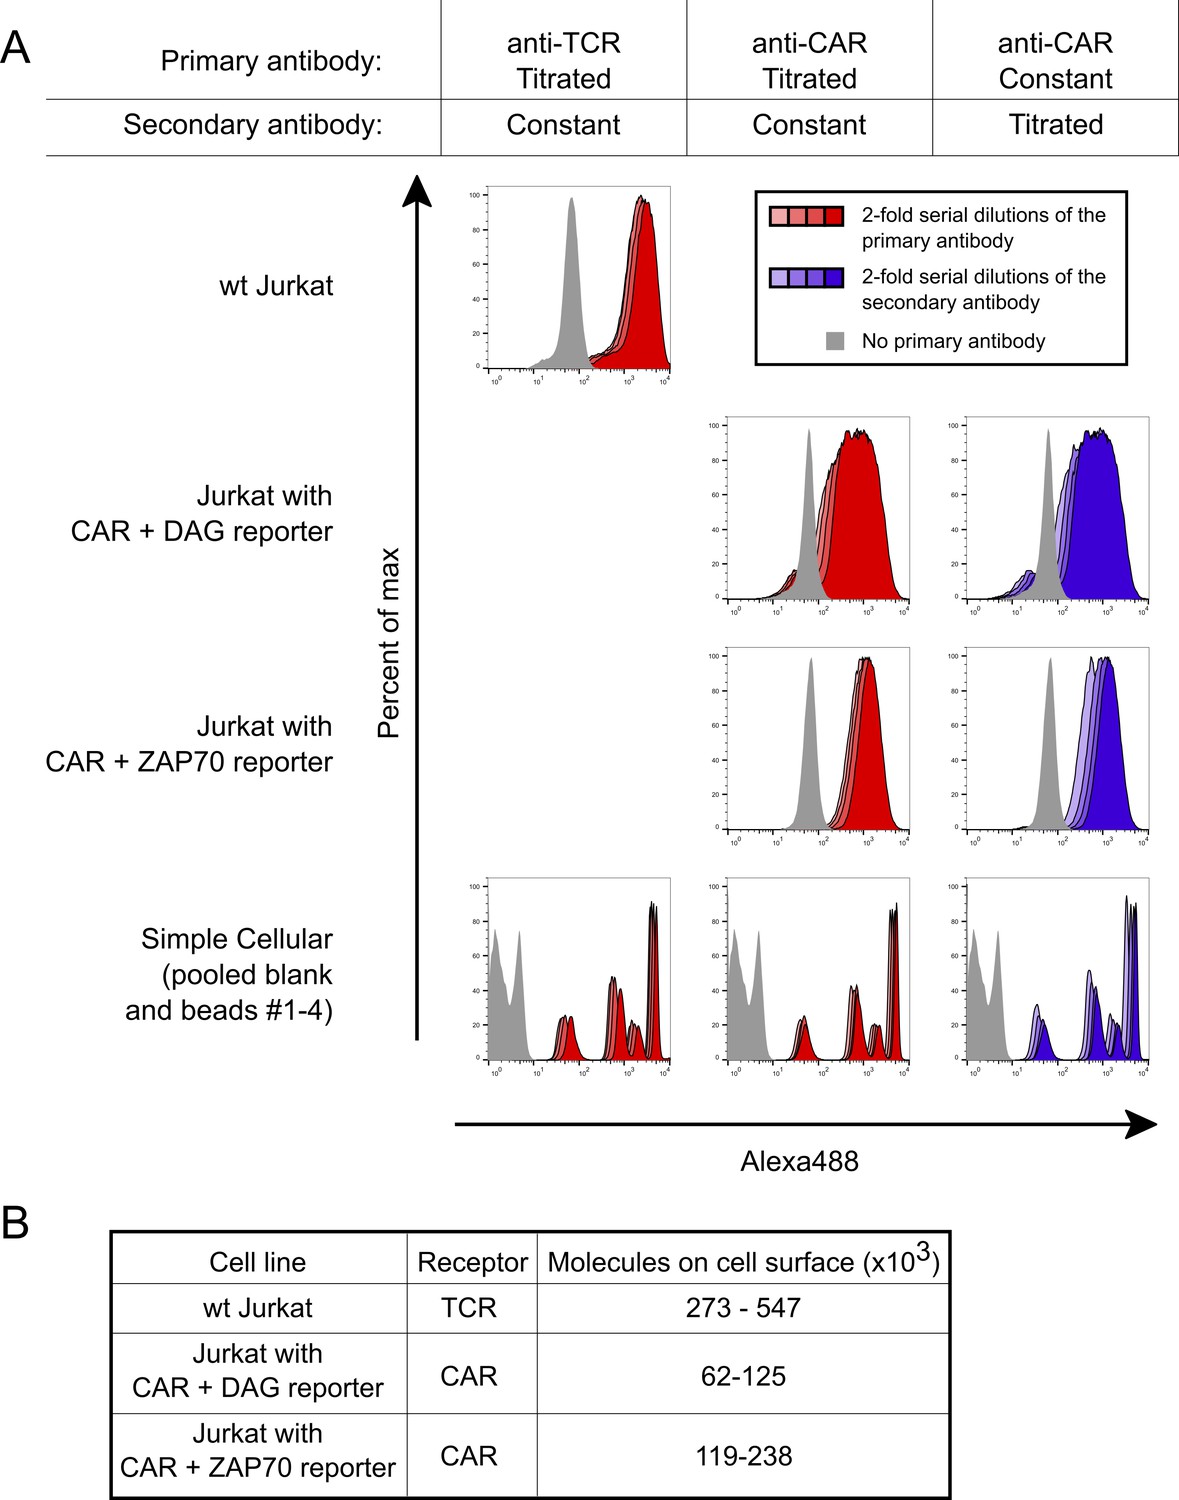
Absolute quantification of cell surface TCRs and CARs.
The number of cell surface exposed TCRs and CARs was measured using beads with known antibody binding capacities and flow cytometry. (A) To ensure measurements were made at saturating antibody concentrations, high concentrations of antibodies were used. Saturation was verified by serially diluting each antibody individually with resulting negligible changes in MFI. Staining under saturating antibody conditions are shown for the primary antibodies in red and the secondary antibody in blue. The primary antibodies OKT3 and OKT8 were used to stain for the TCR and CAR, respectively, while a goat anti-mouse Alexa488 antibody was used as the secondary. Three 2-fold serial dilutions of each antibody are shown in lighter shades, which nearly overlap the saturating condition. Light gray indicates no primary antibody was used. (B) The absolute number of cell surface TCRs or CARs were calculated for each cell line based on the MFI of the population. Because the bead standards bind a known number of IgG primary antibodies and each primary antibody could bind between one to two receptors, we report a two-fold range for the number of each receptor.
Figure 2 with 3 supplements
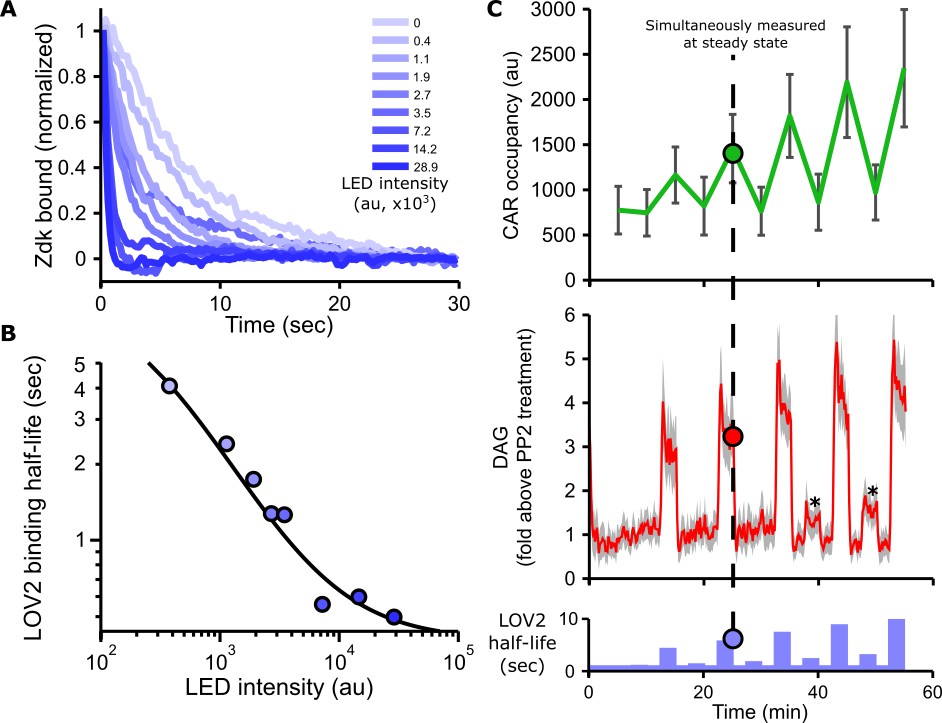
Blue light intensity titrates binding half-life, CAR occupancy and DAG levels.
(A) In vitro measurements of blue light intensity-based control of LOV2-Zdk binding half-life. SLBs functionalized with LOV2 were combined with soluble, dye-labeled Zdk. After washing out free Zdk, Zdk dissociation was measured upon acute illumination with different intensities of blue light using TIRF microscopy. (B) Blue light intensity enforces LOV2-Zdk binding half-lives from ten seconds to hundreds of milliseconds. Binding half-lives were determined by fitting a single exponential decay to the traces shown in A). Data was fit using a two-step unbinding model (solid black line), consisting of light-dependent excitation of LOV2 followed by light-independent release of Zdk. (C) Time course showing that intermediate light levels modulate ligand binding half-lives (bottom), titrate receptor occupancy (top), and induce DAG accumulation in Jurkat cells (middle). Asterisks in middle panel highlight small but detectable increases in DAG levels to weak stimuli. n = 31 cells. Mean with 95% CI (two-sided Student’s t-test).
Figure 2—figure supplement 1

Purification of LOV2 and Zdk1.
(A) Schematic of LOV2 construct expressed in E. coli. Arrow indicates TEV protease cleavage site. The Avitag is biotinylated by BirA, which was co-expressed in the cells. KCK tag used for maleimide dye labeling. Not to scale. (B) Schematic of Zdk1 construct expressed in E. coli. SenP2 cleaves after the SUMO3 domain (arrow). Not to scale. (C and D) Samples from different stages of the protein purifications were run by SDS-PAGE and stained with Coomassie Blue R250. WCL: whole cell lysate. Soluble: soluble fraction after ultracentrifugation of the whole cell lysate. IMAC FT: Immobilized metal affinity chromatography flow through. IMAC eluate: Protein eluted from the IMAC column. Rebinding FT: Protein flow through after recirculating the SenP2 digest over an IMAC column. SEC: Size exclusion chromatography. fl: full length.
Figure 2—figure supplement 2
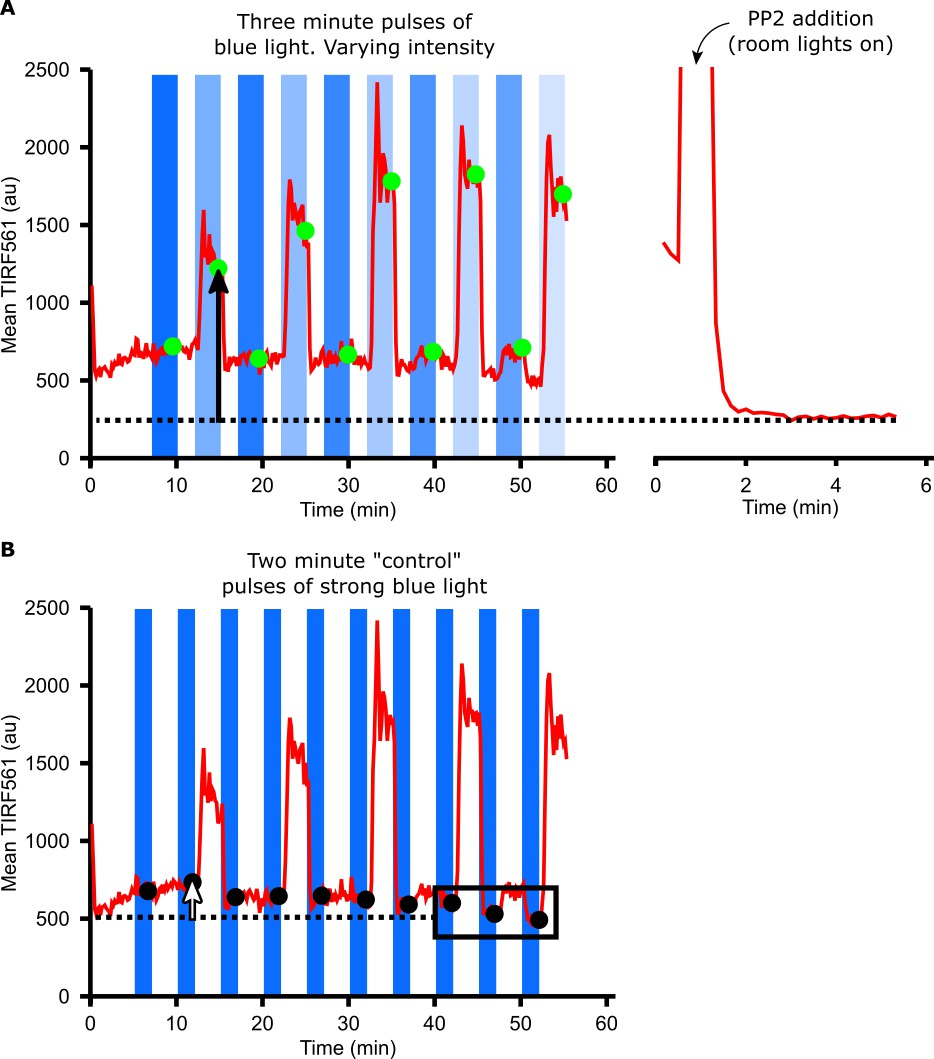
Calculating DAG levels.
(A) Mean TIRF561 pixel intensities within the cell mask are plotted over time. TIRF561 signals at steady state (green circles) are calculated as the average of frames taken during the last minute of a three-minute hold in blue light. DAG levels (black arrow) are measured as the difference between the TIRF561 signal at steady state compared to after treatment with PP2 (dotted line). (B) Changes in the baseline TIRF561 signal can impair our ability to detect small increases in DAG levels. To correct for this, the TIRF561 signal was measured after two-minute ‘control’ pulses of identical, higher intensity blue light (black circles). Baseline changes (white arrow) were measured as the difference between the TIRF561 signal after a control pulse of blue light and the average of the last three control pulses (dotted line). This baseline drift was subtracted from the DAG levels measured in A) to yield the raw, unnormalized DAG level of each cell.
Figure 2—figure supplement 3

Calculating CAR occupancy.
(A) RICM images were used to construct a cell mask and a local background mask. When used to mask the TIRF488 images, the fluorescence within the cell mask is the sum of freely diffusing LOV2 and LOV2 bound to the CAR, while the fluorescence within the background mask reflects freely diffusing LOV2 only. The CAR occupancy is calculated as the difference in mean TIRF488 pixel intensity between the cell mask region and the background region. (B) The measured CAR occupancy is affected by both photobleaching and power fluctuations in the 488 nm laser. To correct for this, integrated whole field TIRF488 intensities were measured over time and normalized to their mean values. Initial CAR occupancies measured in A) were divided by the normalized whole-field TIRF488 values to yield the final CAR occupancy measurement.
Figure 3 with 2 supplements
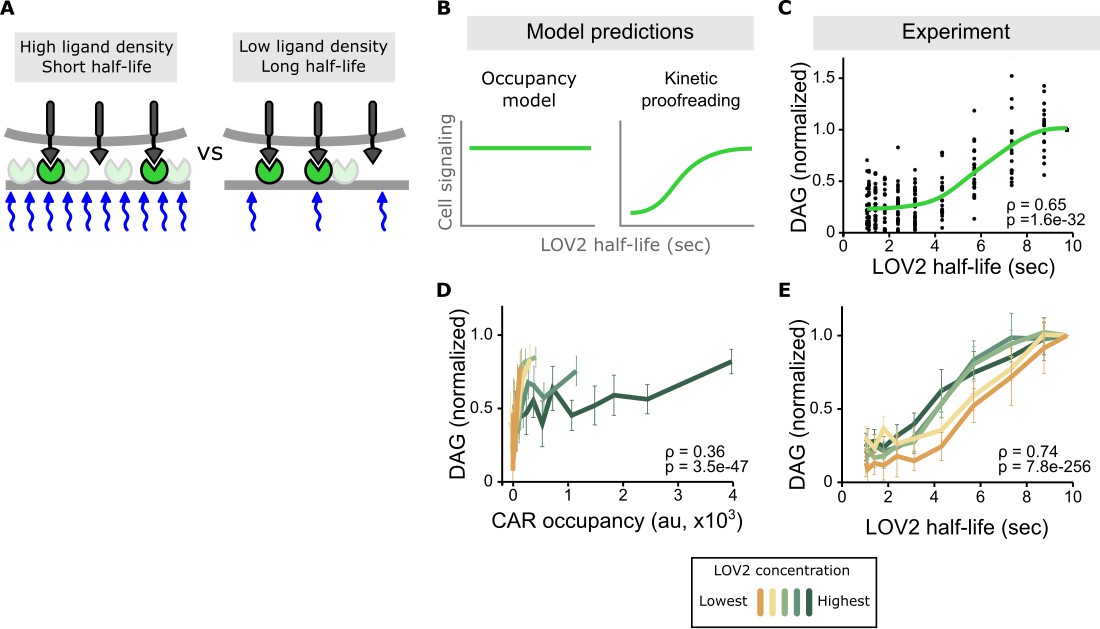
Binding half-life, not receptor occupancy, dominates CAR signaling.
(A) A cell exposed to a high LOV2 density but a short binding half-life can have the same receptor occupancy as a cell exposed to a low LOV2 density but a long binding half-life. (B) At constant receptor occupancy, an occupancy model predicts binding half-life should have no effect on signaling, while kinetic proofreading predicts that increasing binding half-life should increase signaling. (C) At constant receptor occupancy, increasing ligand binding half-life increases DAG signaling, as shown by both non-parametric kernel smoothing regression (green line) and Spearman’s correlation coefficient (ρ). Each black dot is a single cell measurement obtained from multiple experiments over a range of LOV2 concentrations. (D and E) During individual experiments, there is a fixed concentration of LOV2, meaning that both receptor occupancy and binding half-life change in response to blue-light. We measured Spearman’s correlation coefficient to ask whether DAG levels were best described as a function of receptor occupancy or binding half-life across different LOV2 concentrations. DAG levels are more correlated with binding half-life (E) than they are with CAR occupancy (D). This is reflected in the fact that the DAG response curves nearly overlap with each other when plotted as a function of binding half-life, indicating changing the concentration of LOV2 has little effect on downstream signaling. These data are consistent with binding half-life, not receptor occupancy, dominating CAR signaling. The mean is plotted with a 95% CI (two-sided Student’s t-test).
Figure 3—figure supplement 1
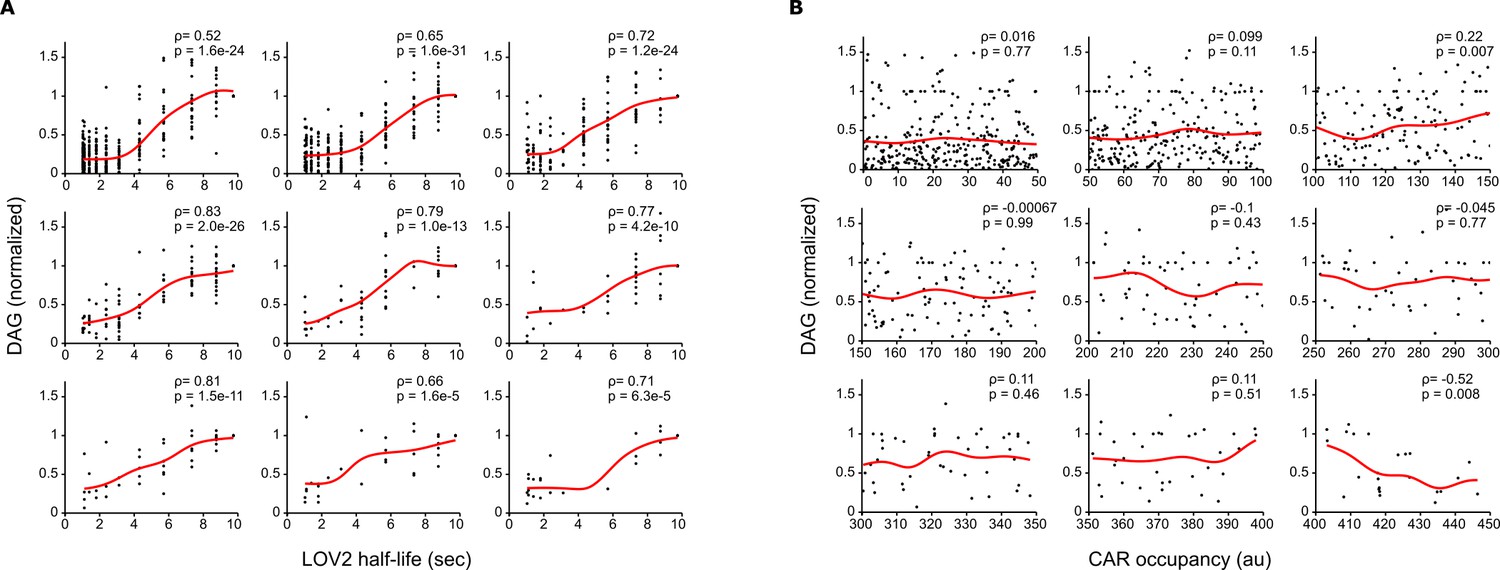
Long LOV2 binding half-lives signal better than short binding half-lives, even at equal receptor occupancy.
(A) Single cell measurements were binned together over narrow ranges of CAR occupancy, and DAG levels were plotted as a function of LOV2 binding half-life. Long LOV2 binding half-lives lead to higher DAG levels, despite nearly identical receptor occupancies. Each plot shows data from a different narrow range of CAR occupancy. (B) Single cell DAG measurement from A) are plotted over their narrow range of CAR occupancies. Grid positions of plots in A) correspond to those in B). Over these narrow ranges, there is no correlation between CAR occupancy and DAG levels, indicating that the increasing DAG levels observed in A) are due to increasing binding half-life and not small increases in receptor occupancy.
Figure 3—figure supplement 2
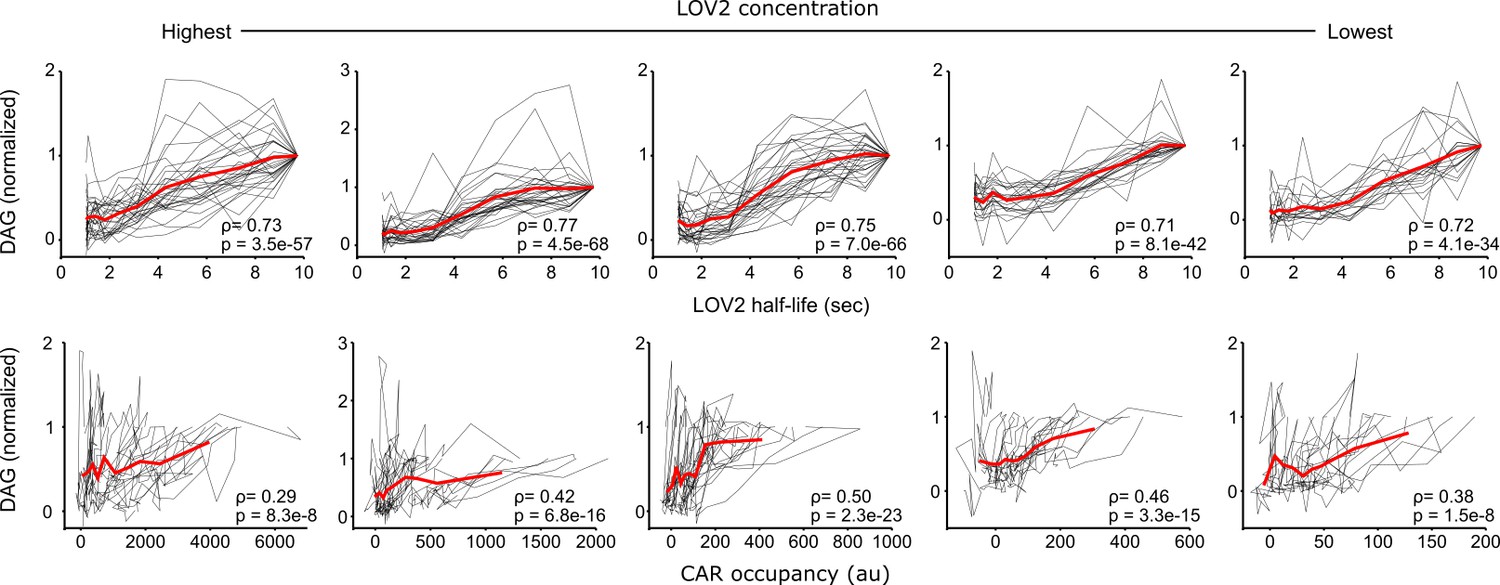
DAG levels are most strongly correlated with ligand binding half-life.
DAG levels from cell stimulated with the same intensities of blue light but different LOV2 concentrations are plotted as a function of receptor occupancy or ligand binding half-life. Each black line connects measurements from the same cell. The mean response is plotted in red. DAG levels correlate better to ligand binding half-life than they do to receptor occupancy, indicating that binding half-life strongly influences downstream CAR signaling. ρ is Spearman’s correlation coefficient and p denotes the p-value.
Figure 4 with 3 supplements

A kinetic proofreading model best explains T cell signaling.
(A) Models for how CAR occupancy and binding half-life affect T cell signaling in the presence of moderate (left) or no kinetic proofreading (middle). To facilitate visualization, single cell measurements were fit with non-parametric kernel smoothing regression and plotted as a heat map (right). The degree of proofreading is denoted by n, and the value of n for the moderate proofreading scenario is derived from single cell measurements from all three data sets. (Figure 4—figure supplement 1). Experimental data of DAG levels as a function of CAR occupancy and binding half-life (right) is consistent with moderate kinetic proofreading. (B) Schematic of our kinetic proofreading model. After a ligand binds the receptor, it must remain bound sufficiently long to accommodate the slow proofreading steps. Long lived ligands survive this slow waiting period and produce strong downstream signaling, while short lived ligands dissociate and produce weak downstream signaling.
-
Figure 4—source data 1
This spreadsheet contains all the single cell data used in this study.
It includes measurements of receptor occupancy, ligand binding half-life and cell signaling (either DAG levels or ZAP70 recruitment).
- https://doi.org/10.7554/eLife.42498.025
Figure 4—figure supplement 1
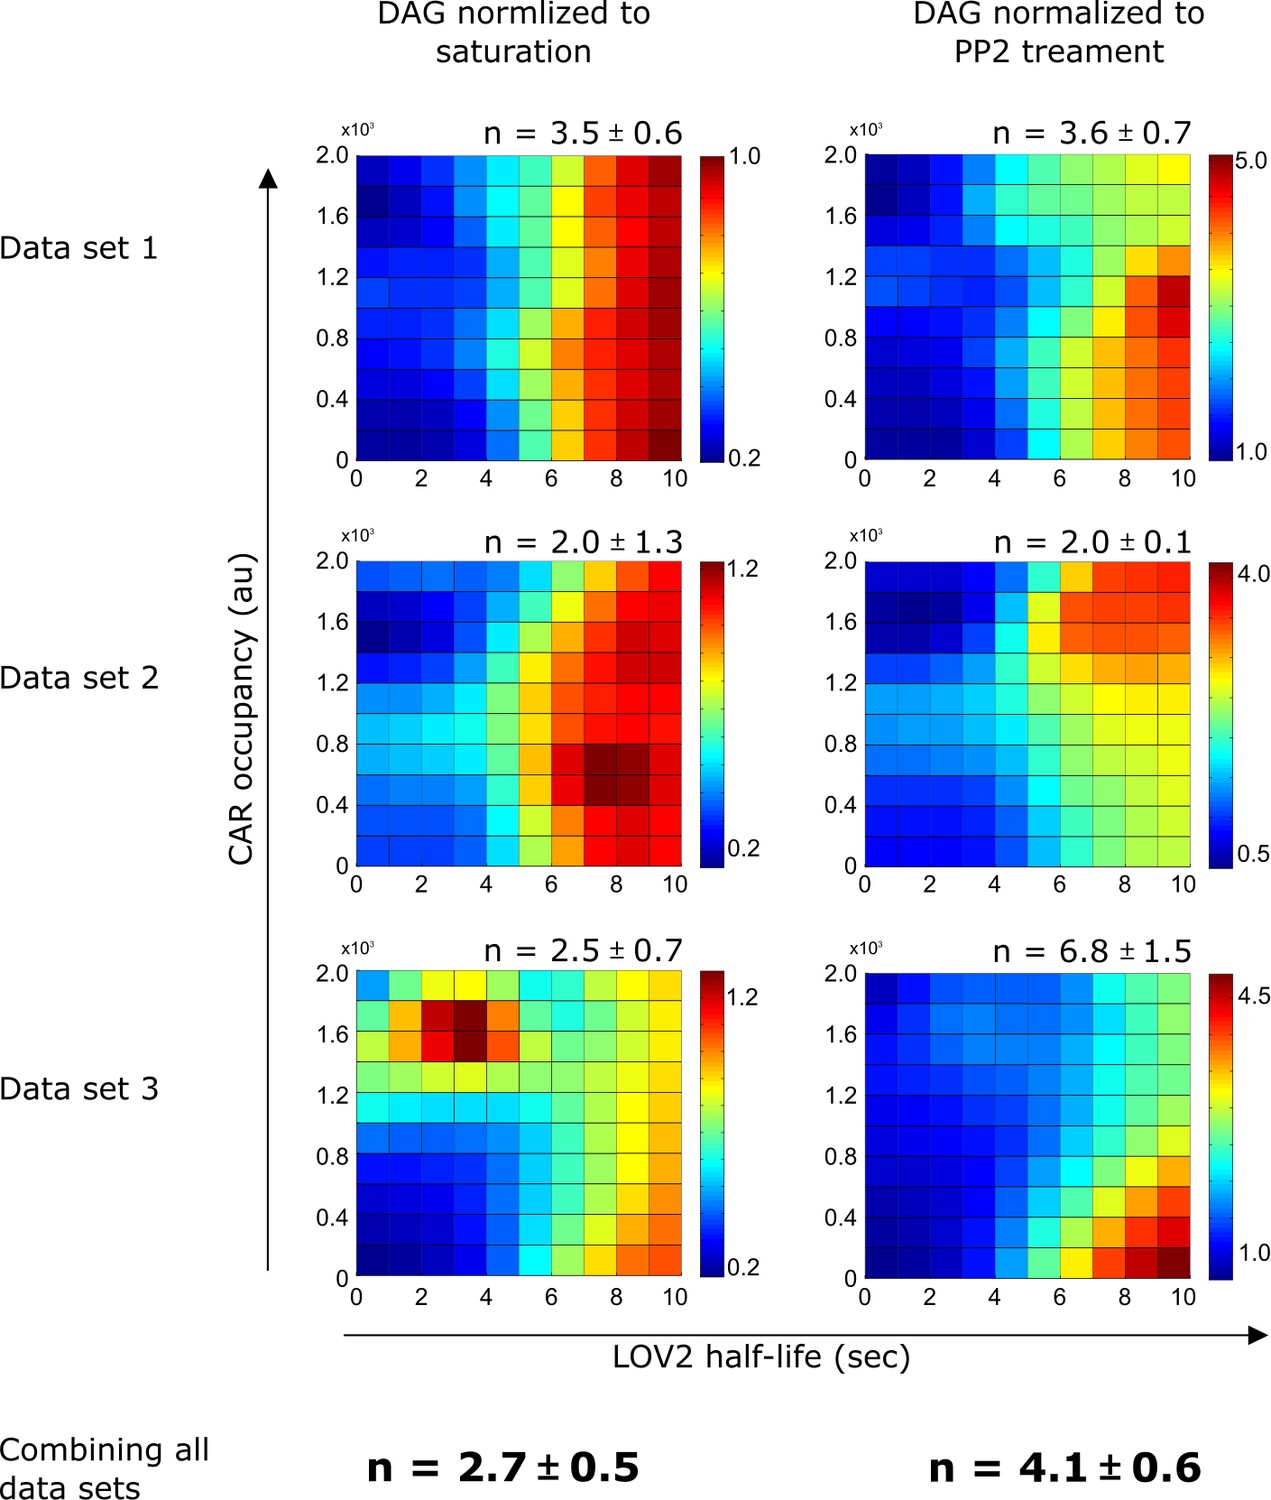
DAG normalization method only has a minor effect on the calculated degree of proofreading.
Regardless of normalization method, DAG levels are strongly influenced by LOV binding half-life and produce similar degrees of proofreading (n). Heat maps of DAG signaling were generated by fitting single cell DAG measurements with non-parametric kernel smoothing regression for all three data sets under both DAG normalization schemes. See Figure 4—figure supplement 2 for an explanation of the normalization schemes. n is the degree of proofreading calculated by fitting the single cell DAG measurements to our kinetic proofreading model (Supplemental Equation 7), reported with a 95% confidence interval. We favored normalizing to saturation, as it provided a more conservative estimate of n. Each data set is a biological replicate.
Figure 4—figure supplement 2
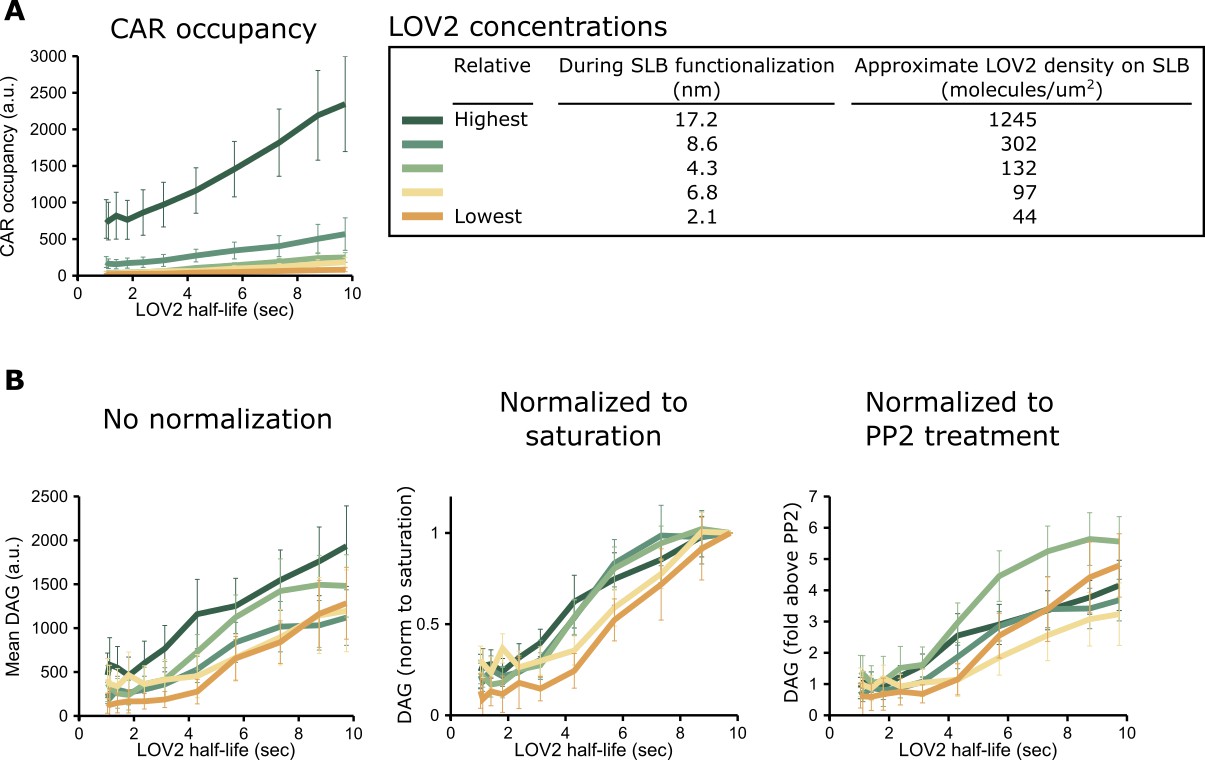
Justification for DAG normalization.
(A) Different concentrations of the LOV2 ligand on the SLB drive very different CAR occupancies, as expected. CAR occupancy was mostly linear in response to changing half-lives, suggesting that we operated far from saturation and that neither free CAR nor unbound LOV2 were limiting. (B) By contrast, DAG levels were largely unaffected by large changes in LOV2 concentration, even without normalization (left). Because variation in the DAG reporter expression level affects the raw DAG values, we normalized the data in one of two ways. We either normalized the DAG response relative to a cell’s saturation point (middle) or relative to the background fluorescence from reporter in the cytosol after treatment with PP2, a Src family kinase inhibitor (right). Higher reporter expression produces a higher TIRF signal in this non-signaling state.
Figure 4—figure supplement 3

ZAP70 recruitment does not show evidence of kinetic proofreading.
Unlike DAG levels, ZAP70 recruitment is dominated by CAR occupancy and is relatively unaffected by the LOV2 binding half-life. Because the ZAP70 reporter is not compatible with the anti-β2 microglobulin antibody, corresponding data sets of the DAG reporter without the antibody were also acquired (bottom row; see Materials and methods for a full explanation). Heat maps were generated by fitting single-cell measurements using non-parametric kernel smoothing regression. Each heat map represents an independent data set. n is the degree of proofreading calculated by fitting the single cell measurements to our kinetic proofreading model (Supplemental Equation 7, substituting DAG levels for ZAP70 recruitment where appropriate), reported with a 95% confidence interval. Each heat map represents a biological replicate.
Scheme 1
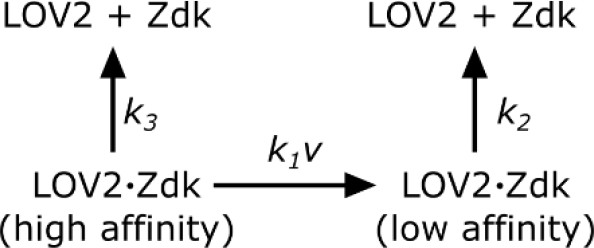
Zdk dissociation from LOV2.
https://doi.org/10.7554/eLife.42498.027
Scheme 2
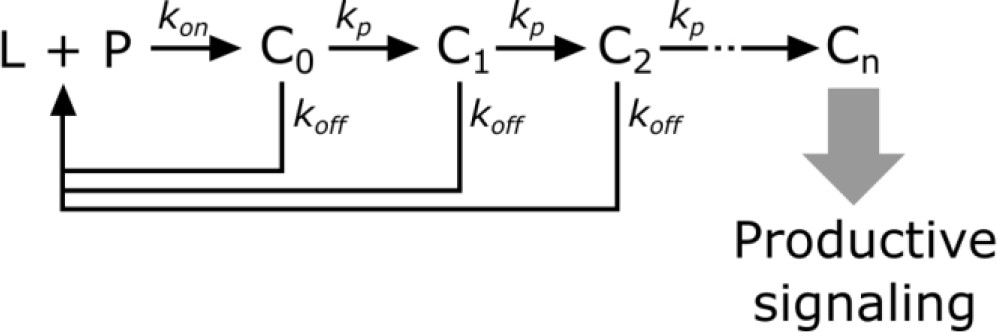
Kinetic proofreading steps.
https://doi.org/10.7554/eLife.42498.028Videos
Video 1
LOV2 reversibly binds the CAR.
Time course showing the photoreversible binding of LOV2-Alexa488 to cells expressing the Zdk-CAR in the presence or absence of strong blue light. Images taken in TIRF with a 488 nm laser. Because the 488 nm laser strongly activates LOV2, LOV2 localization can only be imaged at the end of a pulse of blue light (every five minutes). The mean response of the cells is plotted.
Video 2
LOV2 quickly unbinds the CAR.
Time course showing that LOV2 binds and unbinds the CAR on the order of seconds in response to blue light. To track LOV2 binding in real time, LOV2 was labeled with Cy3 (instead of Alexa 488 which is used in the rest of the paper) and imaged in TIRF with a 561 nm laser. Such real-time imaging of LOV2 localization could not be used throughout the paper, as the 561 nm laser used to image the DAG reporter was the only laser on the microscope that did not activate LOV2. The dark holes are imperfections in the supported lipid bilayer.
Video 3
DAG signaling is photoreversible.
Time course showing optogenetic control CAR signaling, as measured by the photoreversible accumulation of DAG in the presence or absence of strong blue light. Cells are the same as in Video 1, imaged in TIRF with a 561 nm laser. The mean response of the cells is plotted.
Video 4
DAG signaling is LOV2-dependent.
Time course showing that in the absence of LOV2, the cells fail to exhibit blue light-induced changes in DAG accumulation. Jurkat cells expressing both the Zdk-CAR and DAG reporter were passively adhered to an SLB lacking LOV2 with a biotinylated anti-β2 microglobulin antibody and were exposed to the same pulses of blue light as in Video 1. We observed spontaneous flashes of DAG but no changes in DAG accumulation in response to blue light illumination. Cells were imaged in TIRF with a 561 nm laser. The mean response of the cells is plotted.
Video 5
Light-based titration of cell spreading.
Time course showing RICM images of cells exposed to intermediate blue-light intensities. The mean response of cell spreading is plotted.
Video 6
Light-based titration of CAR occupancy.
Time course showing the quantification of receptor occupancy (via LOV2 localization) in response to intermediate blue-light intensities. Because the 488 nm laser strongly activates LOV2, LOV2 localization can only be imaged at the end of a pulse of blue light (every five minutes). Cells are the same as in Video 5, imaged in TIRF with a 488 nm laser. The mean response of the cells is plotted.
Video 7
Light-based titration of DAG signaling.
Time course showing the quantification of DAG levels in response to intermediate blue-light intensities. Cells are the same as in Video 5, imaged in TIRF with a 561 nm laser. The mean response of the cells is plotted.
Tables
Key resources table
| Reagent type (species) or resource | Designation | Source or reference | Identifiers | Additional information |
|---|---|---|---|---|
| Recombinant DNA reagent | C1-Halo | PMID: 17629516 | Dr. Mark M Davis (Stanford University) | |
| Recombinant DNA reagent | ZAP70-mCherry | PMID: 23840928 | Dr. Jay Groves (UC Berkeley) | |
| Recombinant DNA reagent | LOV2 (V529N) | PMID: 27427858, PMID: 18604202 | Dr. Klaus Hahn (UNC Chapel Hill) | |
| Recombinant DNA reagent | Zdk1 (purified) | PMID: 27427858 | Dr. Klaus Hahn (UNC Chapel Hill) | |
| Recombinant DNA reagent | Zdk-CAR | This paper and PMID: 1705867 | Zdk1 was fused to the N-terminus of an existing CD8 CAR, provided by Dr. Art Weiss (UCSF) | |
| Cell line (H. sapiens, male) | Jurkat | PMID: 6327821 | RRID: CVCL_0367 | Dr. Art Weiss (UCSF) |
| Cell line (H. sapiens, male) | Jurkat expressing Zdk-CAR and C1- Halo reporter | This paper. | A clonal Jurkat line expressing the Zdk-CAR and C1-Halo reporter made via lentiviral transduction. | |
| Cell line (H. sapiens, male) | Jurkat expressing Zdk-CAR and ZAP70 -mCherry reporter | This paper. | A clonal Jurkat line expressing the Zdk-CAR and ZAP70-mCherry reporter made via lentiviral transduction. | |
| Antibody | Mouse anti-human B2 microglobulin | BioLegend | Cat. #: 316308 RRID: AB_493689 | Cells labeled at 0.5 ug/ml in growth media. |
| Chemical compound, drug | PP2 | abcam | Cat. #: ab120308 | Used at 10 uM |
| Chemical compound, drug | Halo dye (JF549) | PMID: 25599551 | Dr. Luke Lavis (Janelia Research Campus) | |
| Chemical compound, drug | Alexa Fluor 488 C5 Maleimide | ThermoFisher Scientific | Cat. #: A10254 | |
| Chemical compound, drug | Sulfo-Cyanine3 maleimide | Lumiprobe | Cat. #: 11380 | |
| Chemical compound, drug | POPC | Avanti Polar Lipids | Cat. #: 850457C | |
| Chemical compound, drug | PEG-PE | Avanti Polar Lipids | Cat. #: 880230C | |
| Chemical compound, drug | biotinyl CAP PE | Avanti Polar Lipids | Cat. #: 870277X |
Table 1
Plasmids use in this study.
The plasmid name, the expressed protein, and a brief description of the construct are given. The entire coding regions of all constructs were verified by Sanger Sequencing. Plasmids and detailed maps are available from Addgene.
| Plasmid | Expressed protein | Backbone | Description |
|---|---|---|---|
| pDT326 | DAG reporter | pHR (James and Vale, 2012) | C1 domains mPKCθ (aa 45–166)-HaloTag |
| pDT481 | Zdk1 | pETM11-SUMO3 | 10xHis-TEV-SUMO3-KCK-SpyCatcher-GS linker-Zdk1 |
| pDT523 | ZAP70 reporter | pHR | hZAP70-mCherry |
| pDT537 | Zdk-CAR | pHR (James and Vale, 2012) | IgK ss-HA tag-Zdk1-GS linker-hCD8α (aa 22–208)-mCD3ζ (aa 52–164)-tagBFP |
| pDT552 | LOV2 | pETM11-SUMO3 | 10xHis-TEV-AviTag-KCK-LOV2 V529N |
Additional files
-
Transparent reporting form
- https://doi.org/10.7554/eLife.42498.029
Download links
A two-part list of links to download the article, or parts of the article, in various formats.
Downloads (link to download the article as PDF)
Open citations (links to open the citations from this article in various online reference manager services)
Cite this article (links to download the citations from this article in formats compatible with various reference manager tools)
Light-based tuning of ligand half-life supports kinetic proofreading model of T cell signaling
eLife 8:e42498.
https://doi.org/10.7554/eLife.42498


