Natural depletion of histone H1 in sex cells causes DNA demethylation, heterochromatin decondensation and transposon activation
- John Innes Centre, United Kingdom
Figures
Figure 1 with 1 supplement
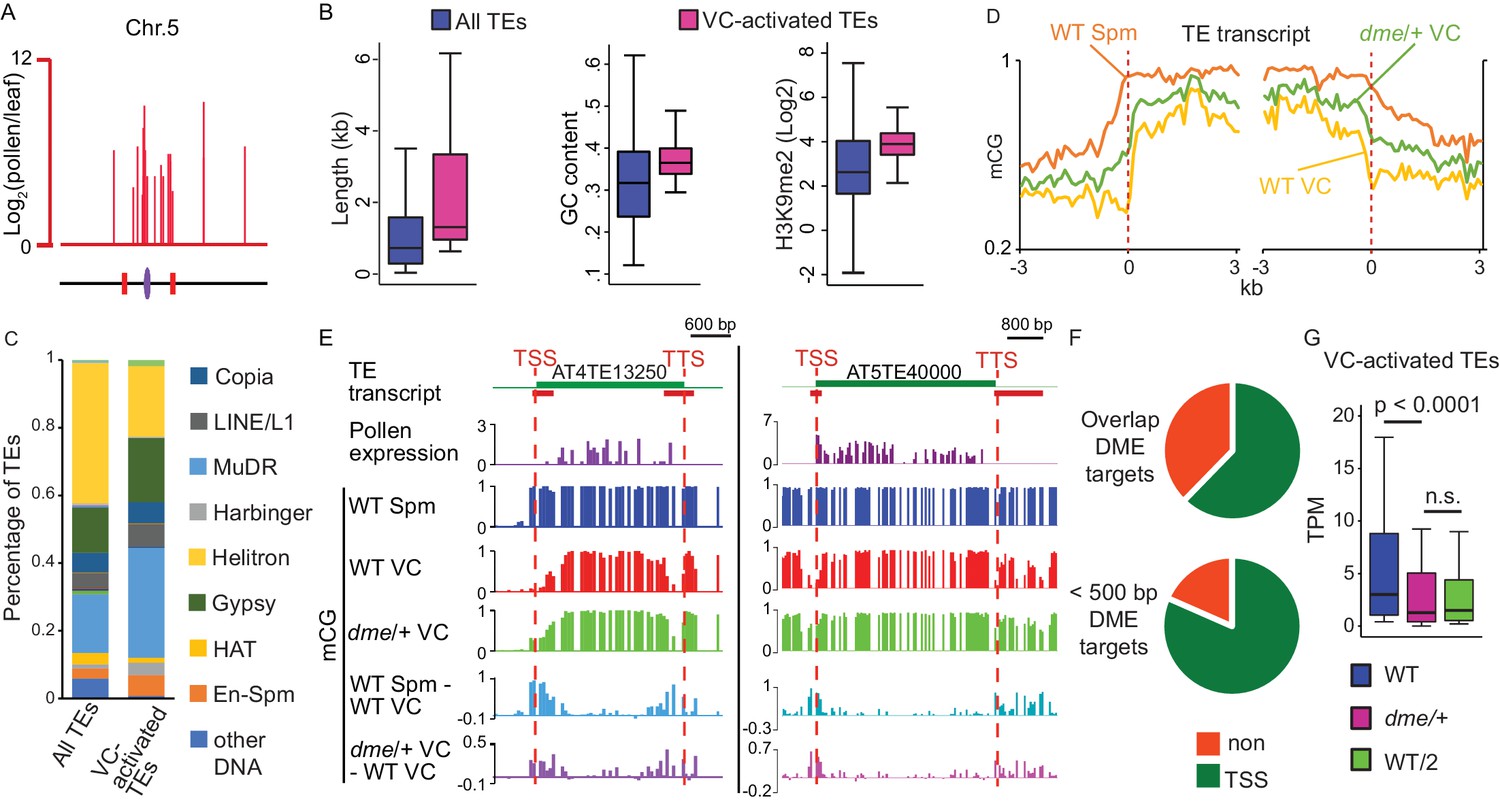
VC-activated TEs are heterochromatic and demethylated by DME.
(A) Expression and locations of VC-activated TEs along Chromosome 5. The purple ellipse and red bars indicate the centromere and borders of pericentromeric regions, respectively. (B) Box plots showing the length, GC content, and H3K9me2 level of TEs. Each box encloses the middle 50% of the distribution, with the horizontal line marking the median and vertical lines marking the minimum and maximum values that fall within 1.5 times the height of the box. Difference between the two datasets compared for each feature is significant (Kolmogorov-Smirnov test p<0.001). (C) Percentages of TEs classified by superfamily. (D) VC-activated TEs were aligned at the TSS and TTS (dashed lines), respectively, and average CG methylation levels for each 100 bp interval were plotted (referred to as ends analysis). (E) Snapshots demonstrating the expression (Log2RPKM), absolute and differential CG methylation at two example VC-activated TEs. Red lines under TE annotations indicate VC DME targets. Spm, sperm. (F) Pie charts illustrating percentages of VC-activated TEs with TSS overlapping (top) or within 500 bp (bottom) of VC DME targets. (G) Box plot showing the expression level of VC-activated TEs in pollen from WT and dme/+ heterozygous mutant. WT/2 shows half of the WT expression level. Wilcoxon matched-pairs signed-rank test is used. n.s., no significance.
-
Figure 1—source data 1
List of VC-activated TEs.
- https://doi.org/10.7554/eLife.42530.005
-
Figure 1—source data 2
List of VC DME targets.
- https://doi.org/10.7554/eLife.42530.006
Figure 1—figure supplement 1
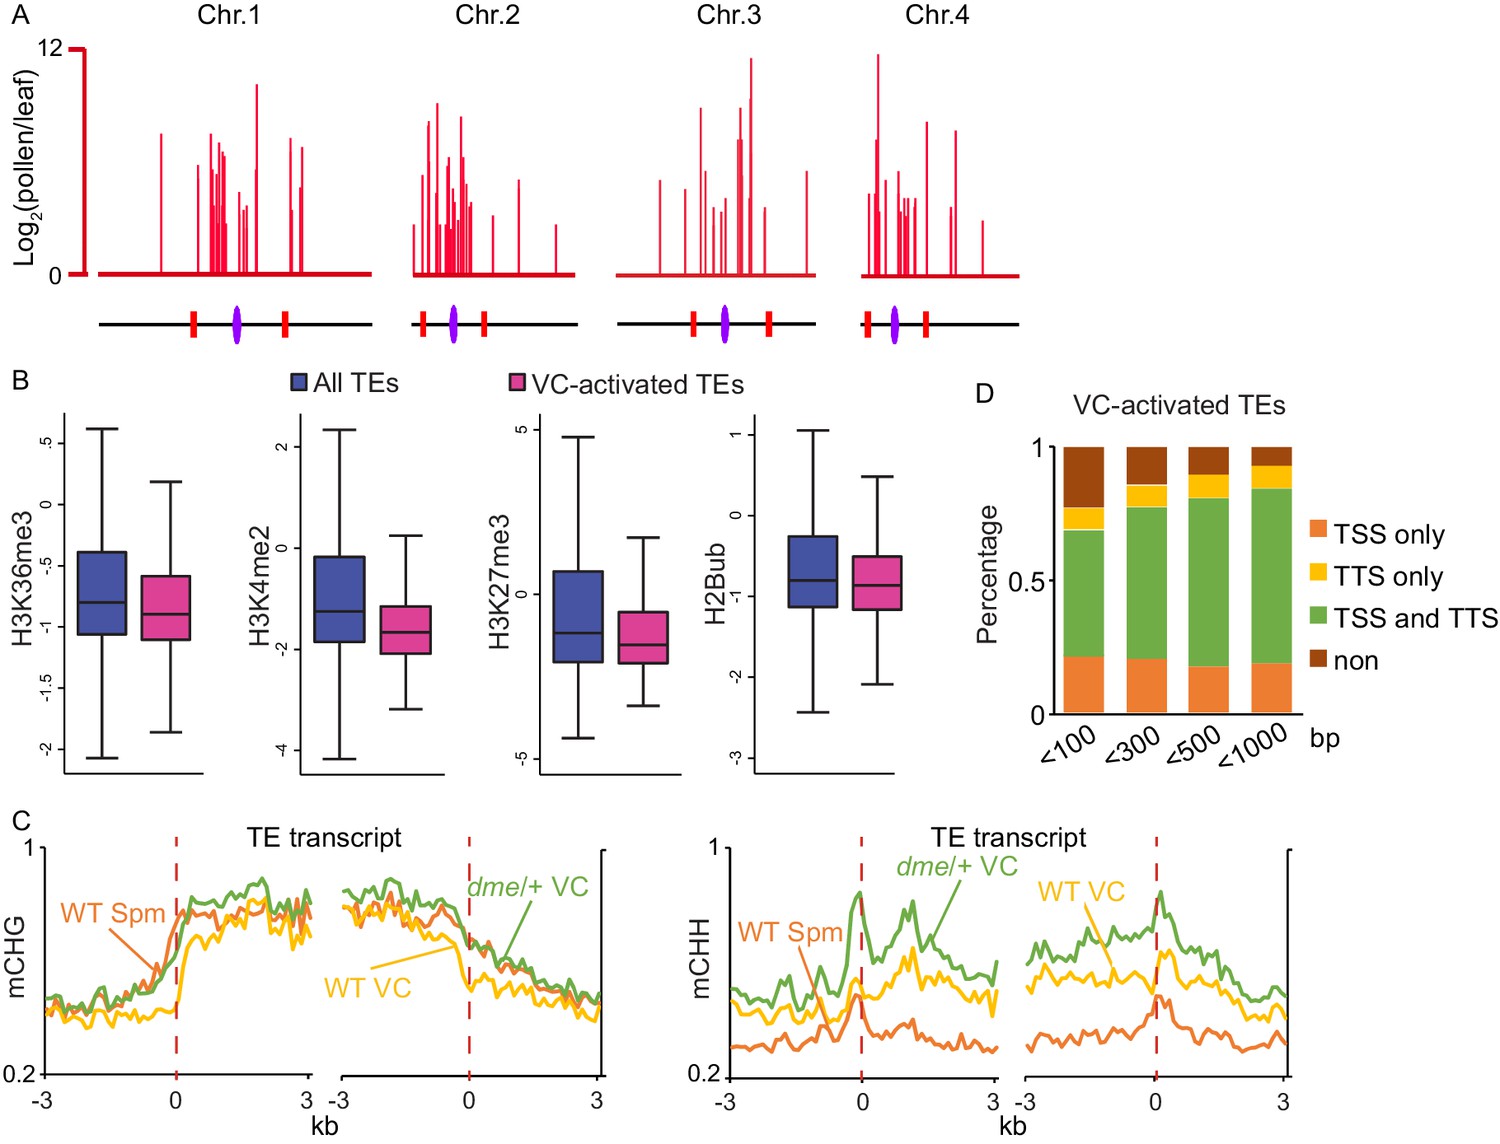
VC-activated TEs are heterochromatic and demethylated by DME.
(A) Chromosomal view of VC-activated TEs, similar to Figure 1A. (B) Box plots showing the enrichment of euchromatic histone modifications at TEs, similar to Figure 1B. Difference between the two datasets compared for each feature is significant (Kolmogorov-Smirnov test p<0.001). H2Bub, H2B ubiquitination. (C) Ends analysis of VC-activated TEs, similar to Figure 1D. (D) Percentages of VC-activated TEs with TSS and/or TTS within indicated distances of VC DME targets.
Figure 2 with 2 supplements
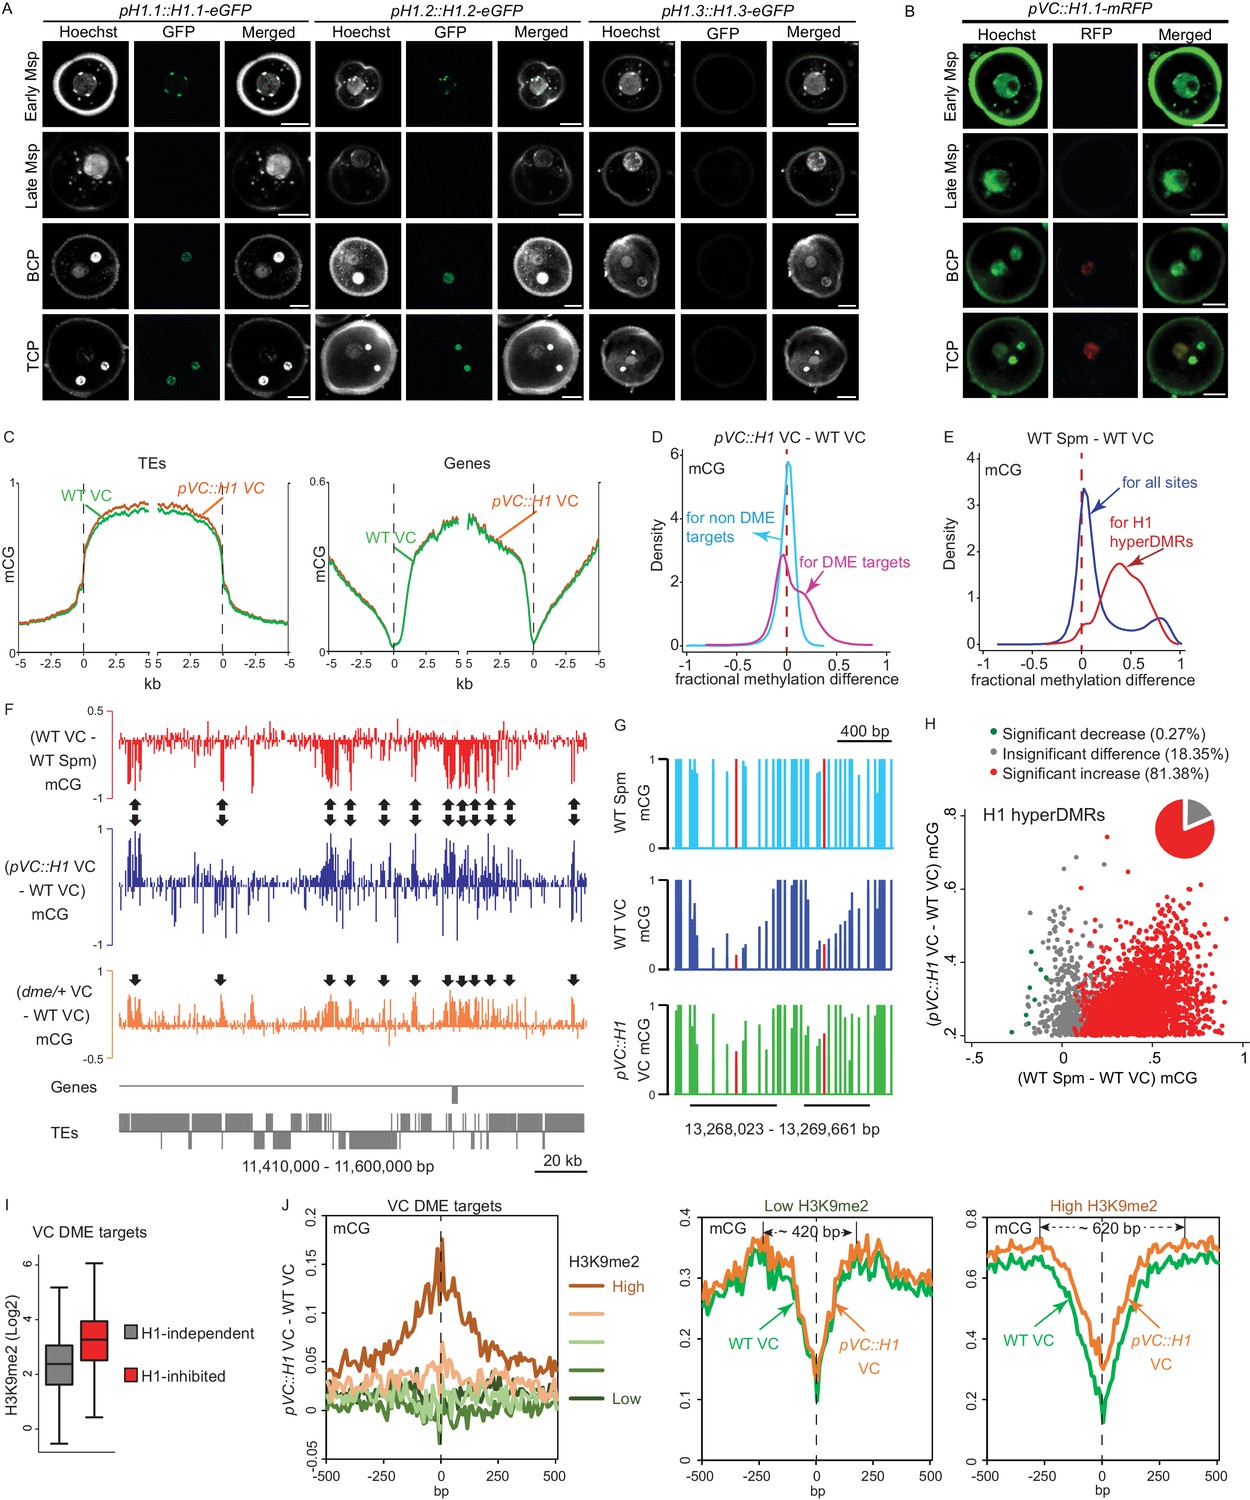
Ectopic H1 expression in the vegetative cell impedes DME at the most heterochromatic loci.
(A–B) Confocal images showing H1 localization under native promoter (A) and VC-specific promoter (pVC, B) during male gametogenesis. Msp, microspore; BCP, bicellular pollen; TCP, tricellular pollen. Bars, 5 μm. All pVC::H1.1-mRFP (short as pVC::H1) refers to line #2. (C) Ends analysis of all TEs or genes in VCs from pVC::H1 (line #2) and WT. (D–E) Kernel density plots illustrating frequency distribution of methylation differences in 50 bp windows between VCs from pVC::H1 and WT (D), and between WT sperm (Spm) and VC (E). (F) Snapshots showing CG methylation difference between the indicated cell types. Arrows point to DME targets that are hypermethylated by pVC::H1. (G) Snapshots demonstrating CG methylation in sperm and VCs at single-nucleotide resolution, with the cytosine most hypomethylated by DME marked in red. VC DME targets are underlined in black. (H) Scatter plot illustrating CG methylation differences between the indicated cell types at H1 hyperDMRs. 82.25% of H1 hyperDMRs show significant increase in sperm in comparison to VCs. (I) Box plot illustrating H3K9me2 level at VC DME targets that are significantly hypermethylated in pVC::H1 (H1-inhibited) or not (H1-independent), respectively. Difference between the two groups is significant (Kolmogorov-Smirnov test p<0.001). (J) VC DME targets were grouped according to H3K9me2 levels, aligned at the most demethylated cytosine (dashed lines), and plotted for average CG methylation difference as indicated in each 10 bp interval (left). Similarly, CG methylation in pVC::H1 and WT VCs was plotted for the group with the lowest and highest H3K9me2, respectively. Spm, sperm.
-
Figure 2—source data 1
List of H1 hyperDMRs.
- https://doi.org/10.7554/eLife.42530.010
Figure 2—figure supplement 1
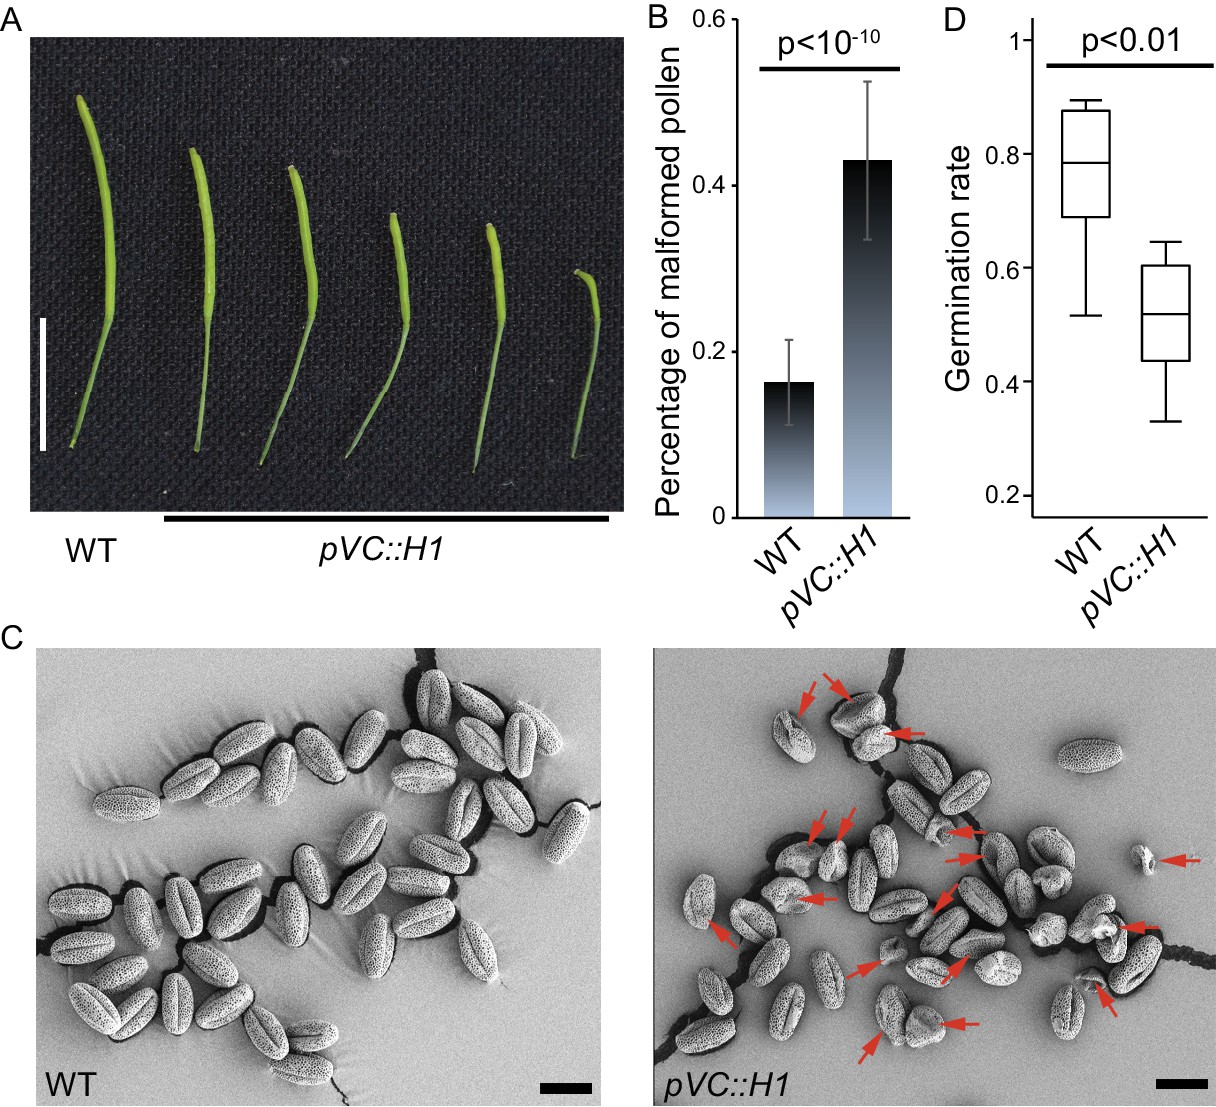
H1 ectopic expression in the vegetative cell causes pollen defect and reduced fertility.
pVC::H1 (pLAT52::H1-mRFP line #2) plants show reduced silique length (A) and an increased proportion of malformed pollen grains (B), which are indicated by red arrows in the SEM image (C). (D) Box plot showing the germination rate of the indicated genotypes. Statistics: (B), Student’s t test p<10−10, n = 17, mean ± SD are shown; (D), Kolmogorov-Smirnov test p<0.01, n = 8. Bars: (A), 1 cm; (C), 20 μm.
Figure 2—figure supplement 2
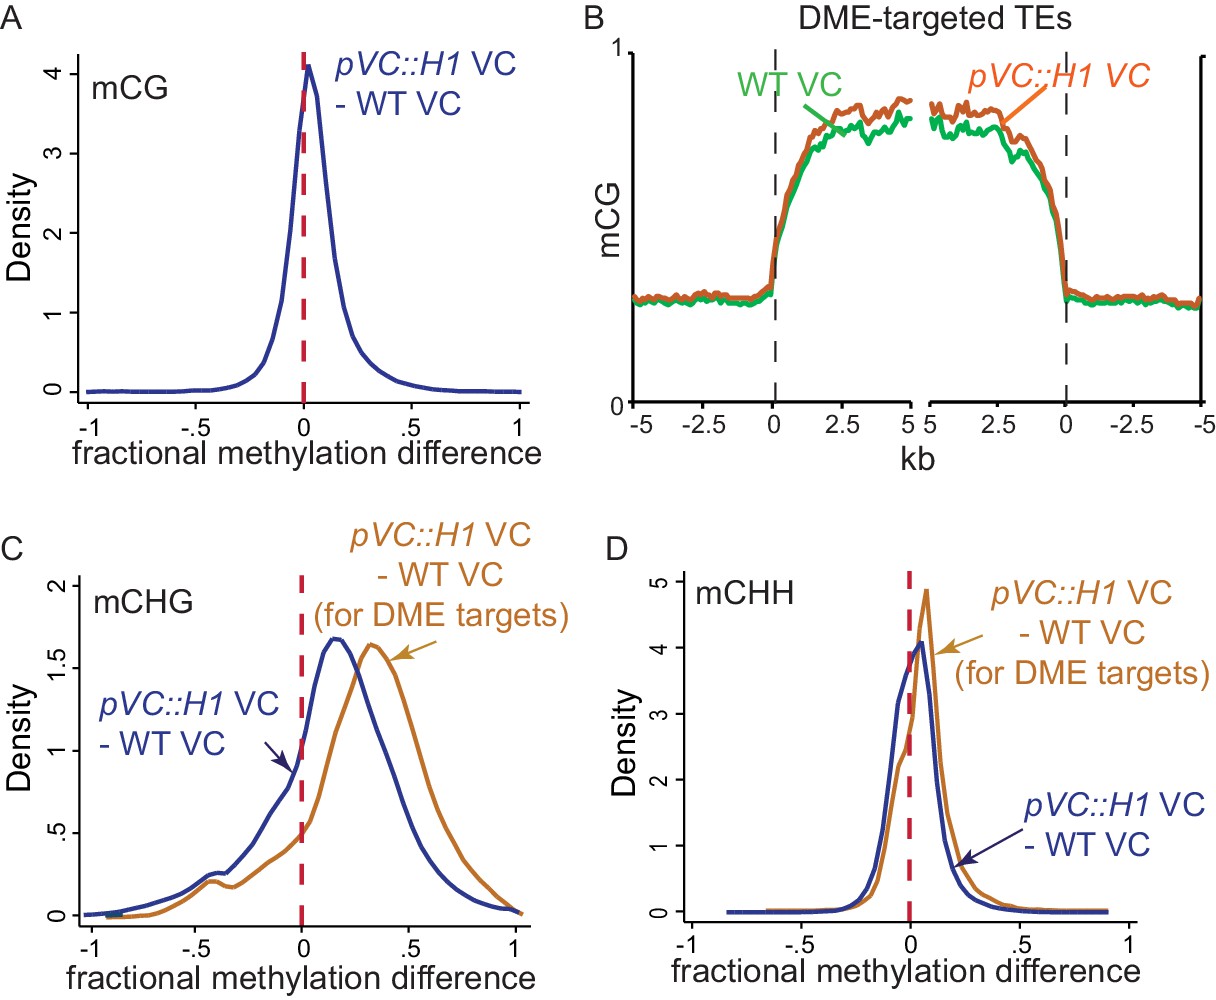
H1 ectopic expression in the vegetative cell causes DNA hypermethylation at DME targets.
(A,C,D) Kernel density plots showing frequency distribution of methylation differences between VCs from pVC::H1 and WT in all 50 bp windows (blue traces) and windows overlapping VC DME targets (orange traces). (B) Ends analysis of DME-targeted TEs in VCs from pVC::H1 (line #2) and WT.
Figure 3 with 1 supplement
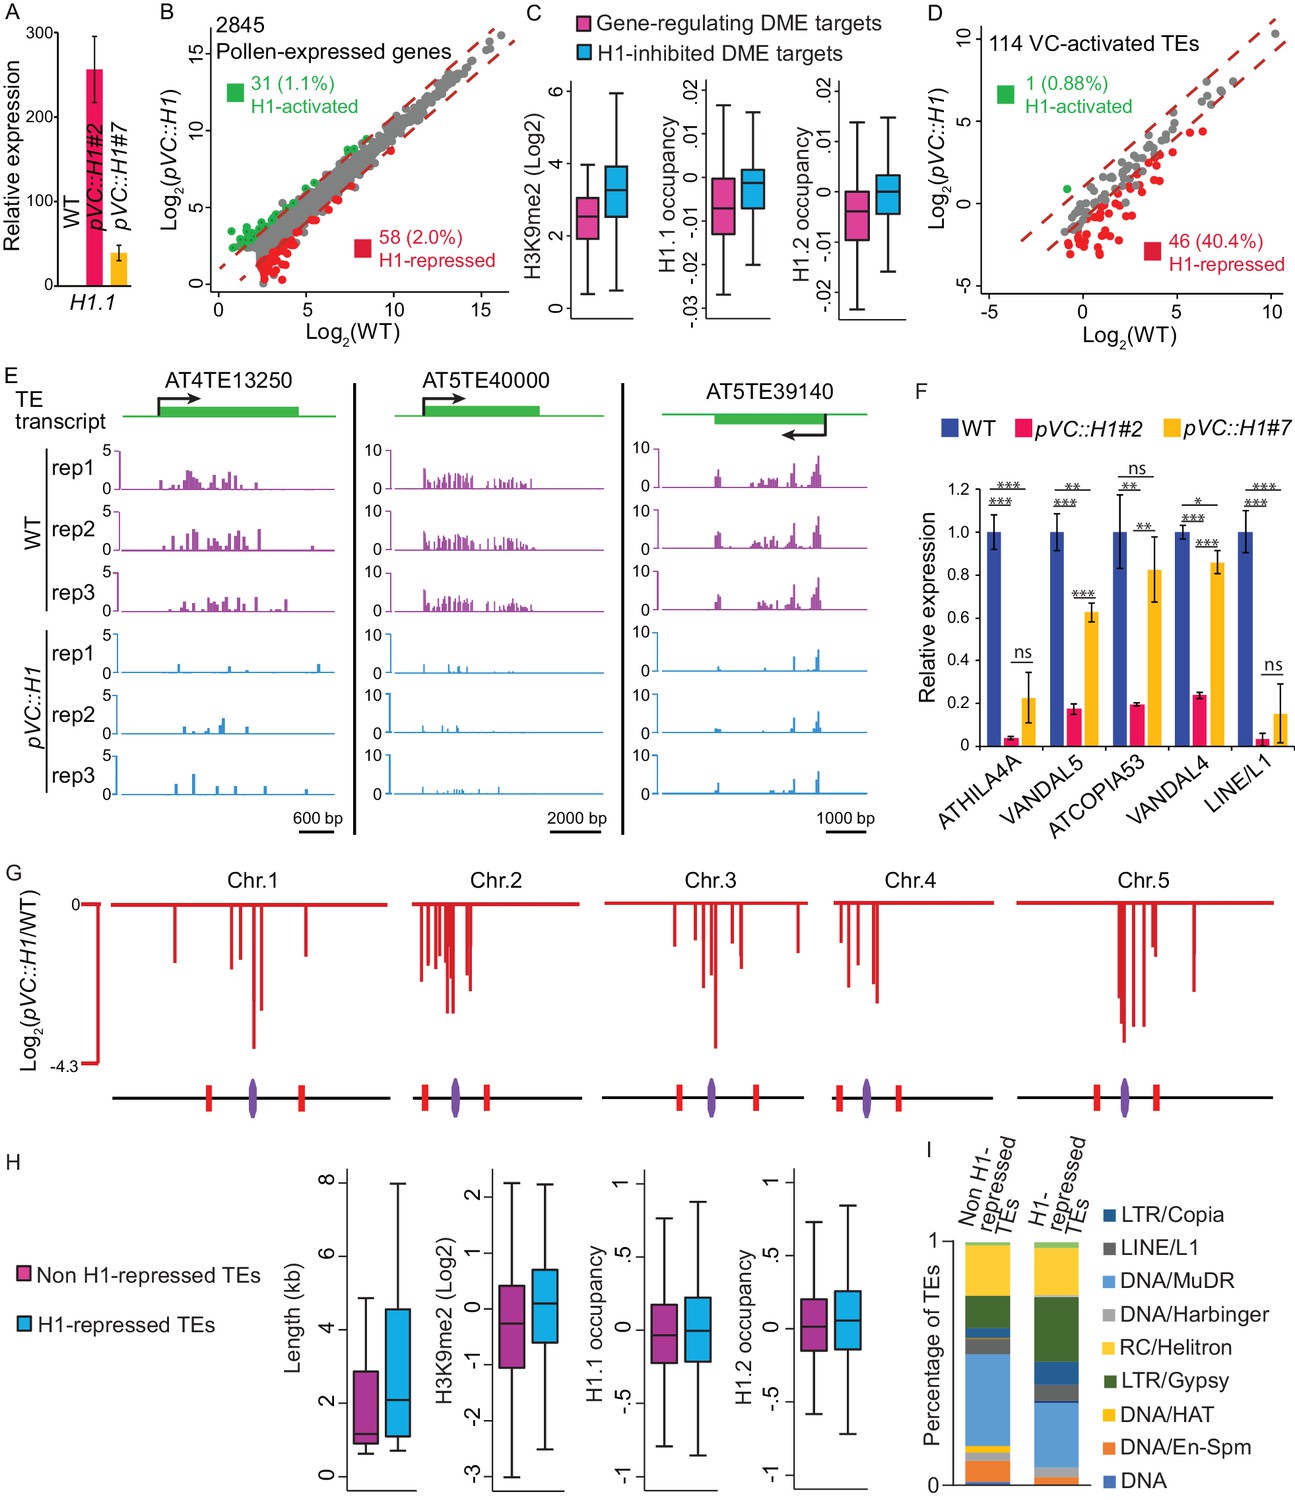
Vegetative-cell-expressed H1 represses heterochromatic TEs in a dosage-dependent manner.
pVC::H1 refers to line #2 except as specified in A) and F). (A,F) quantitative RT-PCR demonstrating H1.1 (A) or TE (F) expression in pollen from WT and two independent pVC::H1 transgenic lines. Relative expression is calculated by normalizing to WT (WT = 1). Student’s t test *p<0.05, **p<0.01, ***p<0.001; ns, not significant; n = 3; mean ± SD are shown. (B,D) Scatter plot illustrating the expression (Log2TPM) of TEs or genes in WT and pVC::H1 pollen. Red and green dots indicate significant down- and up-regulation in pVC::H1 compared to WT (|fold change| > 2, marked by dashed lines; likelihood ratio test p<0.05), respectively. (C) Box plots illustrating H3K9me2 enrichment and H1 occupancy at endosperm DME targets which are within 500 bp of the TSS of imprinted genes, or VC DME targets inhibited by pVC::H1 (refer to Figure 2I). Difference between the two datasets compared for each feature is significant (Kolmogorov-Smirnov test p<0.001). (E) Snapshots showing the expression (Log2RPKM) of 3 example H1-repressed TEs in WT and pVC::H1 pollen. Rep, biological replicate. (G) Chromosomal view of H1-repressed TEs, similar to Figure 1A. (H) Box plots illustrating the length, H3K9me2 enrichment, and H1 occupancy at two groups of VC-activated TEs. Difference between the two datasets compared for each feature is significant (Kolmogorov-Smirnov test p<0.05 for length, and <0.001 for others). (I) Percentages of TEs classified by superfamily.
-
Figure 3—source data 1
List of pollen-expressed genes and their expression in WT and pVC::H1 pollen.
- https://doi.org/10.7554/eLife.42530.013
-
Figure 3—source data 2
List of imprinted genes and their expression in WT and pVC::H1 pollen.
- https://doi.org/10.7554/eLife.42530.014
Figure 3—figure supplement 1
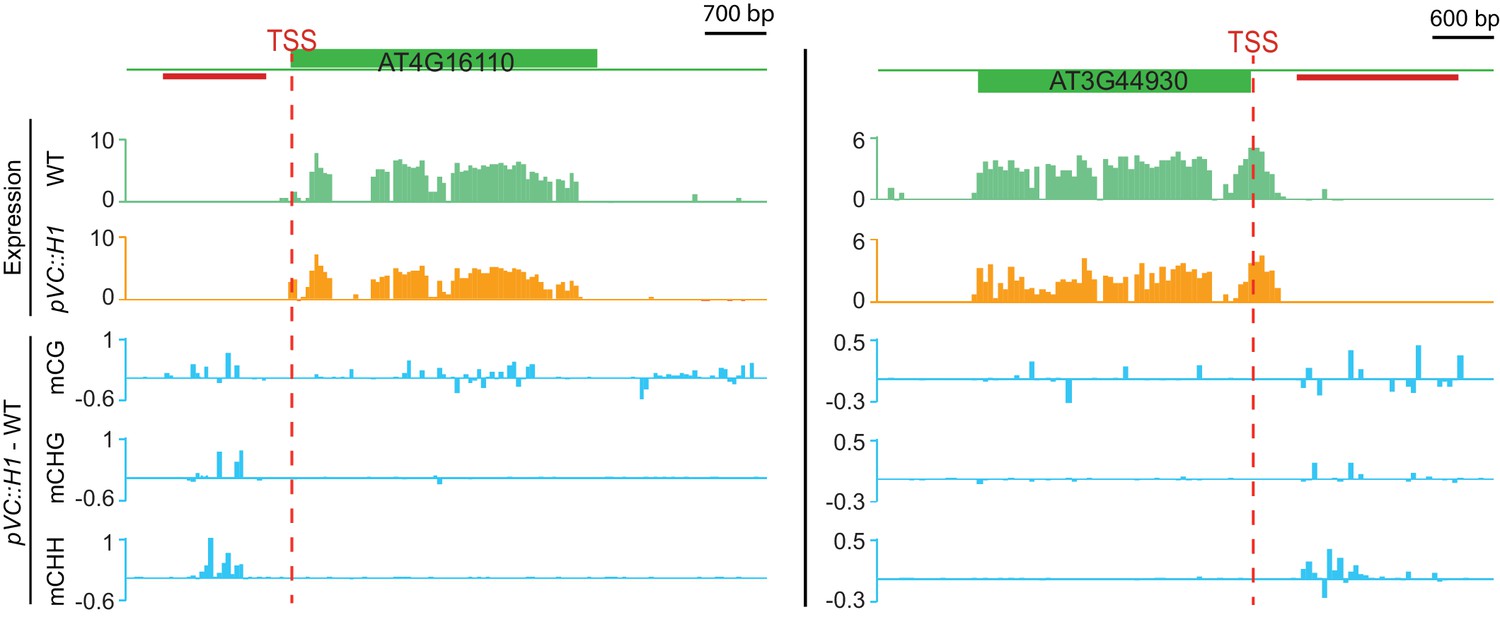
Two genes suppressed by VC-expressed H1 that gain methylation at nearby DME targets.
Top two traces show expression (Log2RPKM) in pVC::H1 (line #2) or WT pollen; three traces at the bottom show differential DNA methylation between pVC::H1 (line #2) and WT VC. The red lines indicate VC DME targets.
Figure 4
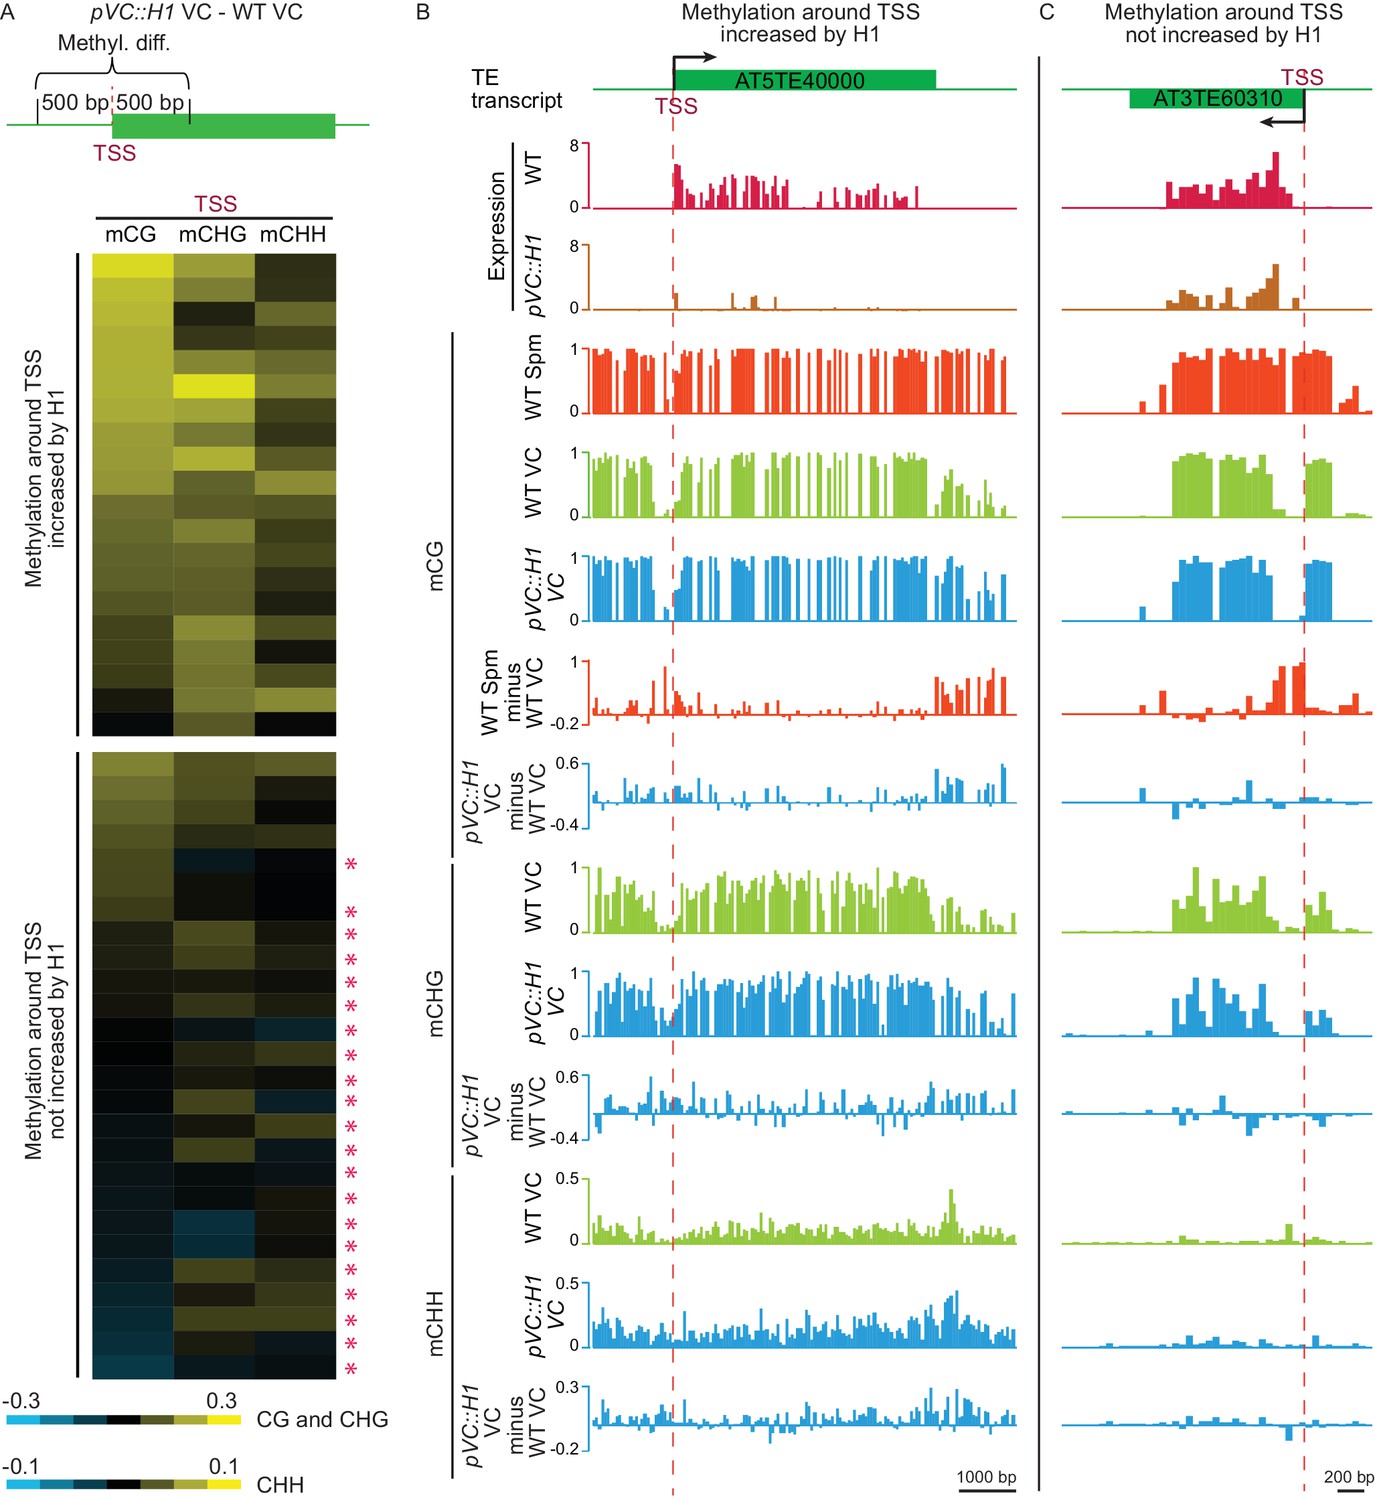
H1 suppresses TEs in the vegetative cell via two mechanisms.
(A) Heat map demonstrating DNA methylation differences between pVC::H1 and WT VCs within 500 bp of the TSS of H1-repressed TEs. Asterisks mark TEs whose suppression is not caused by changes in DNA methylation. Data are sorted in descending order based on CG methylation difference for upper and lower panels, respectively. (B,C) Snapshots showing the expression and DNA methylation of representative TEs suppressed by pVC::H1 via methylation-dependent (B) and -independent (C) mechanisms, respectively. Spm, sperm.
Figure 5
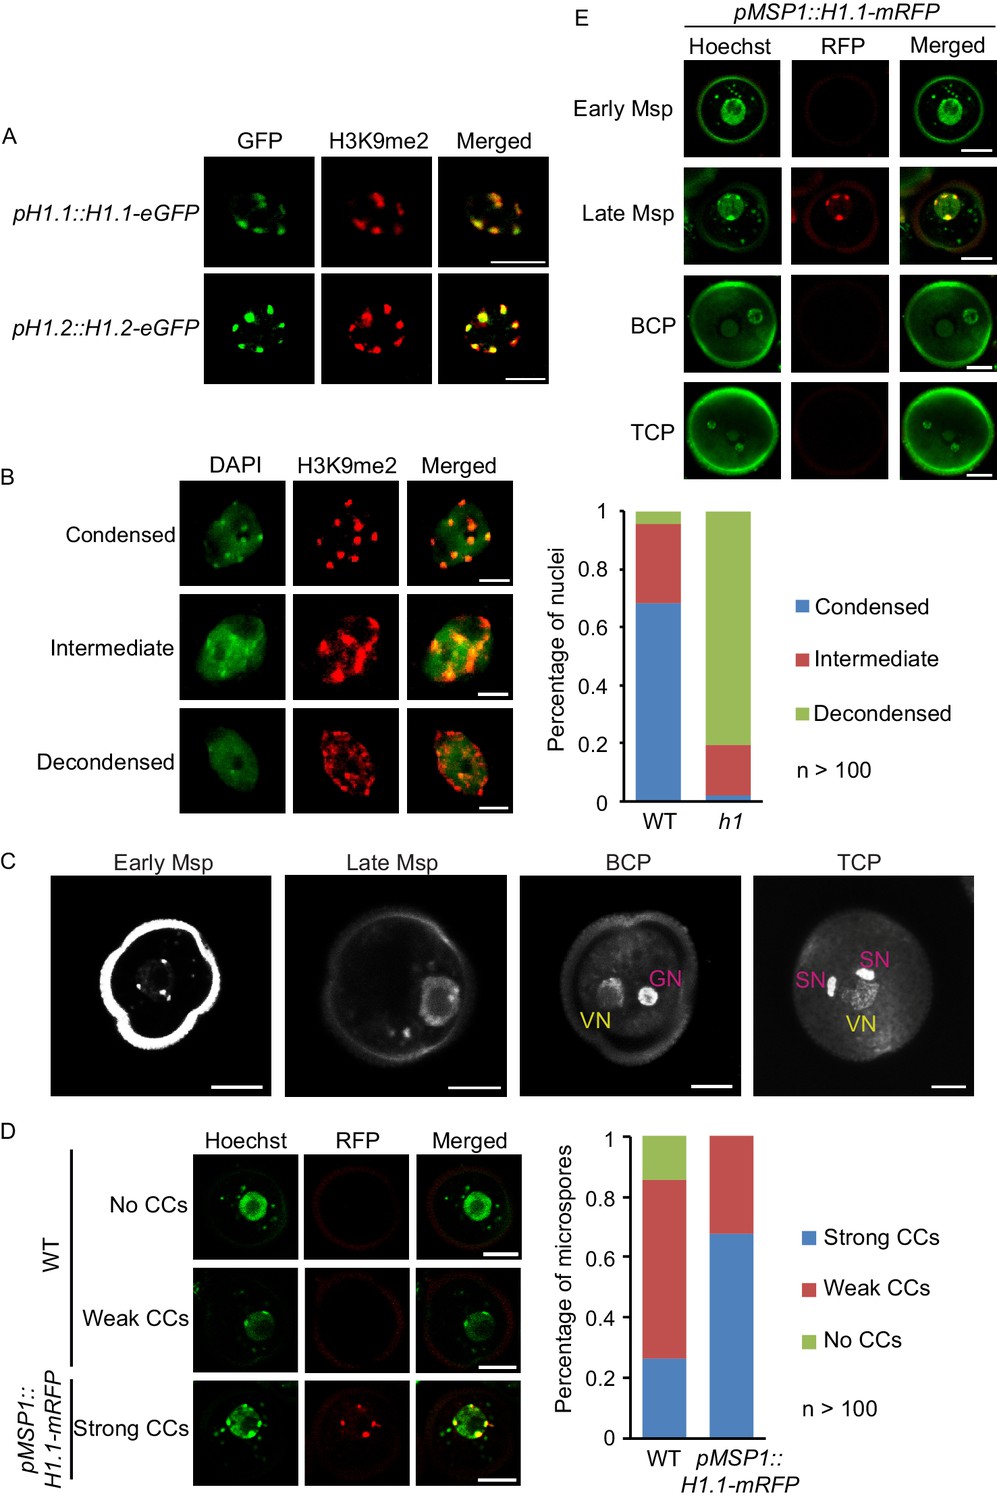
Depletion of H1 decondenses heterochromatin in leaves and late microspores.
(A) Immunostaining with GFP and H3K9me2 antibodies showing the co-localization of H1 and H3K9me2-enriched chromocenters. (B) Examples of leaf nuclei with condensed, intermediate or decondensed chromocenters, and their percentages in WT or the h1 mutant. (C) Gradual decondensation of heterochromatin during male gametogenesis in Arabidopsis. Micrographs of Hoechst-stained microspores (Msp) and pollen (BCP, bicellular pollen; TCP, tricellular pollen) demonstrate a gradual dispersion of chromocenters in late microspores and subsequently the vegetative nucleus (VN) in pollen. Chromocenters are not detected in the VN of BCP and TCP. GN, generative nucleus. (D) Percentages of late microspores with no, weak or strong chromocenters (CCs; examples on the left) in WT and pMSP1::H1.1-mRFP, in which H1 co-localizes with the strong CCs. (E) H1 is induced only in late microspores in pMSP1::H1.1-mRFP, and co-localizes with strong CCs. All bars, 5 μm.
Figure 6
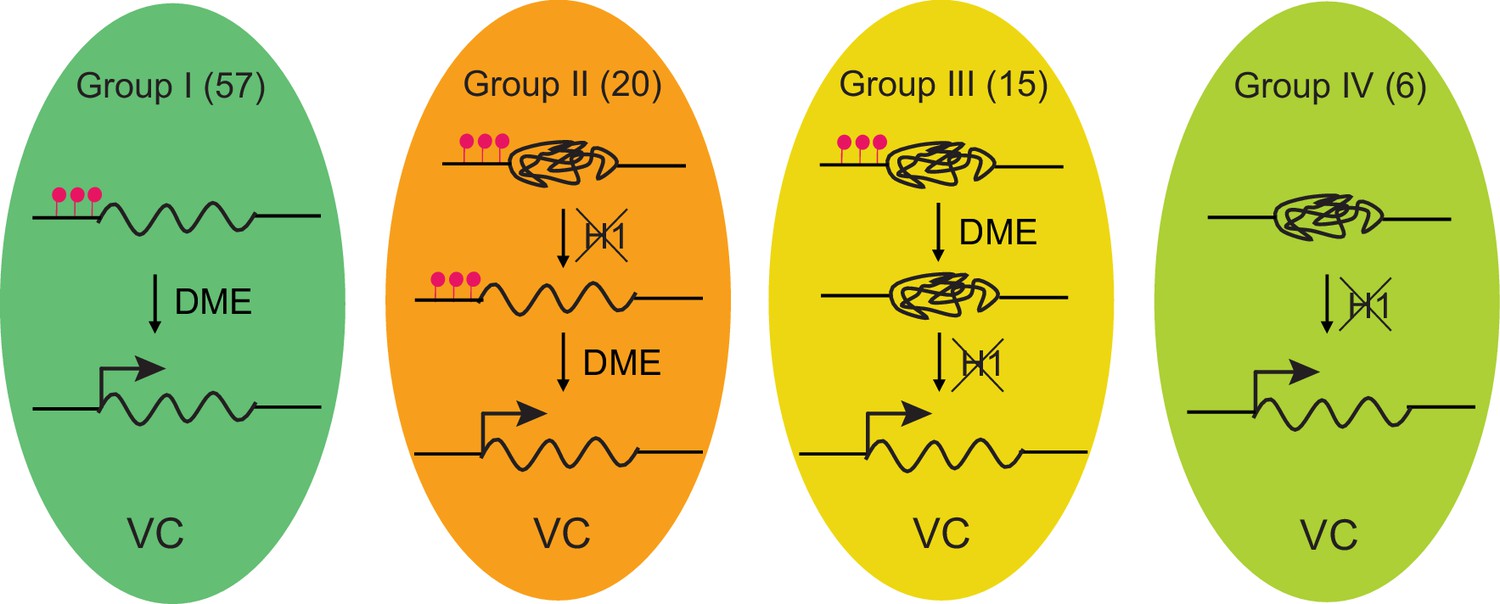
Model depicting four mechanisms underlying TE activation in the VC.
The number of TEs in each group is shown on the top. Significantly less heterochromatic than TEs in other groups (Figure 3H), Group I TEs are activated by DME-directed DNA demethylation. Group II TEs rely on H1 depletion to allow DME demethylation and activation. Group III TEs are demethylated by DME but require H1 depletion to allow transcription (ie. pVC::H1 represses these TEs without affecting DME). Group IV TEs are not demethylated by DME; their activation is solely dependent on the depletion of H1. TEs belong to each group are listed in Figure 1—source data 1. Red lollipops denote DNA methylation.
Author response image 1
Tables
Key resources table
| Reagent type (species) or resource | Designation | Source or reference | Identifiers | Additional information |
|---|---|---|---|---|
| Gene (Arabidopsis thaliana) | H1.1 | NA | AT1G06760 | |
| Gene (A. thaliana) | H1.2 | NA | AT2G30620 | |
| Gene (A. thaliana) | DEMETER | NA | AT5G04560 | |
| Genetic reagent (A. thaliana) | h1.1–1 | Nottingham Arabidopsis Stock Centre | SALK_128430C | |
| Genetic reagent (A. thaliana) | h1.2–1 | GABI-Kat | GABI_406H11 | |
| Genetic reagent (A. thaliana) | dme-7 | Nottingham Arabidopsis Stock Centre | SALK_107538 | |
| Genetic reagent (A. thaliana) | pLAT52::H1.1-mRFP | this paper | LAT52 promoter from tomato is used | |
| Genetic reagent (A. thaliana) | pMSP1::H1.1-mRFP | this paper | MSP1 (AT5G59040) promoter is used | |
| Biological sample (A. thaliana) | sperm nuclei from Col-0 | this paper | bisulfite-sequencing | |
| Biological sample (A. thaliana) | vegetative nuclei from Col-0 | this paper | bisulfite-sequencing | |
| Biological sample (A. thaliana) | vegetative nuclei from pLAT52::H1.1-mRFP | this paper | bisulfite-sequencing | |
| Biological sample (A. thaliana) | pollen from Col-0 | this paper | RNA-sequencing | |
| Biological sample (A. thaliana) | pollen from pLAT52::H1.1-mRFP | this paper | RNA-sequencing | |
| Biological sample (A. thaliana) | pollen from dme-7/+ | this paper | RNA-sequencing | |
| Antibody | GFP | Abcam | Cat# ab290, RRID:AB_303395 | (1:100) |
| Antibody | H3K9me2 | Abcam | Cat# ab1220, RRID:AB_449854 | (1:100) |
| Antibody | Alexa 488- secondaries | ThermoFisher Scientific | Cat# A-11034, RRID:AB_2576217 | (1:200) |
| Antibody | Alexa 555- secondaries | ThermoFisher Scientific | Cat# A28180, RRID:AB_2536164 | (1:200) |
| Software, algorithm | Mikado | Venturini et al., 2018 | RRID:SCR_016159 | |
| Software, algorithm | Kallisto | Bray et al., 2016 | RRID:SCR_016582 | |
| Software, algorithm | Sleuth | Pimentel et al., 2017 | RRID:SCR_016883 | |
| Other | Hoechst 33342 | ThermoFisher Scientific | Cat# H3570 | (1:1000) |
| Other | DAPI | ThermoFisher Scientific | Cat# D1306, RRID:AB_2629482 | (100 ng/mL) |
Additional files
-
Supplementary file 1
Sequencing summary statistics for bisulfite sequencing libraries.
Mean DNA methylation (Met) was calculated by averaging methylation of individual cytosines in each context, and chloroplast CHH methylation was used as a measure of cytosine non-conversion and other errors. SN, sperm nuclei; VN, vegetative nuclei.
- https://doi.org/10.7554/eLife.42530.018
-
Supplementary file 2
List of primers for quantitative RT-PCR.
- https://doi.org/10.7554/eLife.42530.019
-
Transparent reporting form
- https://doi.org/10.7554/eLife.42530.020
Download links
A two-part list of links to download the article, or parts of the article, in various formats.
Downloads (link to download the article as PDF)
Open citations (links to open the citations from this article in various online reference manager services)
Cite this article (links to download the citations from this article in formats compatible with various reference manager tools)
Natural depletion of histone H1 in sex cells causes DNA demethylation, heterochromatin decondensation and transposon activation
eLife 8:e42530.
https://doi.org/10.7554/eLife.42530


