Behavioural and neural signatures of perceptual decision-making are modulated by pupil-linked arousal
- Newcastle University, United Kingdom
- Monash University, Australia
- Trinity College Dublin, Ireland
- University College Dublin, Ireland
Figures
Figure 1 with 6 supplements
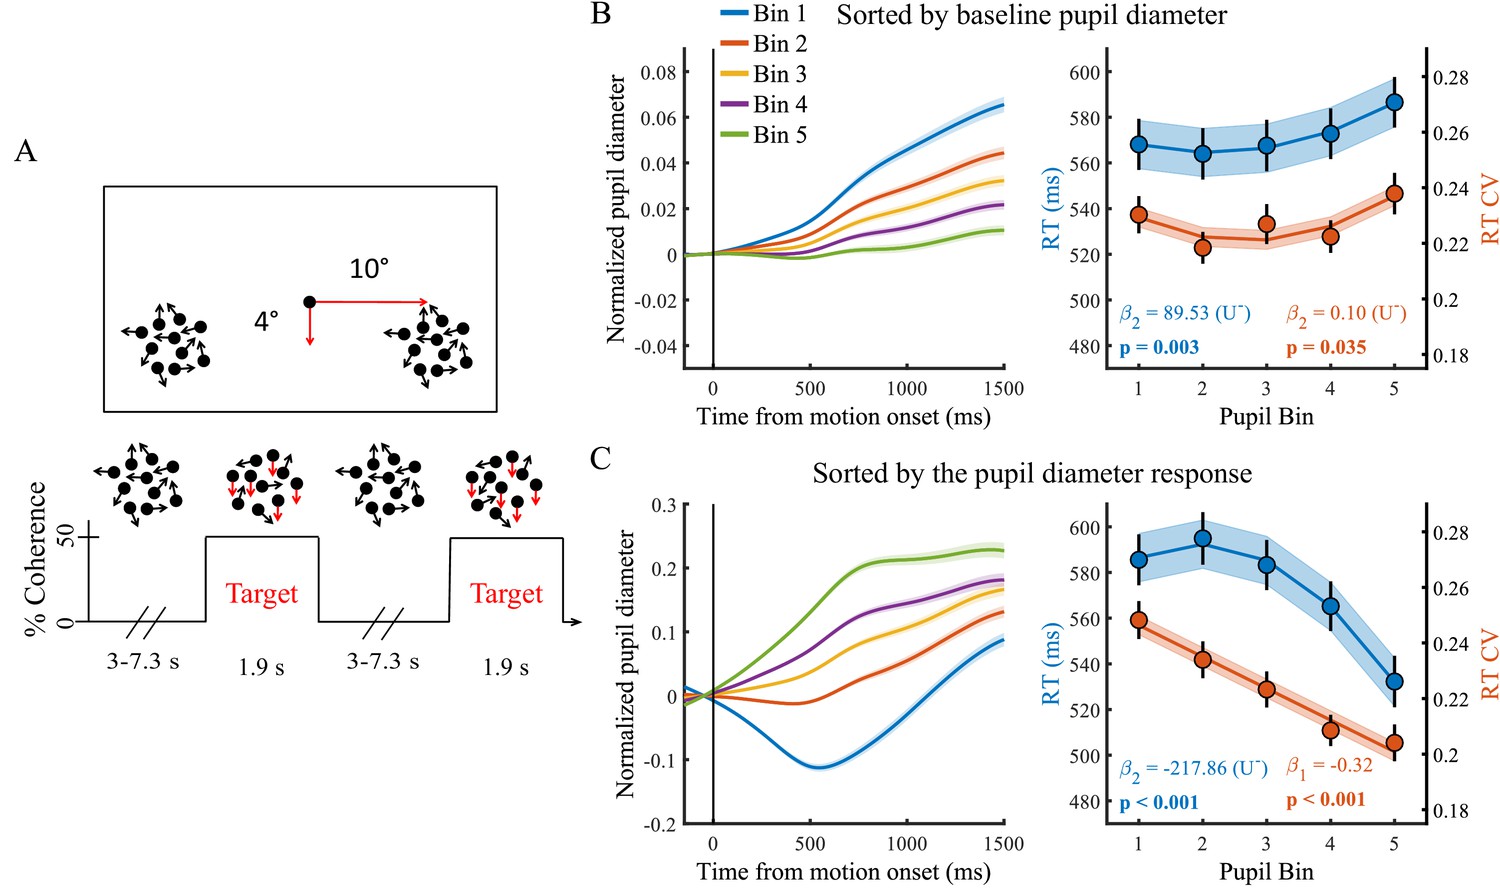
Paradigm and task performance related to baseline pupil diameter and the task-evoked pupil response.
(A) Paradigm. Subjects fixated on a central dot while monitoring two peripheral patches of continuously presented randomly moving dots. At pseudorandom times an intermittent period of coherent downward motion (50%) occurred in either the left or the right hemifield. A speeded right handed button press was required upon detection of coherent motion. (B) Pupil diameter time course and task performance sorted by baseline pupil diameter. (Left) Pupil time-course for the five bins. (Right) Behavioural performance for the five bins. Markers indicate mean reaction times (RT, blue, left y-axis) and reaction time coefficient of variation (RTcv, red, right y-axis), lines and shading indicate significant model fits. (C) Same conventions as B, but sorted by the pupil diameter response. Error bars and shaded regions denote ±1 standard error of the mean (SEM). Stats, β weights: linear mixed effects model analyses, U: indicates presence (+) or absence (-) of significant U-shaped relationship (Statistical analyses).
-
Figure 1—source data 1
Csv table containing data for Figure 1 panel B.
- https://doi.org/10.7554/eLife.42541.010
-
Figure 1—source data 2
Csv table containing data for Figure 1 panel C.
- https://doi.org/10.7554/eLife.42541.011
Figure 1—figure supplement 1
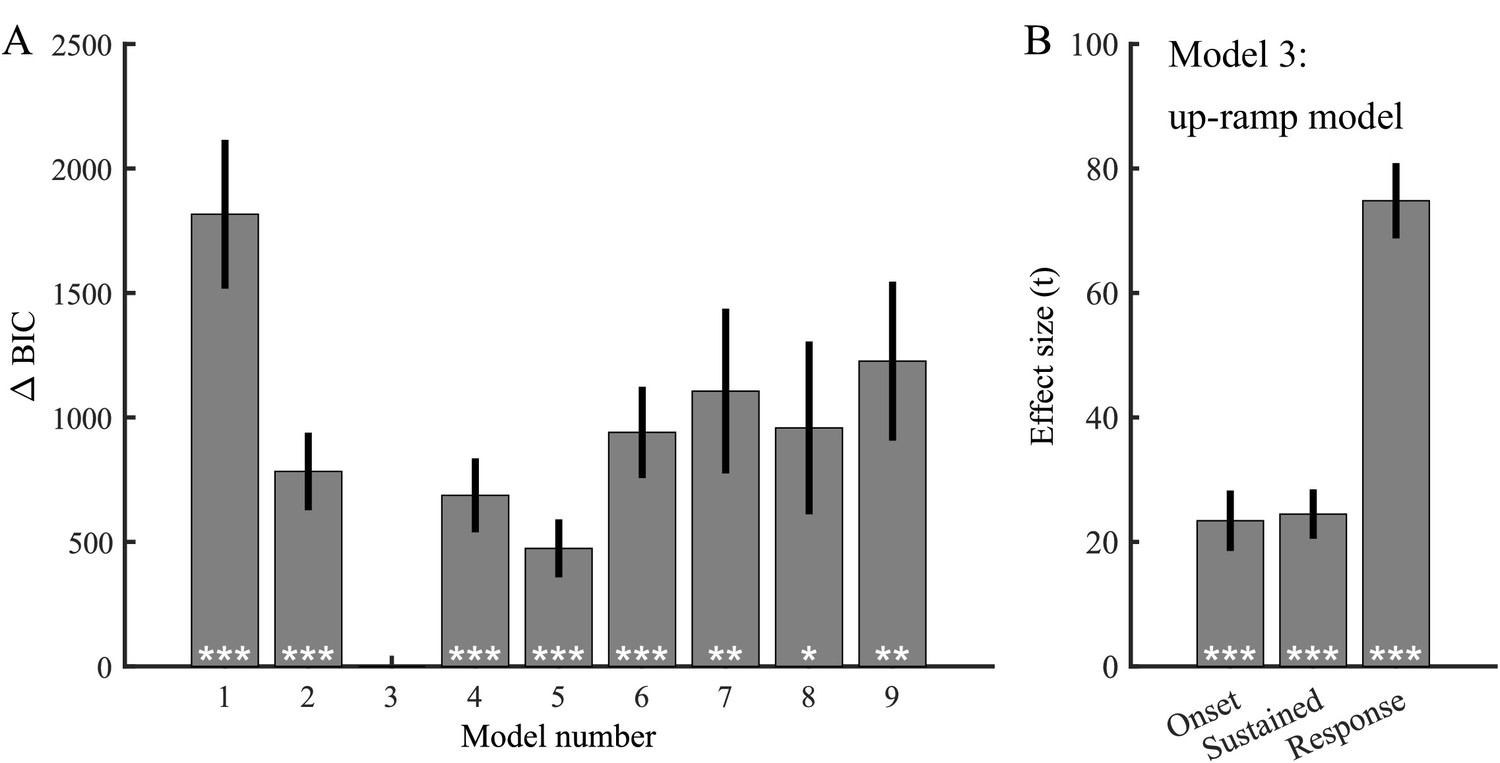
The neural input to the pupil diameter system is best described by a linear up-ramp.
(A) Bayes Information Criterion (BIC) scores for the nine models fit to the pupil diameter time course, relative to the winning model (model 3, linear up-ramp). (B) Effect sizes (t-statistics) for each of the temporal components from the linear up-ramp model. Error bars denote ±1 standard error of the mean (SEM). Stats, Wilcoxon signed rank test.
Figure 1—figure supplement 2
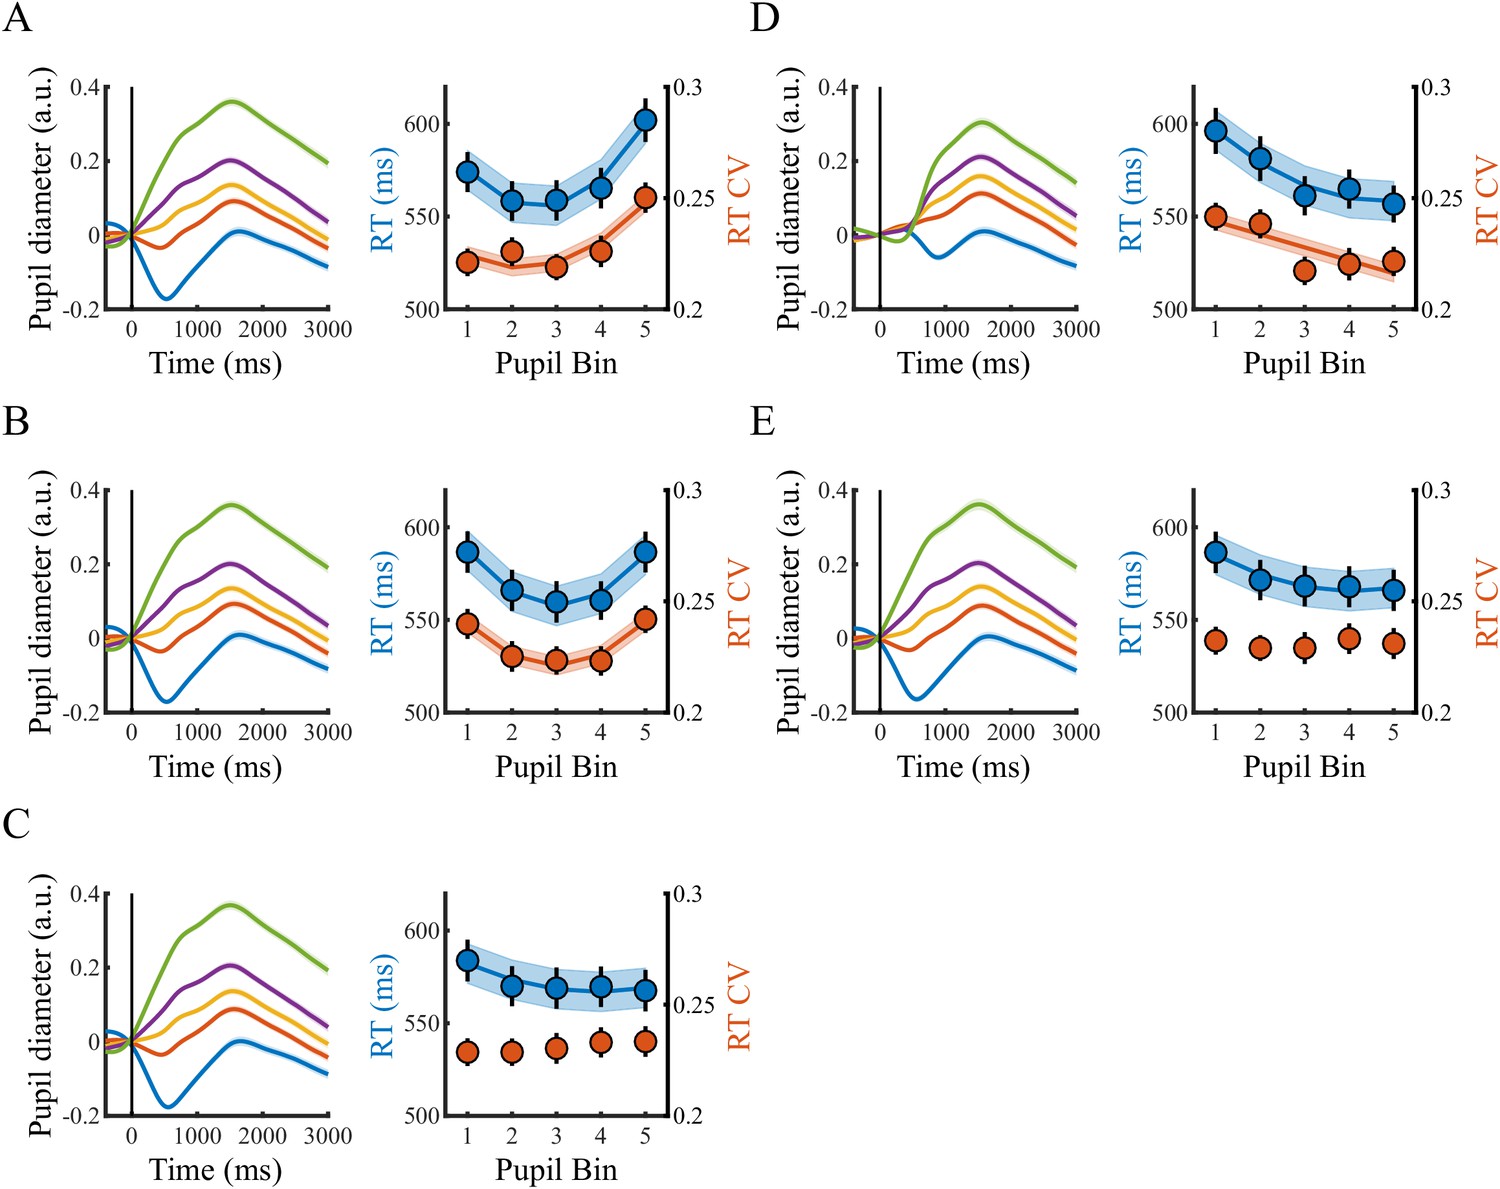
Relating various measures of the phasic pupil response to behavioural performance.
The pupil time course (left) and behavioural performance (right) as measured by RT and RTcv binned by: (A) the mean pupil diameter in the 400 ms around RT; (B) the mean pupil diameter in the 400 ms around RT in which fluctuations in the measurement of pupil diameter due to fluctuations in RT were removed via linear regression; and (C–E) the mean pupil diameter (C) the slope as measured by fitting a straight line (least squares) (D) and linear projection (E) during the 400 ms around the maximum of the derivative of the pupil input response function (636 ms after target onset) used for the GLM analysis. Error bars and shaded regions denote ±1 standard error of the mean (SEM). Stats, linear mixed effects model analyses (Statistical analyses).
Figure 1—figure supplement 3
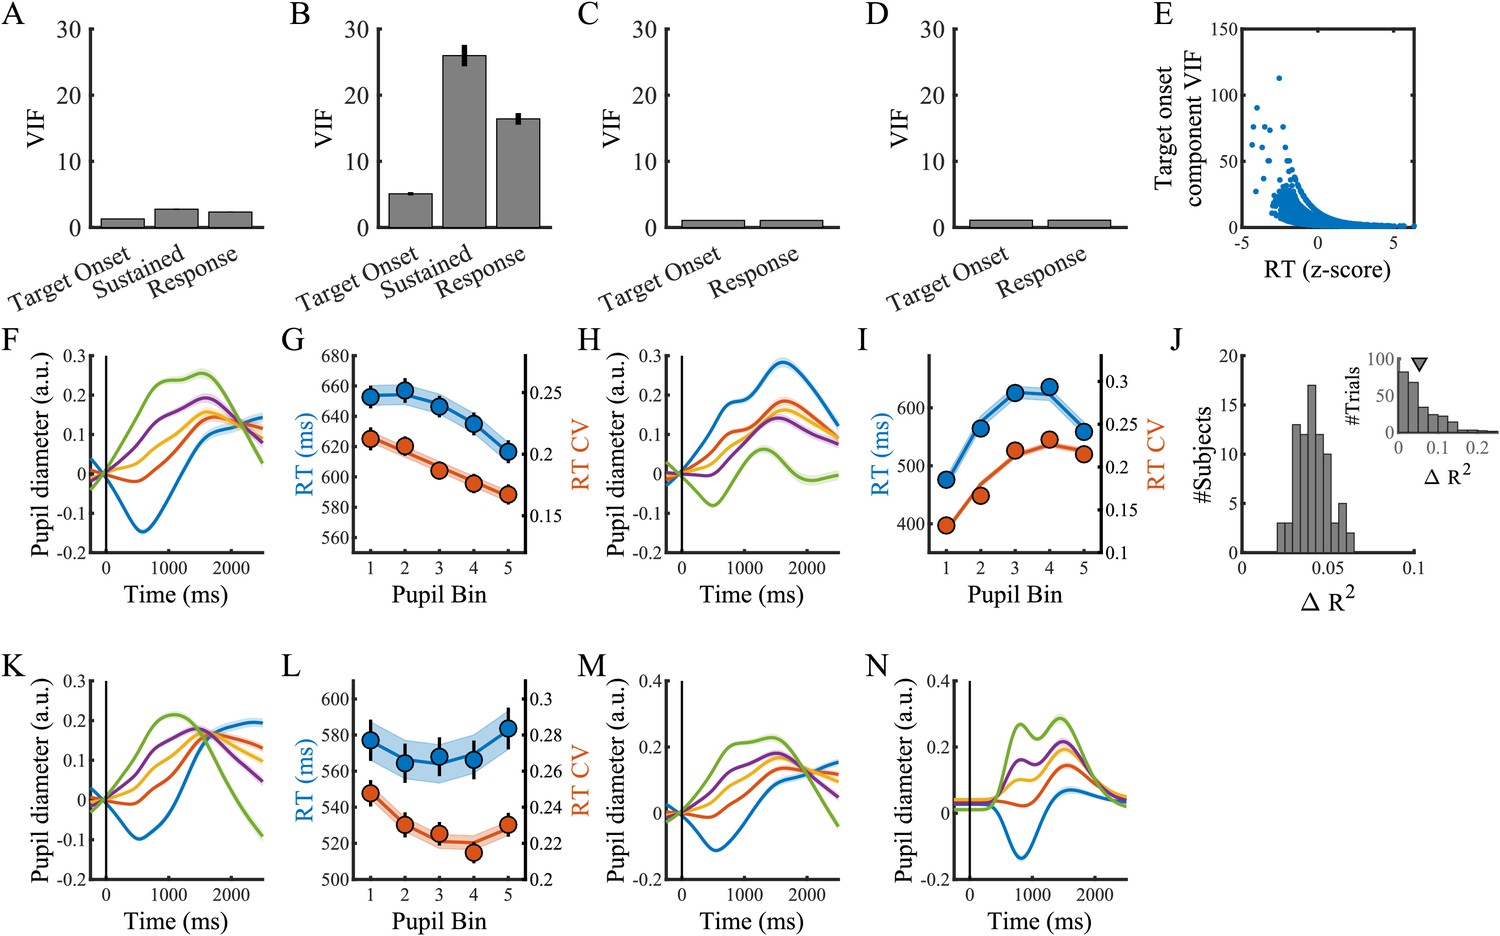
Application of the linear up-ramp model on a single-trial basis.
(A–D) Variance inflation factor (VIF) values for each of the temporal components of the (A) linear up-ramp model applied across trials, (B) linear up-ramp model applied to individual trials, (C) target and response onset model applied across trials, and (D) target and response onset model applied to individual trials. (E) Single-trial VIF values for the target onset component of the linear up-ramp model, plotted against RT. (F) The pupil time course and (G) the relationship between the size of the pupil response to target onset and behavioural performance when trials with VIF values larger than five were excluded. (H–I) Same conventions as F-G, but binned by the estimated amplitude of the sustained component of the linear up-ramp model. (J) Average difference in R2 between a single trial linear up-ramp model and the target-response onset model per subject, inset displays this same difference value for one example subject across trials. (K–L) Same conventions as F-G, but sorted by the estimated amplitude of the target onset component in the target-response onset model. (M) Pupil time course and (N) fitted pupil diameter time course binned by the estimated amplitude of the target onset component in the linear up-ramp model. Error bars and shaded regions denote ±1 standard error of the mean (SEM). Stats, linear mixed effects model analyses (Statistical analyses).
Figure 1—figure supplement 4
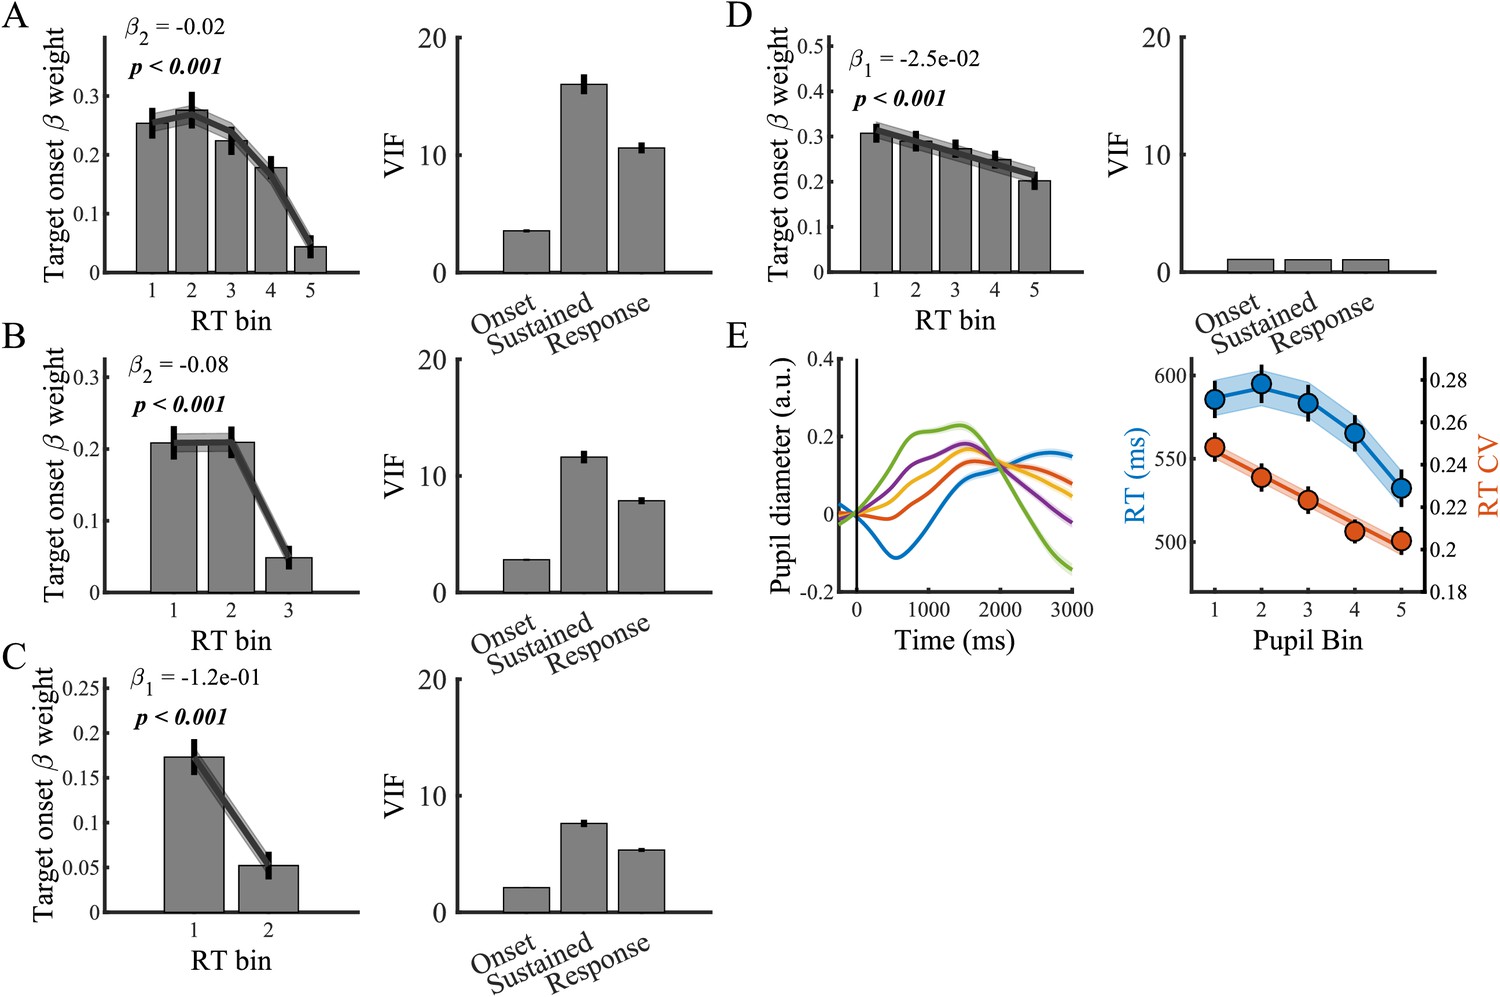
Application of the linear up-ramp model across bins of trials.
Target onset component β weights for the linear up-ramp model applied to (A) five, (B) three or (C) two subsets of trials binned by RT (Left), and the average VIF values across bins and subjects for each of the temporal components in the linear up-ramp model (Right). (D) As in A, but after Gram-Schmidt orthogonalization of the predictors. (E) The pupil time course (left), and task performance (right), binned by the estimated amplitude of the target onset component after orthogonalization of the predictors. Error bars denote ±1 standard error of the mean (SEM). Stats, linear mixed effects model analyses for trend across bins (Statistical analyses).
Figure 1—figure supplement 5

The effect of baseline pupil diameter on the relationship between the pupil response and behavioural performance.
(A) Behavioural performance binned by the size of the phasic pupil response to target onset without removing the trial-to-trial fluctuations in baseline pupil diameter. (B) The relationship between the pre-target phase (radians) of the pupil diameter, and the amplitude of the post-target pupil response, before (blue) and after (red) the regression procedure for an example subject. Dots denote individual trials, lines indicate third order polynomial fits to the data. (C) As in A, but without the removal of the trial-to-trial fluctuations due to fluctuations in the phase of the baseline pupil diameter. Error bars and shaded regions denote ±1 standard error of the mean (SEM). Stats, linear mixed effects model analyses and the circular correlation coefficient (Statistical analyses).
Figure 1—figure supplement 6

The relationship between baseline pupil diameter and task performance, for band-pass (0.1–6 Hz), rather than low-pass (<6 Hz) filtered pupil diameter data.
(A) Pupil time-course for the five bins. (B) Behavioural performance for the five bins. Markers indicate mean reaction times (RT, blue, left y-axis) and reaction time coefficient of variation (RTcv, red, right y-axis). Error bars and shaded regions denote ±1 standard error of the mean (SEM). Stats, linear mixed effects model analyses (Statistical analyses).
Figure 2 with 2 supplements
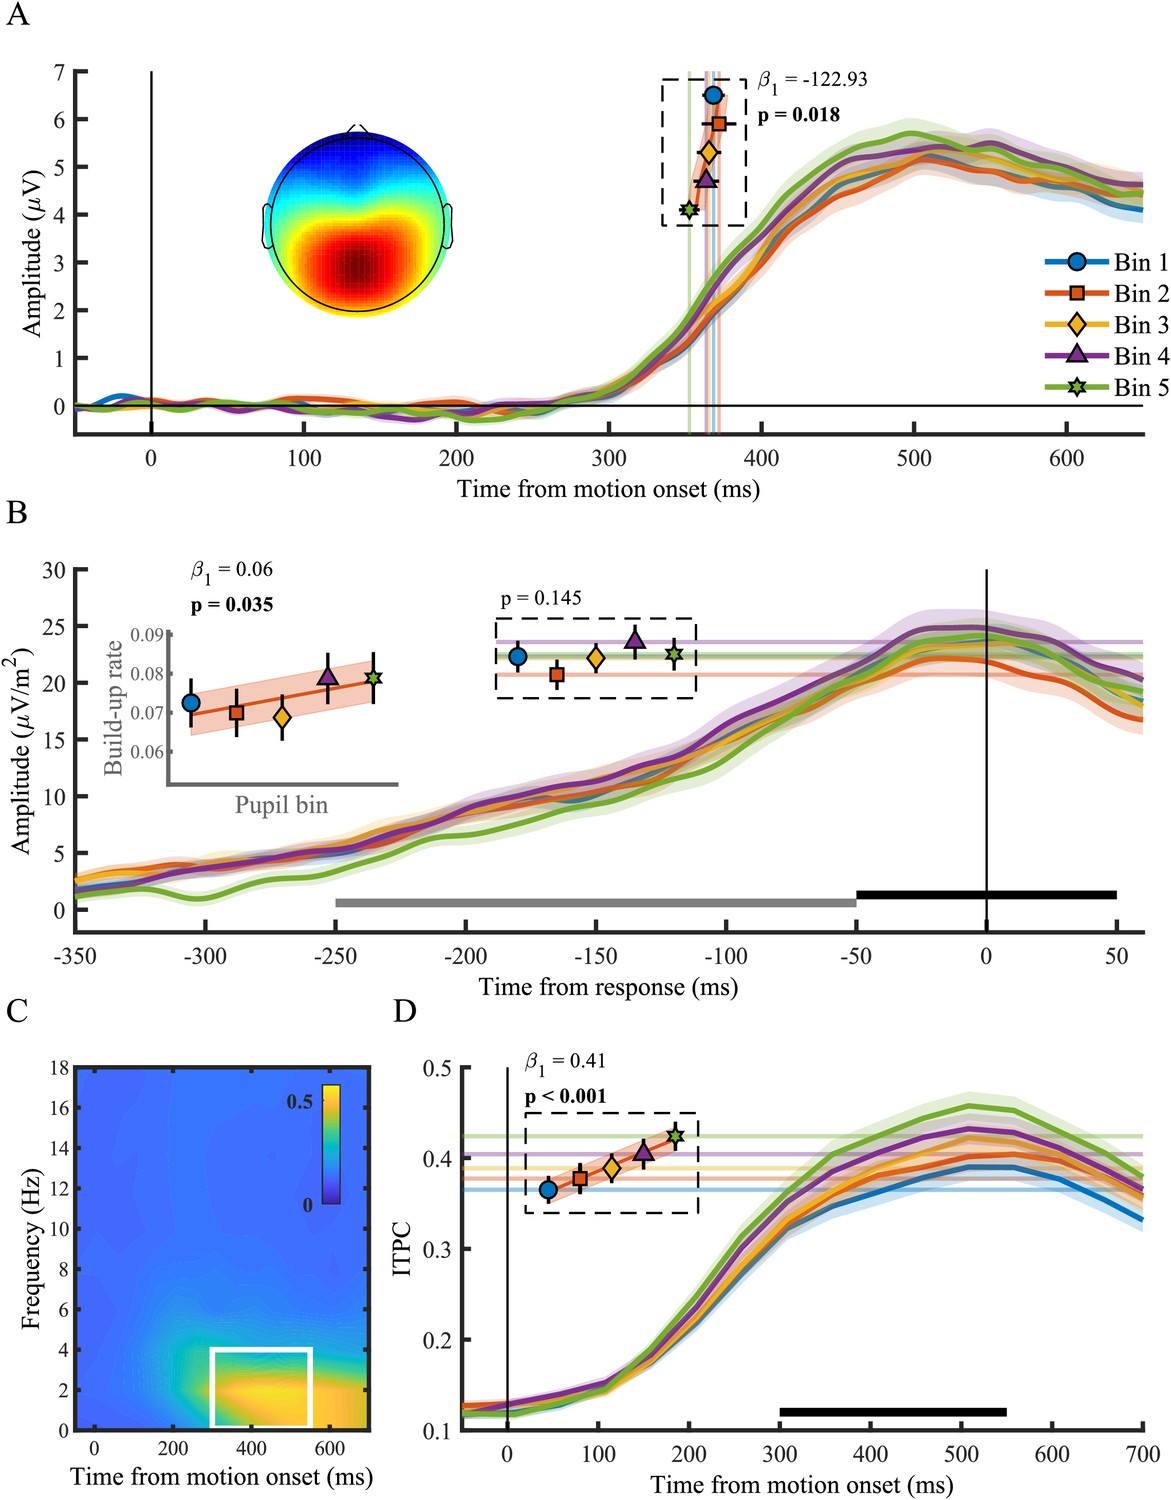
The centro-parietal positivity (CPP) in relation to phasic arousal.
(A) The stimulus-locked CPP time-course shows faster onset times for larger pupil response bins. The inset shows the scalp topography of the CPP. Vertical lines and markers indicate the onset latencies per bin. (B) The response-locked CSD-transformed CPP time-course. Horizontal lines and markers indicate the CPP amplitude, and the inset displays the build-up rate of the CPP across pupil response bins. The black bar represents the time window used for the calculation of the CPP amplitude and the grey bar the time window used for the calculation of the build-up rate. (C) Grand average inter-trial phase coherence (ITPC) per time-frequency point for the CPP. The white box represents the time-frequency window selected for statistical analyses. (D) ITPC per pupil bin over time for frequencies below 4 Hz. The black bar indicates the time window used for further analysis. Horizontal lines and markers indicate the averaged ITPC in the time-frequency window indicated by the white box in panel C. Error bars and shaded regions denote ±1 SEM. Stats, linear mixed effects model analyses (Statistical analyses). Lines and shading indicate significant fits to the data.
-
Figure 2—source data 1
Csv table containing data for Figure 2.
- https://doi.org/10.7554/eLife.42541.015
Figure 2—figure supplement 1
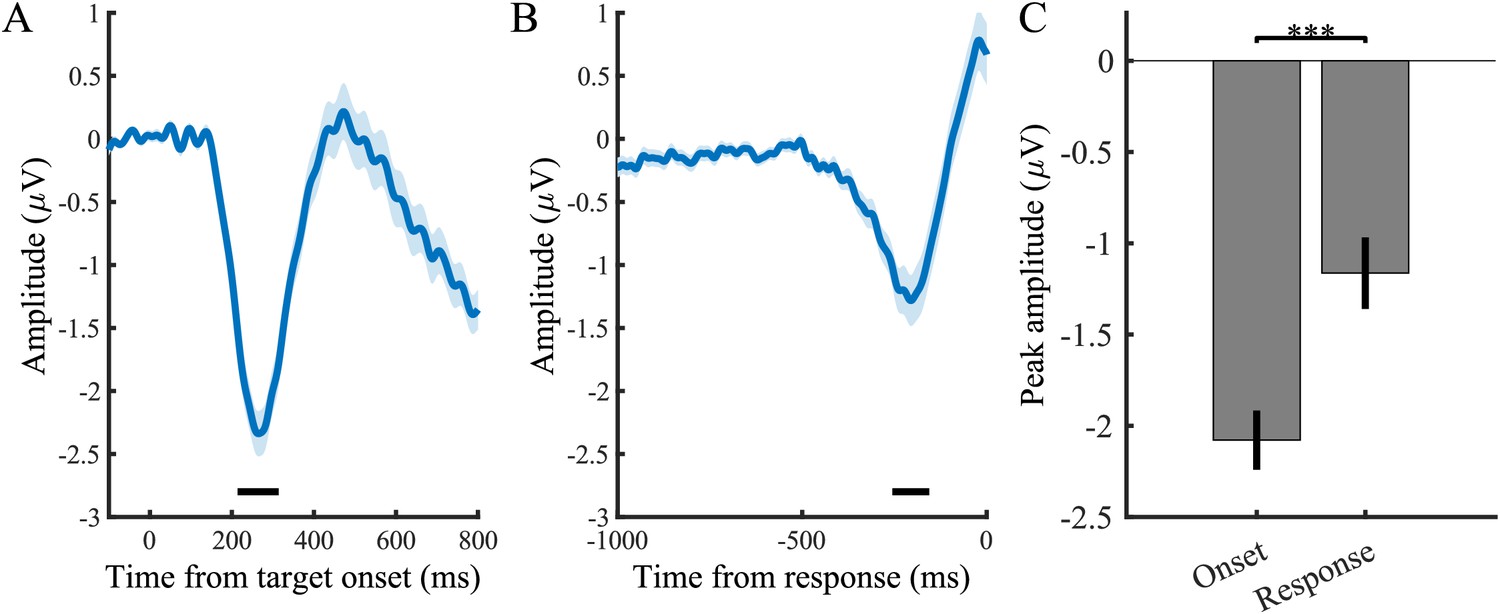
N2c amplitude is reduced when aligned to the response.
(A) N2c signal aligned to target onset. (B) N2c signal aligned to response. (C) N2c amplitude over a 100 ms window (black bars in A and B) aligned to target onset and response. Error bars denote ±1 standard error of the mean (SEM). Stats, Wilcoxon signed rank test.
Figure 2—figure supplement 2
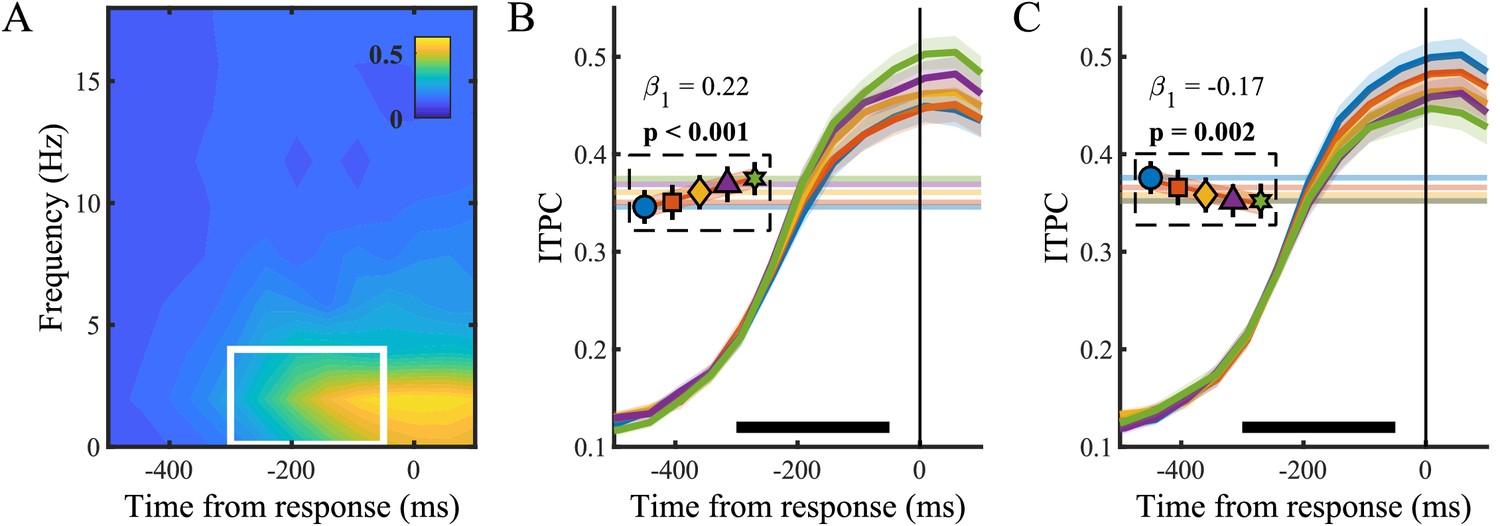
CPP ITPC aligned to response.
(A) Grand average inter-trial phase coherence (ITPC) per time-frequency point for the CPP aligned to response. The white box represents the time-frequency window selected for statistical analyses. (B) ITPC per pupil response bin over time for frequencies below 4 Hz. The black bar indicates the time window used for further analysis. Horizontal lines and markers indicate the averaged ITPC in the time-frequency window indicated by the white box in panel A. (C) Same as B, but binned by baseline pupil diameter. Error bars and shaded regions denote ± 1 SEM. Stats, linear mixed effects model analyses (Statistical analyses). Lines and shading indicate significant fits to the data.
Figure 3 with 1 supplement

The phasic pupil response in relation to EEG signatures of attentional engagement, motor response and early target selection.
(A) RT and RTcv in relation to pre-target α power. (B) Pre-target α power in relation to the pupil response. (C) Response-related left hemispheric β power (LHB) per pupil bin. Horizontal lines and markers indicate the average LHB in the time window indicated by the black bar. Inset shows LHB build-up rate, as determined by fitting a straight line through the LHB in the time window indicated by the grey bar. Note the reverse y-axis direction. (D) The stimulus-locked N2c (solid lines) and N2i (dashed lines) time-course binned by the pupil response. Vertical lines and markers show the peak latencies. Horizontal lines and markers show the average N2 amplitude during the time period indicated by the black (N2c) and grey (N2i) bars. (E–F) N2c (E) and N2i (F) ITPC per pupil bin over the time and frequency window determined based on the grand average ITPC (Figure 3—figure supplement 1). Insets show the scalp topography of each neural signal. Error bars and shaded regions denote ±1 SEM. Stats, linear mixed effects model analyses (Statistical analyses). Lines and shading indicate significant fits to the data.
-
Figure 3—source data 1
Csv table containing data for Figure 3 panel A.
- https://doi.org/10.7554/eLife.42541.017
-
Figure 3—source data 2
Csv table containing data for Figure 3 panel B-F.
- https://doi.org/10.7554/eLife.42541.018
Figure 3—figure supplement 1

N2 ITPC.
(A) Grand average inter-trial phase coherence (ITPC) per time-frequency point for the N2c. White box represents the time-frequency window selected for statistical analyses. (B) N2c ITPC per pupil response bin, (C) N2c ITPC per baseline pupil bin. Horizontal lines and markers indicate average ITPC per pupil bin during the time window indicated by the black bar. (D–F) As in A-C but for N2i. Note that the time window used for the N2i analysis did not cover the peak ITPC activity, but rather focused on the time window in which the N2i amplitude peaked (Figure 3D). Error bars and shaded regions denote ± 1 SEM. Stats, linear mixed effects model analyses (Statistical analyses).
Figure 4
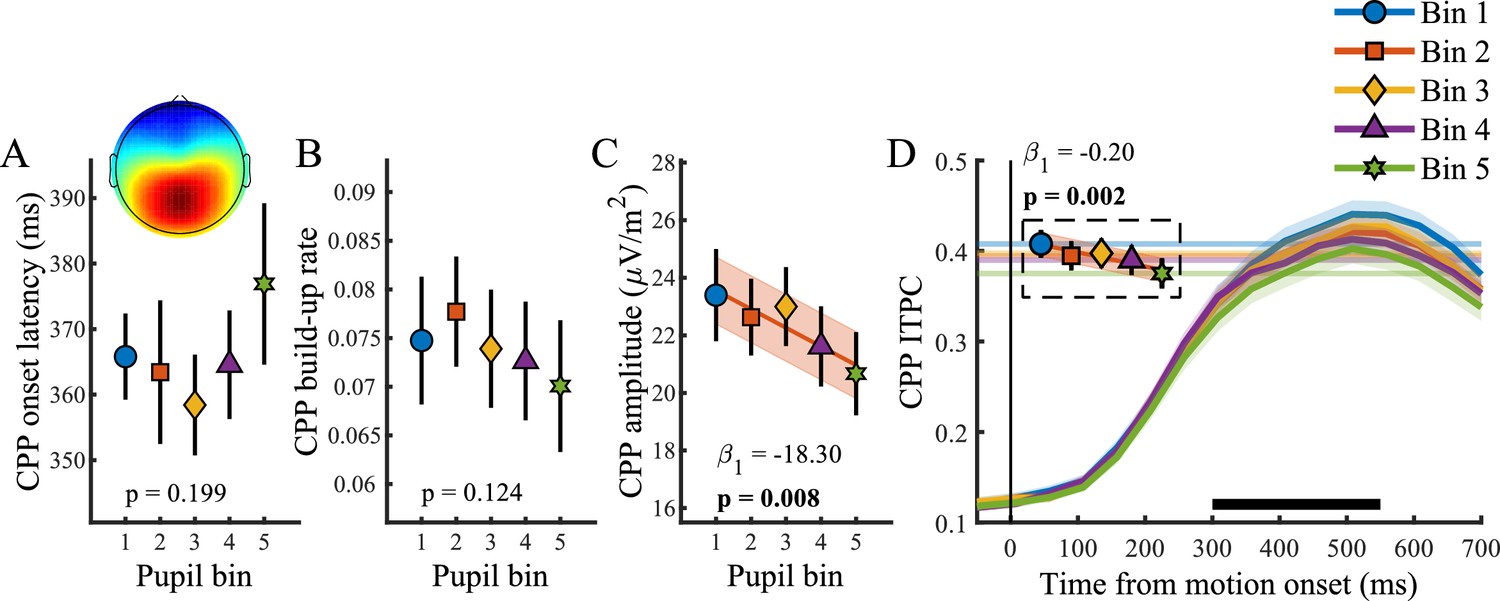
Relationship between baseline pupil diameter and the CPP.
(A) CPP onset latency, (B) build-up rate, (C) amplitude and (D) ITPC per pupil bin over time for frequencies below 4 Hz. The black bar indicates the time window used for further analysis. Horizontal lines and markers indicate the averaged ITPC in the time-frequency window indicated by the white box in Figure 2C. Error bars and shaded regions denote ±1 SEM. Stats, linear mixed effects model analyses (Statistical analyses). Lines and shading indicate significant fits to the data.
-
Figure 4—source data 1
Csv table containing data for Figure 4.
- https://doi.org/10.7554/eLife.42541.022
Figure 5
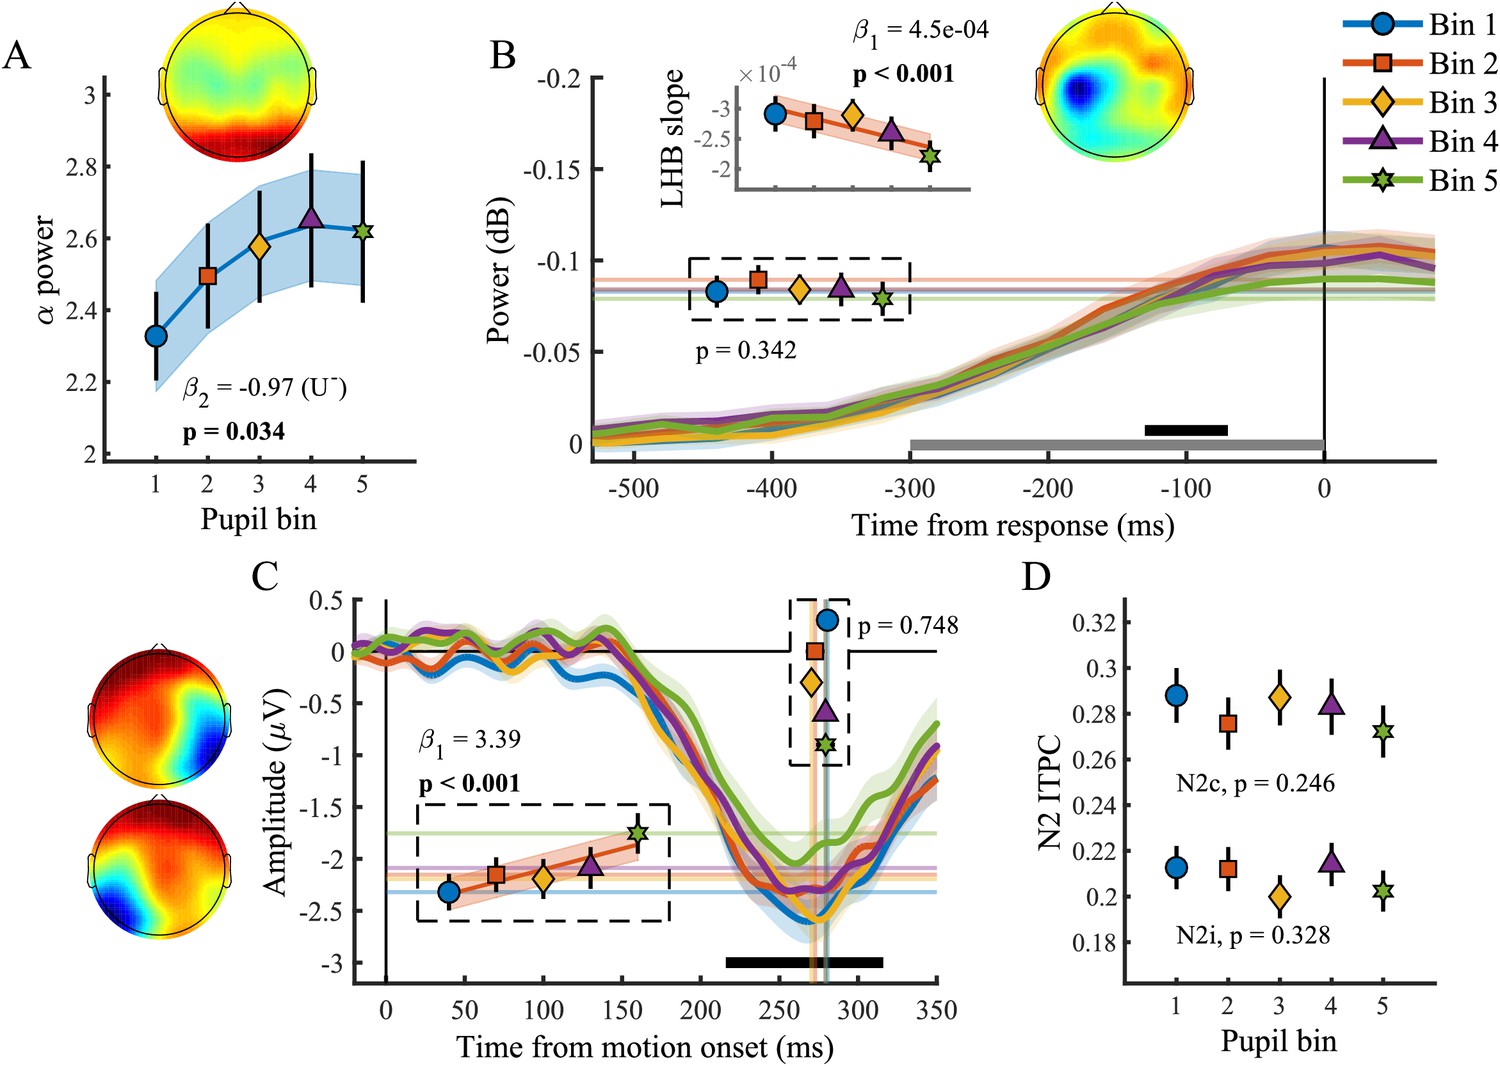
Baseline pupil diameter in relation to EEG signatures of attentional engagement, motor response and early target selection.
(A) Pre-target α power by baseline pupil diameter. (B) Response-related left hemispheric β power (LHB) per pupil bin. Horizontal lines and markers indicate the average LHB in the time window indicated by the black bar. Inset shows the LHB build-up rate, as determined by fitting a straight line through the LHB in the time window indicated by the grey bar. Note the reverse y-axis direction. (C) The stimulus-locked N2c time-course binned by baseline pupil diameter. Vertical lines and markers show the peak latencies. Horizontal lines and markers show the average N2c amplitude during the time period indicated by the black bar. (D) N2c and N2i ITPC per pupil bin averaged in a time-frequency window based on the grand average (Figure 3—figure supplement 1). Insets show the scalp topography of each neural signal. Error bars and shaded regions denote ±1 SEM. Stats, linear mixed effects model analyses (Statistical analyses). Lines and shading indicate significant fits to the data.
-
Figure 5—source data 1
Csv table containing data for Figure 5.
- https://doi.org/10.7554/eLife.42541.024
Tables
Table 1
Parameter estimates for the final linear mixed effect model of RT and RTcv binned by the pupil diameter response or baseline.
The only parameters included are the neural signals that significantly improved the model fit.
| RT | RTcv | |||||||
|---|---|---|---|---|---|---|---|---|
| β | β SE | T | P | β | β SE | T | P | |
| Pupil response | ||||||||
| pre-target α-power | 0.20 | 0.065 | 3.07 | 0.002 | ||||
| CPP ITPC | −0.19 | 0.034 | −5.51 | <0.001 | −0.21 | 0.049 | −4.22 | <0.001 |
| Baseline Pupil diameter | ||||||||
| N2c amplitude | 0.06 | 0.027 | 2.33 | 0.021 | ||||
| CPP ITPC | −0.17 | 0.033 | −5.21 | <0.001 | −0.31 | 0.056 | −5.48 | <0.001 |
Additional files
-
Supplementary file 1
Parameter estimates for the single-trial mixed effect model analysis predicting RT using linear and polynomial basis functions of baseline pupil diameter (BPD) and the pupil response (PR).
- https://doi.org/10.7554/eLife.42541.025
-
Supplementary file 2
Results from model comparisons of the hierarchical regression analysis predicting variability in task performance due to phasic arousal.
Boldface font indicates parameters that significantly improved the model fit compared to the addition of the neural signal associated with the previous neural processing stage. Red text indicates the parameters that were excluded from the final model during the forward/backward stepwise regression (main text). Final model fits revealed a marginal (conditional) r2 of 15.8% (92.6%) and 16.0% (45.9%) for RT and RTcv, respectively.
- https://doi.org/10.7554/eLife.42541.026
-
Supplementary file 3
Coefficients from the multilevel model analysis in which all EEG components were added simultaneously to predict variability in task performance due to variability in phasic arousal.
- https://doi.org/10.7554/eLife.42541.027
-
Supplementary file 4
Results from model comparisons of the hierarchical regression analysis predicting variability in task performance due to tonic arousal.
Boldface font indicates parameters that significantly improved the model fit compared to the addition of the neural signal associated with the previous neural processing stage. Red text indicates the parameters that were excluded from the final model during the forward/backward stepwise regression (main text). Final model fits revealed a marginal (conditional) r2 of 4.2% (94.4%) and 11.9% (44.5%) for RT and RTcv, respectively.
- https://doi.org/10.7554/eLife.42541.028
-
Supplementary file 5
Coefficients from the multilevel model analysis in which all EEG components were added simultaneously to predict variability in task performance due to variability in tonic arousal.
- https://doi.org/10.7554/eLife.42541.029
-
Transparent reporting form
- https://doi.org/10.7554/eLife.42541.030
Download links
A two-part list of links to download the article, or parts of the article, in various formats.
Downloads (link to download the article as PDF)
Open citations (links to open the citations from this article in various online reference manager services)
Cite this article (links to download the citations from this article in formats compatible with various reference manager tools)
Behavioural and neural signatures of perceptual decision-making are modulated by pupil-linked arousal
eLife 8:e42541.
https://doi.org/10.7554/eLife.42541


