Adaptation of hepatitis C virus to interferon lambda polymorphism across multiple viral genotypes
- École Polytechnique Fédérale de Lausanne, Switzerland
- Swiss Institute of Bioinformatics, Switzerland
- Gilead Sciences Inc, United States
- Goethe University Hospital, Germany
- Lausanne University Hospital, Switzerland
Figures
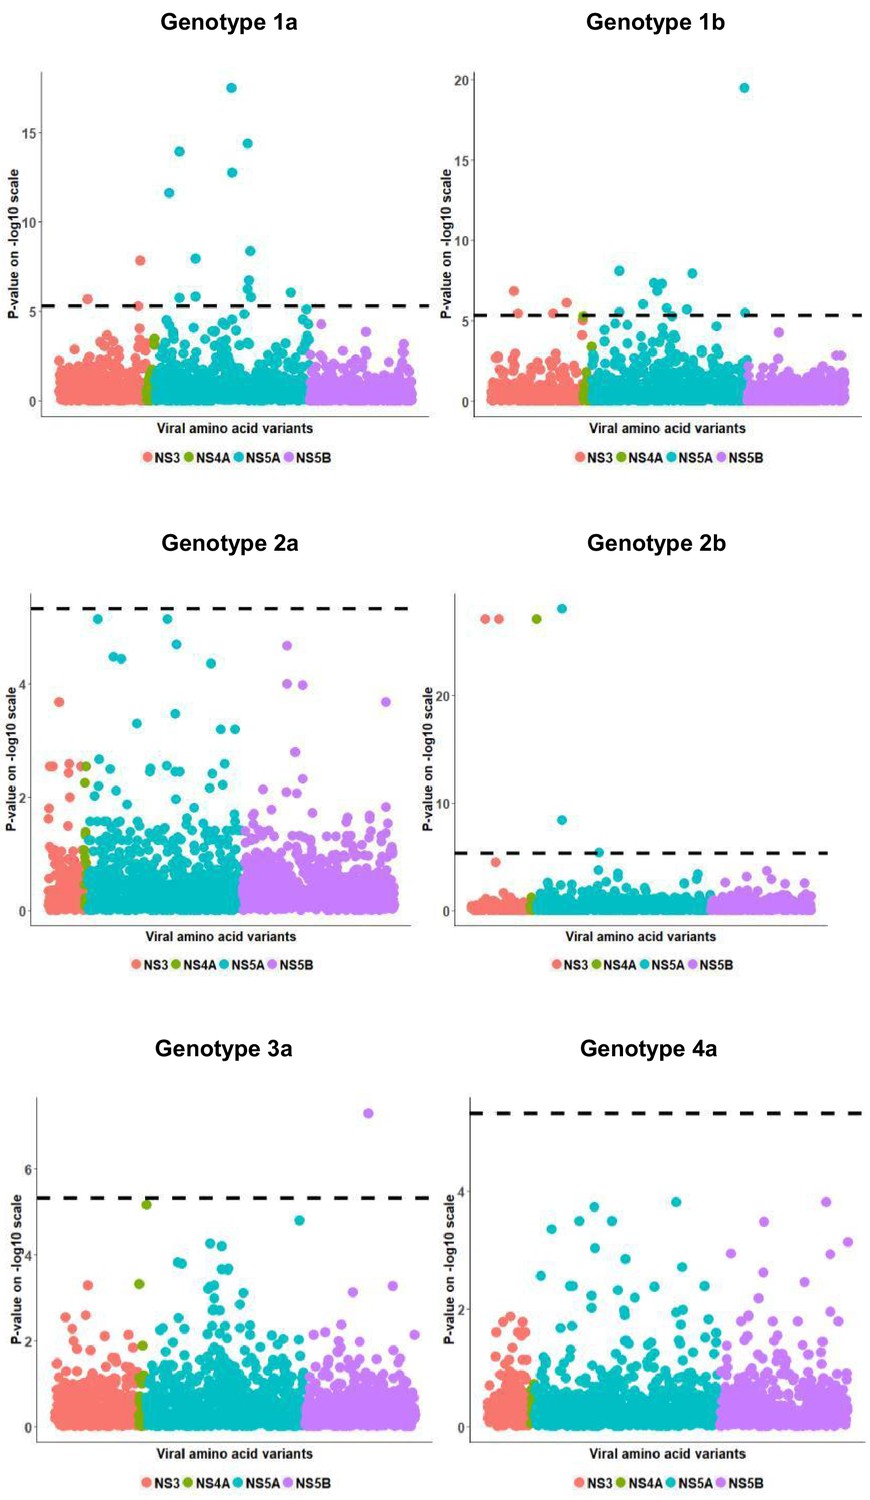
Figure 1 with 2 supplements

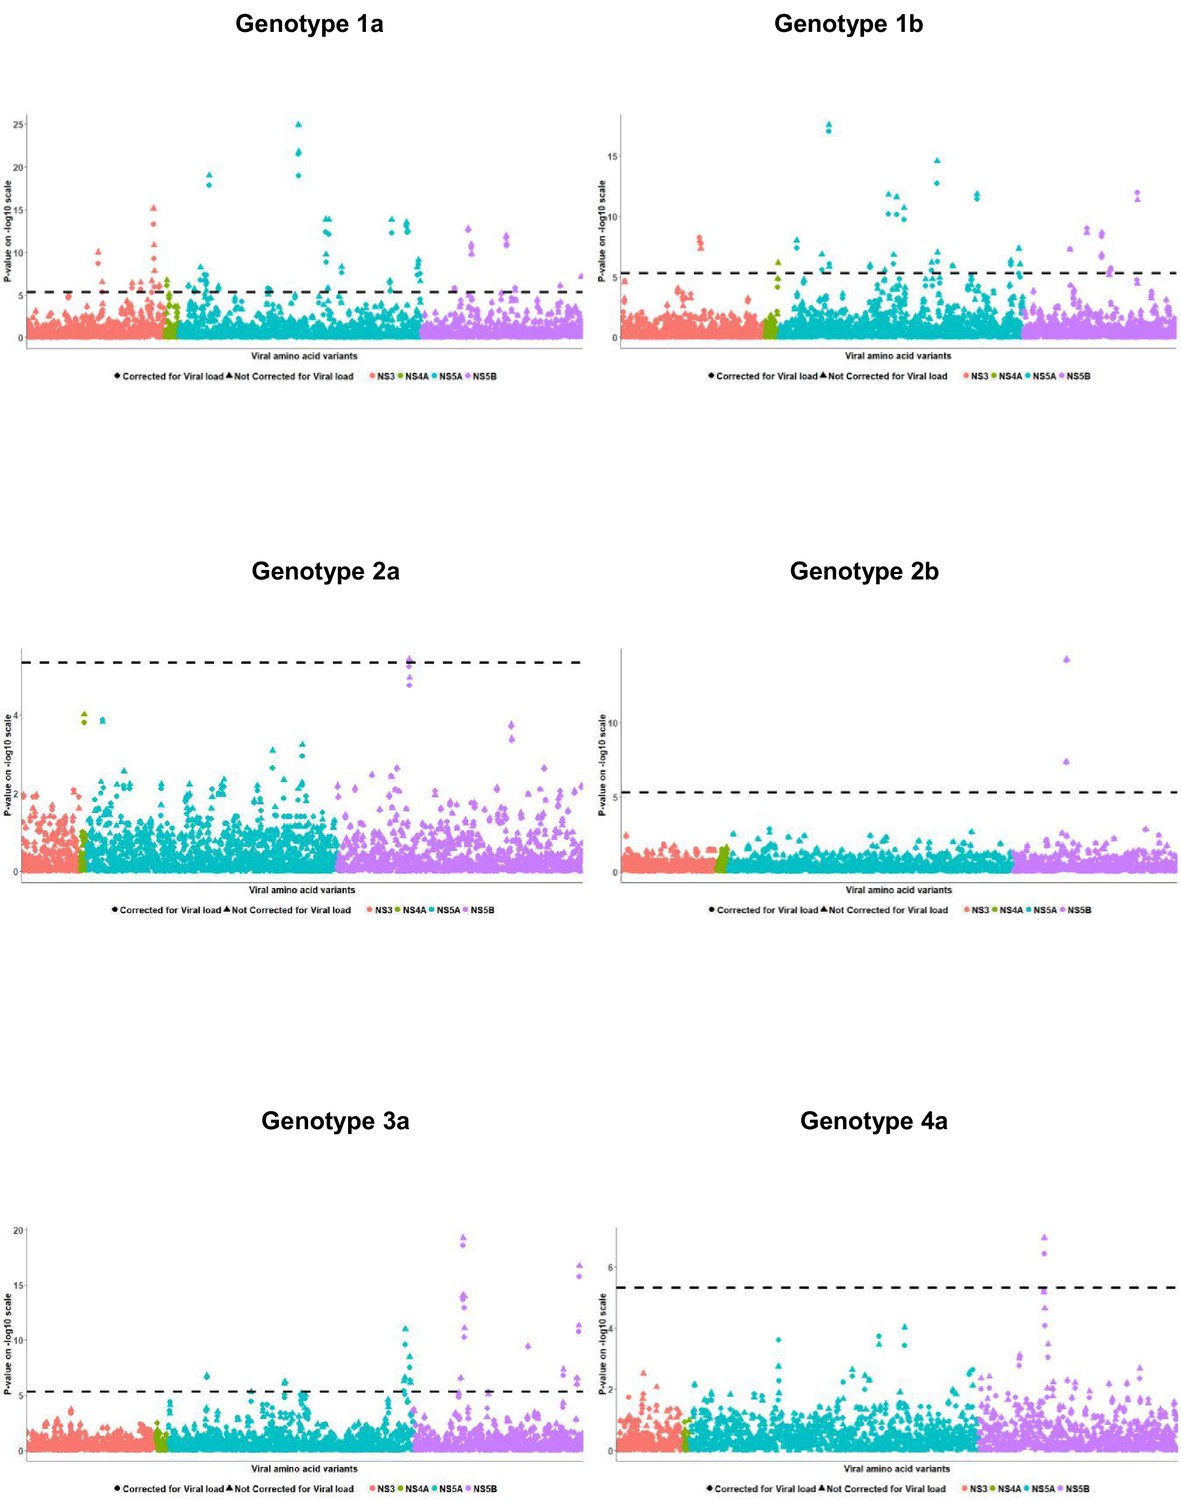
Per genotype integrated association analysis results.
Manhattan plot for associations between human SNP rs12979860 and HCV amino acid variants. The dotted line shows the Bonferroni-corrected significance threshold.
Figure 1—figure supplement 1
Per genotype integrated association analysis results corrected for HCV viral load.
Manhattan plot for associations between human SNP rs12979860 and HCV amino acid variants, with (filled dots) and without HCV (filled triangles) viral load. The dotted line shows the Bonferroni-corrected significance threshold.
Figure 1—figure supplement 2
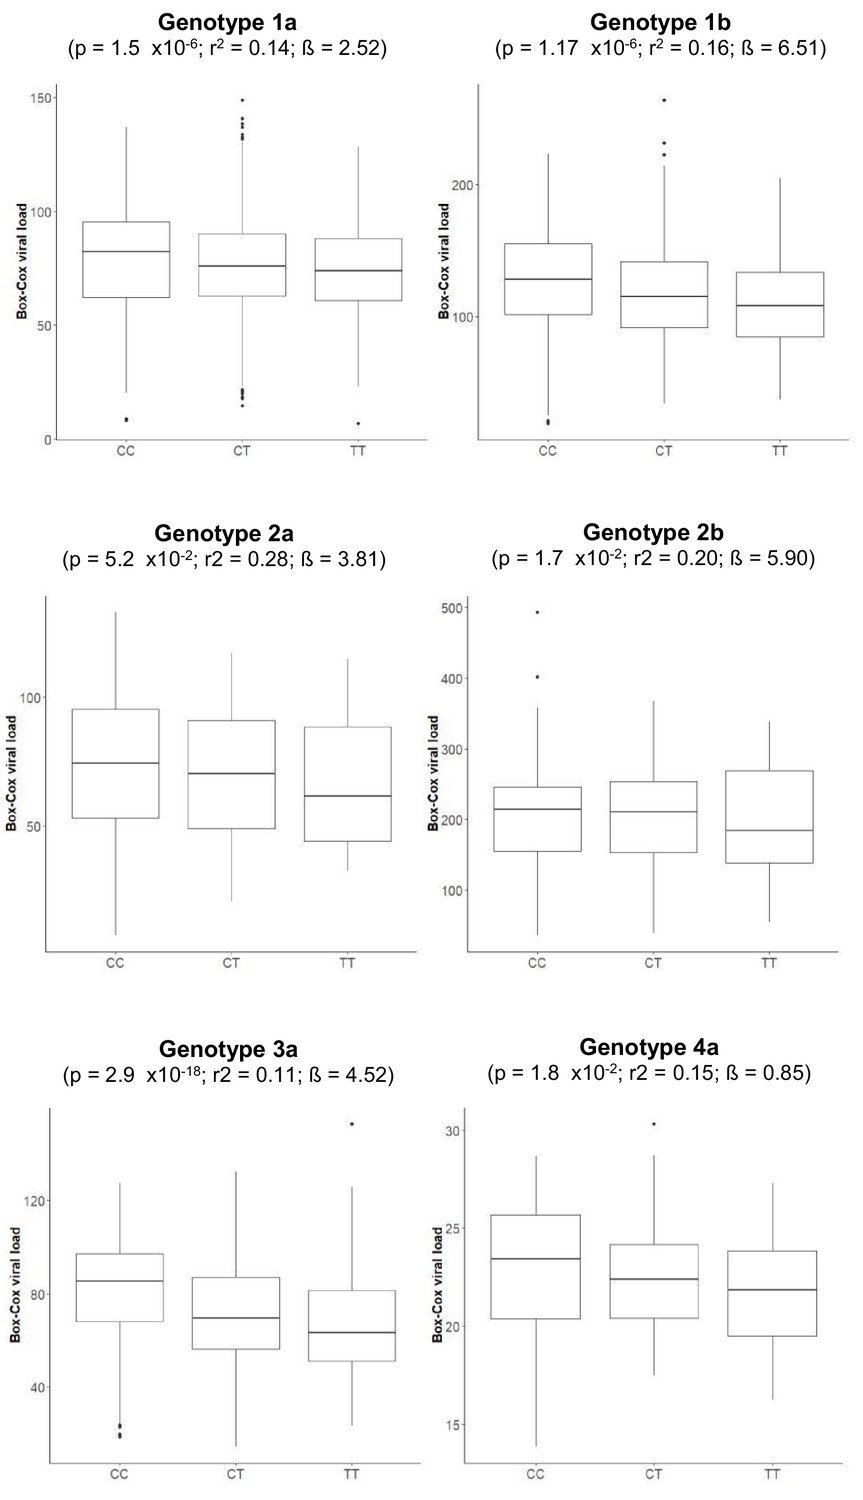
Boxplot of transformed viral load stratified by rs12979860 genotypes (CC, CT, TT).
The association p-values, together with r-squared and beta values, given in the brackets are for associations between rs12979860 and transformed HCV viral load.
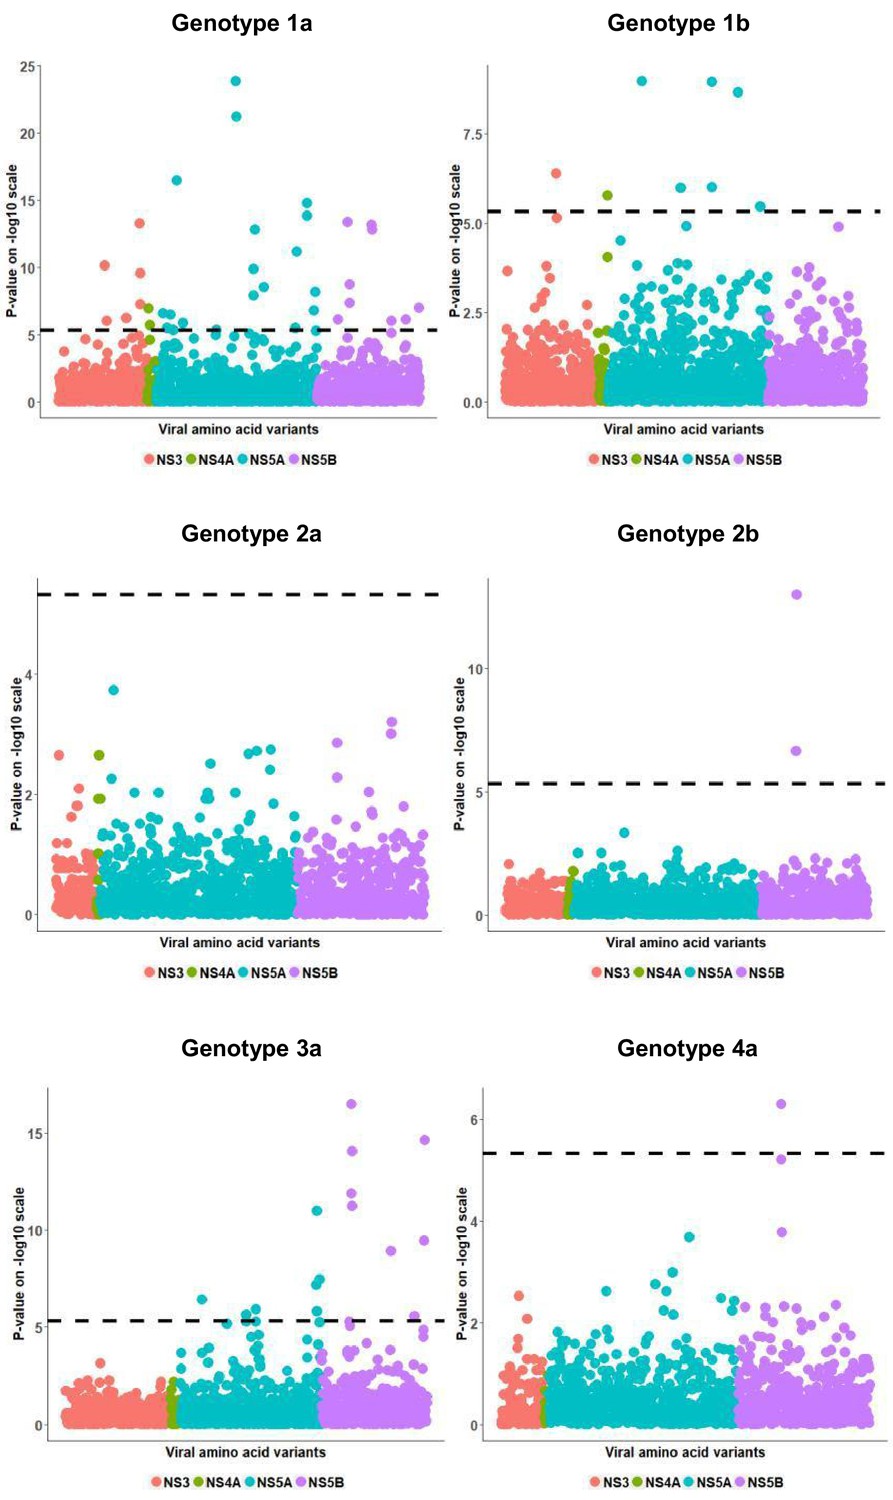
Figure 2

Per genotype viral load GWAS analysis results.
Manhattan plot for associations between human Box-Cox transformed pre-treatment viral load and HCV amino acid variants. The dotted line shows the Bonferroni-corrected significance threshold.
Figure 3 with 5 supplements
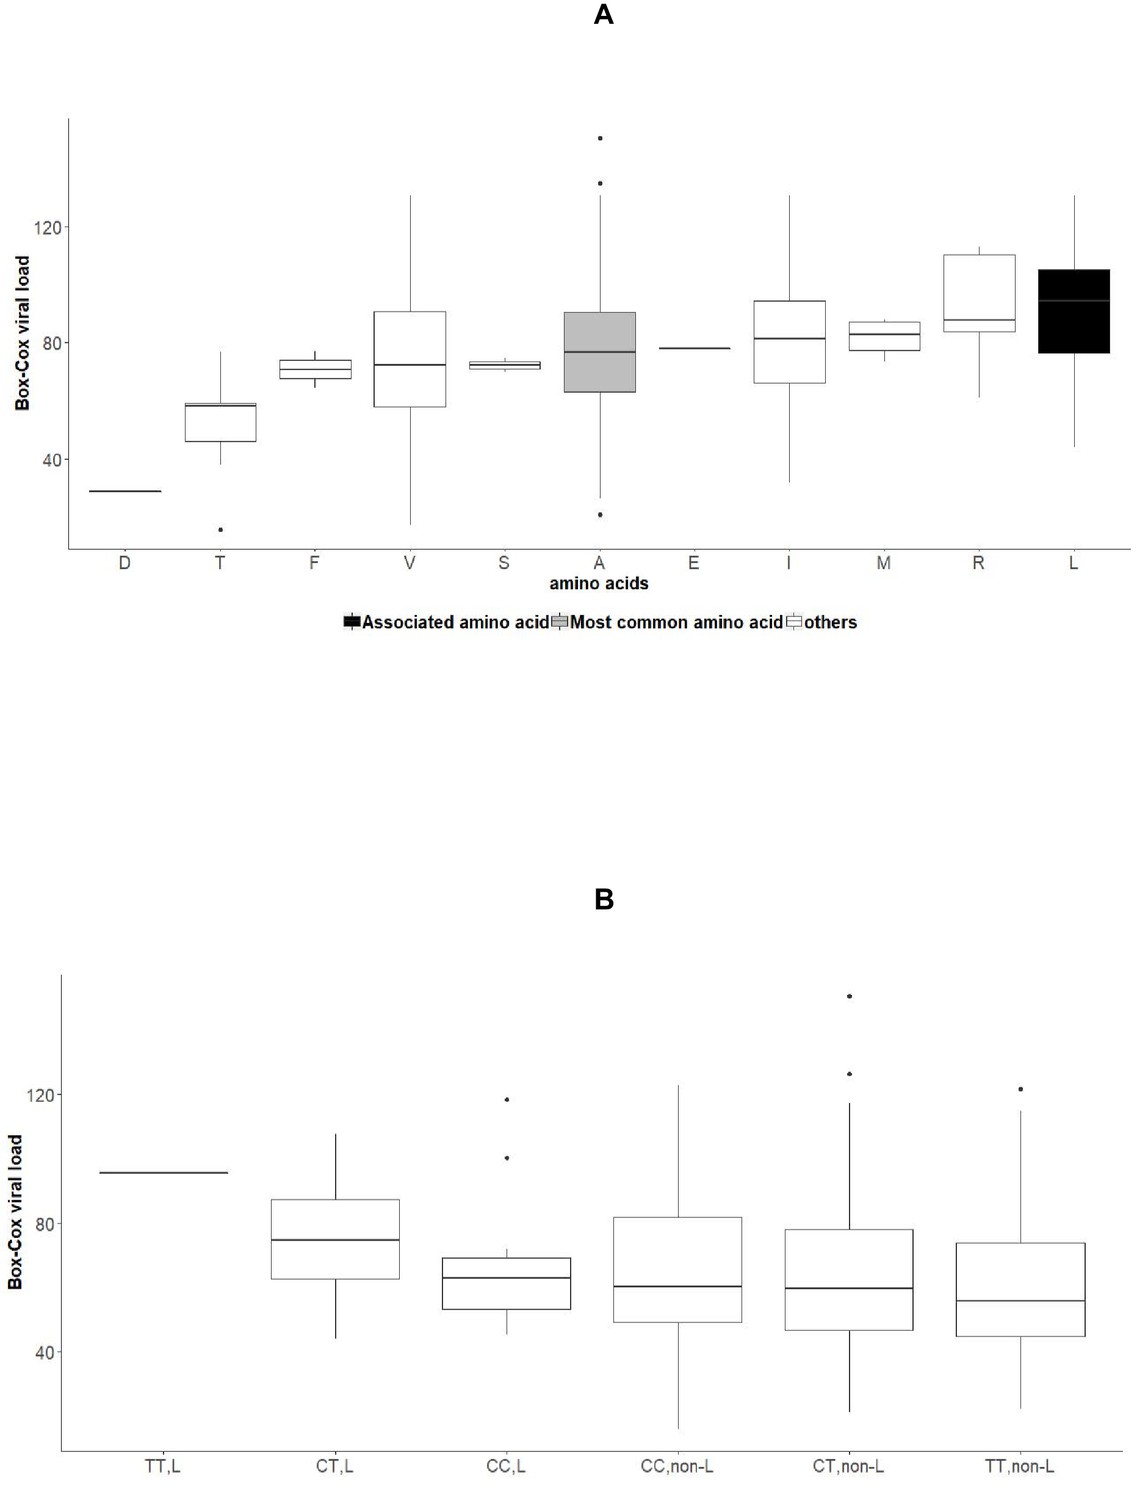
Associations between amino acid variables at position 2224 of NS5A, rs12979860 genotypes and HCV viral load in the group of patients infected with HCV genotype 1b.
(A) Boxplot of transformed viral load stratified by amino acids present at position 2224 of NS5A. (B): Boxplot of transformed viral load stratified by rs12979860 genotypes (CC, CT, TT) and by presence or absence of leucine at position 2224 of NS5A.
Figure 3—figure supplement 1
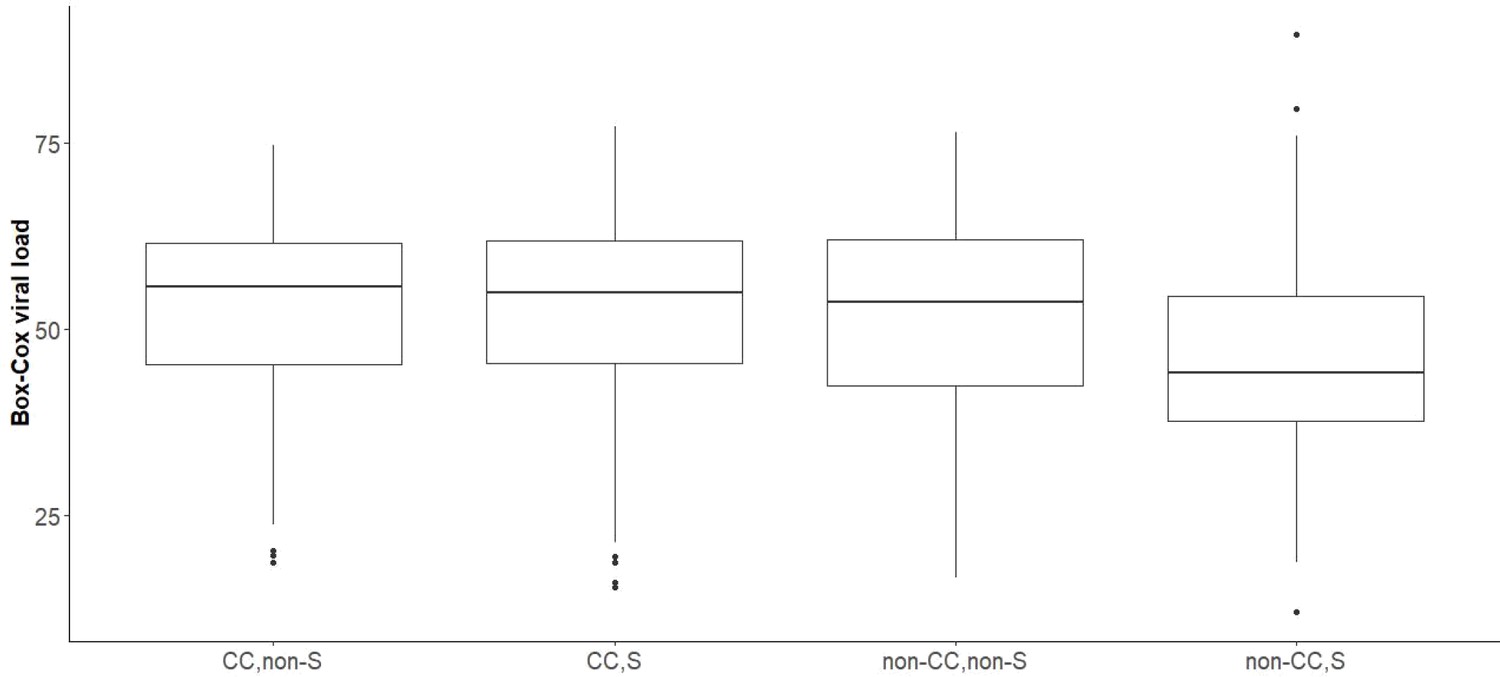
Boxplot of transformed viral load stratified by rs12979860 genotypes (CC, CT, TT) in samples infected with viral genotype 3a, whose virus carries Serine at position 2414.
https://doi.org/10.7554/eLife.42542.009
Figure 3—figure supplement 2
Per genotype viral load residual analysis results.
Manhattan plot for associations between viral load residual and HCV amino acid variants. The dotted line shows the Bonferroni-corrected significance threshold.
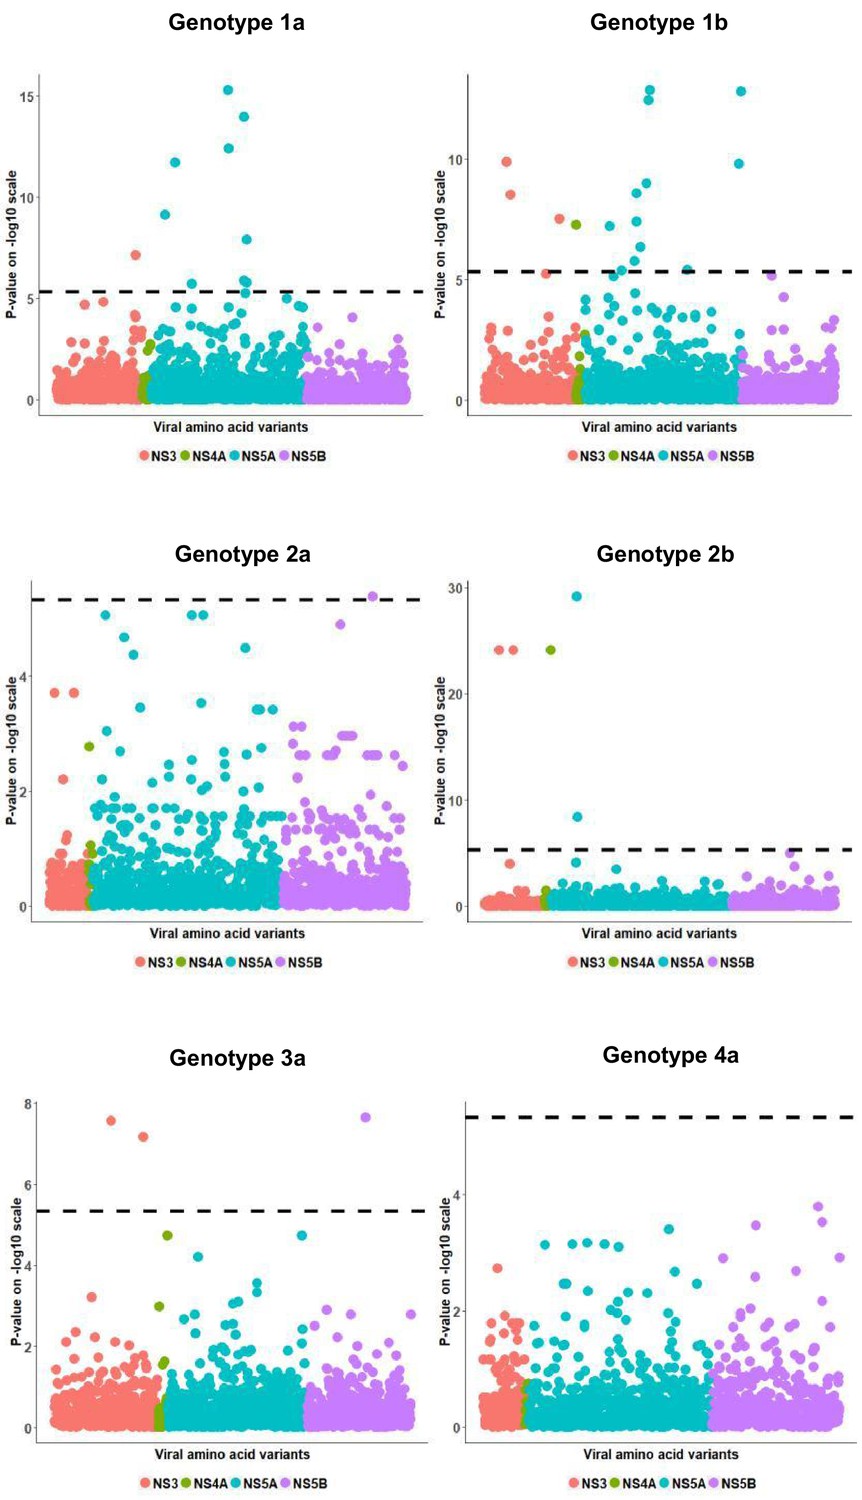
Figure 3—figure supplement 3
Per genotype integrated association analysis results in the European subgroup.
Manhattan plot for associations between human SNP rs12979860 and HCV amino acid variants. The dotted line shows the Bonferroni-corrected significance threshold.
Figure 3—figure supplement 4
European per genotype viral load GWAS analysis results.
Manhattan plot for associations between human Box-Cox transformed pre-treatment viral load and HCV amino acid variants. The dotted line shows the Bonferroni-corrected significance threshold.
Figure 3—figure supplement 5
European per genotype viral load residual GWAS analysis results.
Manhattan plot for associations between viral load residual and HCV amino acid variants. The dotted line shows the Bonferroni-corrected significance threshold.
Tables
Table 1
Characteristics of study participants, by HCV genotype group.
https://doi.org/10.7554/eLife.42542.002| HCV genotype | All | 1a | 1b | 2a | 2b | 3a | 4a | Others |
|---|---|---|---|---|---|---|---|---|
| N | 8729 | 3548 (41) | 1924 (22) | 304 (3) | 472 (5) | 1839 (21) | 193 (2) | 449 (5) |
| Europeans Asians Africans Others | 6704 (77) 1103 (13) 723 (8) 199 (2) | 2987 (84) 59 (2) 421 (12) 81 (2) | 1133 (59) 577 (30) 192 (10) 22 (1) | 100 (33) 197 (65) 7 (2) 0 (0) | 421 (89) 15 (3) 25 (5) 11 (2) | 1635 (89) 111 (6) 19 (1) 74 (4) | 178 (92) 2 (1) 8 (4) 5 (3) | 250 (56) 142 (32) 51 (11) 6 (1) |
| Cirrhosis | 2410 (28) | 978 (28) | 536 (28) | 35 (12) | 77 (16) | 629 (34) | 60 (31) | 95 (21) |
| Male sex | 5605 (64) | 2434 (69) | 1096 (57) | 141 (46) | 301 (64) | 1230 (67) | 143 (74) | 260 (58) |
| SVR | 7702 (88) | 3240 (91) | 1773 (92) | 273 (90) | 426 (90) | 1452 (79) | 153 (79) | 385 (86) |
-
Data are indicated as number (percent); SVR: sustained virological response after treatment.
Table 2
Genome-to-genome analysis results per genotype.
The table shows significant p-values (<4.7×10⁻⁶), NA representing non-significant associations. We also give odds ratio (OR) and 97% confidence interval for each significant association.
| HCV gene | Position (amino acid) | Genotype 1a N = 3548 | Genotype 1b N = 1924 | Genotype 2a N = 304 | Genotype 2b N = 472 | Genotype 3a N = 1839 | Genotype 4a N = 193 |
|---|---|---|---|---|---|---|---|
| NS3 | 1332(A) | 1.02e-10 (OR 1.06; 1.04–1.08) | NA | NA | NA | NA | NA |
| NS3 | 1355(I) | 3.14e-07 (OR 1.1; 1.06–1.14) | NA | NA | NA | NA | NA |
| NS3 | 1370(I) | NA | 1.09e-08 (OR 0.83; 0.78–0.88) | NA | NA | NA | NA |
| NS3 | 1370(T) | NA | 4.87e-08 (OR 1.2; 1.12–1.28) | NA | NA | NA | NA |
| NS3 | 1473(D) | 3.82e-07 (OR 1.03 1.02–1.04) | NA | NA | NA | NA | NA |
| NS3 | 1516(I) | 3.51e-07 (OR 1.06; 1.04–1.09) | NA | NA | NA | NA | NA |
| NS3 | 1598(R) | 2.26e-07 (OR 1.04; 1.02–1.05) | NA | NA | NA | NA | NA |
| NS3 | 1612(I) | 7.88e-16 (OR 0.86; 0.83–0.89) | NA | NA | NA | NA | NA |
| NS3 | 1612(N) | 1.54e-11 (OR 1.09; 1.06–1.11) | NA | NA | NA | NA | NA |
| NS3 | 1612(T) | 1.54e-08 (OR 1.11; 1.07–1.15) | NA | NA | NA | NA | NA |
| NS3 | 1635(I) | 7e-07 (OR 1.1; 1.06–1.14) | NA | NA | NA | NA | NA |
| NS4A | 1671(T) | 1.83e-07 (OR 1.03; 1.02–1.04) | NA | NA | NA | NA | NA |
| NS4A | 1703(R) | NA | 6.94e-07 (OR 1.19; 1.11–1.27) | NA | NA | NA | NA |
| NS5A | 1996(R) | 7.87e-07 (OR 1.01; 1.01–1.02) | NA | NA | NA | NA | NA |
| NS5A | 2009(F) | NA | 1.04e-08 (OR 1.11; 1.07–1.15) | NA | NA | NA | NA |
| NS5A | 2009(I) | 2.01e-06 (OR 1.02; 1.01–1.02) | NA | NA | NA | NA | NA |
| NS5A | 2024(V) | 5.81e-09 (OR 1.04; 1.03–1.05) | NA | NA | NA | NA | NA |
| NS5A | 2034(D) | 1.75e-07 (OR 1.03; 1.02–1.04) | NA | NA | NA | NA | NA |
| NS5A | 2034(T) | NA | NA | NA | NA | 1.61e-07 (OR 0.91; 0.87–0.94) | NA |
| NS5A | 2040(K) | 3.05e-06 (OR 0.98; 0.97–0.99) | NA | NA | NA | NA | NA |
| NS5A | 2040(R) | 2.54e-07 (OR 1.03; 1.02–1.04) | NA | NA | NA | NA | NA |
| NS5A | 2047(A) | 9.8e-20 (OR 1.07; 1.06–1.09) | NA | NA | NA | NA | NA |
| NS5A | 2065(H) | 9.81e-07 (OR 1.01; 1.01–1.02) | 1.38e-07 (OR 1.06; 1.04–1.09) | NA | NA | NA | NA |
| NS5A | 2080(K) | NA | 2.9e-18 (OR 1.12; 1.09–1.14) | NA | NA | NA | NA |
| NS5A | 2080(R) | NA | 1.39e-06 (OR 0.95; 0.93–0.97) | NA | NA | NA | NA |
| NS5A | 2187(R) | NA | 1.07e-06 (OR 1.07; 1.04–1.09) | NA | NA | NA | NA |
| NS5A | 2211(L) | 2.84e-06 (OR 0.99; 0.98–0.99) | NA | NA | NA | NA | NA |
| NS5A | 2220(R) | NA | 2.65e-06 (OR 1.03; 1.02–1.04) | NA | NA | NA | NA |
| NS5A | 2224(L) | NA | 1.6e-12 (OR 1.05; 1.04–1.07) | NA | NA | NA | NA |
| NS5A | 2234(W) | NA | 1.46e-07 (OR 1.06; 1.03–1.08) | NA | NA | NA | NA |
| NS5A | 2237(K) | NA | 2.6e-12 (OR 1.06; 1.04–1.08) | NA | NA | NA | NA |
| NS5A | 2251(I) | NA | 2.05e-11 (OR 1.07; 1.05–1.09) | NA | NA | NA | NA |
| NS5A | 2252(I) | 1.29e-25 (OR 1.12; 1.1–1.15) | NA | NA | NA | 8.68e-07 (OR 1.05; 1.03–1.07) | NA |
| NS5A | 2252(V) | 1.72e-22 (OR 0.89; 0.87–0.91) | NA | NA | NA | 5.5e-07 (OR 0.95; 0.92–0.97) | NA |
| NS5A | 2287(I) | 1.54e-14 (OR 1.09; 1.07–1.12) | 6.24e-07 (OR 1.08; 1.05–1.11) | NA | NA | NA | NA |
| NS5A | 2287(V) | 1.82e-10 (OR 0.92; 0.90–0.95) | NA | NA | NA | NA | NA |
| NS5A | 2298(I) | 1.56e-06 (OR 1.05; 1.03–1.08) | NA | NA | NA | NA | NA |
| NS5A | 2298(V) | 1.66e-14 (OR 0.92; 0.90–0.94) | NA | NA | NA | NA | NA |
| NS5A | 2300(P) | NA | 2.7e-15 (OR 1.12; 1.09–1.15) | NA | NA | NA | NA |
| NS5A | 2300(S) | NA | 9.41e-08 (OR 0.94; 0.91–0.96) | NA | NA | NA | NA |
| NS5A | 2320(Q) | 5.01e-09 (OR 1.08; 1.05–1.11) | NA | NA | NA | NA | NA |
| NS5A | 2330(R) | NA | 1.26e-06 (OR 1.03; 1.02–1.04) | NA | NA | NA | NA |
| NS5A | 2360(A) | NA | 1.46e-12 (OR 1.12; 1.09–1.16) | NA | NA | NA | NA |
| NS5A | 2371(S) | 2.03e-07 (OR 1.03; 1.02–1.04) | NA | NA | NA | NA | NA |
| NS5A | 2372(A) | 2.44e-06 (OR 0.96; 0.94–0.97) | NA | NA | NA | NA | NA |
| NS5A | 2372(S) | 1.63e-14 (OR 1.06; 1.04–1.07) | NA | NA | NA | NA | NA |
| NS5A | 2385(C) | 3.24e-14 (OR 1.09; 1.07–1.11) | 4.35e-07 (OR 1.04; 1.03–1.06) | NA | NA | NA | NA |
| NS5A | 2385(Y) | 2.7e-13 (OR 0.93; 0.91–0.94) | NA | NA | NA | NA | NA |
| NS5A | 2411(G) | NA | 4.61e-08 (OR 1.11; 1.07–1.15) | NA | NA | NA | NA |
| NS5A | 2411(S) | NA | 9.02e-07 (OR 0.92; 0.89–0.95) | NA | NA | NA | NA |
| NS5A | 2412(K) | 5.74e-09 (OR 1.03; 1.02–1.05) | NA | NA | NA | NA | NA |
| NS5A | 2412(T) | 7.87e-10 (OR 0.93; 0.91–0.95) | NA | NA | NA | NA | NA |
| NS5A | 2414(D) | 2.43e-07 (OR 0.97; 0.96–0.98) | NA | NA | NA | NA | NA |
| NS5A | 2416(G) | NA | NA | NA | NA | 5.21e-07 (OR 1.06; 1.04–1.09) | NA |
| NS5A | 2416(N) | NA | NA | NA | NA | 2.5e-07 (OR 1.09; 1.05–1.12) | NA |
| NS5A | 2416(S) | NA | NA | NA | NA | 1.04e-11 (OR 0.89; 0.86–0.92) | NA |
| NS5A | 2420(N) | NA | NA | NA | NA | 3.39e-09 (OR 1.08; 1.05–1.11) | NA |
| NS5A | 2420(S) | NA | NA | NA | NA | 7.1e-07 (OR 0.95; 0.93–0.97) | NA |
| NS5B | 2510(N) | 2.25e-06 (OR 1.02; 1.01–1.03) | NA | NA | NA | NA | NA |
| NS5B | 2567(I) | 1.73e-13 (OR 1.02; 1.02–1.03) | 5.73e-08 (OR 1.07; 1.04–1.09) | NA | NA | NA | NA |
| NS5B | 2570(A) | NA | NA | NA | NA | 2.63e-07 (OR 1.11; 1.06–1.15) | NA |
| NS5B | 2570(T) | NA | NA | NA | NA | 8.87e-15 (OR 1.11; 1.08–1.14) | NA |
| NS5B | 2570(V) | NA | NA | NA | NA | 5.57e-20 (OR 0.84; 0.81–0.87) | NA |
| NS5B | 2576(A) | 1.21e-11 (OR 1.02; 1.01–1.02) | NA | 3.84e-06 (OR 1.27; 1.15–1.4) | 4.02e-08 (OR 1.2; 1.13–1.28) | 1.04e-14 OR 1.07; 1.05–1.08) | NA |
| NS5B | 2576(P) | 1.53e-10 (OR 0.98; 0.98–0.99) | NA | NA | 5.41e-15 (OR 0.77; 0.72–0.82) | 8.39e-12 (OR 0.95; 0.94–0.96) | 1.13e-07 (OR 0.83; 0.77–0.88) |
| NS5B | 2633(S) | NA | 2.33e-09 (OR 1.08; 1.06–1.11) | NA | NA | NA | NA |
| NS5B | 2729(Q) | 1.19e-12 (OR 0.91; 0.89–0.94) | 1.38e-07 (OR 0.94; 0.92–0.96) | NA | NA | NA | NA |
| NS5B | 2729(R) | 9.13e-12 (OR 1.09; 1.06–1.12) | 2.22e-09 (OR 1.08; 1.05–1.11) | NA | NA | NA | NA |
| NS5B | 2755(N) | 2.98e-06 (OR 1.04; 1.02–1.06) | NA | NA | NA | NA | NA |
| NS5B | 2758(A) | NA | 2.3e-06 (OR 1.05; 1.03–1.07) | NA | NA | NA | NA |
| NS5B | 2794(Q) | NA | NA | NA | NA | 3.56e-10 (OR 1.08; 1.05–1.1) | NA |
| NS5B | 2860(G) | NA | 4.63e-12 (OR 1.07; 1.05–1.09) | NA | NA | NA | NA |
| NS5B | 2937(K) | 8.23e-07 (OR 0.95; 0.93–0.97) | NA | NA | NA | NA | NA |
| NS5B | 2937(R) | NA | NA | NA | NA | 4.4e-08 (OR 1.08; 1.05–1.11) | NA |
| NS5B | 2986(H) | NA | NA | NA | NA | 1.03e-06 (OR 0.95; 0.93–0.97) | NA |
| NS5B | 2986(R) | NA | NA | NA | NA | 2.9e-07 (OR 1.05; 1.03–1.07) | NA |
| NS5B | 2991(H) | NA | NA | NA | NA | 4.66e-12 (OR 0.88; 0.85–0.91) | NA |
| NS5B | 2991(Y) | NA | NA | NA | NA | 1.86e-17 (OR 1.17; 1.13–1.22) | NA |
| NS5B | 3008(F) | 7.47e-08 (OR 1.01; 1.01–1.02) | NA | NA | NA | NA | NA |
Additional files
-
Supplementary file 1
HCV amino acid positions with significant association p-values from genome-to-genome analysis (column 3), viral load GWAS analysis (column 4) and viral load residual GWAS analysis (column 5) for viral genotype 1a.
HCV genes and positions on the HCV proteome are given in the first and the second column of the table. Amino acid residuals on the associated positions are given in the second column.
- https://doi.org/10.7554/eLife.42542.014
-
Supplementary file 2
HCV amino acid positions with significant association p-values from genome-to-genome analysis (column 3), viral load GWAS analysis (column 4) and viral load residual GWAS analysis (column 5) for viral genotype 1b.
HCV genes and positions on the HCV proteome are given in the first and the second column of the table. Amino acid residuals on the associated positions are given in the second column.
- https://doi.org/10.7554/eLife.42542.015
-
Supplementary file 3
Genome to genome analysis results for Asians and Europeans.
The table consists of significant p-values and NA represents non-significant p-values.
- https://doi.org/10.7554/eLife.42542.016
-
Supplementary file 4
Genome to genome analysis results per genotype in European samples.
The table consists of significant p-values and NA represents non-significant p-values.
- https://doi.org/10.7554/eLife.42542.017
-
Supplementary file 5
HCV amino acid positions with significant association p-values from genome-to-genome analysis (column 3), viral load GWAS analysis (column 4) and viral load residual GWAS analysis (column 5), for European samples infected with viral genotype 1a.
HCV genes and positions on the HCV proteome are given in the first and the second column of the table. Amino acid residuals on the associated positions are given in the second column.
- https://doi.org/10.7554/eLife.42542.018
-
Transparent reporting form
- https://doi.org/10.7554/eLife.42542.019
Download links
A two-part list of links to download the article, or parts of the article, in various formats.
Downloads (link to download the article as PDF)
Open citations (links to open the citations from this article in various online reference manager services)
Cite this article (links to download the citations from this article in formats compatible with various reference manager tools)
Adaptation of hepatitis C virus to interferon lambda polymorphism across multiple viral genotypes
eLife 8:e42542.
https://doi.org/10.7554/eLife.42542


