Narrow equilibrium window for complex coacervation of tau and RNA under cellular conditions
- University of California Santa Barbara, United States
Figures
Figure 1 with 4 supplements

Steady tau dynamics and reversible droplet formation of tau-RNA complex coacervates.
(A) Diagram of tau187 and polyU RNA. Tau187 is a truncated version of full-length human tau (2N4R 255-441) containing repeat domains and C terminal. At neutral pH experimental conditions, tau187 is overall positively charged; while RNA consists of a phosphate backbone and is negatively charged. (B) Scheme of tau-RNA CC preparation. Mixing clear tau187 and RNA solutions at proper conditions results in a turbid solution containing liquid droplets. (C) X-band cw-EPR spectra (solid line) of tau187 solution (tau187, red), tau187-RNA CC (blue) and tau187-heparin (green) at room temperature with different incubation time, tinc. Samples contains 500 μM tau with 20% spin-labelled. EPR simulation were performed (see Materials and methods) and the fitted spectra is shown as a dashed line. (D) Rotational correlation time, τR extracted from EPR simulation shown in (C) (see Materials and methods). (E) Turbidity of tau187-RNA suspension in consecutive heating-cooling cycles. Confocal images represented samples at 19 °C and 25 °C. Temperatures were ramped at 1 °C/min.
-
Figure 1—source data 1
Primary sequences of tau187 and tau114 used in the experiments and FH-VO calculation.
- https://doi.org/10.7554/eLife.42571.008
Figure 1—figure supplement 1

ThT fluorescence of tau-RNA CC.
100 μM of tau187 and tau187-SL was mixed with 300 μg/mL polyU RNA (RNA) at room temperature. 100 μM tau187 with 25 μM heparin was prepared as reference. Ribbon shows the standard deviation of three replicates.
Figure 1—figure supplement 2
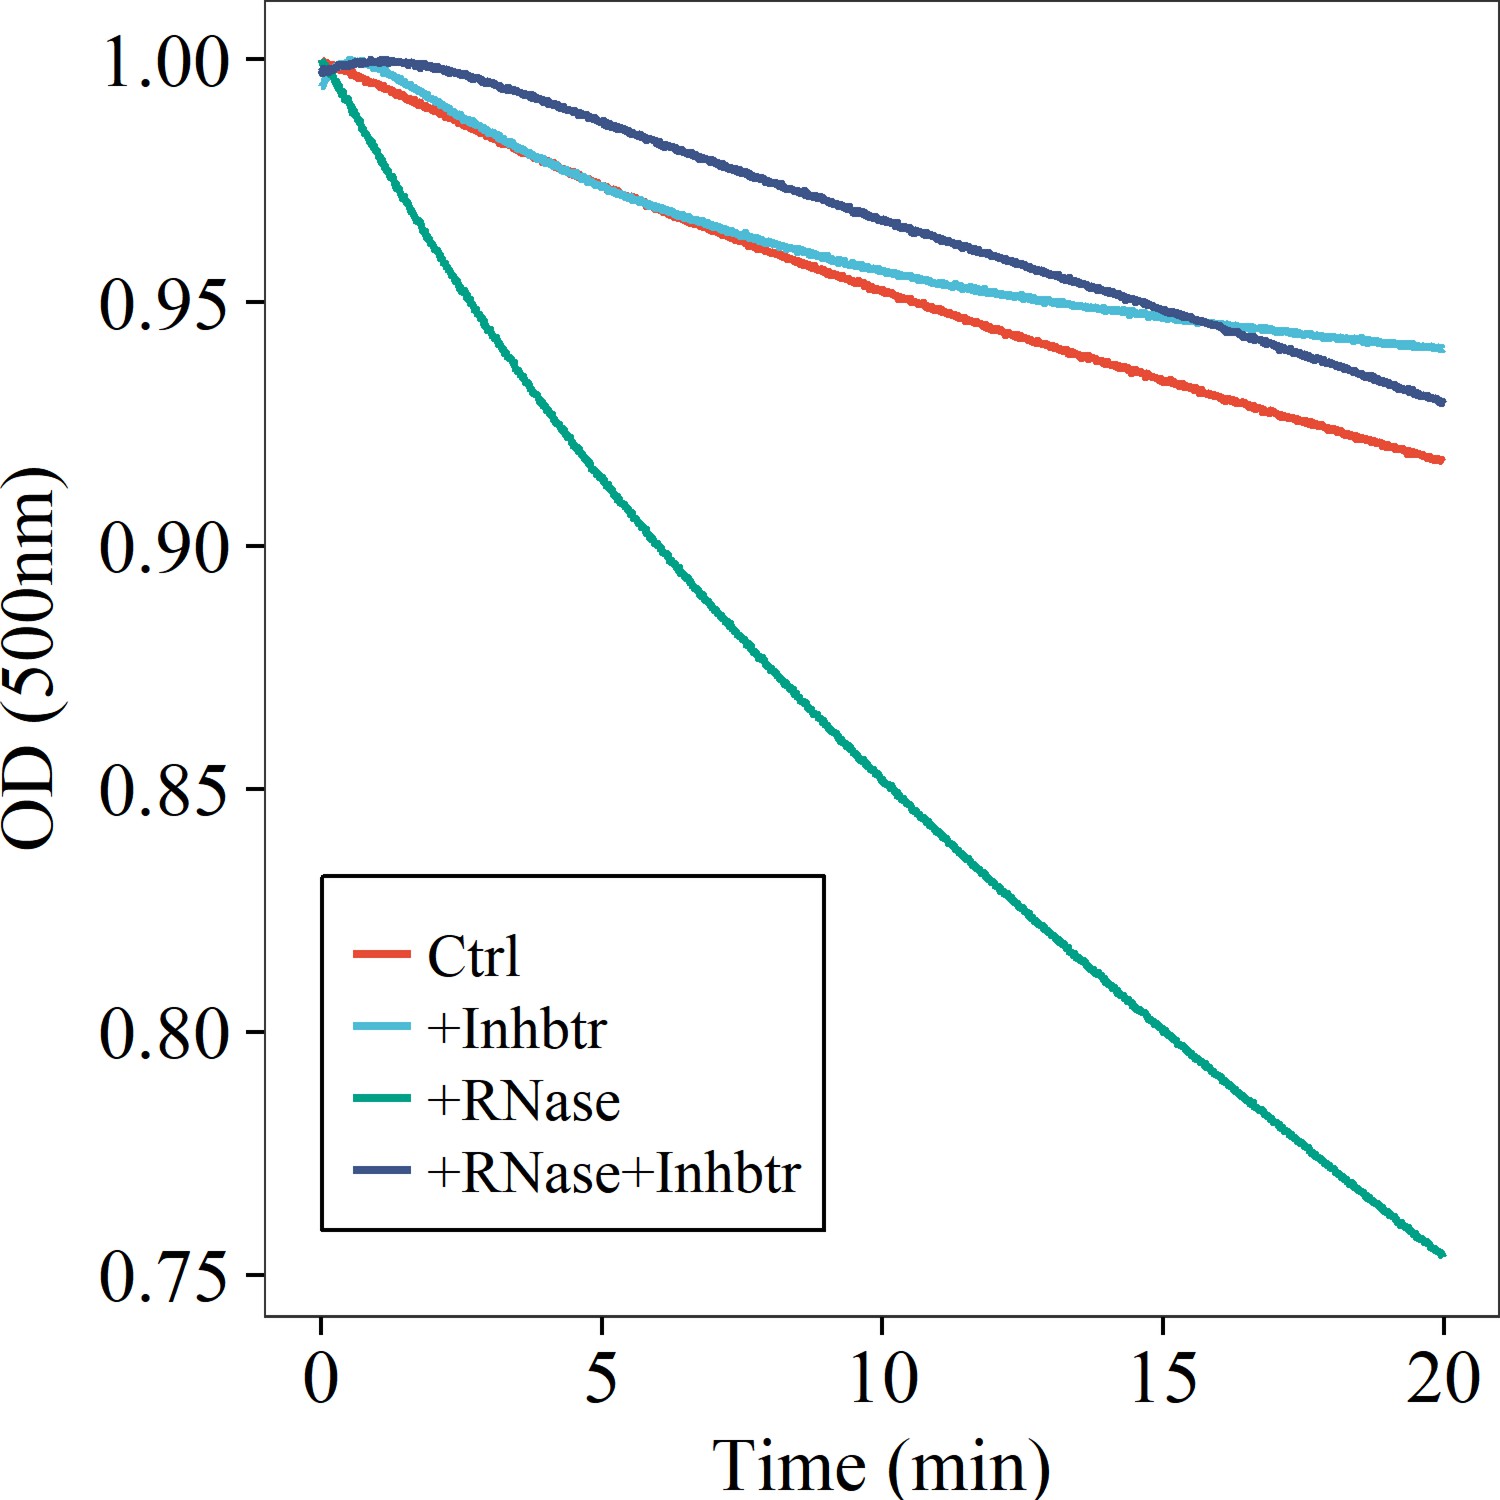
RNase induces turbidity decrease of tau187-RNA CC suspension.
Tau187-RNA CCs were re-prepared with 100 μM tau187C291S and 300 μg/mL polyU RNA, while absorbance at 500 nm was monitored. Samples were treated with buffer (Ctrl), 1 U/μL RNase inhibitor (mainly inhibiting RNase A), 50 ng/mL RNase A, and 50 ng/mL RNase A with 1 U/μL RNase inhibitor.
Figure 1—figure supplement 3

Turbidity of tau-RNA CC at varying charge ratios and ionic strength.
(A) PolyU RNA was titrated into 20 μM tau187C291S in the buffer of 20 mM ammonium acetate at pH 7. Charge ratio was calculated based on the estimated charge for tau,+11 per tau molecule and the estimated charge for RNA, −1 per nucleotide. Turbidity was assigned from absorbance at λ = 500 nm. Red line indicates the place where the estimated RNA:tau charge ratio equals to 1. (B) 20 μM tau was mixed with 60 μg/mL RNA so that RNA:tau charge ratio equals to 1. NaCl was titrated into the mixture while turbidity was monitored.
Figure 1—figure supplement 4
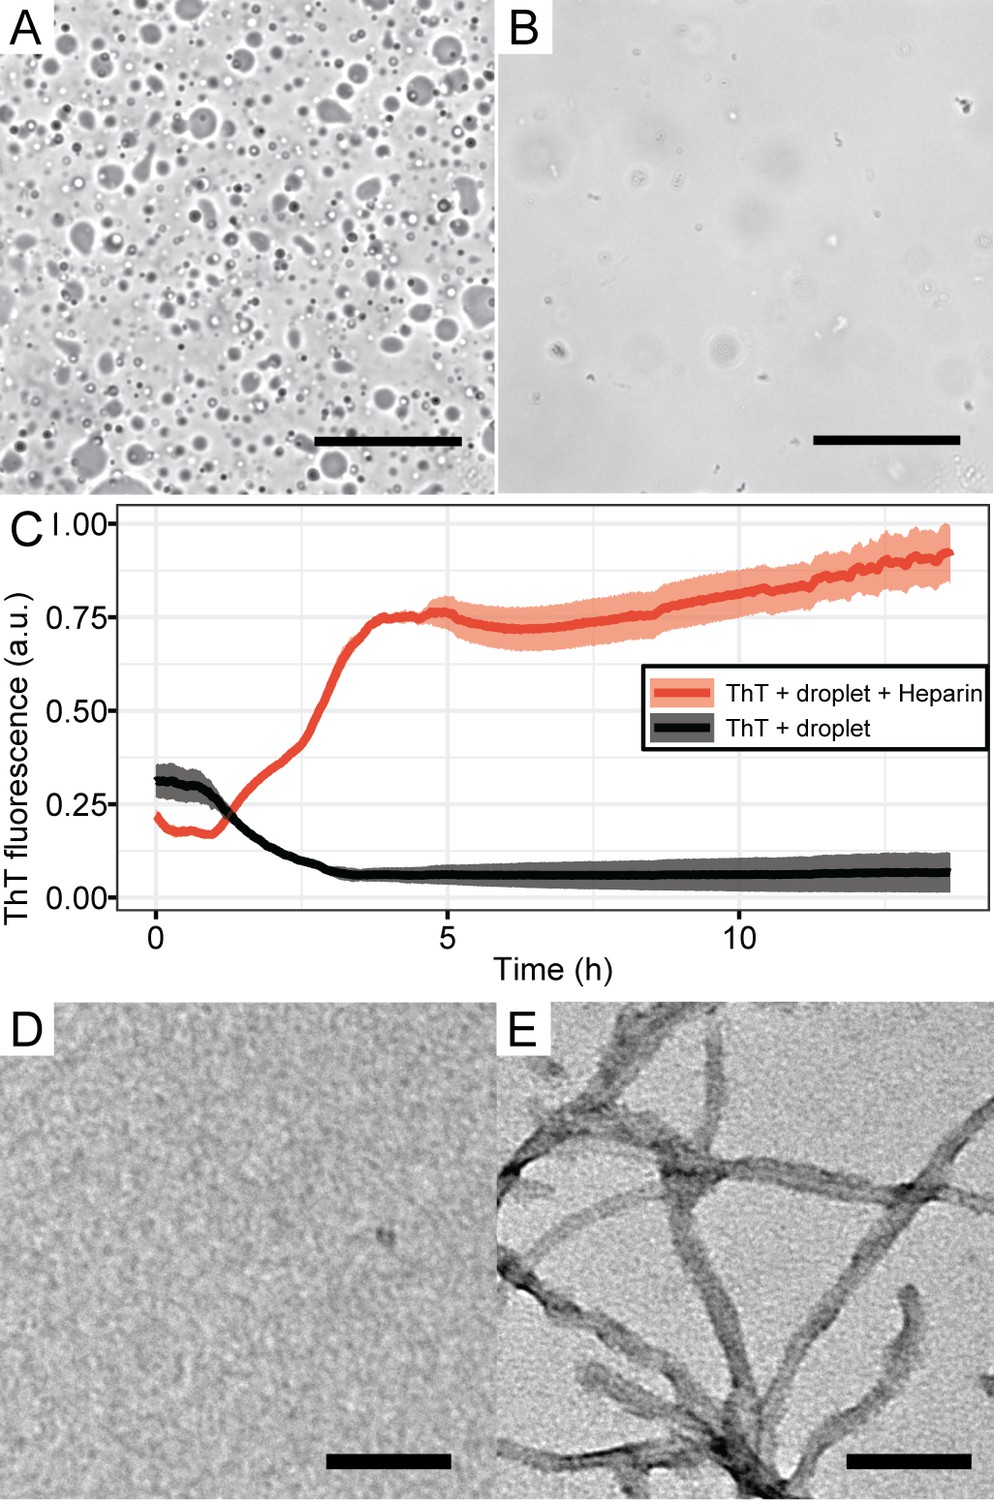
Tau-RNA CC upon addition of heparin.
(A) 100 μM tau187C291S-SL and 300 μg/mL polyA RNA was mixed in the buffer of 20 mM ammonium acetate at pH 7, with 19 vol % glycerol. Images were taken after 10 min at room temperature. (B) Sample in A was re-prepared and incubated for 10 min. 25 μM heparin was added afterwards, immediately followed by imaging. The scale bars in both A and B are 50 μm long. (C) ThT fluorescences of samples in A and B were monitored with additional 10 μM ThT. (D) TEM images of sample in A after overnight incubation, showing no structures similar to amyloid fibrils. (E) TEM images of sample in B after overnight incubation, showing structures with length and width consistent with tau fibrils. The scale bars in both D and E are 200 nm long.
Figure 2 with 3 supplements

FH-VO modeling of tau-RNA complex coacervation.
(A). Turbidity of tau187-RNA CC upon heating (Expt.1 ([tau], [NaCl]) = (50 μM, 120 mM), green dots; Expt.2 ([tau], [NaCl]) = (40 μM, 30 mM), purple dots). Absorbance at λ = 500 nm were normalized and used as turbidity value. Turbidity-temperature data of the heating curves were fitted with a sigmoidal function (solid line) as described in (Materials and methods), and the temperature at which normalized turbidity reaches 0.5 was assigned to cloud point, Tcp. (B)-(C). Experimental phase diagram (points) showing [tau] vs. Tcp and [NaCl] vs. Tcp along with the binodal curve generated from fitting the data to the FH-VO model with χ = χ(Tcp) (solid line). (D). Diagram of Flory Huggins lattice. Tau and RNA are represented by consecutively occupied lattice sites. (E). Each experimental condition in (A) was independently fit to the FH-VO model (solid lines) to obtain an empirical χ value. (E) shows two representative curves. These empirically determined values of χ are shown as points in (F). The solid line in (F) is a linear regression, generating χ = χ(Tcp), which is then used to generate the binodal lines in (B) and (C).
-
Figure 2—source data 1
Degree of polymerization and average charge densities of species used in the FH-VO calculation.
N, degree of polymerization; net charge, estimated net charge per molecule; σ, average charge per monomer.
- https://doi.org/10.7554/eLife.42571.013
-
Figure 2—source data 2
Thermodynamics calculated by FH-VO at 300 K and physiological relevant salt concentrations.
T = 300 K was used to determine α, εH/T and εS. At this temperature, 50 mM ~200 mM total salt concentration was used to calculated binodal compositions as described in SI Methods. The calculated composition of tau, RNA and water in the dense phase was listed as ϕtau+ ϕRNA and ϕwater. ΔHD-H, the Debye-Huckel approximated phase separation enthalpy; ΔH, the Flory-Huggins phase separation enthalpy and TΔS, the Flory-Huggins phase separation entropy.
- https://doi.org/10.7554/eLife.42571.014
Figure 2—figure supplement 1

Turbidity-temperature data and cloud points determinations of various [tau] and [NaCl].
Tau187-RNA CCs were prepared at various concentration of [tau] and [NaCl] with fixed ratio of [RNA]:[tau], shown as strip text (e.g. ‘2 6 30’ refers to [tau]=2 μM, [RNA]=6 μg/mL, [NaCl]=30 mM). Samples were kept at 4°C before ramping up temperature at 1°C/min. Absorbance at 500 nm was monitored and used as turbidity (grey points). Turbidity-temperature data were fit to a sigmoid curve (black solid line), where the cloud point, Tcp, were determined (blue vertical line). [tau], [NaCl] and Tcp were used for theory and simulation modeling.
Figure 2—figure supplement 2
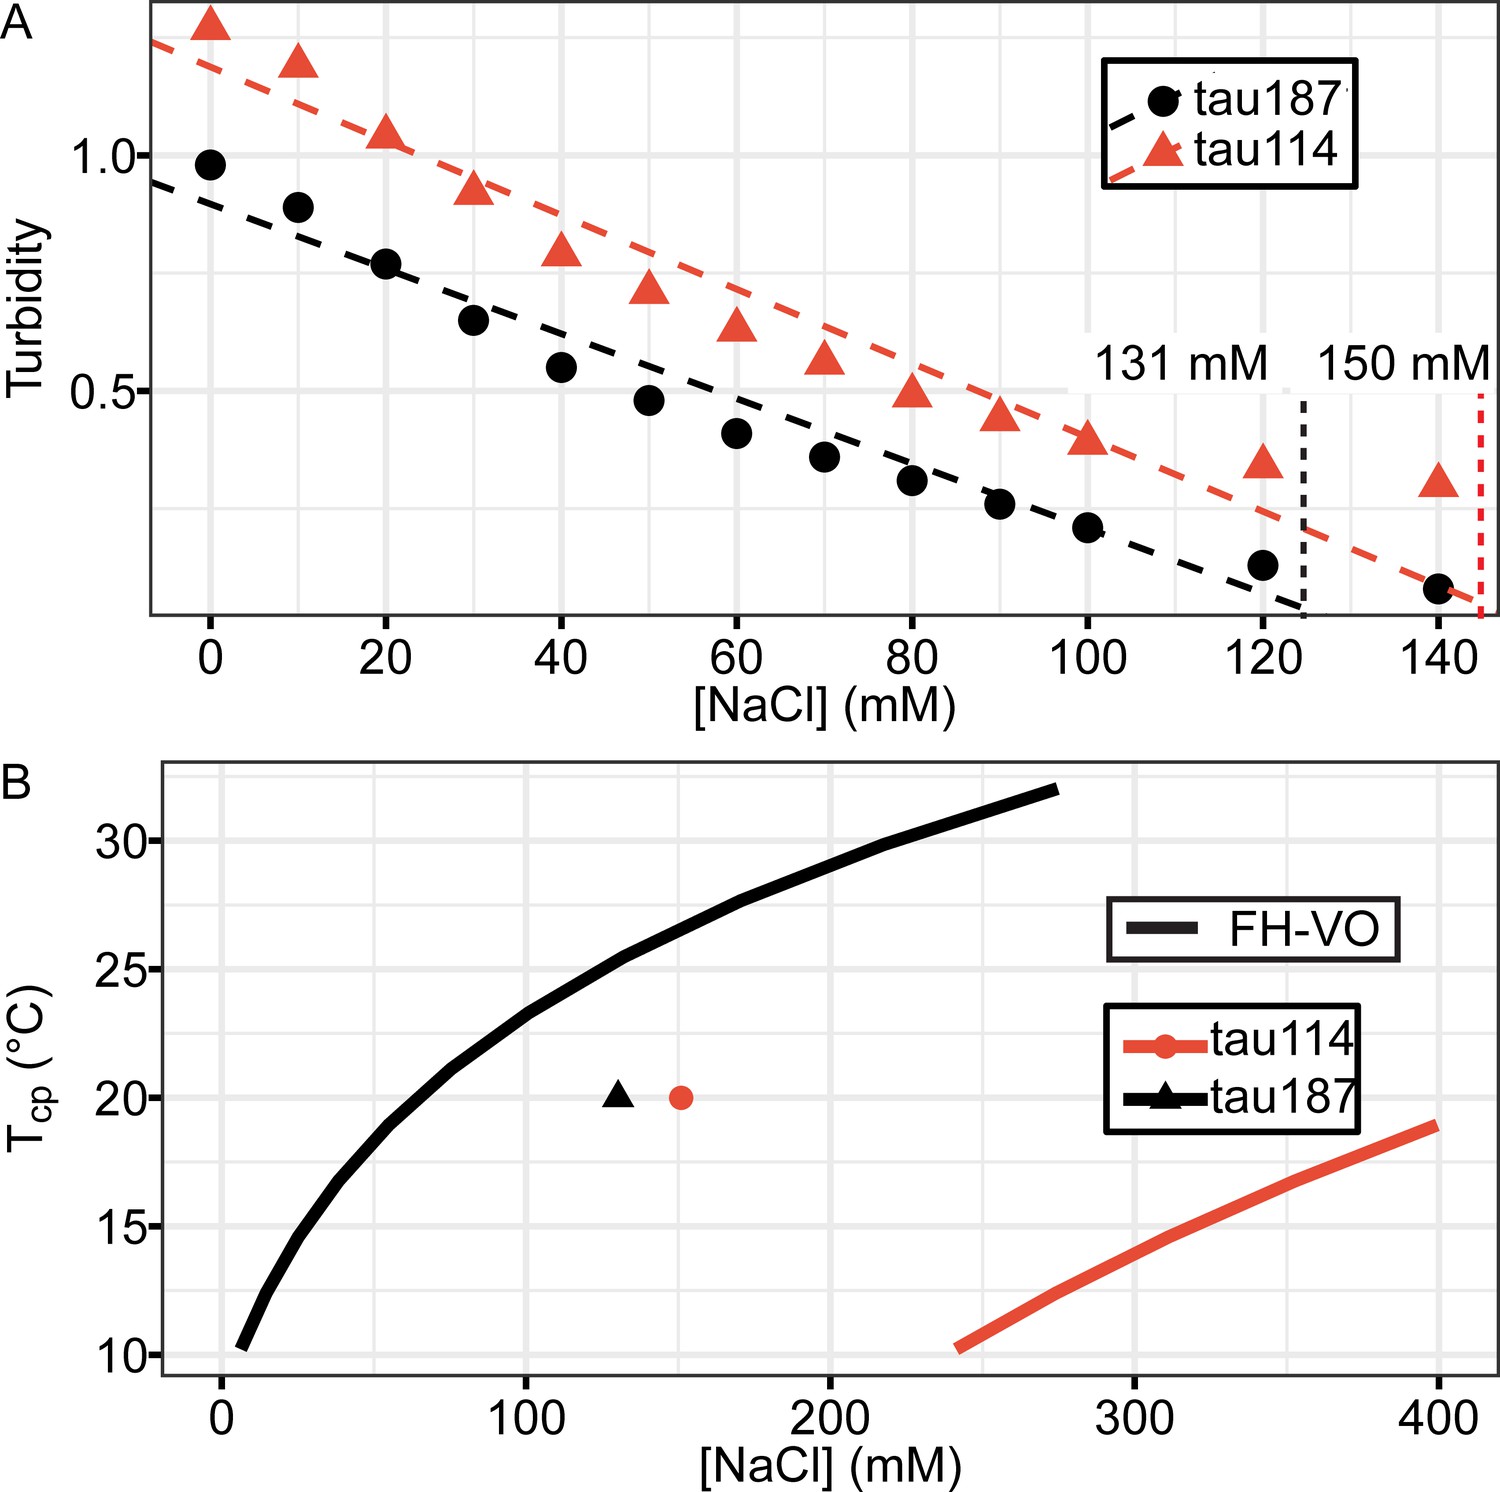
Phase diagrams of tau114 vs tau187.
Tau-RNA CC were prepared with 20 μM tau187 with 60 μg/mL RNA (tau187) or 28 μM tau114 with 84 μg/mL RNA (tau114). (A) Turbidity was recorded with varying NaCl concentration. [NaCl] where turbidity vanished were determined by linear fitting to be 131 mM for tau187 and 150 mM for tau114. (B) [NaCl] vs. Tcp vs. [NaCl] curves for 20 μM tau187 or 28 μM tau114 were computed by FH-VO with χ = χ(Tcp) obtained from Figure 2D, shown together with the experimental data points obtained from (A).
Figure 2—figure supplement 3
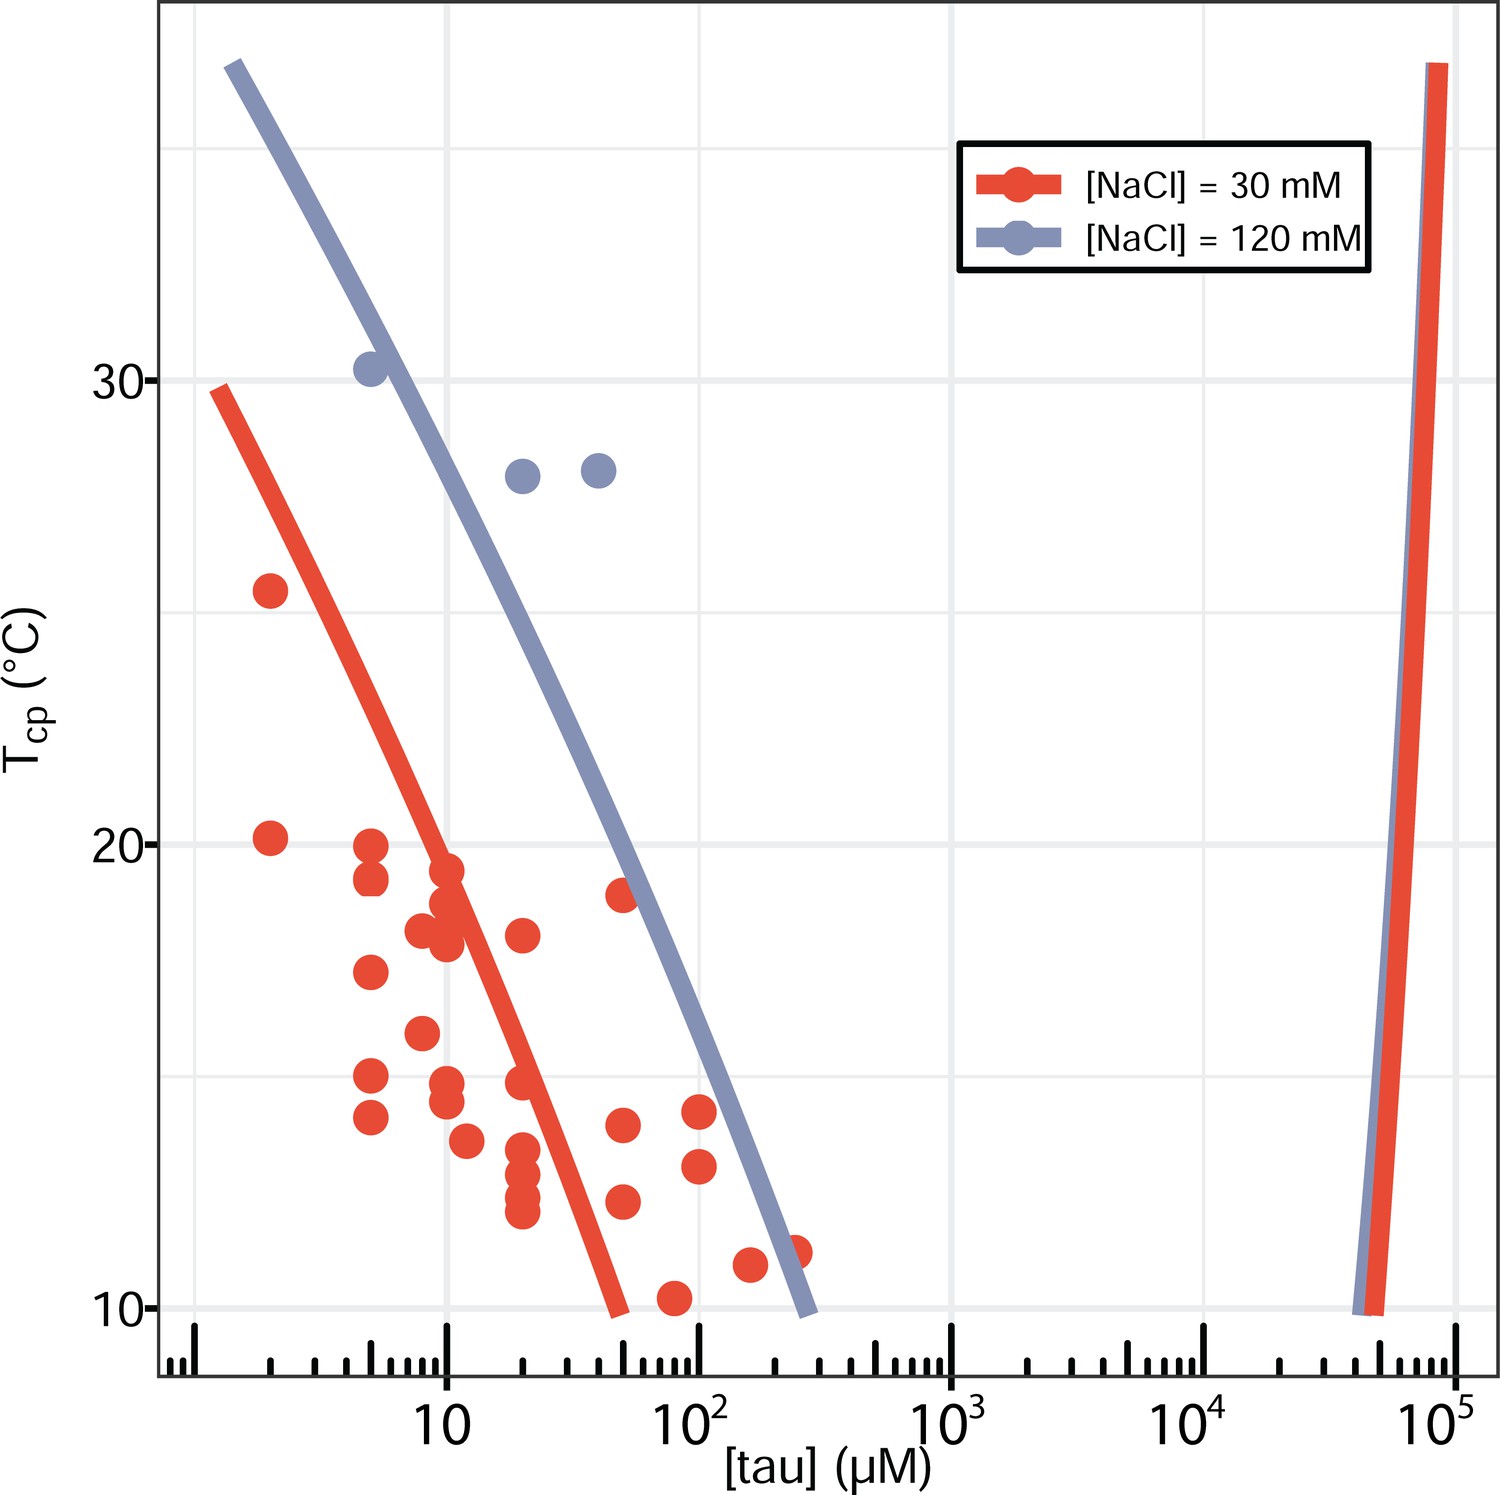
Full phase diagram of tau187-RNA CC.
Experimental data showing [tau] vs Tcp was replot from Figure 2B (points). Binodal curves was generated by fitting the data to the FH-VO model (solid lines).
Figure 3
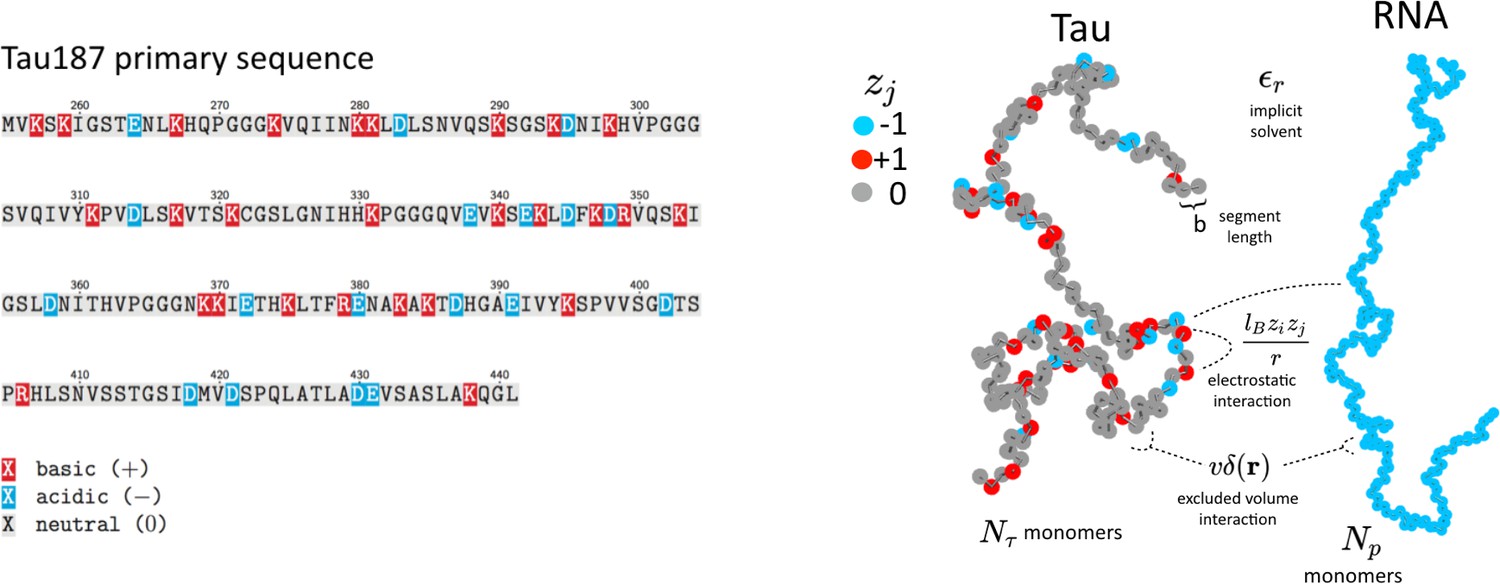
Schematic depiction of the tau and RNA polyelectrolyte models.
Tau and RNA molecules are represented as bead-spring polymers with segment length b in implicit solvent. Tau is modeled as a polyampholyte with the charge of each monomer determined from the amino acid charge at pH = 7. RNA is modeled as a fully charged polyelectrolyte. In addition to chain connectivity, all monomers interact with an excluded volume repulsive potential, and charged monomers interact with a long-ranged Coulomb potential.
Figure 4

Polymer density field of single phase solution and two phase coacervate from FTS.
Left: Polymer density profile showing a single solution phase for the condition of relatively weak electrostatic strength lB = 0.16 b and relatively high excluded volume (good solvent conditions) v = 0.02 b3. The solution phase is characterized by near homogeneous low polymer density (white/light blue) throughout the entire simulation box. Right: Polymer density profile showing complex coacervation upon increasing the electrostatic strength to lB = 3.25 b and decreasing the solvent quality by lowering the excluded volume to v = 0.0068 b3. The two phase region is characterized by a distinct region of high polymer density (dark red) and a surrounding region of low polymer density (white) within the same simulation box. The total polymer concentration is the same in both simulations.
Figure 5 with 1 supplement
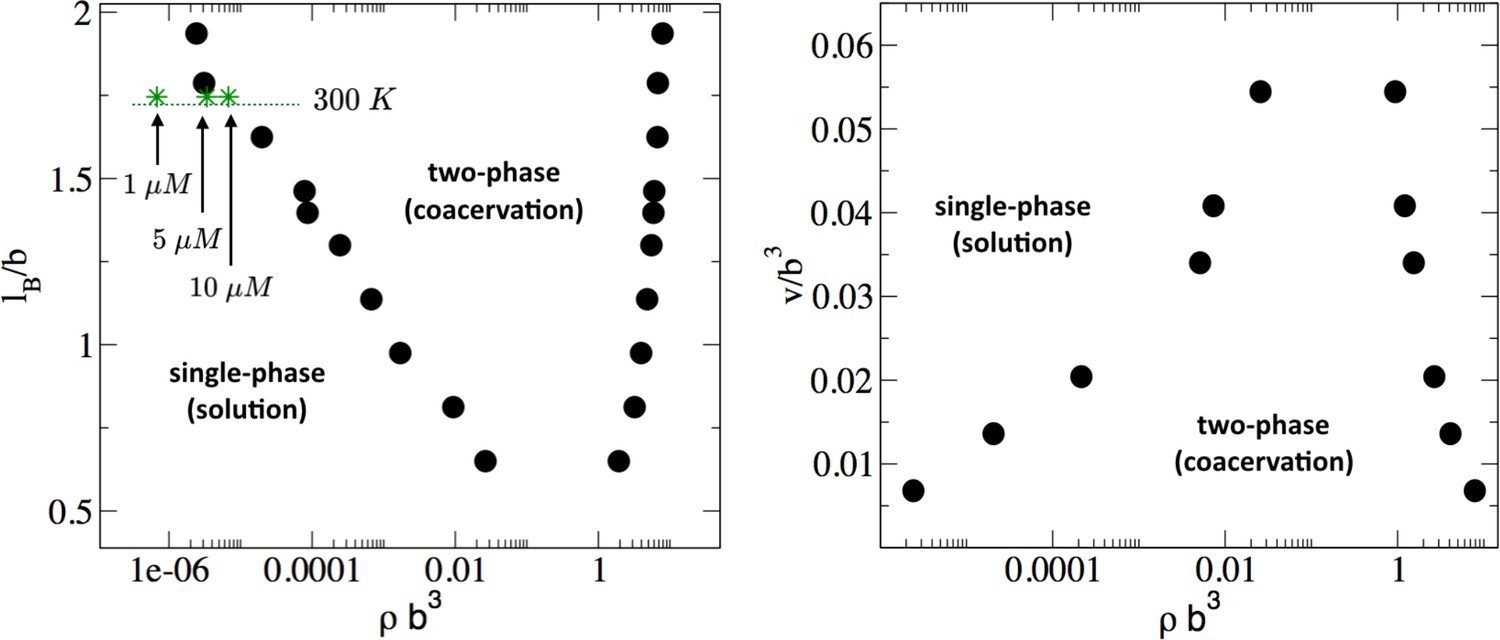
Phase diagram of the tau-RNA model obtained from FTS.
Left: Binodal points as a function of the Bjerrum length at fixed excluded volume of v = 0.0068 b3. For comparison three concentrations at 300 K are indicated (arrows) assuming ϵr = 80 and b = 4 Å. Right: Binodal points as a function of the excluded volume at fixed Bjerrum length lB = 1.79 b.
Figure 5—figure supplement 1
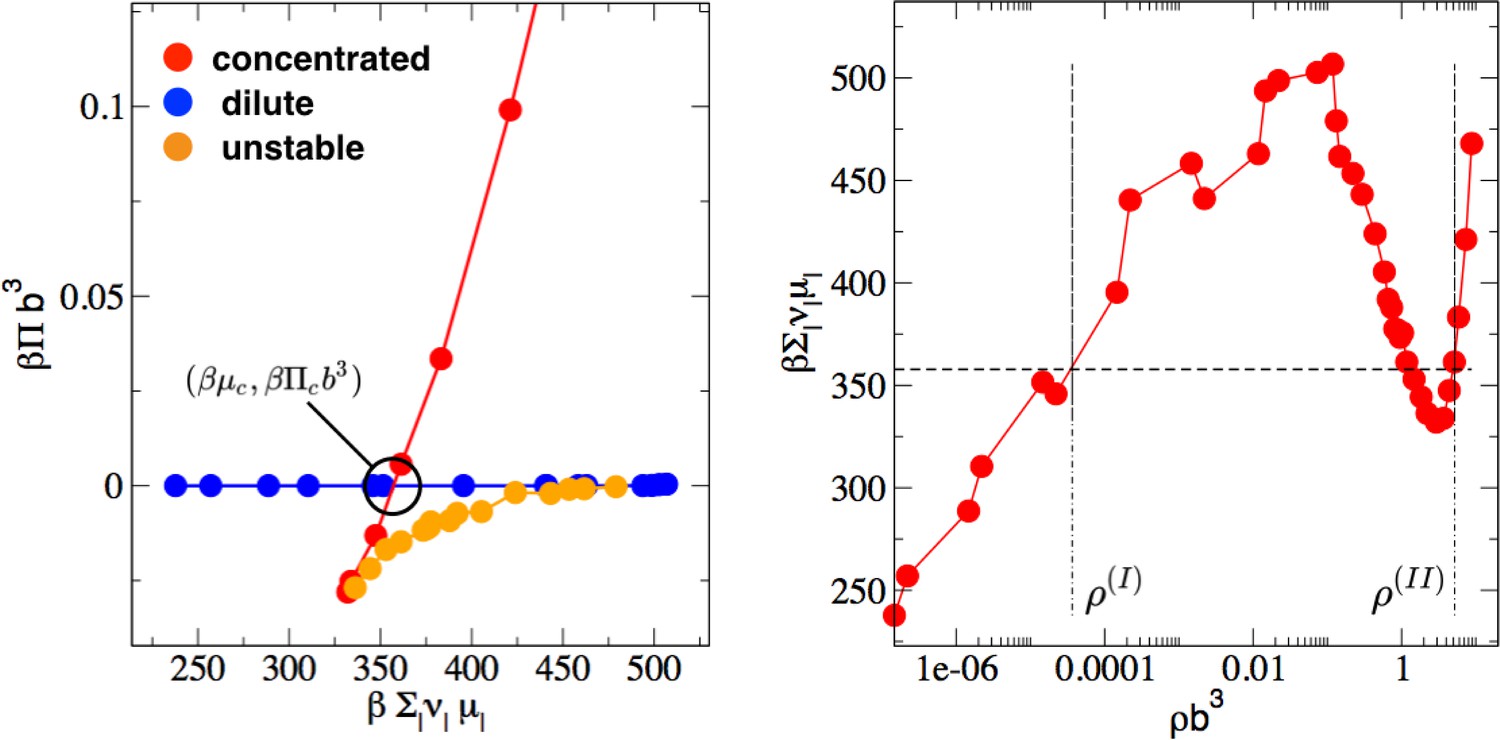
Determination of phase coexistence points from FTS.
(Left). Parametric plot of FTS simulation data points of the osmotic pressure vs the chemical potential. The dilute phase is shown in blue and the concentrated phase (complex coacervate) is shown in red. The intersection point of the two branches is the condition for simultaneous equivalence of pressure and chemical potential for the two phases. (Right) The chemical potential vs. the total polymer density from FTS simulation (red points). The horizontal dashed line is the chemical potential at the phase coexistence point. Intersection of the data points with the horizontal dashed lines determines the supernatant (I) and complex-coacervate (II) coexisting polymer densities.
Figure 6 with 4 supplements
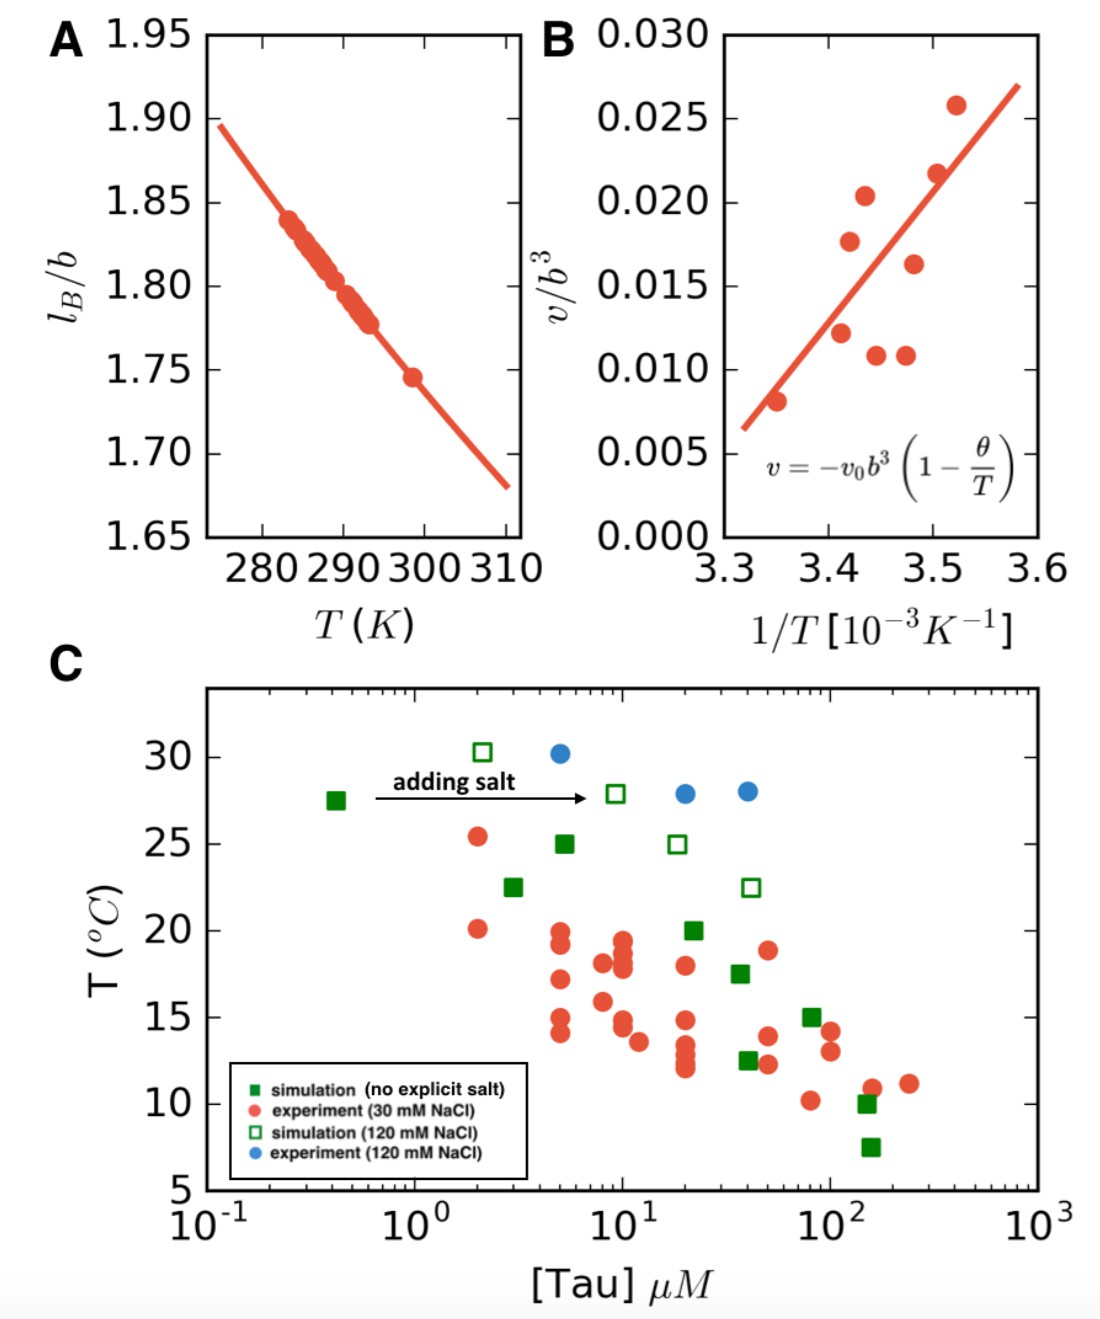
LCST phase behavior recapitulated from FTS.
(A) Temperature dependence of the reduced Bjerrum length (εr = 80 for water) shown in red. (B) Temperature dependence of the excluded volume obtained by adjusting the excluded volume parameter until FTS agrees with a subset of the experimental data (points). The solid line shows a linear fit to the data which is used to obtain the temperature dependent excluded volume for subsequent simulations. (C) FTS coexistence points (filled green squares) obtained by using a temperature dependent Bjerrum length (A) and excluded volume (B). Experiments performed at 20 mM NaCl are shown in red for comparison. Upon introducing excess salt ions in FTS with a fixed concentration of [NaCl] = 120 mM, the binodal shifts upwards (open green squares). For comparison experiments performed at 120 mM NaCl are shown in blue.
Figure 6—figure supplement 1
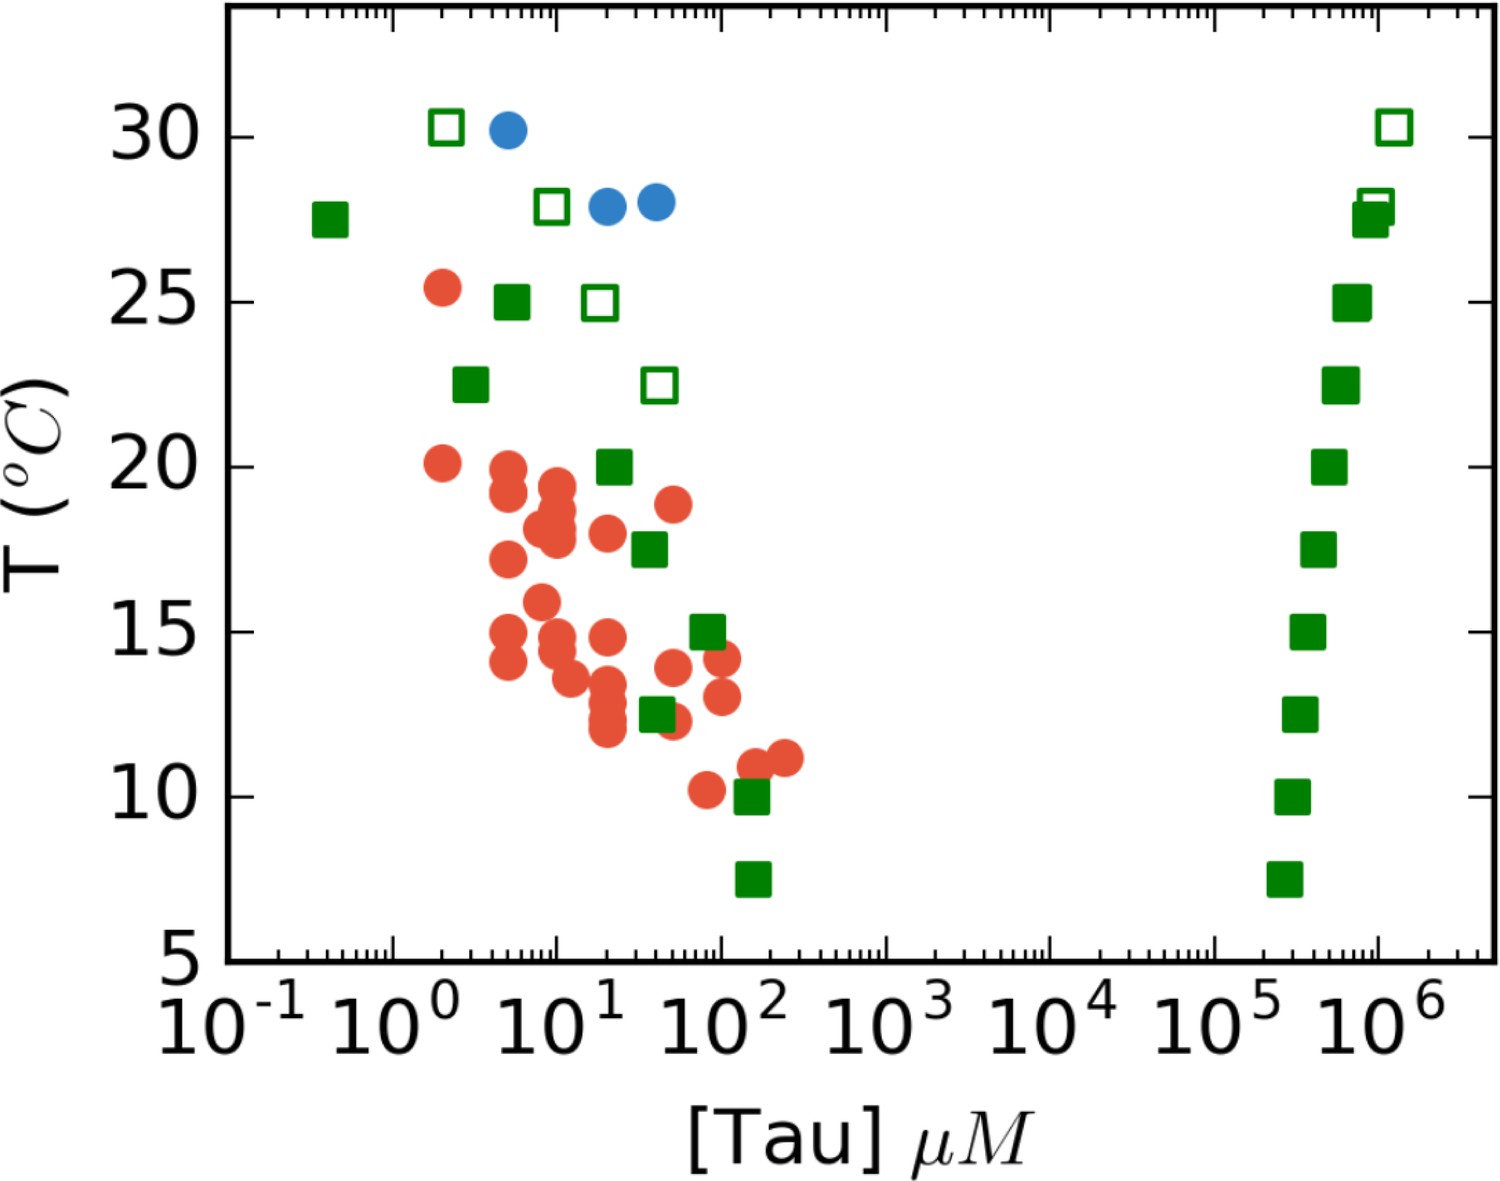
Full phase diagram of tau187-RNA CC from FTS.
Low-density points (left) are reproduced from Figure 6C in the main text. Filled green (low salt) and open green (120 mM NaCl) are obtain from FTS, and red and blue circles are corresponding experimental data. The right side of the figure shows the corresponding high-density binodal curve predicted from FTS.
Figure 6—figure supplement 2
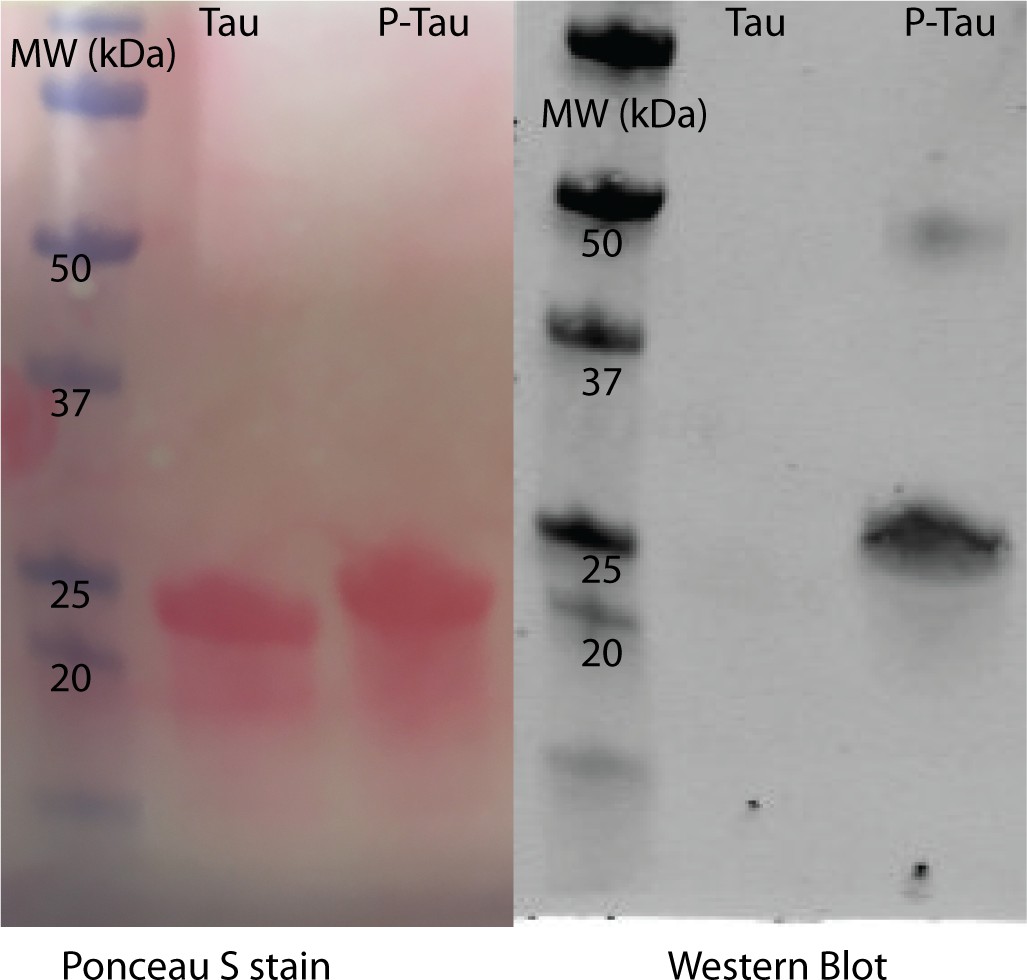
Tau in vitro phosphorylation.
Tau (tau187C291S) were prepared as described in Materials and methods. Tau was subjected to in vitro phosphorylation using mouse brain extract as previously described (Despres et al., 2017). Phosphorylation was confirmed using SDS-PAGE and western blot analysis. Ponceau S staining of the blot shows equal loading of samples before (Tau) and after (P-Tau) the phosphorylation reaction, while reactivity with PHF-1 antibody indicates phosphorylation at S396/404.
Figure 6—figure supplement 3
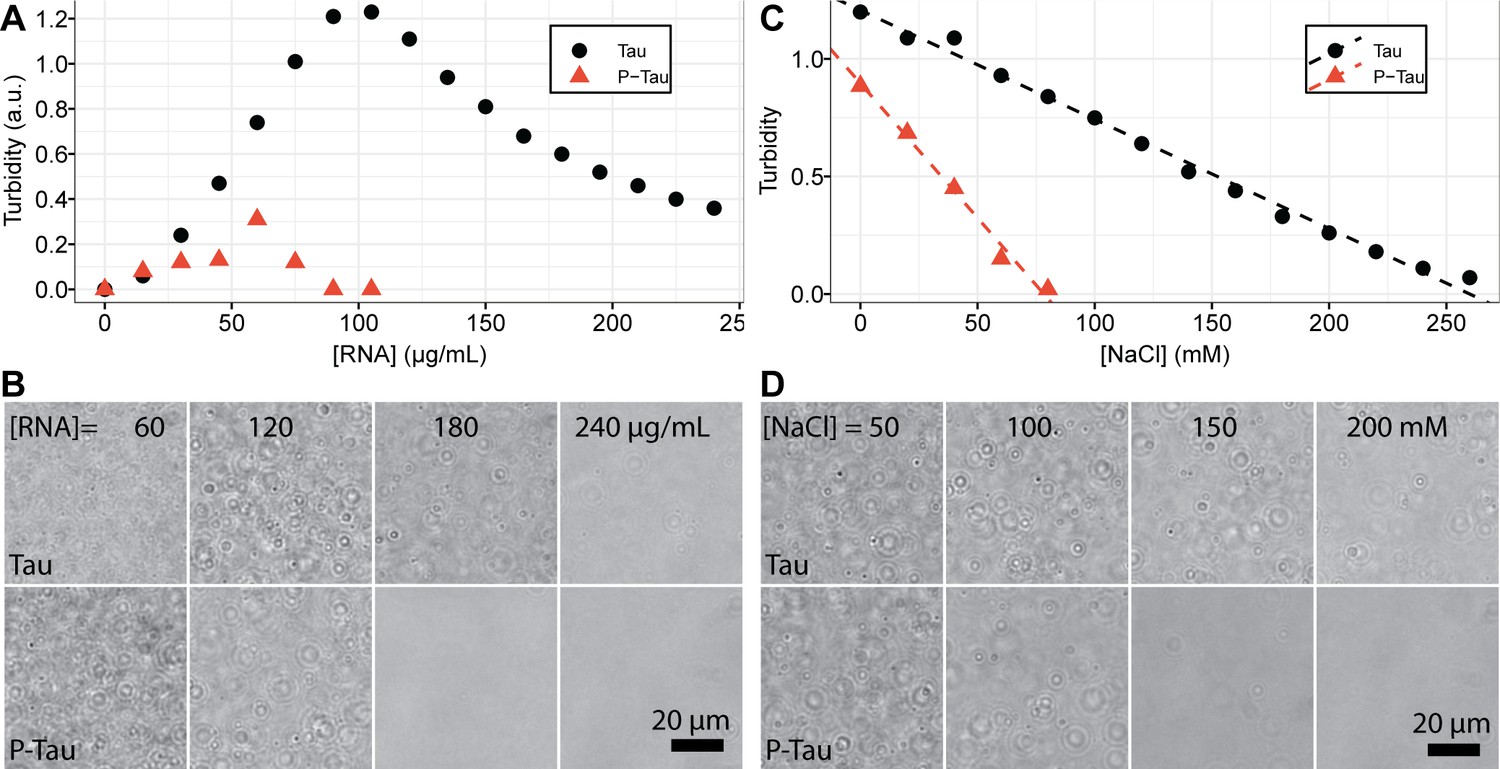
Phosphorylation on tau-RNA complex coacervation.
(A) 20 μM Tau and P-Tau was titrated with PolyU RNA. Absorbance at 500 nm was monitored and plotted as turbidity. (B) Corresponding representative bright field microscope images of samples in (A). (C) 20 μM Tau and P-Tau was mixed with 50 μg/mL and 100 μg/mL PolyU RNA, respectively. Mixtures were titrated with NaCl. Turbidity was plot (solid points) and fit using linear regression (dashed lines). (D) Corresponding representative bright-field microscope images of samples in (C). (Experiments were performed in 20 mM HEPES, pH = 7.0 with 1 mM TCEP. P-Tau concentration was determined by BCA assay. Tau concentration was determined by UV-Vis spectroscopy as described in Materials and methods).
Figure 6—figure supplement 4
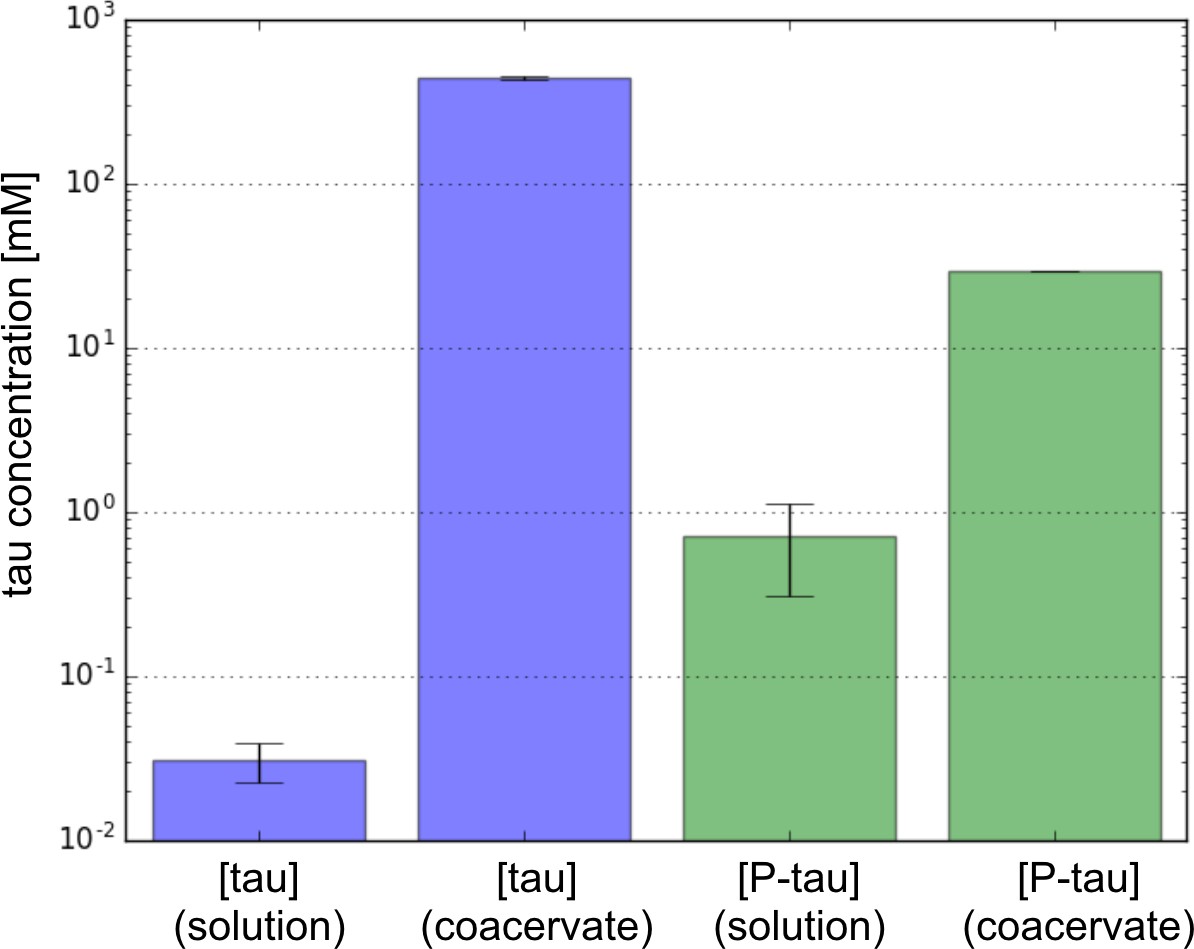
Concentration of protein in the solution phase and coacervate phase predicted from FTS simulation performed at 20°C on Tau (blue) and P-tau (green) in excess salt.
Phosphorylation is seen to decrease the concentration difference between the two phases indicating a narrowing of the two phase window.
Figure 7
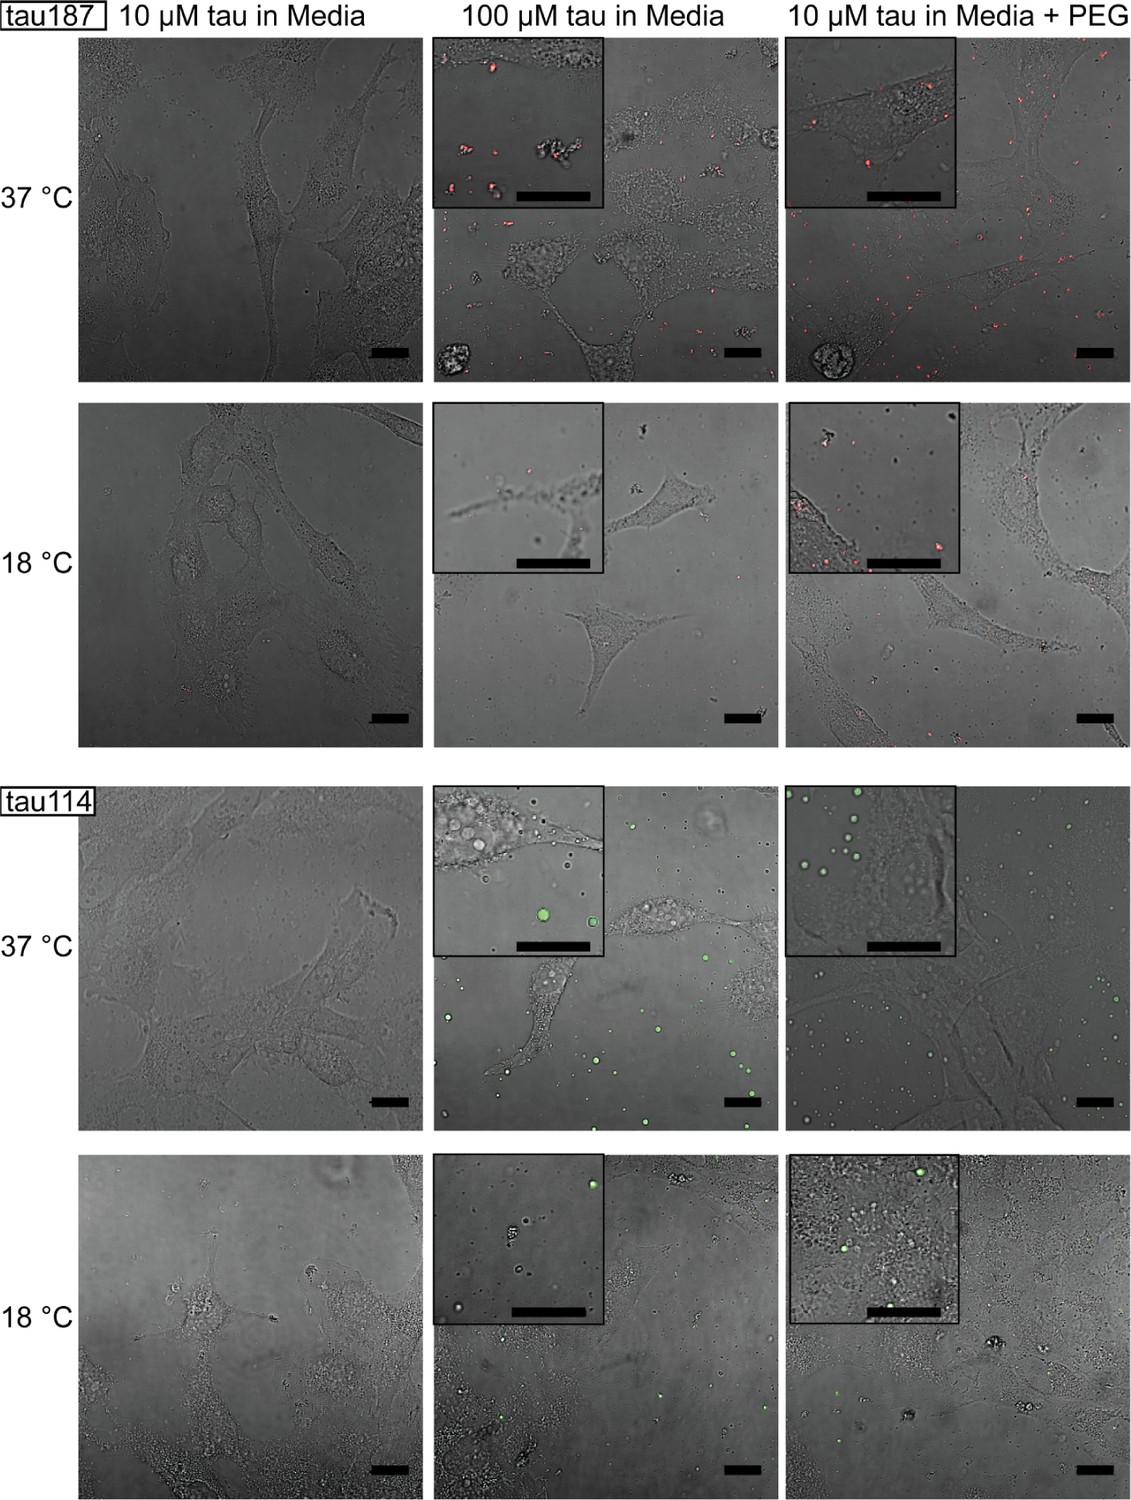
Tuning experimental conditions to catch tau-RNA complex coacervates in the presence of living cells.
Bright field images and superimposing fluorescence images of tau-RNA CC coculturing with H4 cells, with 10 μM tau (left), 100 μM tau (middle) and 10 μM tau with 10% v.v. PEG (right). Samples at 37 °C (first row) and 18 °C (second row) were images with representative images showing the co-presence of living cells and tau-RNA CCs. Tau187 (Top) and tau114 (Bottom) were used showing tau114 with higher propensity at CC formation. Alexa Fluor 488 was used to prepare fluorescent labeled tau. 3 μg/mL polyU RNA per 1 μM tau was used to prepared samples. Scale bar is 20 μm long.
Author response image 1
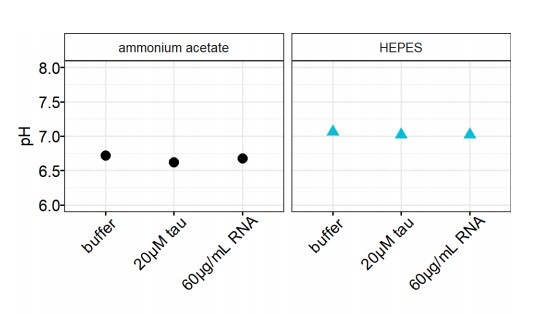
pH changes of buffer.
The pH values of 20 mM ammonium acetate and 20 mM HEPES were recorded upon addition of 20 μM tau or 60 μg/mL RNA.
Tables
Key resources table
| Reagent type (species) or resource | Designation | Source or reference | Identifiers |
|---|---|---|---|
| Peptide, recombinant protein | tau187 | Peterson et al., 2008 | |
| Chemical compound, drug | PolyU RNA | Sigma | CAS: 27416-86-0; Cat#: P9528 |
| Chemical compound, drug | MTSL | Toronto Research Chemicals | CAS: 81213-52-7; Cat#: O875000 |
| Cell line (E. coli) | E. coli BL21 (DE3) | Sigma | Cat#: CMC0014 |
Additional files
-
Transparent reporting form
- https://doi.org/10.7554/eLife.42571.025
Download links
A two-part list of links to download the article, or parts of the article, in various formats.
Downloads (link to download the article as PDF)
Open citations (links to open the citations from this article in various online reference manager services)
Cite this article (links to download the citations from this article in formats compatible with various reference manager tools)
Narrow equilibrium window for complex coacervation of tau and RNA under cellular conditions
eLife 8:e42571.
https://doi.org/10.7554/eLife.42571


