Decision and navigation in mouse parietal cortex
- University College London, United Kingdom
Figures
Figure 1 with 1 supplement
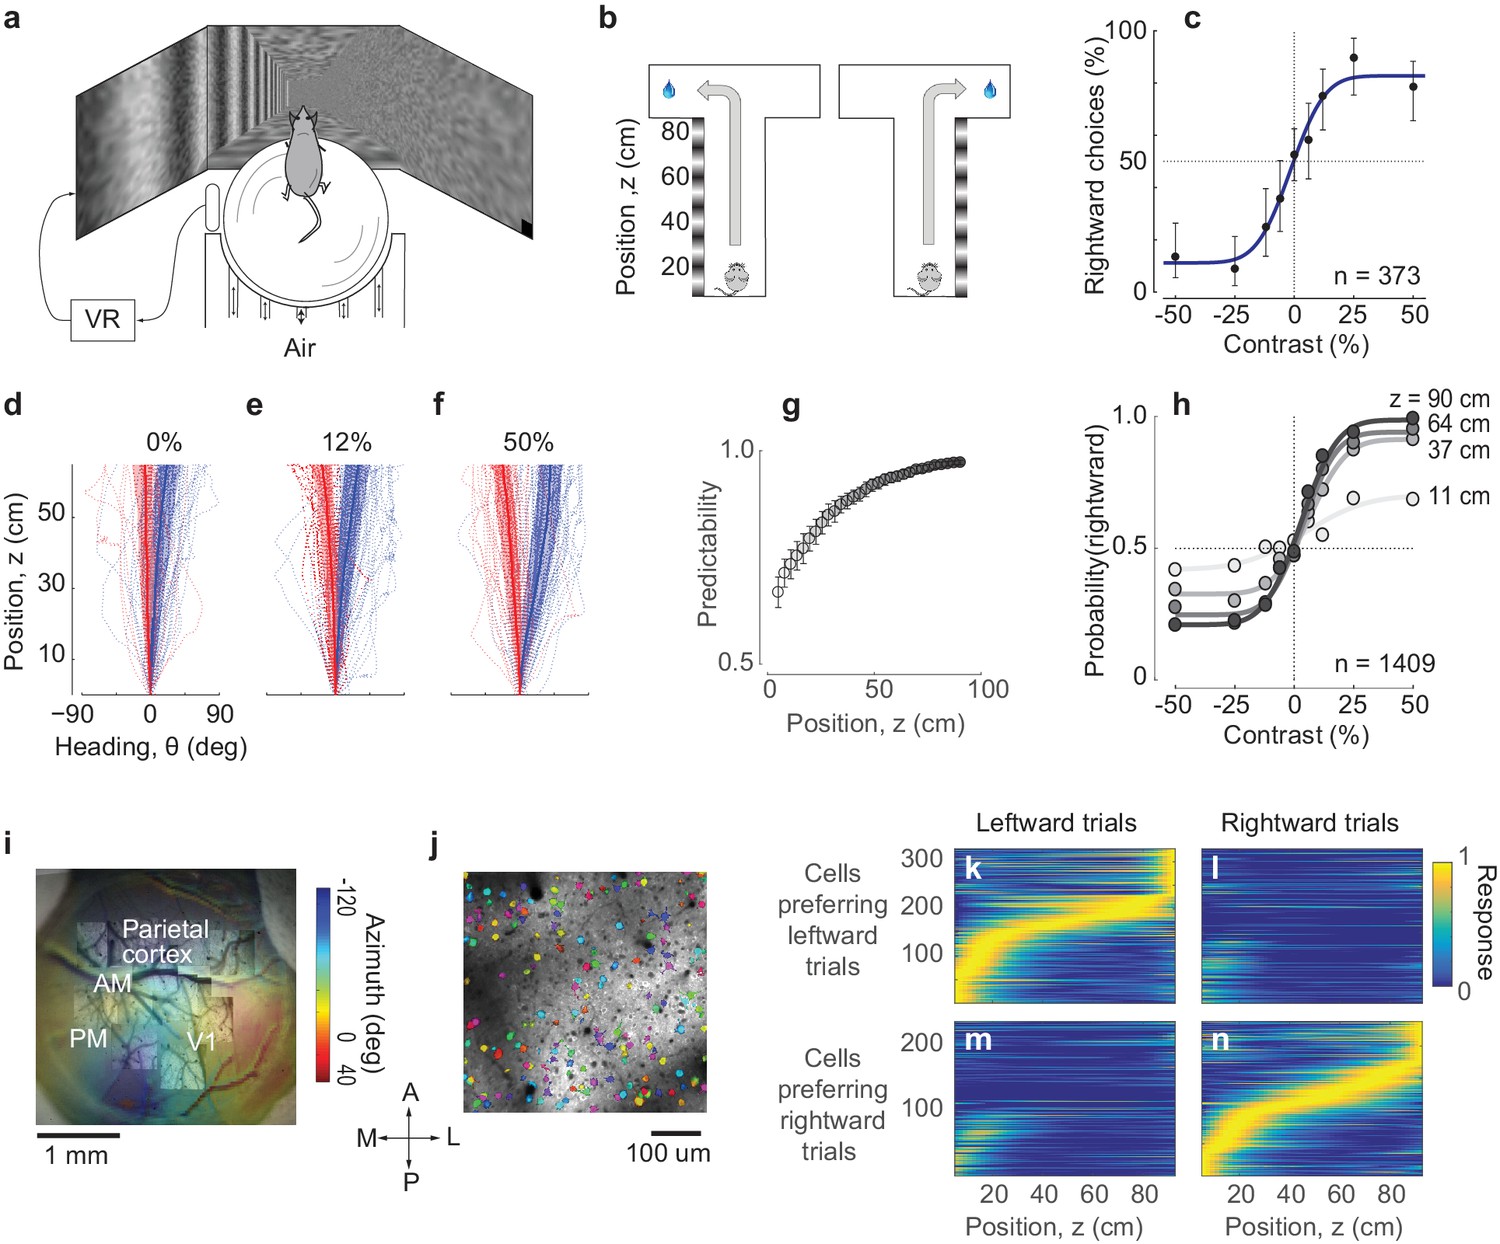
Imaging PPC activity during a navigation task driven by visual decisions.
(a) Schematic view of the experimental setup. The monitors are positioned at 90 deg relative to each other, spanning 270 deg of the horizontal field of view. (b) Schematic of the virtual environment. The mouse receives a water reward for turning in the correct direction at the end of the corridor. (c) Psychometric curve for an example session. Negative contrasts indicate stimuli on the left wall, positive values indicate stimuli on the right wall. Error bars indicate 95% confidence intervals. (d-f) Examples of trajectories in position-heading coordinates within a single session (where heading was allowed to vary between −90 and 90), divided according to the whether the final choice was leftward (red) or rightward (blue). For easier trials (high contrast, (f), the trajectories in the corridor tended to diverge sooner than for harder trials (low or zero contrast, (d–e). Thick lines indicate the median θ for each z, shaded areas indicate 25th-75th percentile range of θ, dotted lines indicate individual trials. (g) The probability of predicting the final choice of the animal (predictability) from its heading increases as the mouse progresses through the corridor. Error bars represent s.e.m. (1409 trials in seven sessions in one mouse). (h) Heading provides increasingly accurate predictions of the psychometric functions as the animal progresses through the corridor (same data as in g), gray levels as in g). (i) Retinotopic map acquired using widefield imaging of a GCaMP6f transgenic mouse. This map was used in combination with stereotaxic coordinates to identify brain areas (Figure 1—figure supplement 1). (j) Mean fluorescence of a single plane obtained in PPC with two-photon imaging. Active cells (shown in color) were identified by a cell detection algorithm, and curated to include only cell bodies. (k–n) Choice-specific sequences of activity. PPC cells appeared to be selective to the trial outcome, some firing in trials ending with a left choice (k) and others in trials ending with a right choice (n). Also, cells were only active in a specific position in the corridor. These figures show all active cells from two example recording sessions (no cells were excluded).
Figure 1—figure supplement 1
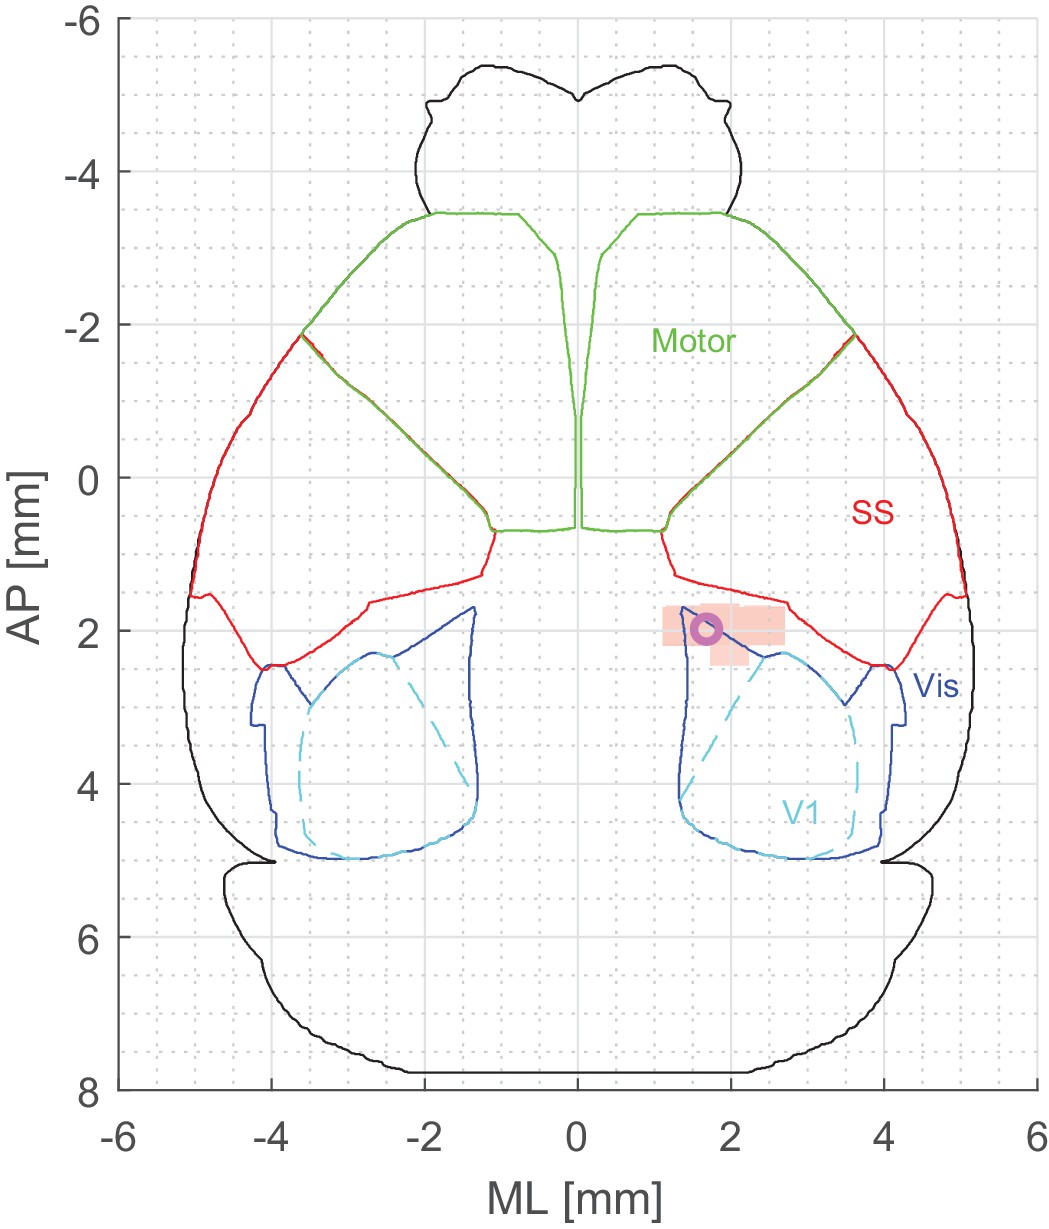
Location of imaged neurons relative to somatosensory and primary visual cortices.
Outlines of visual, primary visual, somatosensory and motor cortices were derived from Allen Institute atlas, and aligned to coordinates relative to bregma – [0, 0]. Magenta circle represents the coordinates of PPC as identified in Harvey et al. (2012) – [−2.0 AP, 1.7 ML]. Peach-colored patch represents the FOVs of the 2-photon imaging sessions.
Figure 2 with 1 supplement
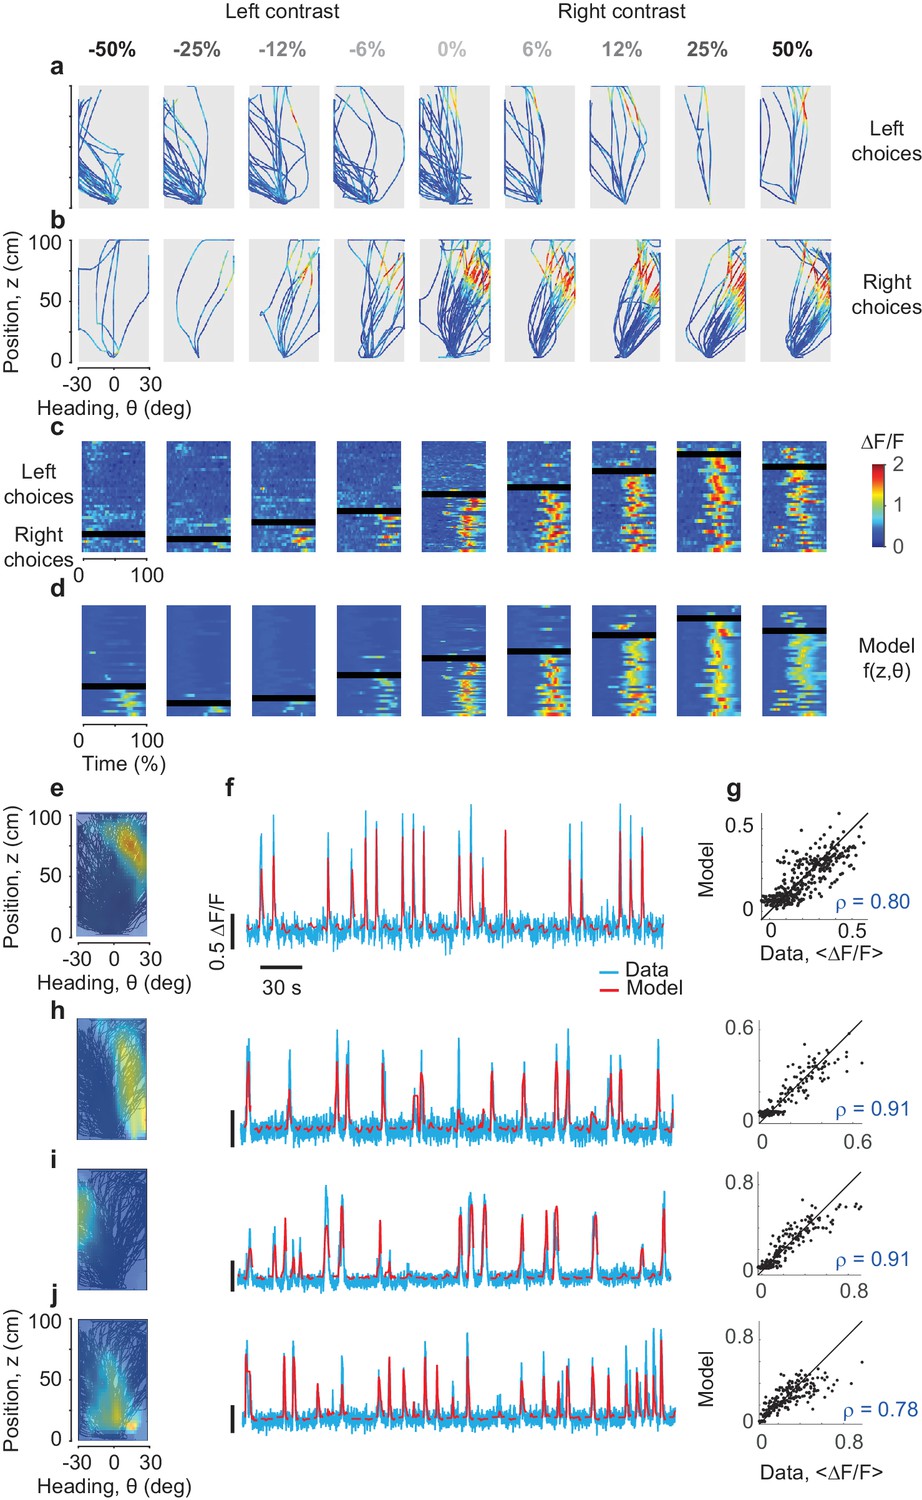
Predicting the responses of PPC neurons based on position and heading.
(a,b) Activity () of an example neuron, plotted in pseudocolor, for trajectories that ended in leftward (a) or rightward (b) choices. Columns correspond to different stimulus contrasts and sides as indicated. Trajectories are plotted as a function of position and heading. The neuron fired (red) in a small region of this space, and was mostly silent (blue) elsewhere. (c) The same data, plotted as a function of normalized time. The rows in each panel correspond to trials, divided depending on whether they ended in rightward vs. leftward choices (above vs. below the black bar). (d) Same format as in c, but predicted by the position-heading model in e. Color scale is the same for panels a–d (color bar in c). (e) Position-heading field of this example neuron. Color represents the normalized of the neuron. (f). Model prediction (red) compared to the actual calcium traces (cyan) in representative trials. For each trial, the position-heading model was estimated without the calcium data from that trial. (g) The model provides a good explanation for the different levels of activity of the cell in different trials, with a correlation between actual data and model prediction of 0.8 (373 trials). (h–j) Examples of three other cells with position-heading fields in different locations from a different session (216 trials).
Figure 2—figure supplement 1
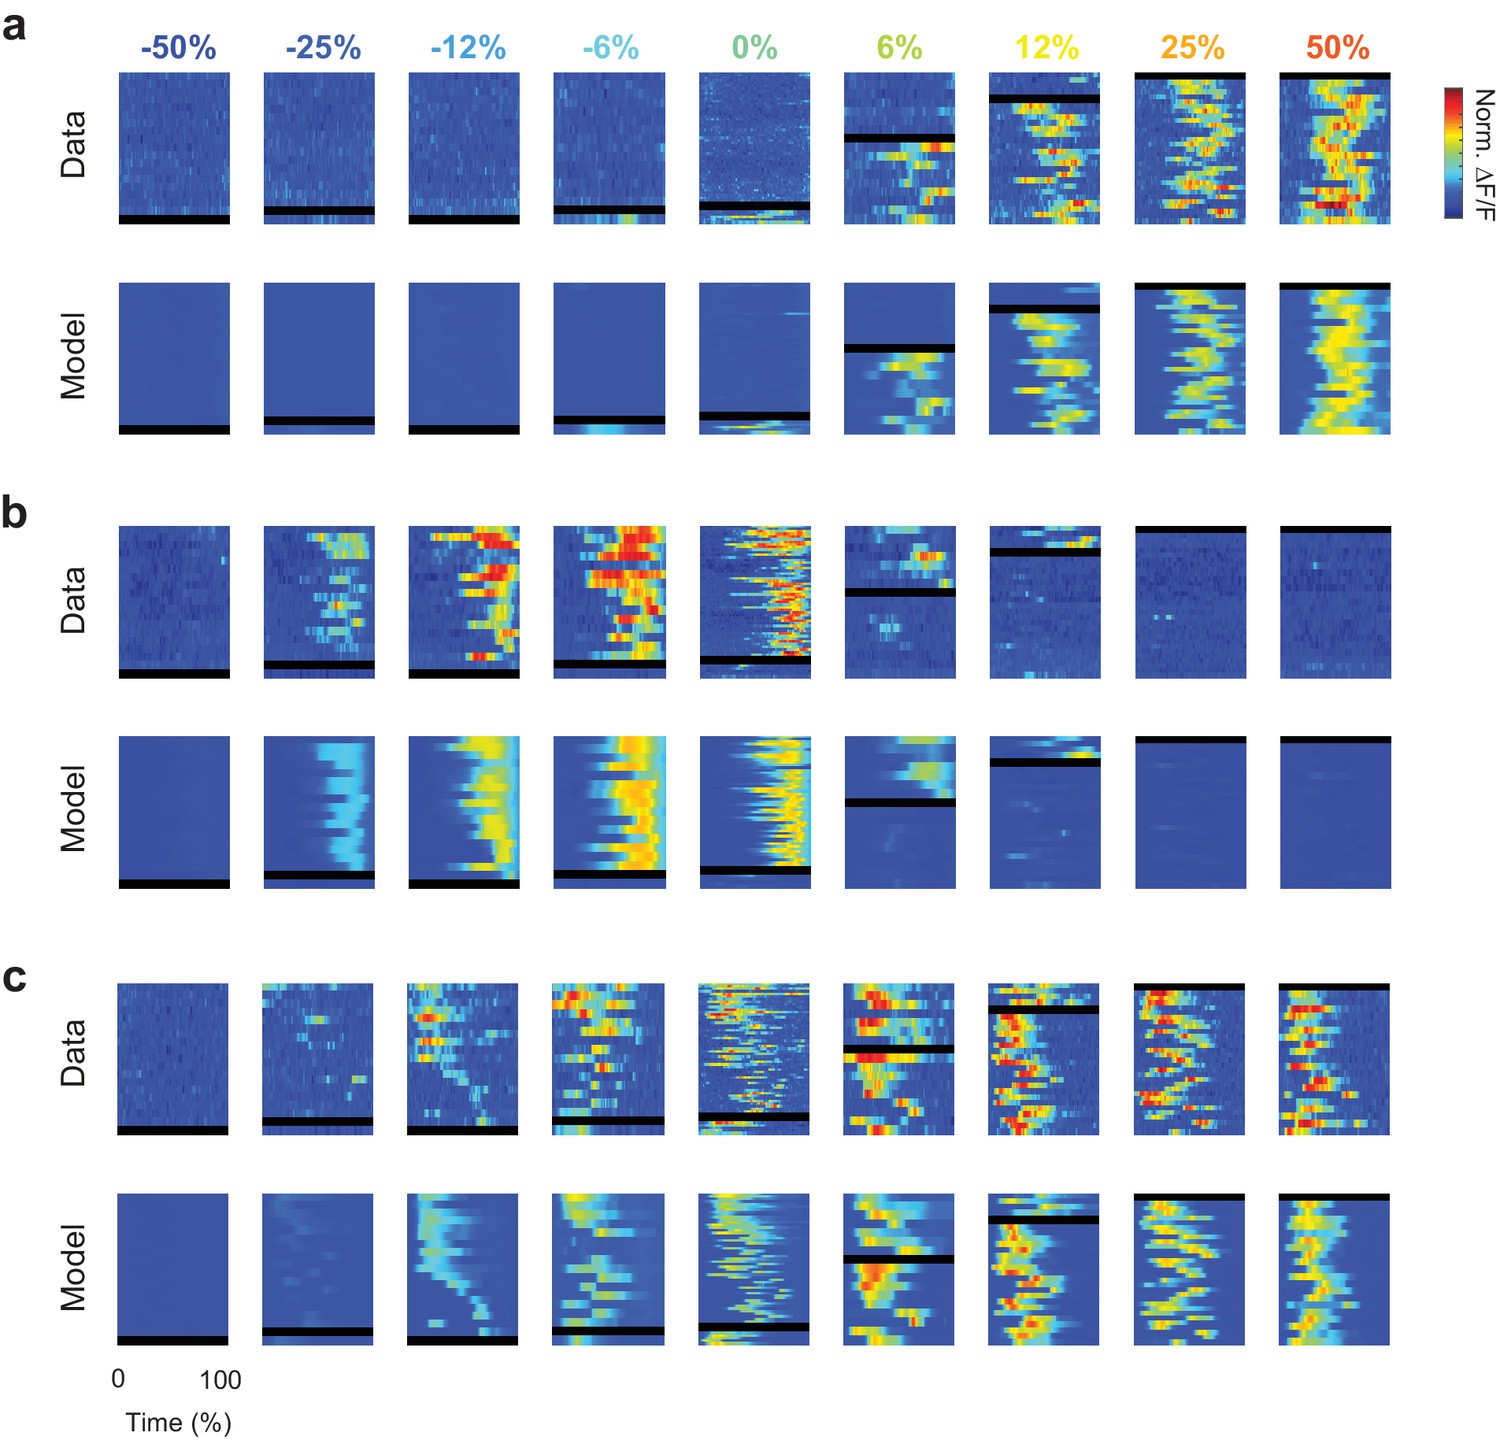
Single-trial responses and model predictions for three example cells.
(a) Responses (top) and model predictions (bottom) for the cell in Figure 2h. Format as in Figure 2b,d. (b,c) same as a, for the example cells in Figure 2i–j.
Figure 3
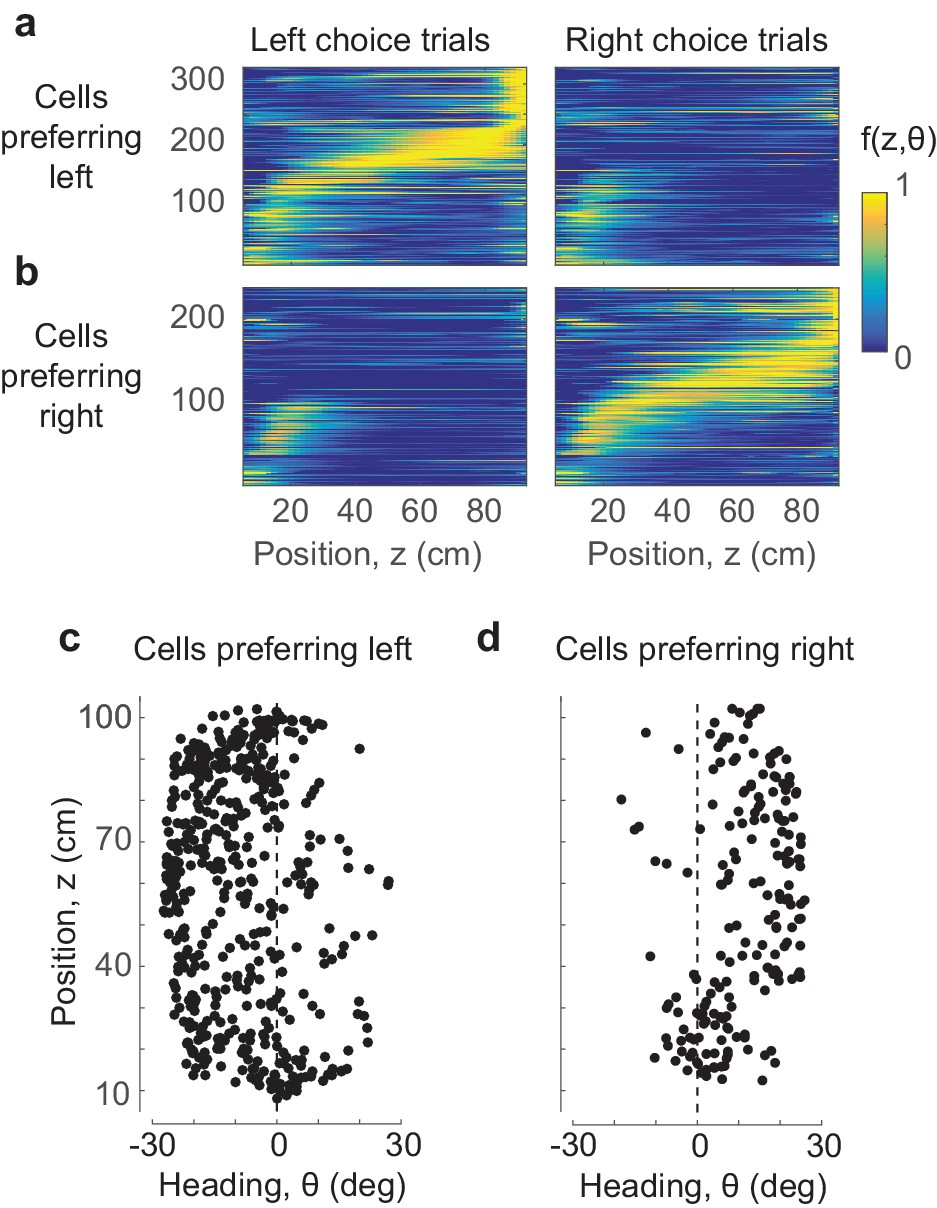
Position and heading are sufficient to explain the dependence of responses on choice.
(a,b) The position-heading model correctly predicts the sequential choice-selective activations seen in the data (compare to Figure 1k–n, where cells are arranged in the same order). (c,d) The centers of the position-heading fields of all the cells, for cells that fired preferentially in trials that ended in leftward (c) or rightward choices (d). Almost invariably, the former preferred negative (leftward) heading angles, and the latter preferred positive (rightward) heading angles.
Figure 4 with 3 supplements

Effects of adding decision as an explicit variable.
(a) Average responses of the example cell shown previously (Figure 2a–g) in the range of positions (z) of 60–80 cm, where the cell responds maximally, for trials ending in leftward choices (red) or rightward choices (blue). Curve: fits of the position-heading f(z, θ) model. The bottom panel shows the same data, fitted with a model f(z, (d) where responses depend on position z and decision, d. (b) Comparison of performance of the position-heading model (abscissa) and of the position-decision model (ordinate) for n = 7646 neurons in seven mice. Because of the vast number of neurons, data are summarized by density (gray level). For each neuron, model performance was measured by the correlation across trials between neuronal activity and model prediction. Neuronal activity and model predictions were trial-averaged, after excluding timepoints where decision and heading angle were highly correlated. The histogram shows the distribution of differences in correlation with the two models. (c): Same, but summarized as median values of correlation coefficients on a session-by-session basis. Different symbols denote different mice as indicated in Figure 4—figure supplement 1. (d) Same as b, for the extended model f(z, θ, d), where responses depend on position z, heading angle θ, and decision, d. The model predicts two largely overlapping curves. (e–f) Same as b–c, comparing the performance of the extended model with the position-heading model.
Figure 4—figure supplement 1
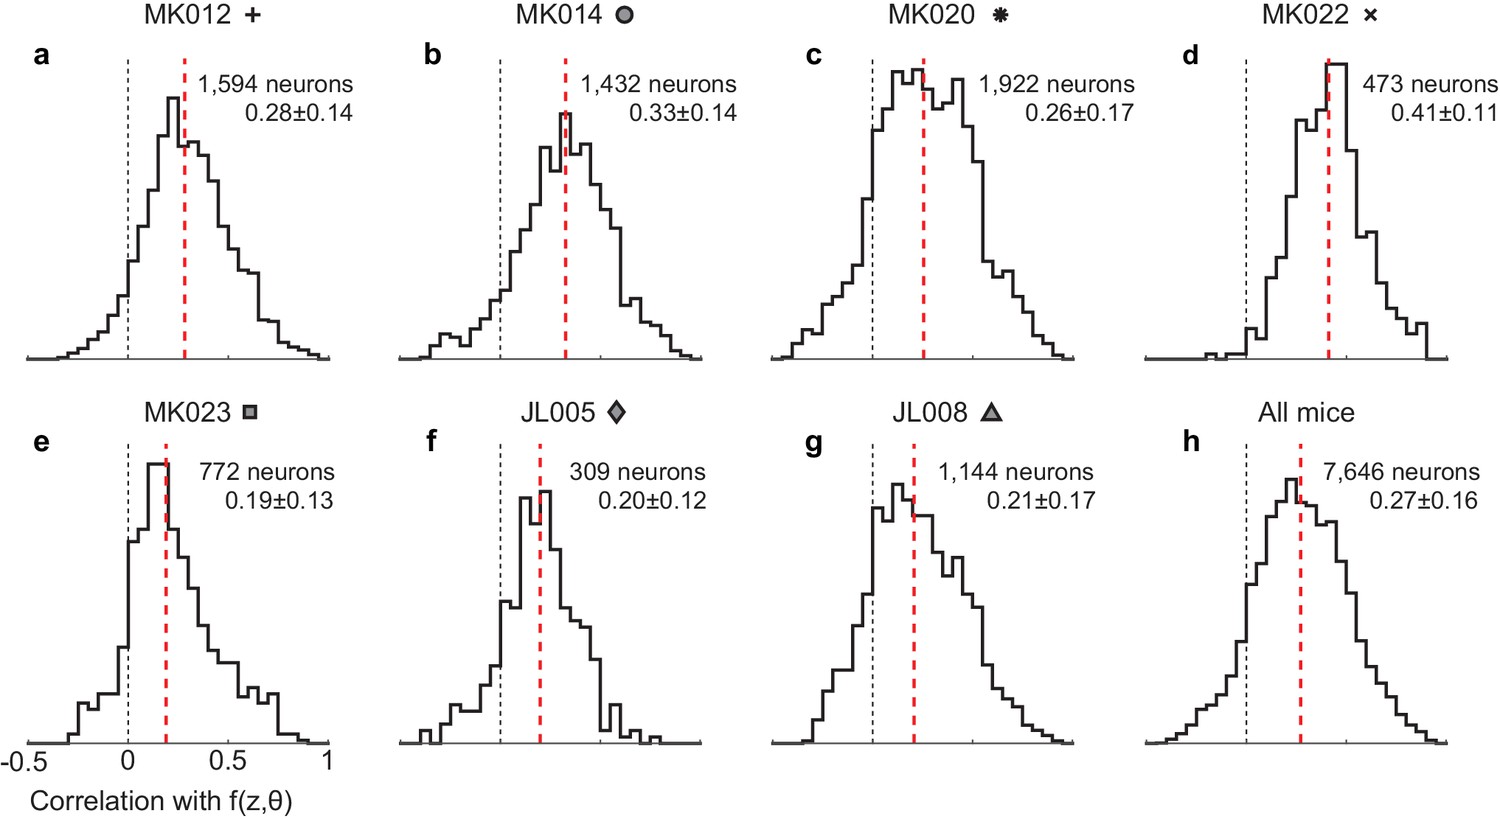
Quality of fits by position-heading model across all neurons in individual mice, measured by the correlation between the trial-averaged raw data and the model predictions.
(a–g) The seven individual mice, each with the symbol used to denote it in Figure 4. The genetic backgrounds of the mice were C57bl/6 (a,b), Camk2a-TTA;Ai93;Emx1 (c–e), and Ai95;Slc17a7-Cre (f,g). The median values of these distributions were not significantly different across the three genotypes (p=0.48, one-way ANOVA). (h) All neurons from all mice.
Figure 4—figure supplement 2
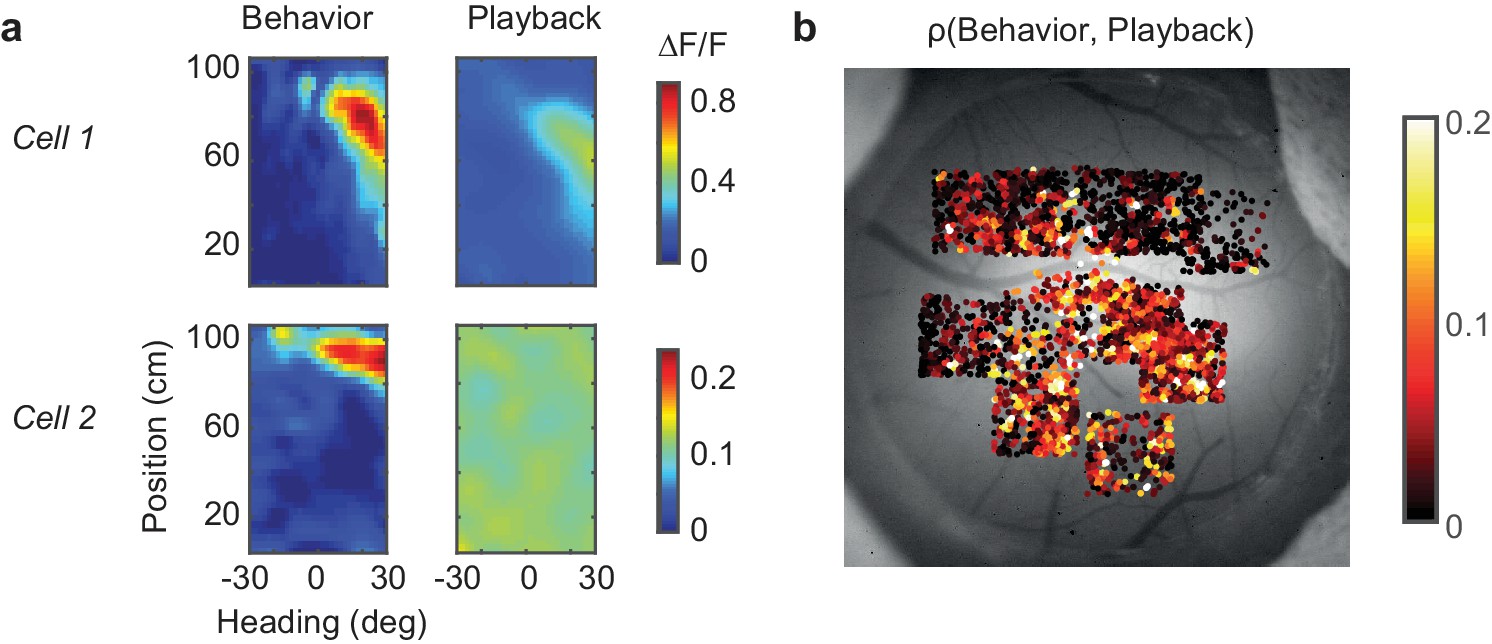
Assessing the role of visual factors.
(a) In the playback condition, the estimated position-heading fields of PPC neurons were either much weaker (example cell 1) than during the task behavior, or completely absent (example cell 2) (b) When comparing responses between behavior and playback, neurons in primary visual cortex (posterior fields of view) showed more similarity in their responses between the two conditions than neurons in PPC (anterior fields of view).
Figure 4—figure supplement 3
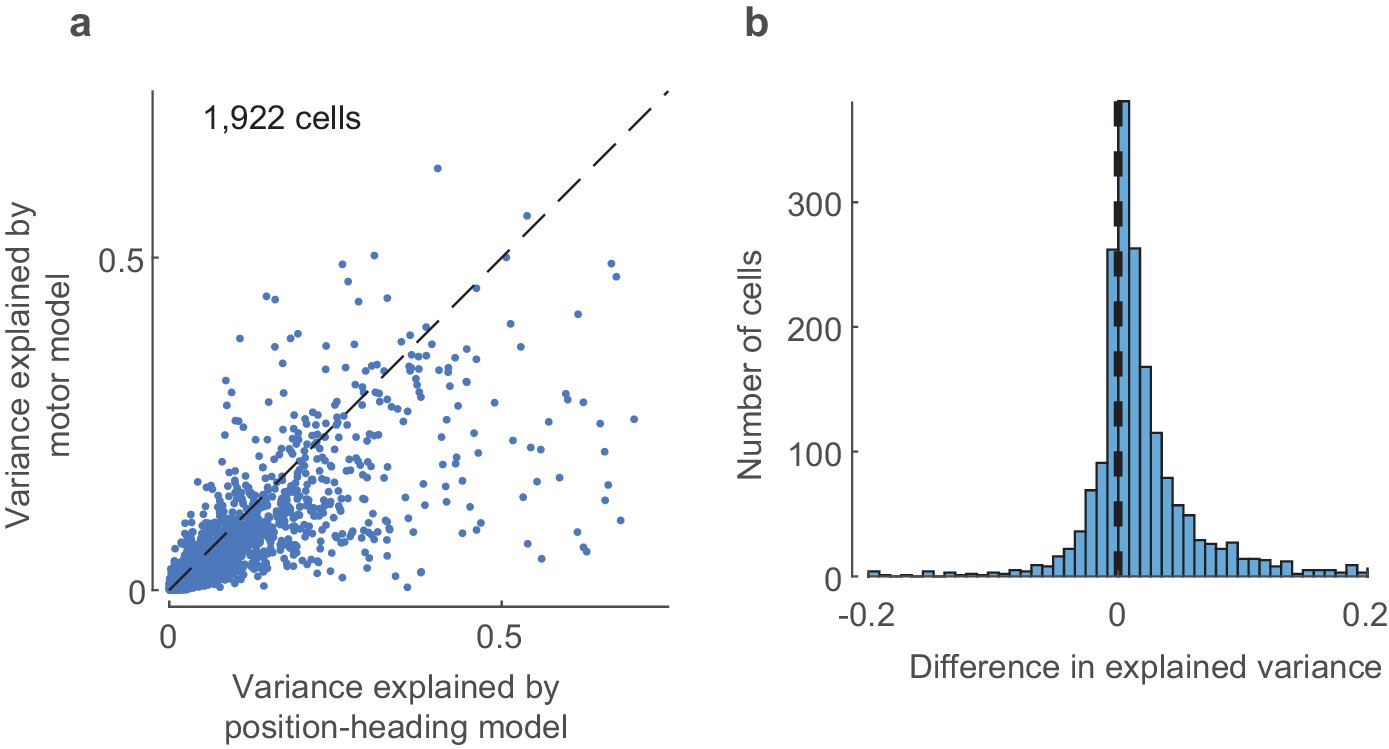
Assessing the role of motor factors.
(a) The position-heading model performs better than the alternative motor model, as measured by cross-validated explained variance. (b) The explained variance of the position-heading model is significantly larger than the explained variance of the motor model (p<0.001, one-sided t-test).
Figure 5 with 1 supplement

Decoding animal position and choice from neural activity.
(a) The posterior estimate of the position closely follows the actual trajectory of the animal. Different rows represent different trials; different columns represent different moments in the trial. Red dashed line represents the trajectory of the mouse in the trial, circle – the actual position of the mouse in the corridor. Estimation of underlying position-heading fields used for position decoding during a specific trial was performed without including the neural data of that same trial. (b) Estimated trajectories in z-θ space closely follow the actual trajectories of the mouse. The red dashed line represents the actual mouse’s trajectory, green solid line represents estimated trajectory, superimposed on a pseudocolor representation of the underlying posterior probability distribution. (c) Choice predictability, as estimated from the decoded trajectories at different stages of the trial, from early in the trial (faint red) to late in the trial (full red). The neurometric choice predictability increases as the mouse progresses through the corridor, meaning that the final choice becomes increasingly more predictable from the neural activity. Error bars represent s.e.m. (d) Neurometric functions, estimated at different positions in the corridor (faint red line to full red line). The data points here are the same as in Figure 1h), however the curves are fit to the data points decoded from neural activity (not shown).
Figure 5—figure supplement 1

Full trajectory decoding from a sequence of posterior distribution estimates.
(a) Posterior distribution estimated from PPC population activity at a specific time t and z= z(t). (b) Probability distribution of the heading angle is estimated by calculating an integral of the posterior distribution from a across z. Heading angle θ is estimated as a center of mass of. (c) Performing the steps in (a) and (b) for each z provides a prediction of the whole trajectory of the mouse during the trial (green line). Red frame indicates the z=z(t) from the example frame in (a) and (b).
Videos
Video 1
A mouse performing some trials of the task.
https://doi.org/10.7554/eLife.42583.005
Video 2
Frame-by-frame decoding of mouse position from PPC population activity.
The main rectangle represents the position of the mouse in the coordinates of position (z) vs. heading angle (θ). For each trial, the contrast and position of the stimulus shown in that trial is indicated by the grating shown on the left, and the trajectory of the mouse is indicated by a black dashed line. The frame-by-frame position of the mouse is indicated by a circle. The color-coded map is the log posterior distribution of the current position of the mouse estimated from population activity of PPC neurons. The peak (white) indicates the decoded position.
Additional files
-
Transparent reporting form
- https://doi.org/10.7554/eLife.42583.016
Download links
A two-part list of links to download the article, or parts of the article, in various formats.
Downloads (link to download the article as PDF)
Open citations (links to open the citations from this article in various online reference manager services)
Cite this article (links to download the citations from this article in formats compatible with various reference manager tools)
Decision and navigation in mouse parietal cortex
eLife 7:e42583.
https://doi.org/10.7554/eLife.42583


