Division of labour between PP2A-B56 isoforms at the centromere and kinetochore
- University of Dundee, United Kingdom
Figures
Figure 1 with 5 supplements
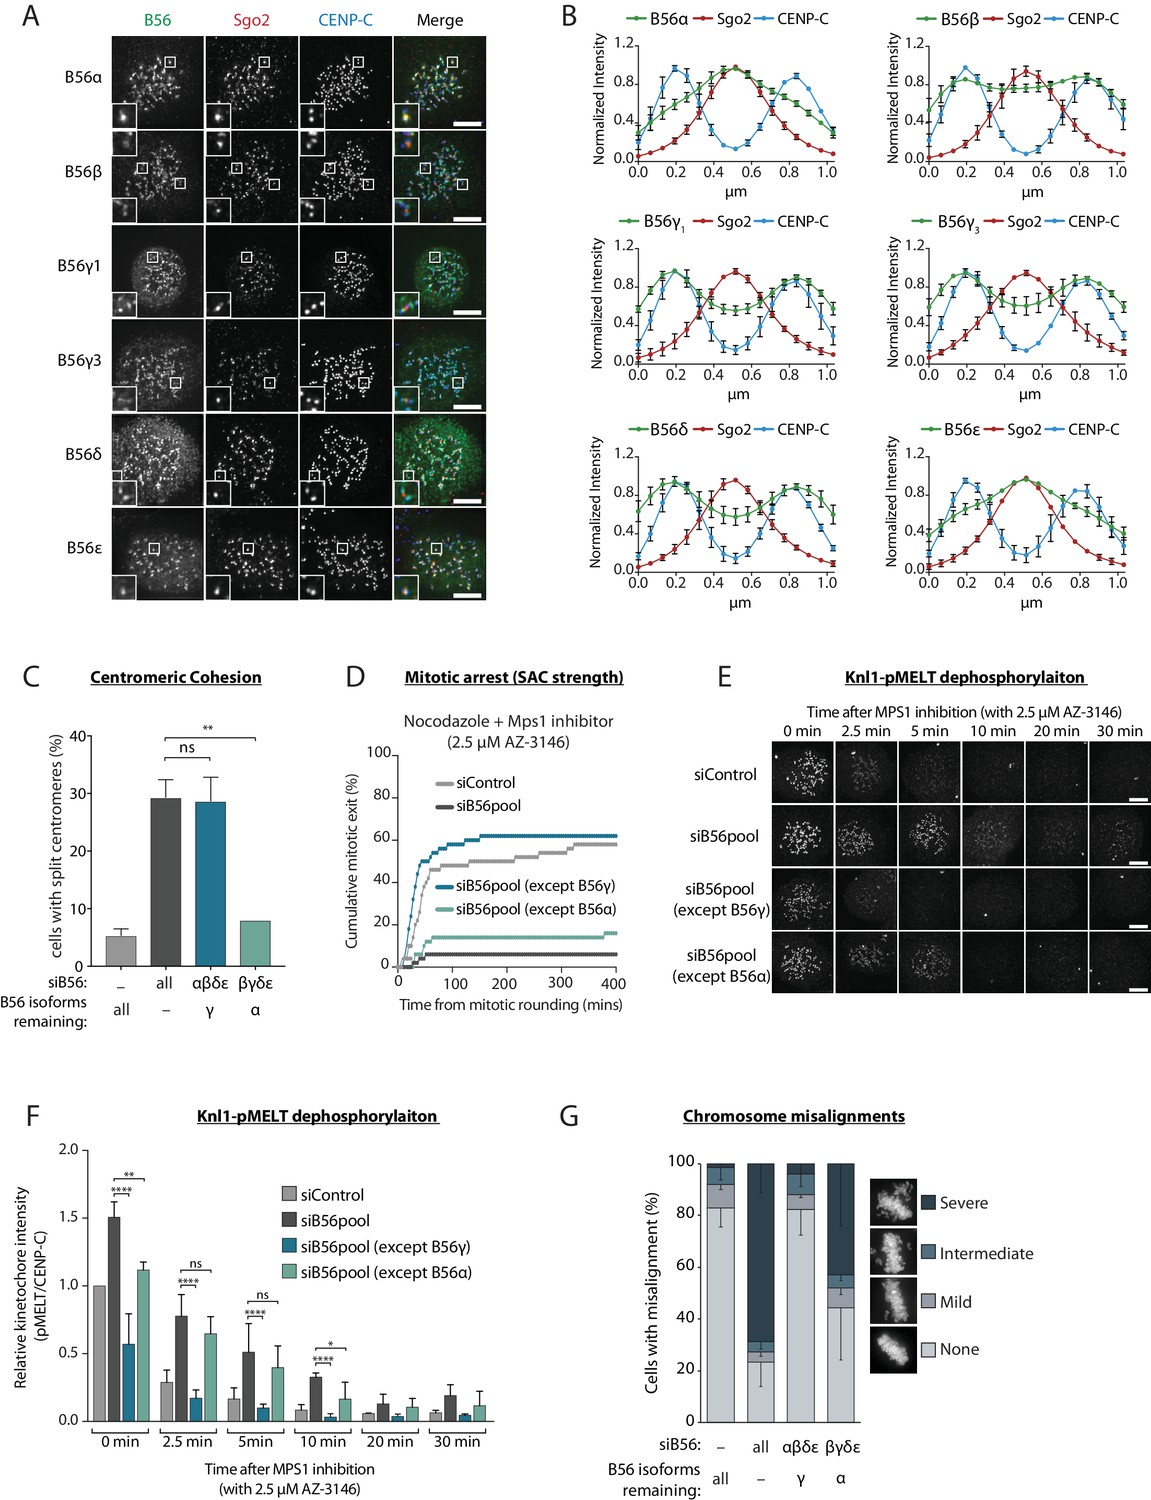
A subset of PP2A-B56 complexes control spindle assembly checkpoint silencing and chromosome alignment.
(A and B) Representative images (A) and line plots (B) of nocodazole-arrested Flp-in HeLa cells expressing YFP-B56 (B56α, B56β, B56γ1, B56γ3, B56δ and B56ε). For line plots, five kinetochore pairs were analysed per cell, for a total of 10 cells per experiment. Graphs represent the mean intensities (±SD) from 3 independent experiments. Intensity is normalized to the maximum signal in each channel in each experiment. (C–G) Flp-in HeLa cells treated with siRNA against B56pool, all B56 isoforms except B56α, or all B56 isoforms except B56γ, were analysed for sister chromatid cohesion, SAC strength, Knl1-MELT dephosphorylation and chromosomal alignment. (C) Quantification of percentage of chromosome spreads that contain at least one split centromere. Graph represents mean data (+SD) from 3 independent experiments with 50 metaphase spreads quantified per condition per experiment. (D) Time-lapse analysis of cells entering mitosis in the presence of nocodazole and 2.5 µM AZ-3146. The graph represents the cumulative data from 50 cells, which is representative of 3 independent experiments. Representative images (E) and quantification (F) of relative kinetochore intensities of Knl1-pMELT in cells arrested in prometaphase with nocodazole and treated with MG132 for 30 min, followed by 2.5 µM AZ-3146 for the indicated amount of time. 10 cells were quantified per experiment and the graph displays the mean (+SD) of 3 independent experiments. The individual data points for each experiment can be found in the source data. (G) Quantification of chromosome misalignment in cells arrested in metaphase with MG-132. At least 100 cells were scored per condition per experiment and graph represents the mean (-SD) of 3 independent experiments. Misalignments were score as mild (1 to 2 misaligned chromosomes), intermediate (3 to 5 misaligned chromosomes), and severe (>5 misaligned chromosomes). Asterisks indicate significance (Figure 1c: Welch’s t -test, unpaired, Figure 1f: Mann-Whitney test); ns p>0.05, *p≤0.05, **p≤0.01, ****p≤0.0001. Scale bars, 5µm.
Figure 1—figure supplement 1
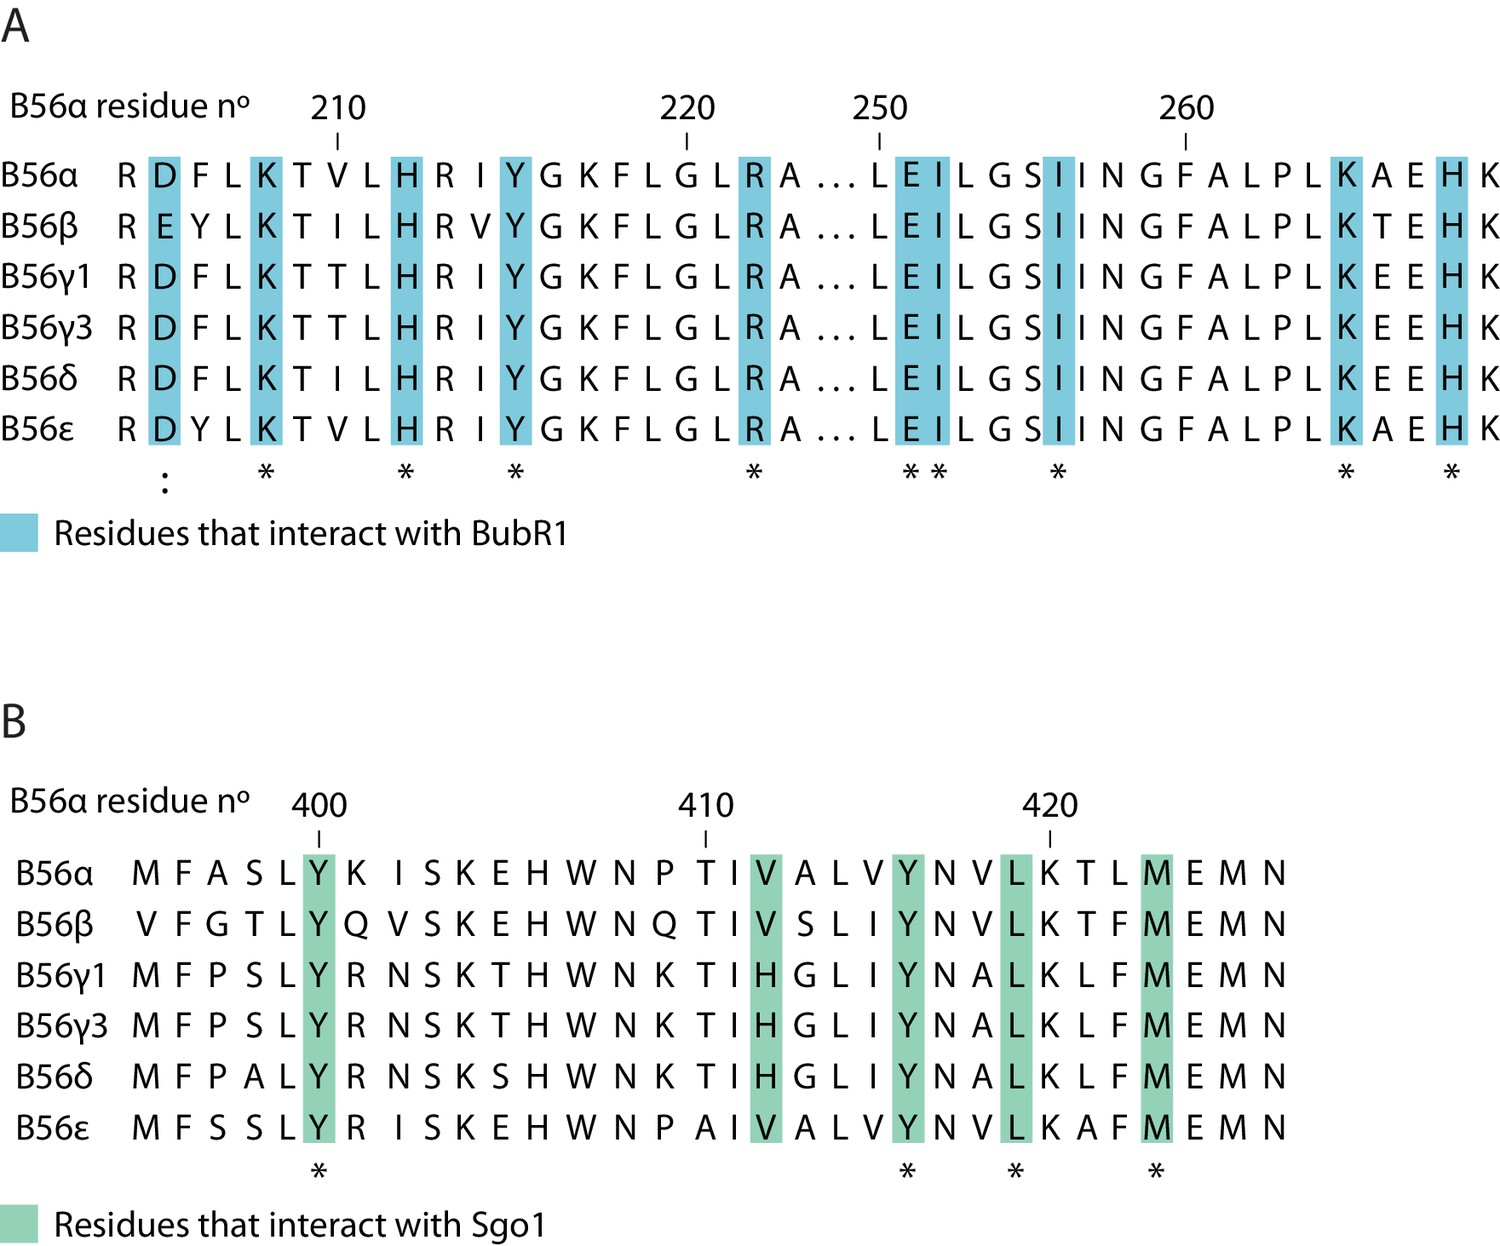
Alignment of B56 isoforms to show that Sgo1 and BubR1 interacting regions are conserved.
Alignment of the BubR1 binding pocket (A) and the Sgo1-binding region (B) in B56 isoforms.
Figure 1—figure supplement 2
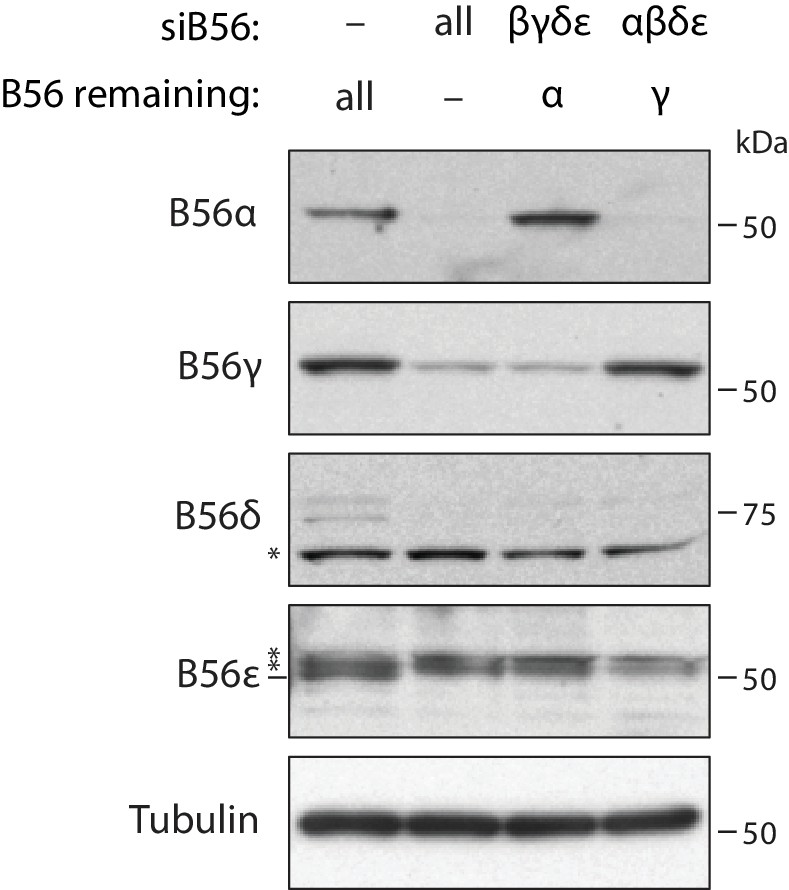
Western blot showing knockdown of different B56 isoforms.
Immunoblot of whole cell lysates from nocodazole-arrested HeLa Flp-in cells treated with the indicated siRNA and probed for B56α, B56γ, B56δ, B56ε or tubulin (note B56β was undetectable). Asterix (*) indicate non-specific bands that do not change upon B56 siRNA.
Figure 1—figure supplement 3
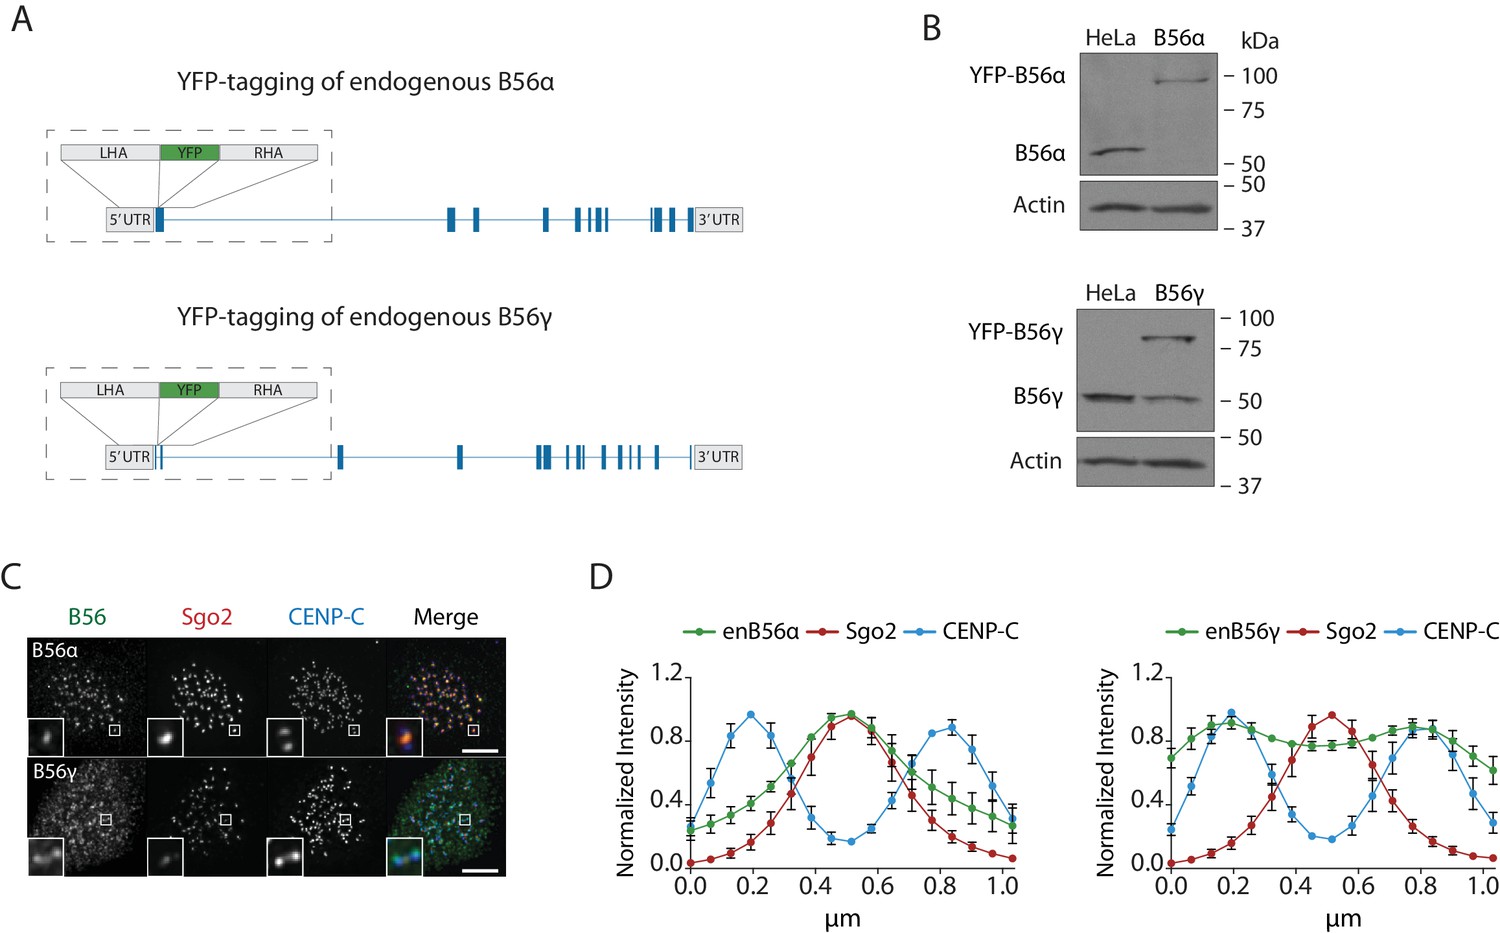
Endogenous tagging of B56α and B56γ with YFP confirms centromere and kinetochore localisation.
(A) Schematic representation of the strategy used for CRISPR/Cas9 YFP-tagging of B56 isoforms α and γ at the N-terminus. (B) Immunoblot of whole cell lysates from nocodazole-arrested HeLa cells with or without YFP-endogenously tagged B56α (enB56α) or B56γ (enB56γ). (C and D) Representative images (C) and line plots (D) of nocodazole-arrested Flp-in HeLa cells expressing endogenously tagged YFP-B56α (enB56α) or YFP-B56γ (enB56γ). For line plots, 5 kinetochore pairs were analysed per cell, for a total of 10 cells per experiment. Graphs represent the mean intensities (±SD) from 3 independent experiments. Intensity is normalized to the maximum signal in each channel in each experiment. Scale bars, 5µm.
Figure 1—figure supplement 4
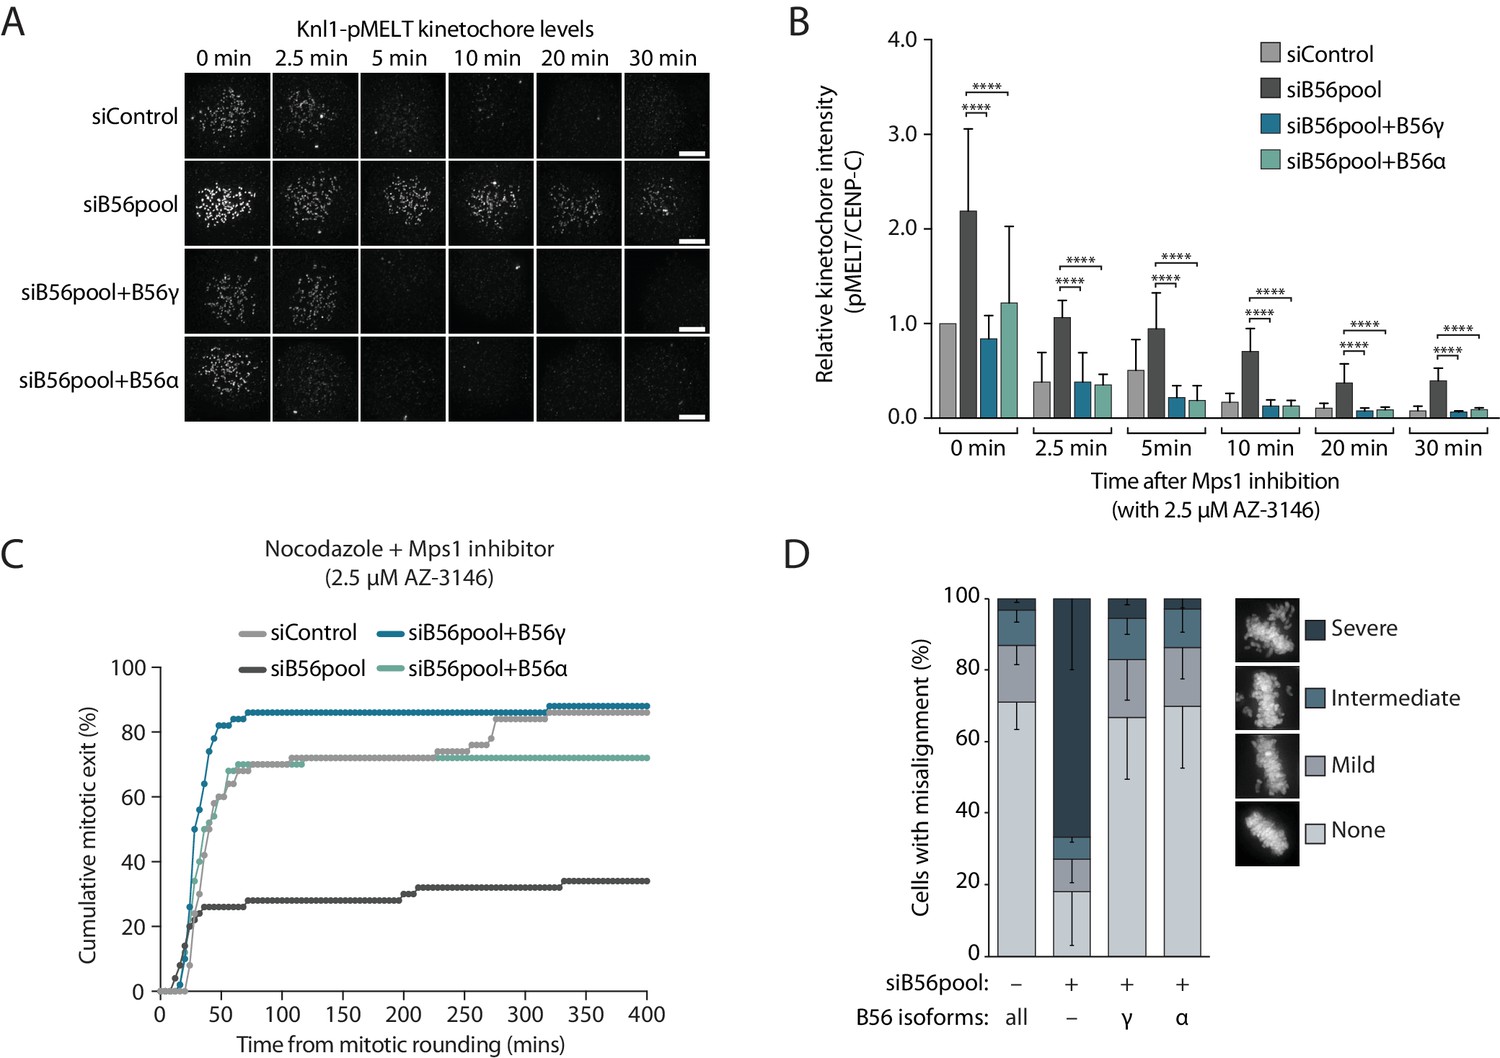
Overexpression of YFP-B56α can rescue kinetochore functions.
(A-D) Flp-in HeLa cells treated with siRNA against B56 pool and induced to re-express YFP-B56α or YFP-B56γ were analysed for SAC silencing and chromosomal alignment. Representative images (A) and quantification of relative kinetochore intensities (B) of Knl1-pMELT in cells arrested in prometaphase with nocodazole and treated with MG132 for 30 min followed by 2.5 μM AZ-3146 for the indicated amount of time. 10 cells were quantified per experiment and graphs represent the mean (+SD) of 4 independent experiments. Scale bars, 5µm. (C) Time-lapse analysis of cells entering mitosis in the presence of nocodazole and 2.5 µM AZ-3146. The graph represents the cumulative data from 50 cells, which is representative of 3 independent experiments. (D) Quantification of chromosome alignment in cells arrested in metaphase with MG-132. At least 100 cells were scored per condition per experiment and graph represents the mean (-SD) of 3 independent experiments. Misalignments were score as mild (1 to 2 misaligned chromosomes), intermediate (3 to 5 misaligned chromosomes), and severe (>5 misaligned chromosomes). Asterisks indicate significance (Mann-Whitney test); ****p≤0.0001.
Figure 1—figure supplement 5
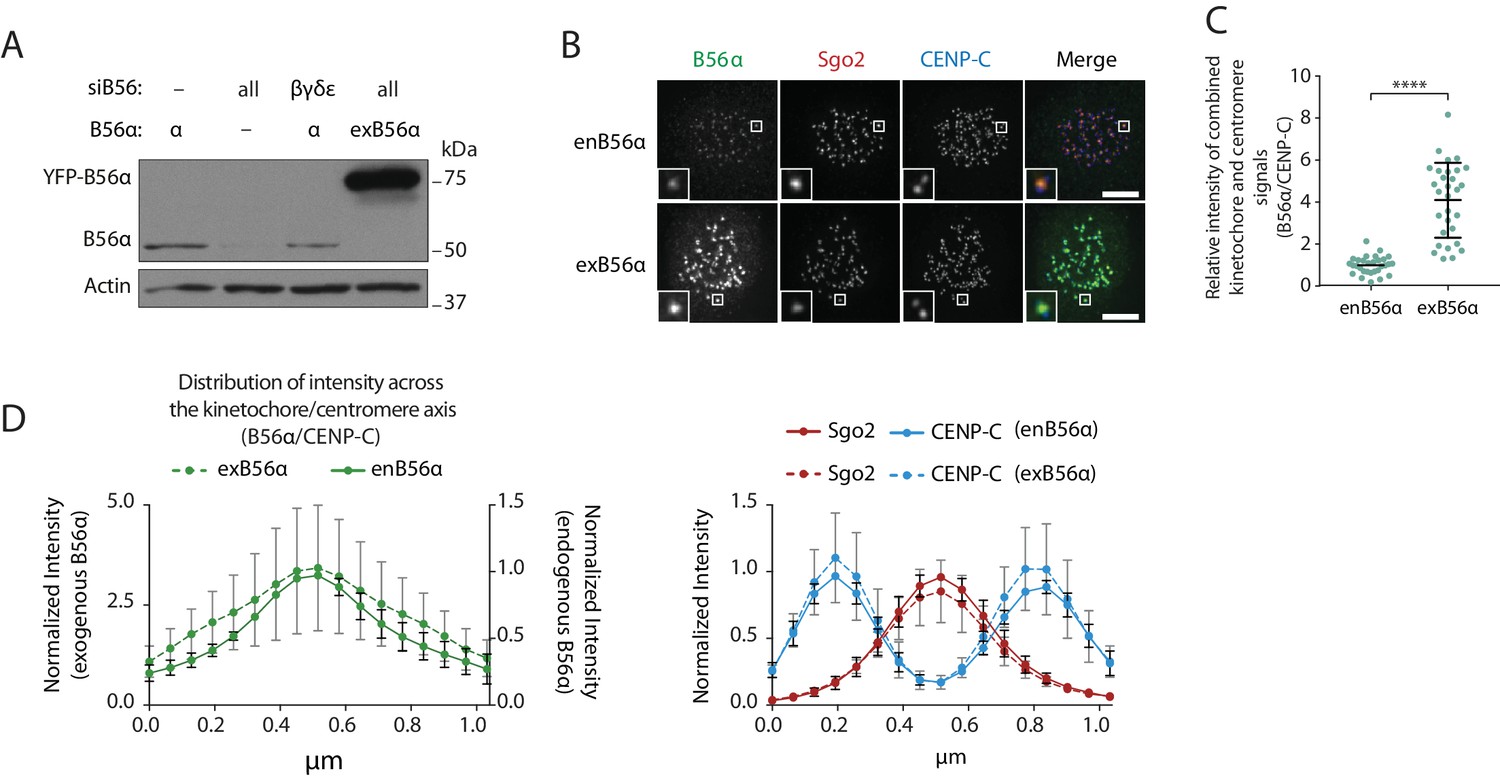
Overexpression of YFP-B56α enhances B56α levels at centromeres and kinetochores.
(A) Immunoblot of whole cell lysates from nocodazole-arrested Flp-in HeLa cells treated with the indicated siRNA expressing endogenous YFP-B56α (enB56α) or exogenous YFP-B56α (ex B56α). Blot was probed for B56α or actin. (B–D) Localization of endogenous and exogenous YFP-B56α. Representative images (B) and quantification of relative centromere/kinetochore intensity (C) of B56α in cells arrested in prometaphase with nocodazole. 10 cells were quantified per experiment and graphs represent the mean (±SD) of 3 independent experiments. Scale bars, 5µm. (D) Line plot analysis: five kinetochore pairs were analysed per cell, for a total of 10 cells per experiment. Graphs represent the mean intensities (±SD) from three independent experiments. Intensity is normalized to the maximum signal present in each channel within the endogenous B56α experiment. Asterisks indicate significance (Mann-Whitney test); ****p≤0.0001.
Figure 2 with 1 supplement

Sgo2 specifically localizes B56α to centromeres.
(A-G) The effect of Sgo1 and/or Sgo2 knockdown on YFP-B56α localisation in Flp-in HeLa cells. Representative images (A, C, F) and quantifications (B, D, G) of relative kinetochore intensity of B56α in cells arrested in prometaphase with nocodazole after knockdown of Sgo2 (A, B), Sgo1 (C, D), or Sgo1 +Sgo2 (F, G). (E) shows line plots of Sgo2 and B56α localisation following Sgo1 knockdown; 5 kinetochore pairs were analysed per cell, for a total of 10 cells per experiment. Graphs represent the mean intensities (±SD) from 3 independent experiments. Intensity is normalized to the maximum signal present in each channel within the endogenous B56α experiment. (H–M) Flp-in HeLa cells expressing YFP-B56α or YFP-B56γ were transfected with the CB-Sgo2 (H–K) or gChr7 +Cas9 DARPIN (L, M) and analysed for B56 recruitment in cells arrested in prometaphase with nocodazole. (H), (L), and J). are representative images; I) and K) are quantifications of relative centromere/kinetochore intensity of the indicated antigen; and M) is quantification of intensity of Sgo2 over B56 at the Chr7 locus. For all centromere/kinetochore intensity graphs, each dot represents a cell and 10 cells were quantified per experiment for at least 3 independent experiments. The spread of dots indicates the biological variation between individual cells and the errors bars display the variation between the experimental repeats (displayed as -/+SD of the experimental means). Asterisks indicate significance (Mann-Whitney test); ns p>0.05, *p≤0.05, ****p≤0.0001. Scale bars, 5µm.
Figure 2—figure supplement 1
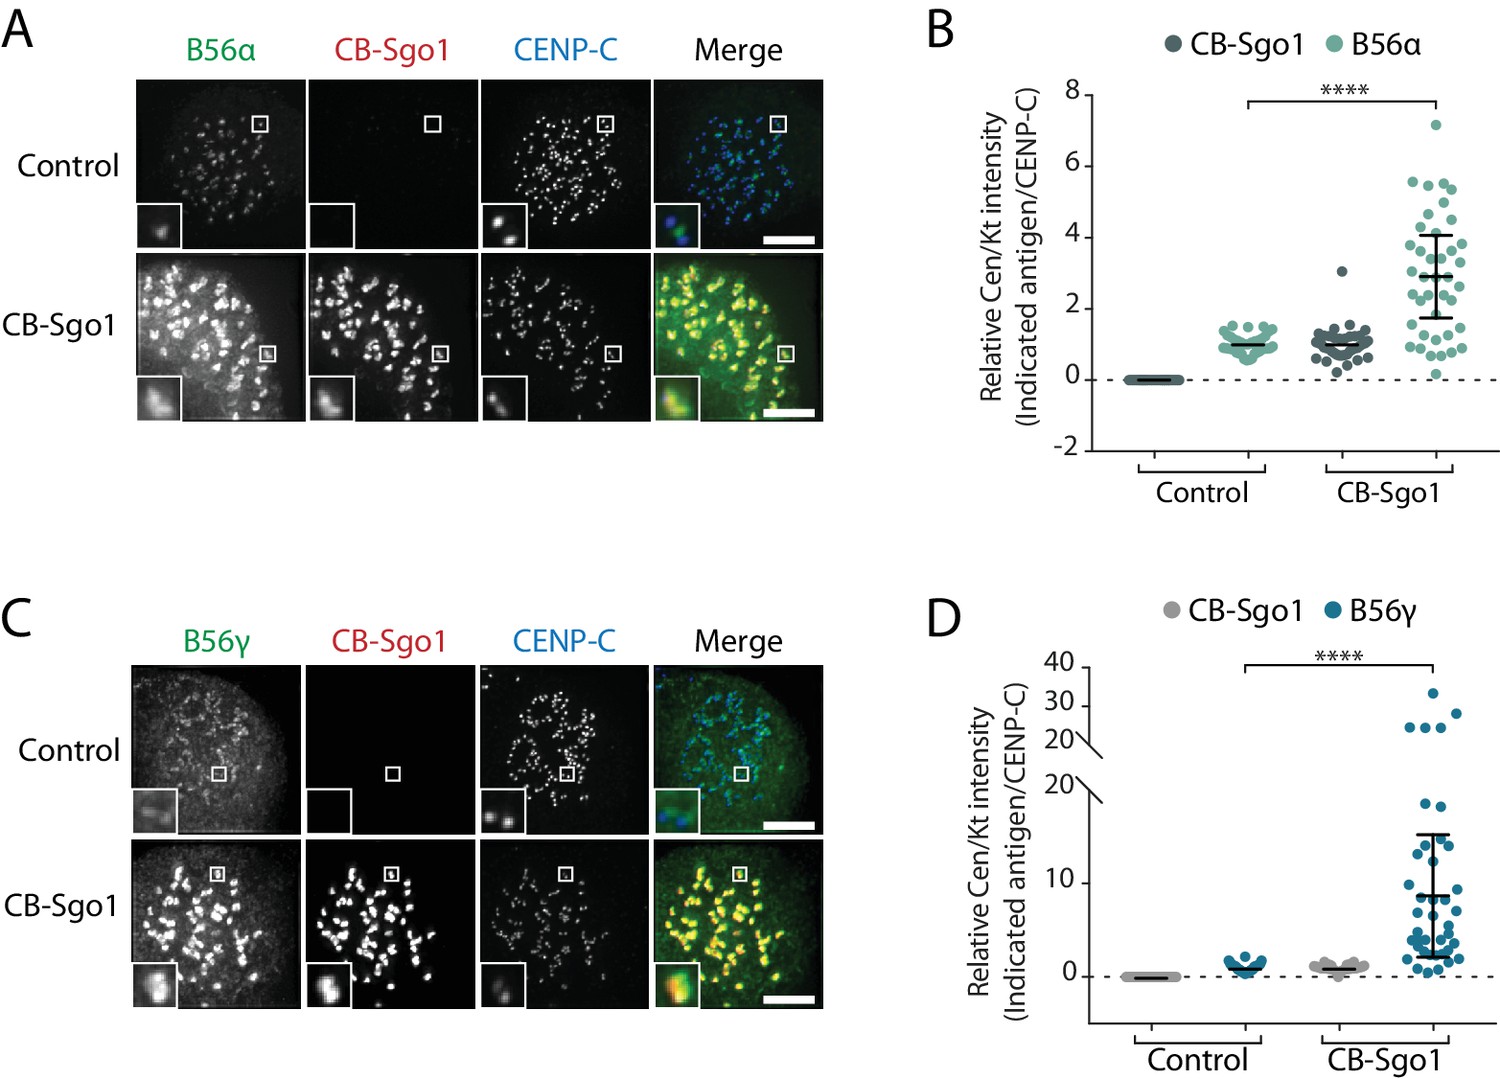
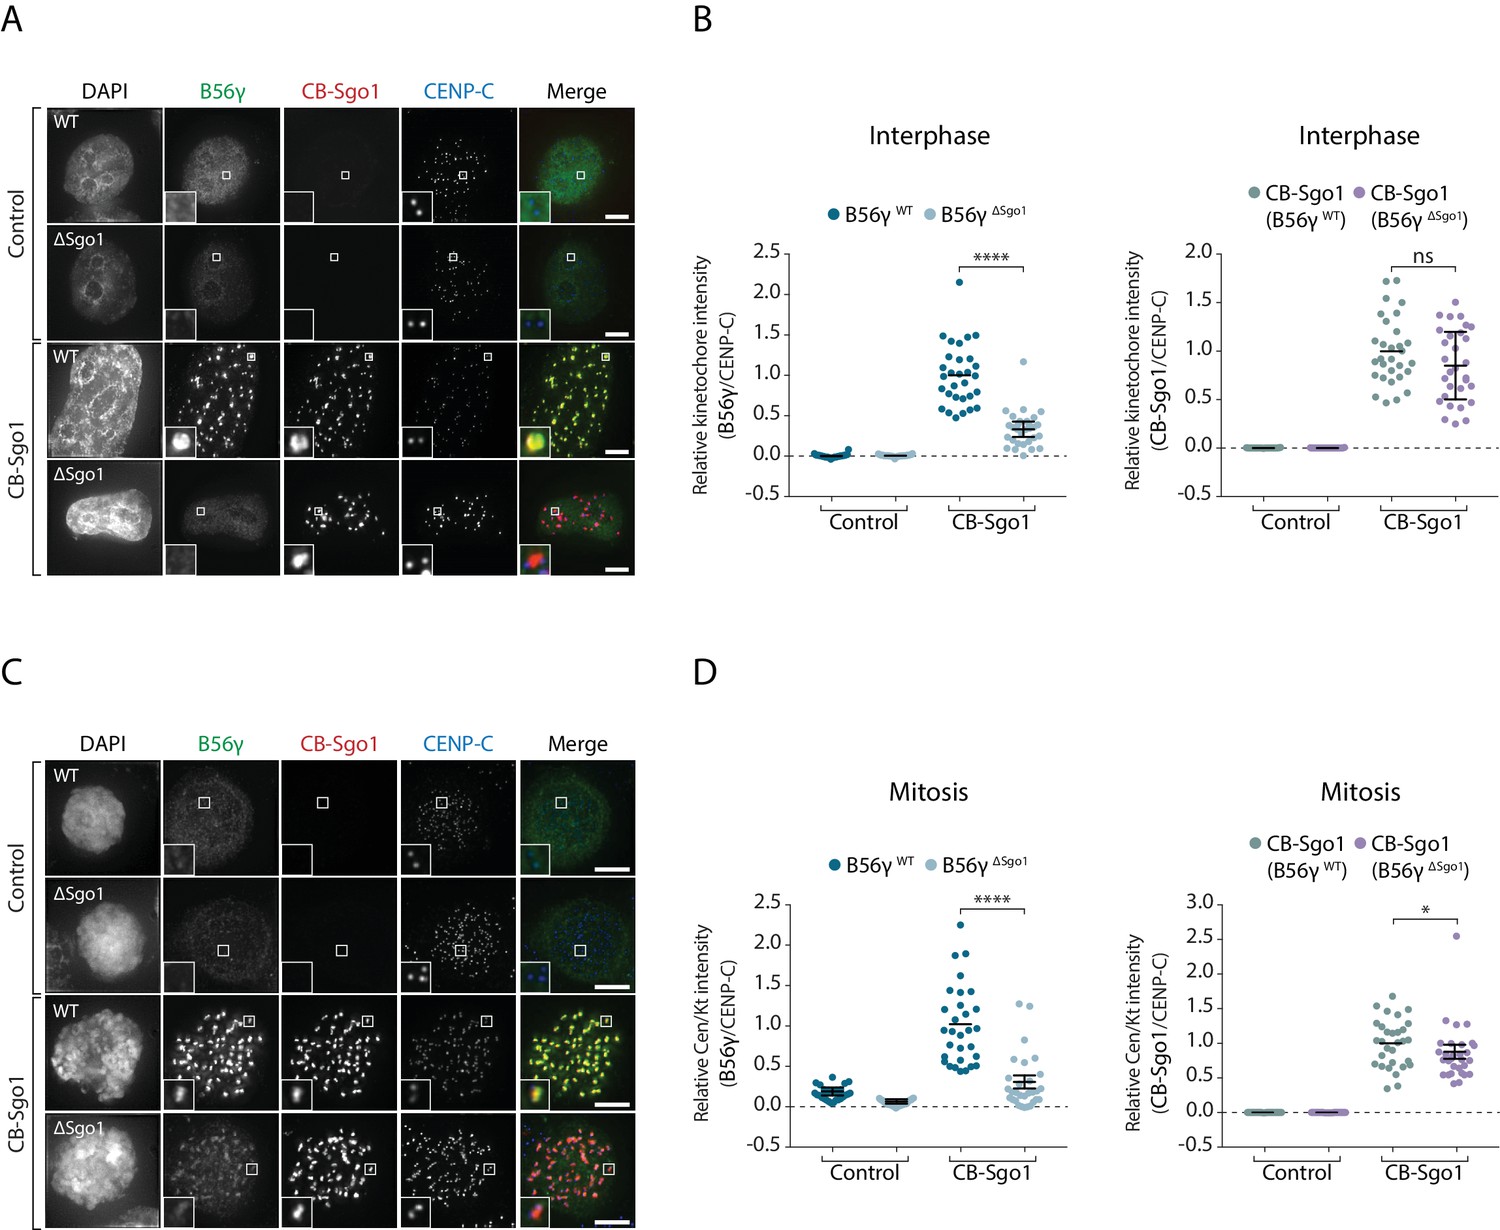
Cenp B-Sgo1 recruits both B56α and B56γ to centromeres.
(A-D) Flp-in HeLa cells expressing YFP-B56α or YFP-B56γ were transfected with CB-Sgo1 and analysed for B56 recruitment. Representative images (A and C) and quantifications (B and D) of relative centromere/kinetochore intensity of the indicated antigen in cells arrested in prometaphase with nocodazole. 10 cells were quantified per experiment and graphs represent the mean (±SD) of 4 independent experiments. Asterisks indicate significance (Mann-Whitney test); *****p≤0.0001. Scale bars, 5µm.
Figure 3 with 2 supplements
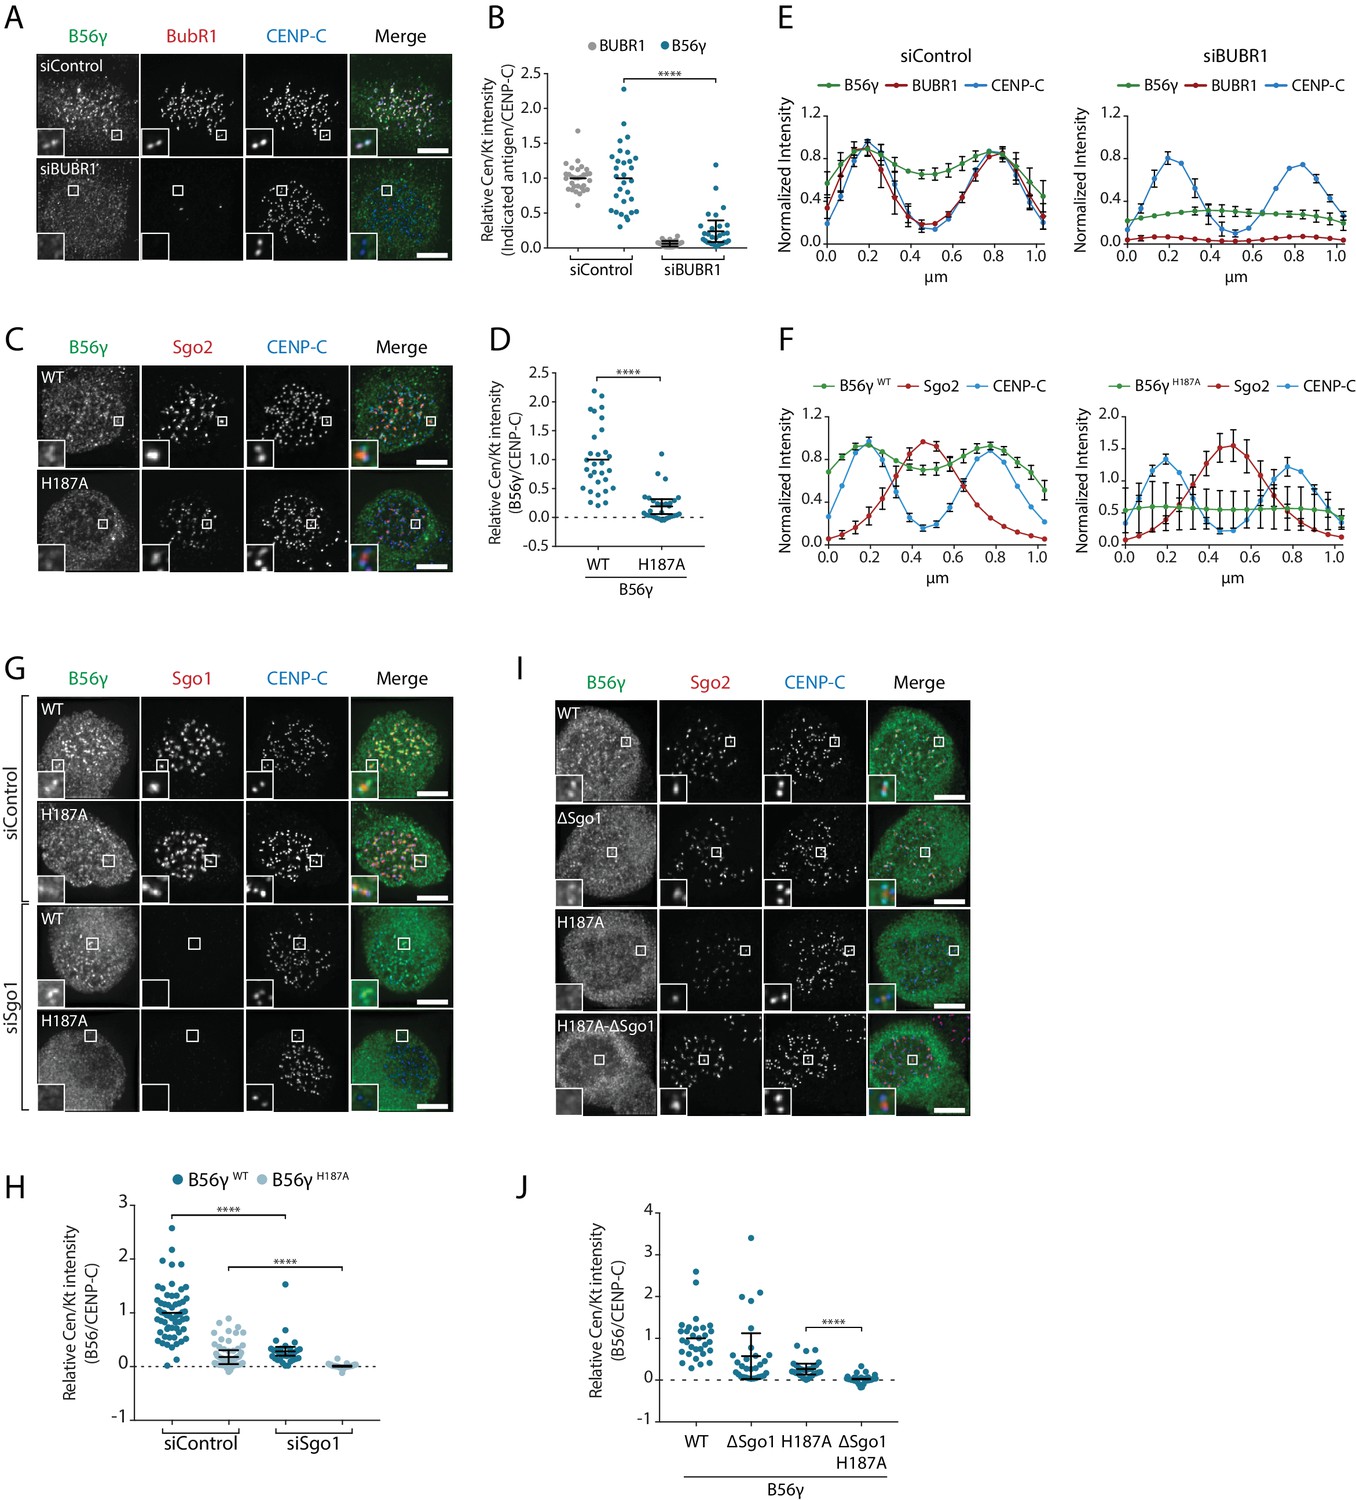
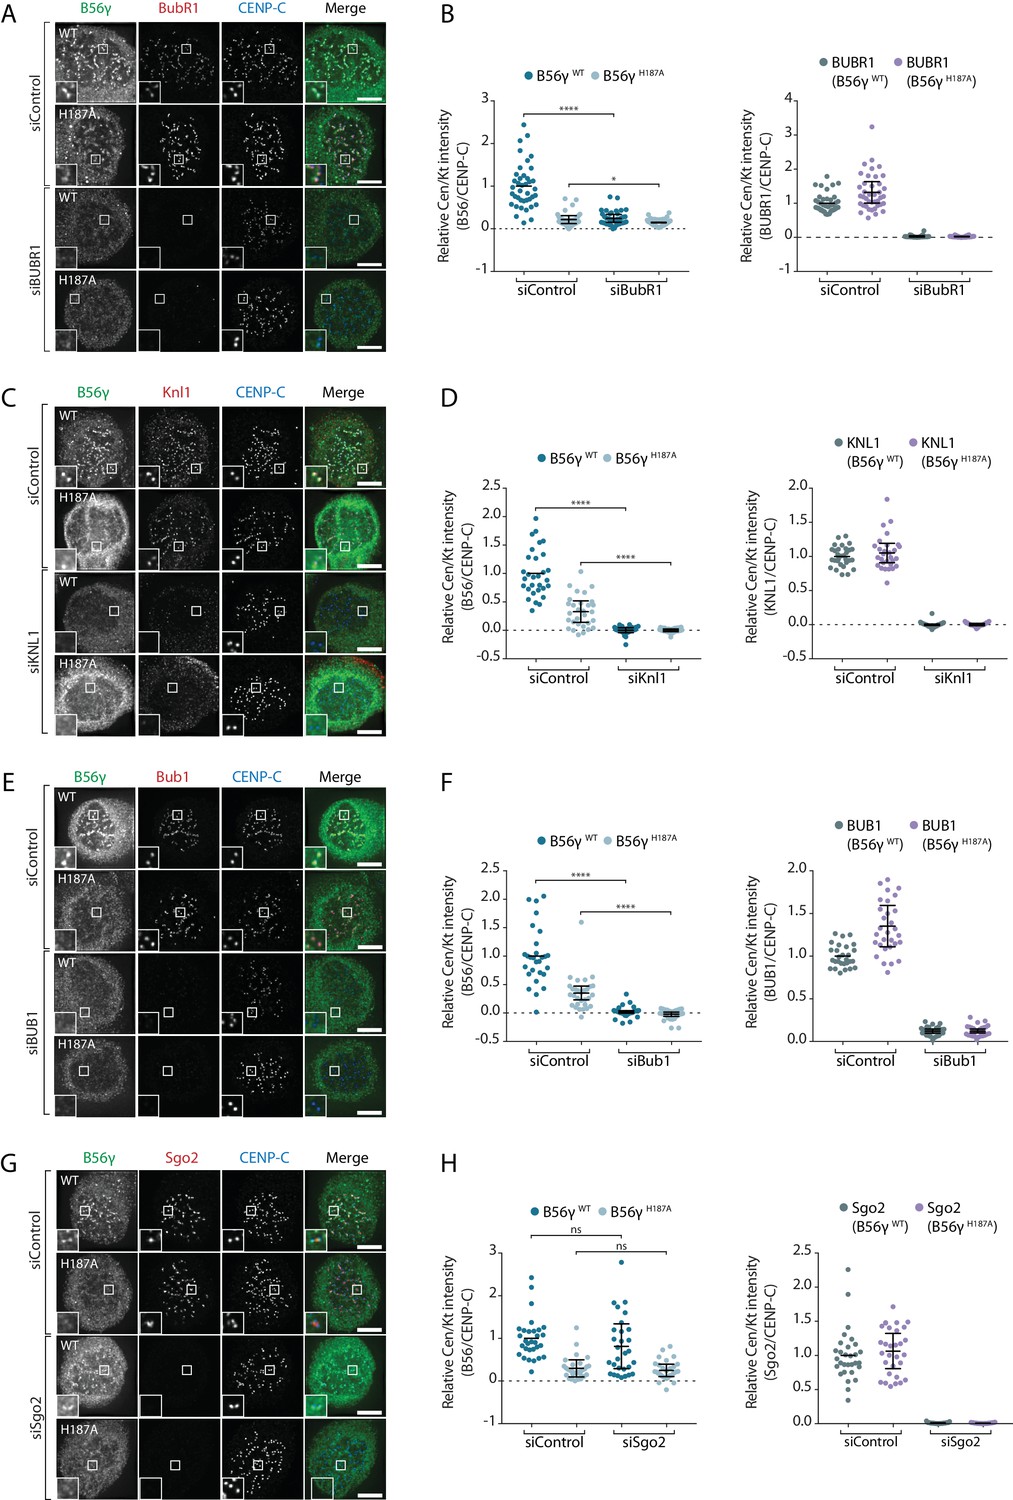
BubR1 and Sgo1 localize B56γ to kinetochores.
B56γ kinetochore localisation in Flp-in HeLa cells after BubR1 knockdown (A, B, E) or mutation of the LxxIxE binding pocket (H187A: C), (D, F) in cells arrested in prometaphase with nocodazole. For each condition, representative images (A, C), quantification of relative centromere/kinetochore levels (B, D) and line plot analysis (E, F) depicts the levels and distribution of the indicated antigens. (G–J): representative images (G, I) and quantification of relative centromere/kinetochore intensities (H, J) YFP-B56γ WT or H187A following Sgo1 knockdown (G, H) or mutation of the Sgo1 binding region (ΔSgo1). For all centromere/kinetochore intensity graphs, each dot represents a cell and 10 cells were quantified per experiment from at least 3 independent experiments. The spread of dots indicates the biological variation between individual cells and the errors bars display the variation between experimental repeats (displayed as -/+SD of the experimental means). For the line plot analysis, 5 kinetochore pairs were analysed per cell, for a total of 10 cells per experiment. The graph represents the mean intensities (±SD) from at least 3 independent experiments. Intensity is normalized to the maximum signal in each channel in each experiment. Asterisks indicate significance (Mann-Whitney test); ****p≤0.0001. Scale bars, 5µm.
Figure 3—figure supplement 1
Knl1 and Bub1 depletion completely removes B56γ from kinetochores.
(A-H) Flp-in HeLa cells expressing YFP-B56γ were treated with the indicated siRNA. Representative images (A, C, E and G) and quantifications of relative centromere/kinetochore intensity (B, D, F and H) of the indicated antigen in cells arrested in prometaphase with nocodazole. On the graphs, each dot represents a cell and 10 cells were quantified per experiment from at least 3 independent experiments. The spread of dots indicates the biological variation between individual cells and the errors bars display the variation between experimental repeats (displayed as -/+SD of the experimental means). Asterisks indicate significance (Mann-Whitney test); ns p>0.05, *p≤0.05, ****p≤0.0001. Scale bars, 5µm.
Figure 3—figure supplement 2
Mutation of the Sgo1 binding region in B56γ perturbs binding to CB-Sgo1.
Flp-in HeLa cells expressing YFP-B56γ or YFP-B56γΔSgo1 were untransfected or transfected with CB-Sgo1. Representative images (A, C) and quantification (B, D) of relative kinetochore intensity of the indicated antigen in interphase cells or cells arrested in prometaphase with nocodazole. On the graphs, each dot represents a cell and 10 cells were quantified per experiment from at least three independent experiments. The spread of dots indicates the biological variation between individual cells and the errors bars display the variation between experimental repeats (displayed as -/+SD of the experimental means). Asterisks indicate significance (Mann-Whitney test); ns p>0.05, *p≤0.05, ****p≤0.0001. Scale bars, 5µm.
Figure 4
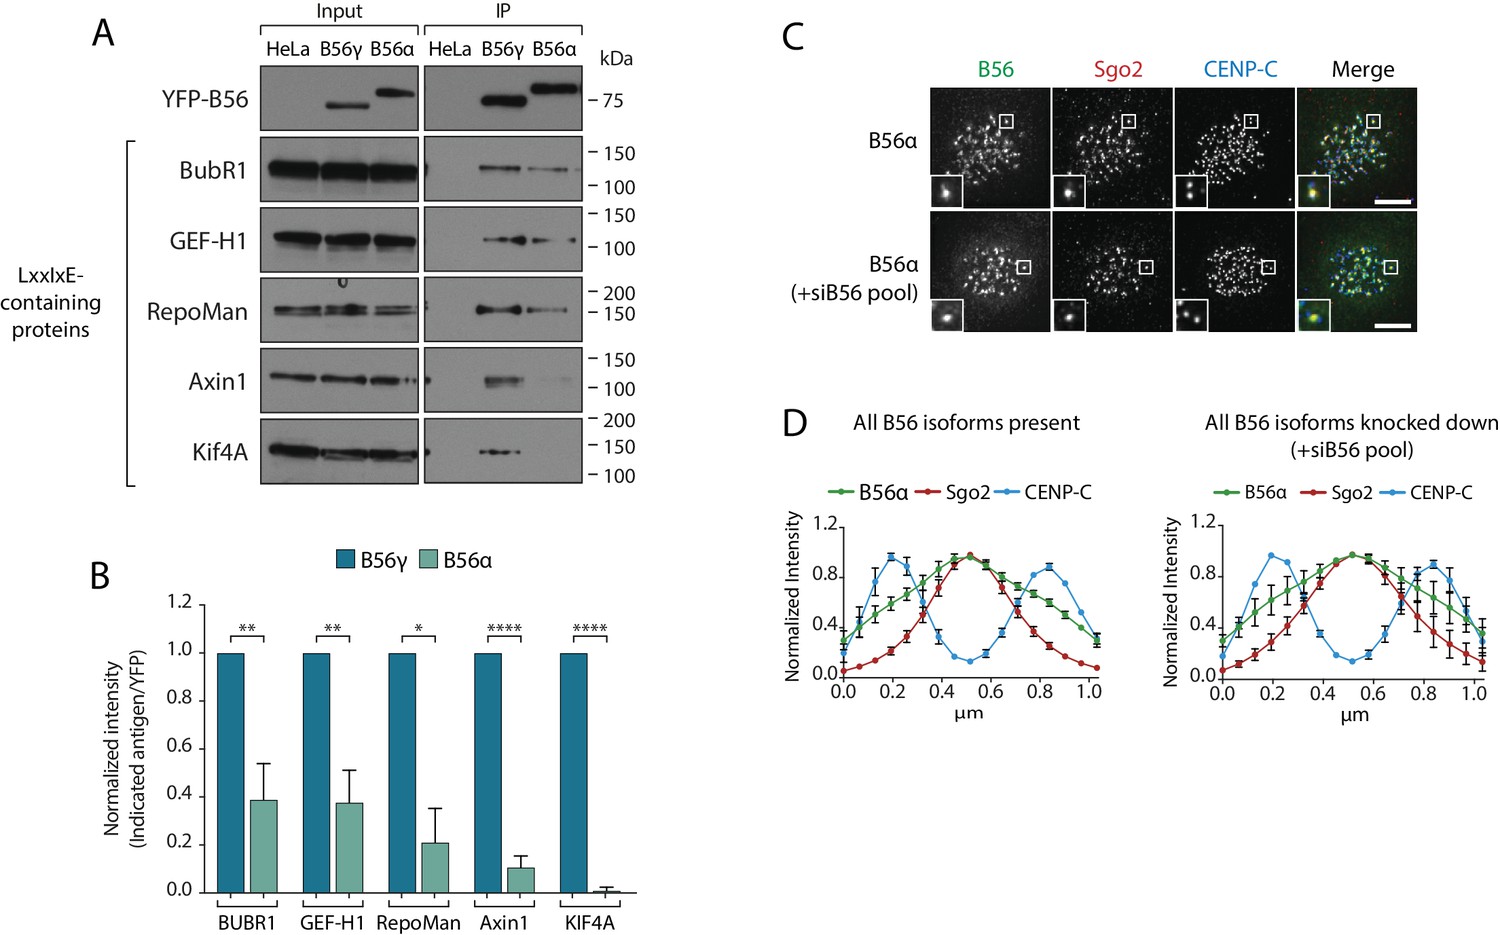
Specific binding of B56γ to kinetochores reflects an enhanced ability to bind LxxIxE motifs.
(A) Immunoblot of the indicated proteins, containing a LxxIxE motif (Hertz et al., 2016), following YFP immunoprecipitation from nocodazole-arrested Flp-in HeLa cells expressing YFP-B56α or YFP-B56γ. (B) Quantification of the mean normalised intensity (+SD) of the indicated antigens in B56α immunoprecipitates, relative to B56γ immunoprecipitates, from at least 3 independent experiments. Representative images (C) and line plot analysis (D) of YFP-B56α in Flp-in HeLa cells arrested in nocodazole and treated with the indicated siRNA. Each line plot graph represents the mean intensities (±SD) from 3 independent experiments. 5 kinetochore pairs were analysed per cell, for a total of 10 cells per experiment. Intensity is normalized to the maximum signal in each channel in each experiment. Asterisks indicate significance (Welch’s t -test, unpaired); *p≤0.05, **p≤0.01, ****p≤0.0001. Scale bars, 5µm.
Figure 5 with 2 supplements
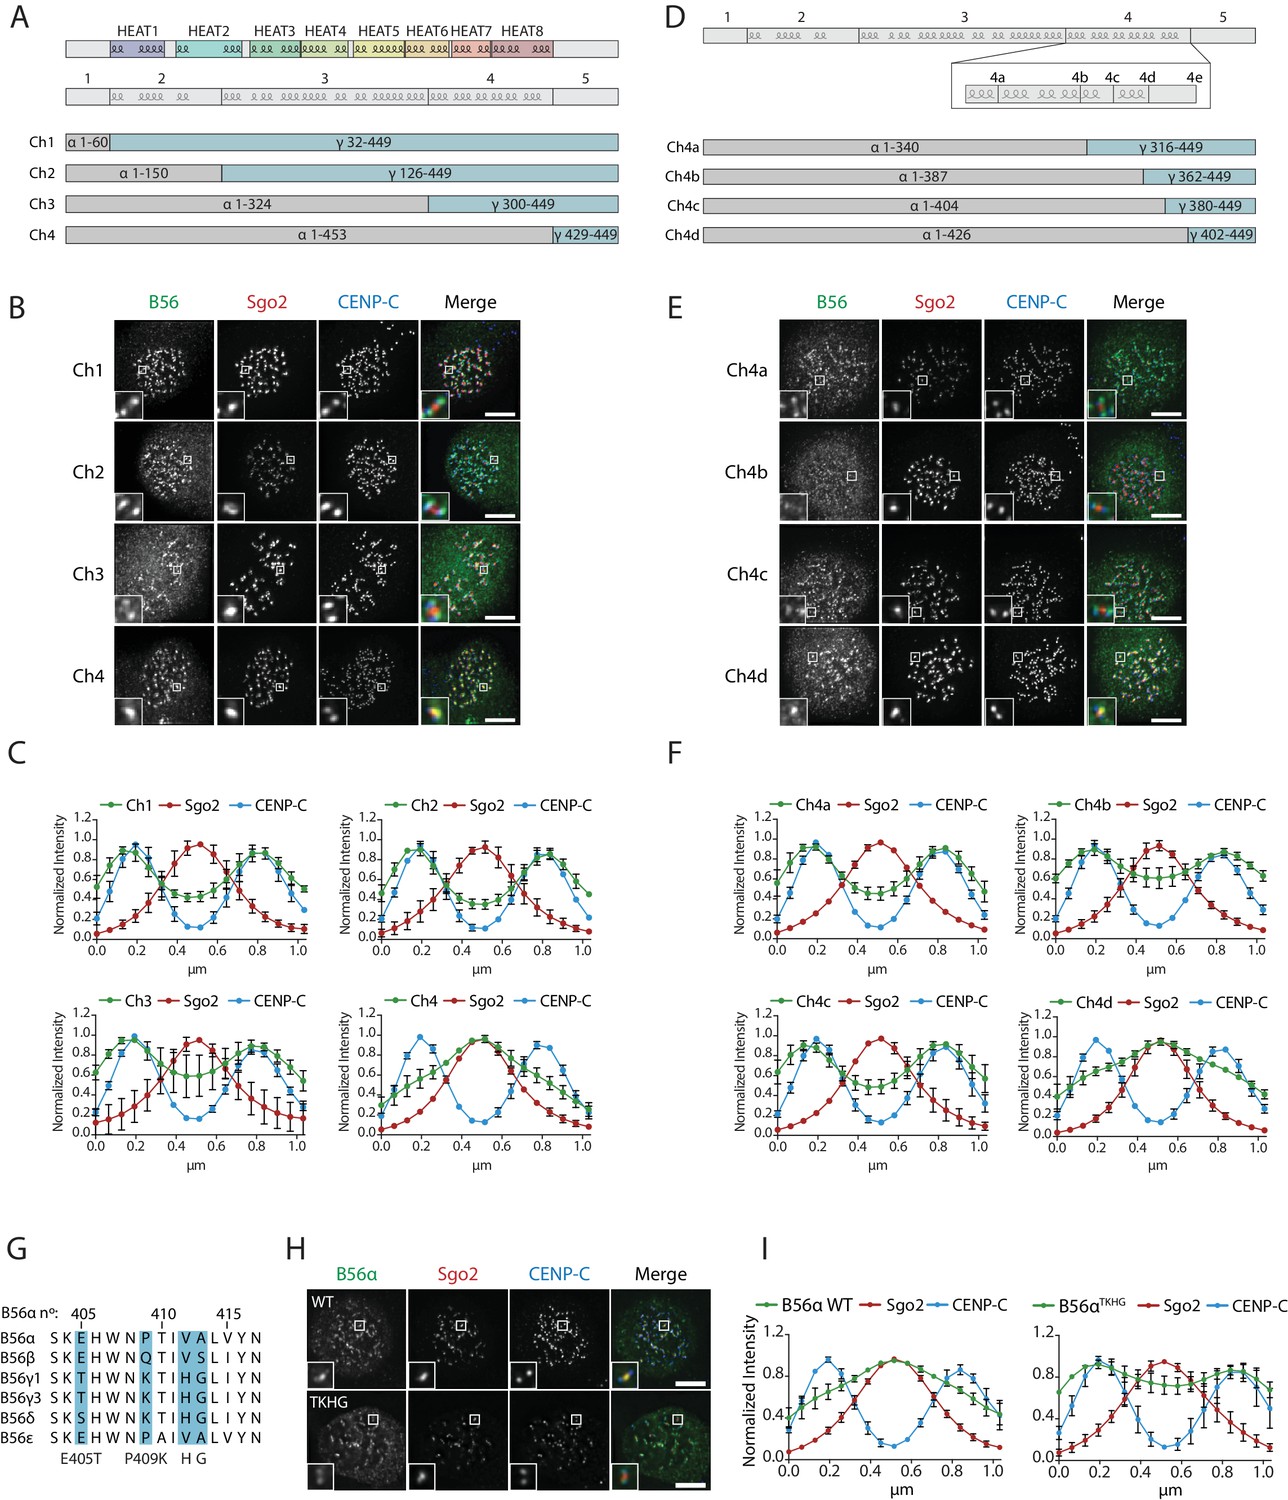
A C-terminal loop in B56 specifies B56 localization to centromeres or kinetochores.
B56 localisation in B56α-γ chimaeras spanning the entire B56 (Ch1-4: A–C), a region at the C-terminus (Ch4a-4d: D–F). (A, D) Schematic representation of the B56α-γ chimaeras created. Representative images (B, E) and line plot analysis (C, F) to show the B56 localisation pattern in each chimaera. (G). Alignment of B56 isoforms within region 4d that controls centromere/kinetochore localisation. (G–H): Effect of 4 point-mutations within region 4d to convert B56α to the correspond B56γ sequence (B56αTKHG). Representative images (H) and line plot analysis (I) of B56α WT or B56αTKHG in cells arrested in prometaphase with nocodazole. Each graph represents the mean intensities (±SD) from 3 independent experiments. 5 kinetochore pairs were analysed per cell, for a total of 10 cells per experiment. Intensity is normalized to the maximum signal in each channel in each experiment. Scale bars, 5µm.
Figure 5—figure supplement 1
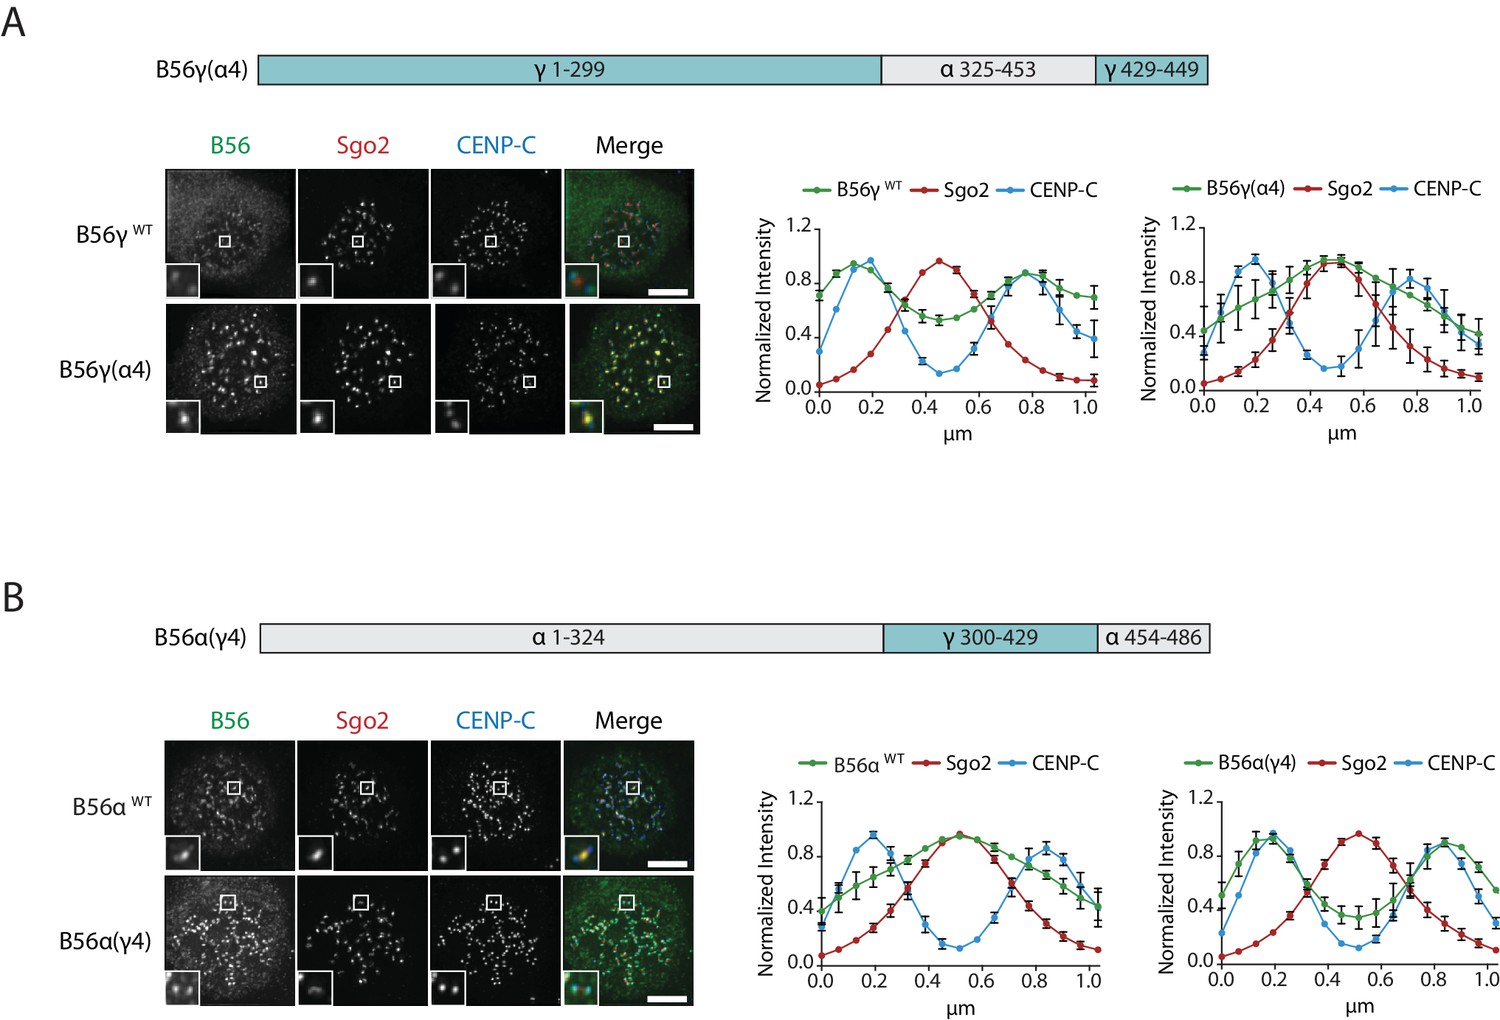
Region four is sufficient to induce B56 localization to the centromere or kinetochore.
Schematic representation of the B56α-γ chimeras alongside representative images and line plot analysis of these chimeras in cells arrested in prometaphase with nocodazole. Each graph represents the mean intensities (±SD) from 2 independent experiments. five kinetochore pairs were analysed per cell, for a total of 10 cells per experiment. Intensity is normalized to the maximum signal in each channel in each experiment. Scale bars, 5µm.
Figure 5—figure supplement 2
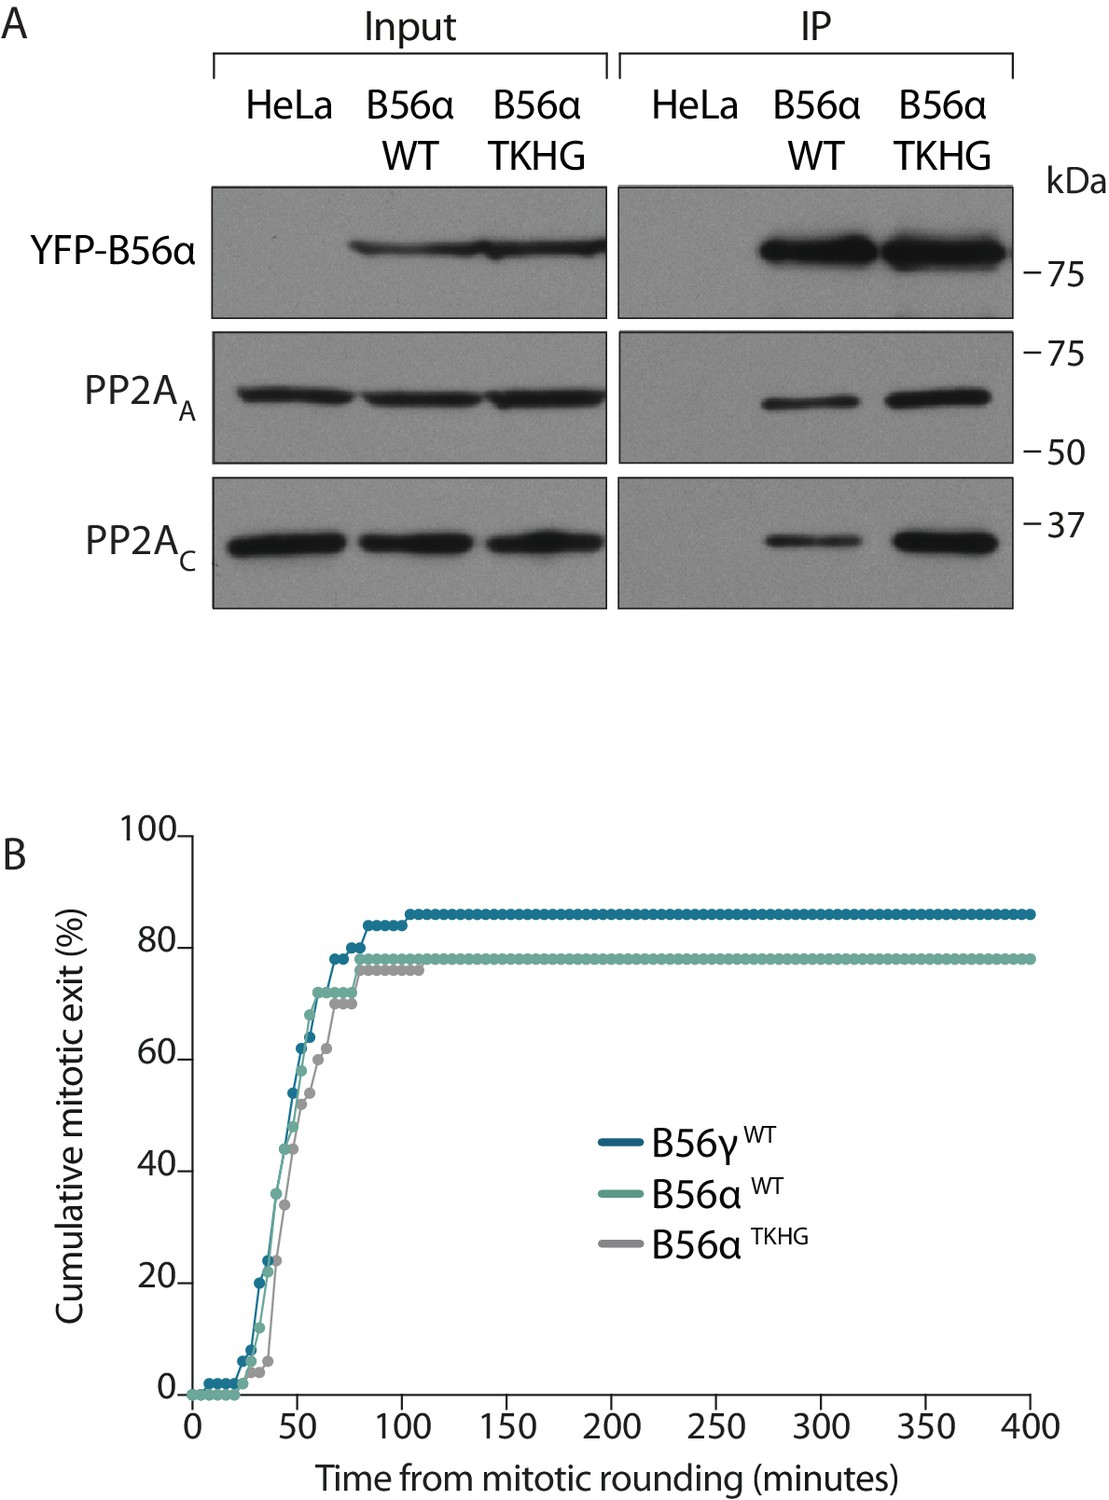
Holoenzyme assembly and mitotic exit is unperturbed by B56α TKHG mutation.
(A) Immunoblot of the PP2A subunits following YFP immunoprecipitation from nocodazole-arrested Flp-in HeLa cells expressing YFP-B56α WT or YFP-B56α TKHG. (B) Flp-in HeLa cells treated with siRNA against B56 pool and induced to re-express indicted antigens were subjected to time-lapse analysis to determine mitotic timing. The graph represents the cumulative data from 50 cells, which is representative of 3 independent experiments.
Figure 6 with 2 supplements
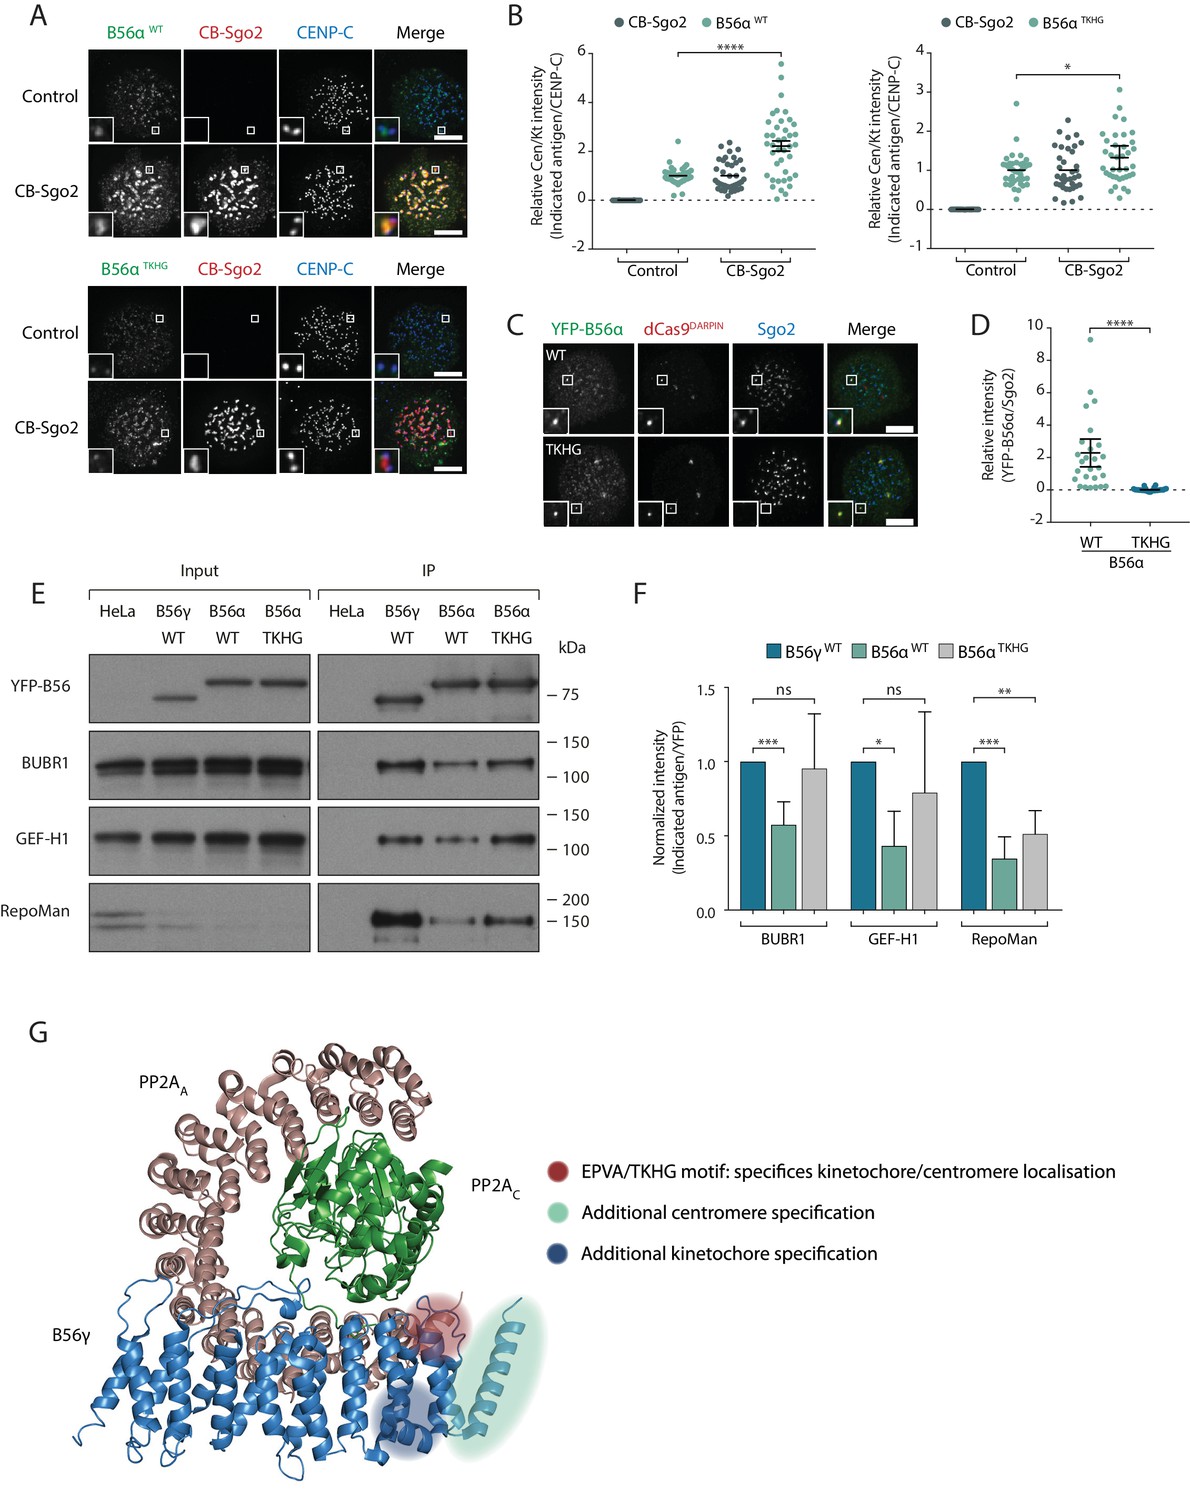
A C-terminal loop in B56 regulates binding to Sgo2 and LxxIxE motifs to specify centromere/kinetochore localisation.
(A-D) Flp-in HeLa cells expressing either YFP-B56α WT or TKHG were transfected with the CB-Sgo2 and analysed for B56 recruitment (A, B) or gChr7 +dCas9 DARPIN to assess YFP-B56α:Sgo2 co-localisation (C, D). Representative images (A, C) and quantification of relative kinetochore intensity (B) or intensity of Sgo2 over B56α at the Chr7 locus (D). For the intensity graphs in B) and D), each dot represents a cell and 10 cells were quantified per experiment from at least 3 independent experiments. The spread of dots indicates the biological variation between individual cells and the errors bars display the variation between experimental repeats (displayed as -/+SD of the experimental means). (E) Immunoblot of the indicated antigens following immunoprecipitation of YFP from nocodazole-arrested Flp-in HeLa cells expressing YFP- B56γ, YFP-B56α WT or YFP-B56α-TKHG. (F) Quantification of the mean normalised intensity (+SD) of indicated antigens in B56α WT or B56α TKHG immunoprecipitates, relative to B56γ, from at least 4 experiments. (G) Crystal structure of PP2A-B56γ [accession code 2NPP (Xu et al., 2006)] with annotation to indicate the regions that specify localisation to centromeres or kinetochores (see Figure 6—figure supplement 1 for details of the additional centromere/kinetochore specification regions). Note, the structure is meant only as a guide because the critical regions may be present within B56α, which has not been structurally solved. The B56α WT values are also used in some of the points plotted in Figure 2m. Asterisks indicate significance (Mann-Whitney test, except Figure 6f: Welch’s t -test, unpaired); ns p>0.05, *p≤0.05, **p≤0.01, ***p≤0.001, ****p≤0.0001. Scale bars, 5µm.
Figure 6—figure supplement 1

Additional residues from B56α are required to switch the localisation of B56γ.
(A) Schematic, representative images and line plot analysis of B56γ and B56γ EPVA localisation in nocodazole-arrested Flp-in HeLa cells. (B) Schematic, representative images and line plot analysis of additional B56γ-α chimaeras to define the extra regions in B56α needed to fully switch B56γ from kinetochores to centromeres. Each graph represents the mean intensities (±SD) from at least 2 independent experiments. 5 kinetochore pairs were analysed per cell, for a total of 10 cells per experiment. Intensity is normalized to the maximum signal in each channel in each experiment. Scale bars, 5µm.
Figure 6—figure supplement 2
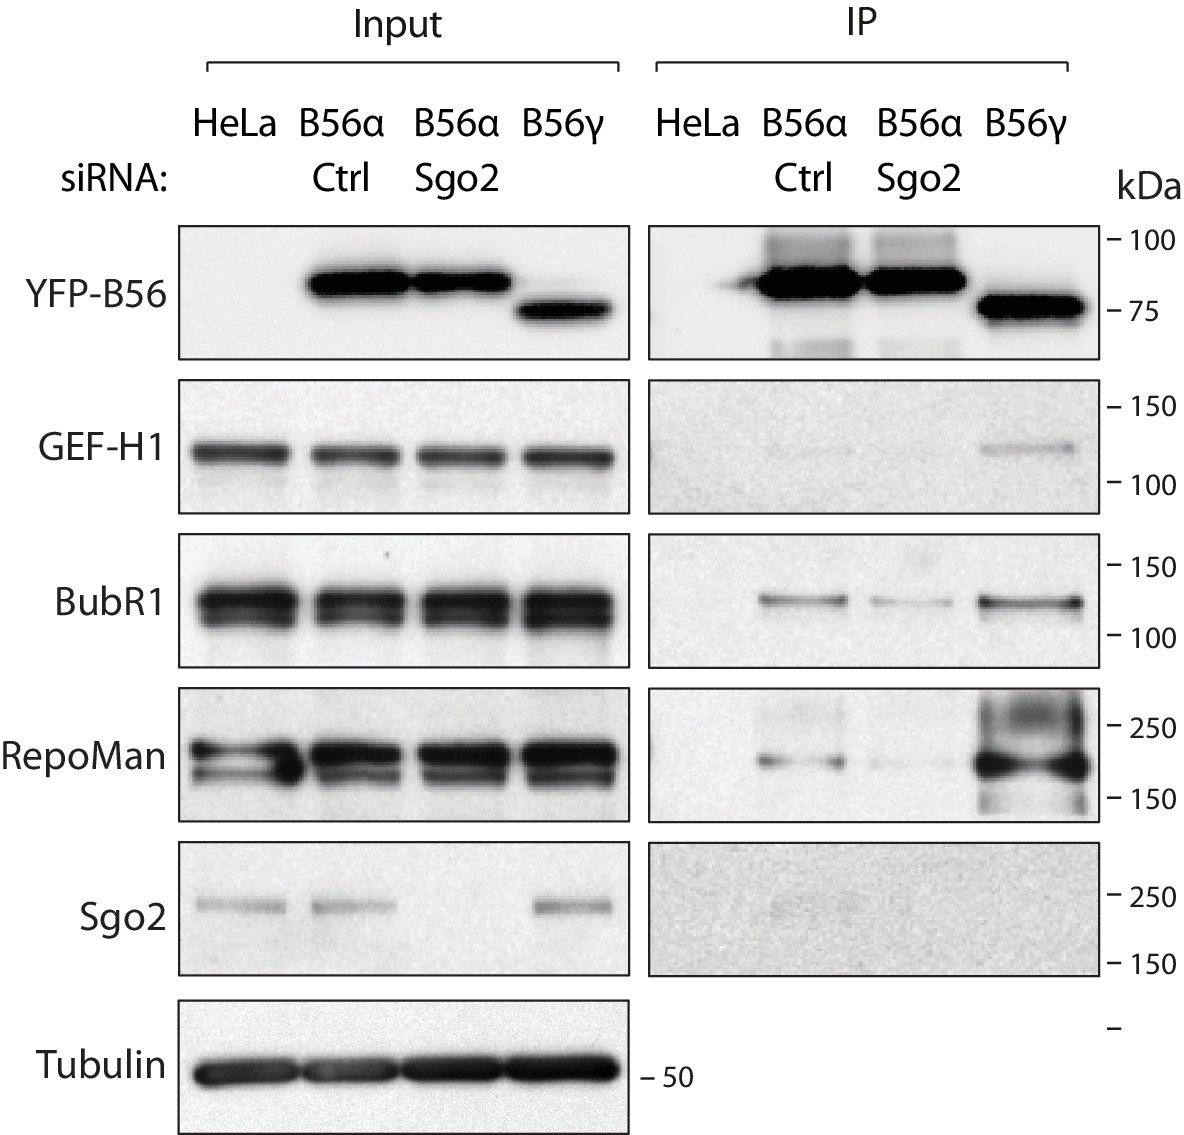
Sgo2 depletion does not enhance the ability of B56α to bind BubR1 or LxxIxE motifs.
Immunoblot of LxxIxE containing proteins (GEF-H1, BubR1 and RepoMan) following YFP immunoprecipitation from nocodazole-arrested Flp-in HeLa cells expressing YFP-B56α or YFP-B56γ and subjected to control or Sgo2 siRNA, as indicated.
Author response image 1
Tables
Key resources table
| Reagent type or resource | Designation | Source or reference | Identifiers | Additional information |
|---|---|---|---|---|
| Cell line (H.sapiens) | HeLa Flp-in | Tighe et al. (2008) | ||
| Recombinant DNA reagent | pcDNA5-YFP-B56 α, β, γ1, γ3, δ and ε. | This paper | B56 from pCEP-4xHA-B56 (Addgene 14532–14537) cloned into pcDNA5-LAP-BubR1WT (Nijenhuis et al., 2014), Not1-Apa1 sites. | |
| Recombinant DNA reagent | pcDNA5-YFP-B56α−(TKHG) | This paper | Site-directed mutagenesis of pcDNA5-YFP-B56α: E405T, P409K, V412H, A413G | |
| Recombinant DNA reagent | pcDNA5-YFP-B56α-(γ4) | This paper | See Figure 5—figure supplement 1 | |
| Recombinant DNA reagent | pcDNA5-YFP-B56γ-H187A | This paper | Site-directed mutagenesis of pcDNA5-YFP-B56γ | |
| Recombinant DNA reagent | pcDNA5-YFP-B56γ-ΔSgo1 | This paper | Site-directed mutagenesis of pcDNA5-YFP-B56γ: Y391F, L394S, M398Q. | |
| Recombinant DNA reagent | pcDNA5-YFP-B56γ-H187A-ΔSgo1 | This paper | Site-directed mutagenesis of pcDNA5-YFP-B56γ-H187A: Y391F, L394S, M398Q. | |
| Recombinant DNA reagent | pcDNA5-YFP-B56γ-(α4) | This paper | See Figure 5—figure supplement 1 | |
| Recombinant DNA reagent | pcDNA5-YFP-B56γ-(α4.1) | This paper | See Figure 6—figure supplement 1 | |
| Recombinant DNA reagent | pcDNA5-YFP-B56γ-(α4.2) | This paper | See Figure 6—figure supplement 1 | |
| Recombinant DNA reagent | pcDNA5-YFP-B56γ-(α4.3) | This paper | See Figure 6—figure supplement 1 | |
| Recombinant DNA reagent | pcDNA5-YFP-B56γ−(EPVA) | This paper | Site-directed mutagenesis of pcDNA5-YFP-B56γ: T631E, K635P, H638V, G639A. | |
| Recombinant DNA reagent | pcDNA5-YFP-B56-Ch1 | This paper | See Figure 5. | |
| Recombinant DNA reagent | pcDNA5-YFP-B56-Ch2 | This paper | See Figure 5. | |
| Recombinant DNA reagent | pcDNA5-YFP-B56-Ch3 | This paper | See Figure 5. | |
| Recombinant DNA reagent | pcDNA5-YFP-B56-Ch4 | This paper | See Figure 5. | |
| Recombinant DNA reagent | pcDNA5-YFP-B56-Ch4a | This paper | See Figure 5. | |
| Recombinant DNA reagent | pcDNA5-YFP-B56-Ch4b | This paper | See Figure 5. | |
| Recombinant DNA reagent | pcDNA5-YFP-B56-Ch4c | This paper | See Figure 5. | |
| Recombinant DNA reagent | pcDNA5-YFP-B56-Ch4d | This paper | See Figure 5. | |
| Recombinant DNA reagent | pcDNA5-vsv-CENP- B-Sgo2-mCherry | This paper | PCR Sgo2 from pDONR-Sgo2 (gift T.J.Yen) into pcDNA5-vsv- CENP-B-Sgo1-mCherry | |
| Recombinant DNA reagent | pcDNA5-vsv-CENP-B- Sgo1-mCherry | Meppelink et al. (2015) | ||
| Recombinant DNA reagent | pHAGE-TO-dCas9- DARPIN-flag | This paper | Progenitor plasmid: pHAGE-TO- dCas9-3xmCherry (Addgene 64108). 3xmCherry replaced with synthesised DARPIN-Flag (Brauchle et al., 2014). | |
| Sequence-based reagent | gRNA targeting a repetetive region on chromosome 7 | Chen et al. (2016) | GCTCTTATGGTGAGAGTGT | |
| Sequence-based reagent | B56 Knockin gRNAs | This paper | B56a: gatgtcgtcgtcgtcgccgccgg. B56g: gtcaacatctagacttcagcggg | |
| Sequence-based reagent | siRNAs | Foley et al. (2011) | B56α (PPP2R5A), 5’-UGAAUGAACUGGUUGAGUA-3’; B56β (PPP2R5B), 5’-GAACAAUGAGUAUAUCCUA-3’; B56γ (PPP2R5C), 5’-GGAAGAUGAACCAACGUUA-3’; B56δ (PPP2R5D), 5’-UGACUGAGCCGGUAAUUGU-3’; B56ε (PPP2R5E), 5’-GCACAGCUGGCAUAUUGUA-3’; | |
| Sequence-based reagent | siRNAs | Kitajima et al. (2006) | Sgo2, 5’-GCACUACCACUUUGAAUAA-3’; | |
| Sequence-based reagent | siRNAs | Dharmacon, J-015475–12 | Sgo1, 5’-GAUGACAGCUCCAGAAAUU-3’; | |
| Sequence-based reagent | siRNAs | Nijenhuis et al. (2014) | BubR1, 5’-AGAUCCUGGCUAACUGUUC-3’ | |
| Sequence-based reagent | siRNAs | Vleugel et al. (2013) | Knl1, 5’-GCAUGUAUCUCUUAAGGAA-3’; Bub1 5’-GAAUGUAAGCGUUCACGAA-3’; | |
| Sequence-based reagent | siRNAs | Dharmacon (D-001830) | Control (GAPDH), 5’-GUCAACGGAUUUGGUCGUA-3’ | |
| Antibody | Mouse monoclonal anti-GFP (clone 4E12/8) | Peter Parker, Francis Crick Institute | 1:1000 | |
| Antibody | Chicken polyclonal anti-GFP | Abcam | Abcam: ab13970, RRID:AB_300798 | 1:5000 |
| Antibody | Mouse monoclonal anti-Sgo1 (clone 3C11) | Abnova | Abnova: H001516480M01 | 1:1000 |
| Antibody | Rabbit polyclonal anti-Sgo2 | Bethyl | Bethyl: A301-262A, RRID:AB_890650 | 1:1000 |
| Antibody | Mouse monoclonal anti-BubR1 (clone 8G1) | EMD Millipore | EMD Millipore: 05–898, RRID:AB_417374 | 1:1000 |
| Antibody | Mouse monoclonal anti-VSV (clone P5D4) | Sigma | Sigma: V5507, RRID:AB_261877 | 1:1000 |
| Antibody | Rabbit polyclonal anti-Knl1 | Abcam | Abcam: ab70537, RRID:AB_1209410 | 1:1000 |
| Antibody | Rabbit polyclonal anti-Bub1 | Bethyl | Bethy;l: A300-373A, RRID:AB_2065943 | 1:1000 |
| Antibody | Mouse monoclonal anti-FLAG (clone M2) | Sigma | Sigma: F3165, RRID:AB_259529 | 1:10000 |
| Antibody | Guinea Pig polyclonal anti-Cenp-C | MBL | MBL: PD030 | 1:5000 |
| Antibody | Rabbit polyclonal anti-pMELT-Knl1 (phospho-T943 and - T1155) | Nijenhuis et al. (2014) | 1:1000 | |
| Antibody | Rabbit polyclonal anti-GFP | Geert Kops, Hubrecht Institute | 1:5000 | |
| Antibody | Mouse monoclonal anti-B56γ (clone A-11) | Santa Cruz Biotechnology | Santa Cruz Biotechnology: sc-374379, RRID:AB_10988028 | 1:1000 |
| Antibody | Mouse monoclonal anti-B56α (clone 23) | BD Biosciences | BD Biosciences: 610615, RRID:AB_397947 | 1:1000 |
| Antibody | Mouse monoclonal anti-B56δ (clone H-11) | Santa Cruz Biotechnology | Santa Cruz Biotechnology: sc-271363, RRID:AB_10611062 | 1:1000 |
| Antibody | Rabbit polyclonal anti-B56ε | Aviva | Aviva: ARP56694-P50 | 1:1000 |
| Antibody | Mouse monoclonal anti-PPP2CA (clone 1D6) | EMD Millipore | EMD Millipore: 05–421, RRID:AB_309726 | 1:5000 |
| Antibody | Rabbit polyclonal anti-PPP2R1A (clone 81G5) | Cell Signaling Technology | Cell Signaling Technology: 2041, RRID:AB_2168121 | 1:1000 |
| Antibody | Rabbit polyclonal anti-BubR1 | Bethyl | Bethyl: A300-386A, RRID:AB_386097 | 1:1000 |
| Antibody | Rabbit polyclonal anti-Axin | Cell Signaling Technology | Cell Signaling Technology: C76H11, RRID:AB_2274550 | 1:1000 |
| Antibody | Rabbit polyclonal anti-GEF-H1 | Abcam | Abcam: ab155785 | 1:1000 |
| Antibody | Rabbit polyclonal anti-Kif4A | Bethyl | Bethyl: A301-074A, RRID:AB_2280904 | 1:1000 |
| Antibody | Rabbit polyclonal anti-Repoman | Sigma | Sigma: HPA030049, RRID:AB_10600862 | 1:1000 |
| Antibody | Rabbit polyclonal anti-Actin | Sigma | Sigma: A2066, RRID:AB_476693 | 1:5000 |
| Antibody | Mouse monoclonal anti-α-Tubulin (clone B-5-1-2) | Sigma | Sigma: T5168, RRID:AB_477579 | 1:5000 |
| Antibody | Alexa-fluor488 anti-mouse | ThermoFisher Scientific | Invitrogen: A11029, RRID:AB_138404 | 1:1000 |
| Antibody | Alexa-fluor488 anti-rabbit | ThermoFisher Scientific | Invitrogen: A11034, RRID:AB_2576217 | 1:1000 |
| Antibody | Alexa-fluor488 anti-chicken | ThermoFisher Scientific | Invitrogen: A11039, RRID:AB_142924 | 1:1000 |
| Antibody | Alexa-fluor488 anti-guinea pig | ThermoFisher Scientific | Invitrogen: A11073, RRID:AB_142018 | 1:1000 |
| Antibody | Alexa-fluor568 anti-mouse | ThermoFisher Scientific | Invitrogen: A11031, RRID:AB_144696 | 1:1000 |
| Antibody | Alexa-fluor568 anti-rabbit | ThermoFisher Scientific | Invitrogen: A11036, RRID:AB_10563566 | 1:1000 |
| Antibody | Alexa-fluor647 anti-guinea pig | ThermoFisher Scientific | Invitrogen: A21450, RRID:AB_141882 | 1:1000 |
| Antibody | HRP-anti-mouse | Bio-Rad | Bio-Rad: 170–6516, RRID:AB_11125547 | 1:2000 |
| Antibody | HRP-anti-rabbit | Bio-Rad | Bio-Rad: 170–6515, RRID:AB_11125142 | 1:5000 |
| Chemical compound, drug | AZ-3146 | Selleckchem | Selleckchem: S2731 | |
| Chemical compound, drug | Calyculin A | LC labs | LC labs: C-3987 | |
| Chemical compound, drug | 4,6-diamidino-2- phenylindole (DAPI) | Sigma | Roche: 10236276001 | |
| Chemical compound, drug | Dulbecco's Modified Eagle Medium (DMEM) | ThermoFisher Scientific | Gibco: 41966029 | |
| Chemical compound, drug | Doxycycline hyclate | Sigma | Sigma: D9891 | |
| Chemical compound, drug | Fetal Bovine Serum | ThermoFisher Scientific | Life Technologies: 10270106 | |
| Chemical compound, drug | GFP-Trap magnetic beads | Chromotek | Chromotek: GTMA-20 | |
| Chemical compound, drug | Hygromycin B | Santa Cruz Biotechnology | Santa Cruz Biotechnology: sc-29067 | |
| Chemical compound, drug | Lipofectamine RNAiMax | ThermoFisher Scientific | Invitrogen: 13778150 | |
| Chemical compound, drug | Nocodazole | EMD Millipore | EMD Millipore: 487928 | |
| Chemical compound, drug | MG132 | Selleckcem | Selleckchem: S2619 | |
| Chemical compound, drug | Opti-MEM reduced serum medium | ThermoFisher Scientific | Gibco: 31985–047 | |
| Chemical compound, drug | penicillin/streptomycin | ThermoFisher Scientific | Gibco: 15070–063 | |
| Chemical compound, drug | RO-3306 | Tocris | Tocris: 4181 | |
| Chemical compound, drug | Thymidine | Sigma | Sigma: T1895 | |
| Software, algorithm | Kinetochore quantification macro | Saurin et al. (2011) | Software, | |
| Algorithm | Multicolor Line plot quantification macro | Kees Straatman (University of Leicester) with modification by Balaji Ramalingam (University of Dundee) | ||
| Software, algorithm | Quantification of immunoblots | Image Studio Lite (LI-COR Biosciences) | ||
| Software, algorithm | Microscopy image processing | Softworx software, GE Healthcare | ||
| Software, algorithm | Microscopy image processing | ImageJ, National Institutes of Health |
Additional files
-
Source data 1
The raw data and statistical values from all the individual experiments that are expressed in graphical format.
This files contains the raw data and statistical values from all the graphs displayed in Figures 1–6; Figure 1—figure supplements 2, 4 and 5; Figure 2—figure supplement 1; Figure 3—figure supplement 2; Figure 5—figure supplements 1 and 2; Figure 6—figure supplement 1.
- https://doi.org/10.7554/eLife.42619.021
-
Transparent reporting form
- https://doi.org/10.7554/eLife.42619.022
Download links
A two-part list of links to download the article, or parts of the article, in various formats.
Downloads (link to download the article as PDF)
Open citations (links to open the citations from this article in various online reference manager services)
Cite this article (links to download the citations from this article in formats compatible with various reference manager tools)
Division of labour between PP2A-B56 isoforms at the centromere and kinetochore
eLife 8:e42619.
https://doi.org/10.7554/eLife.42619


