Arterial smooth muscle cell PKD2 (TRPP1) channels regulate systemic blood pressure
- University of Tennessee Health Science Center, United States
Figures
Figure 1 with 3 supplements
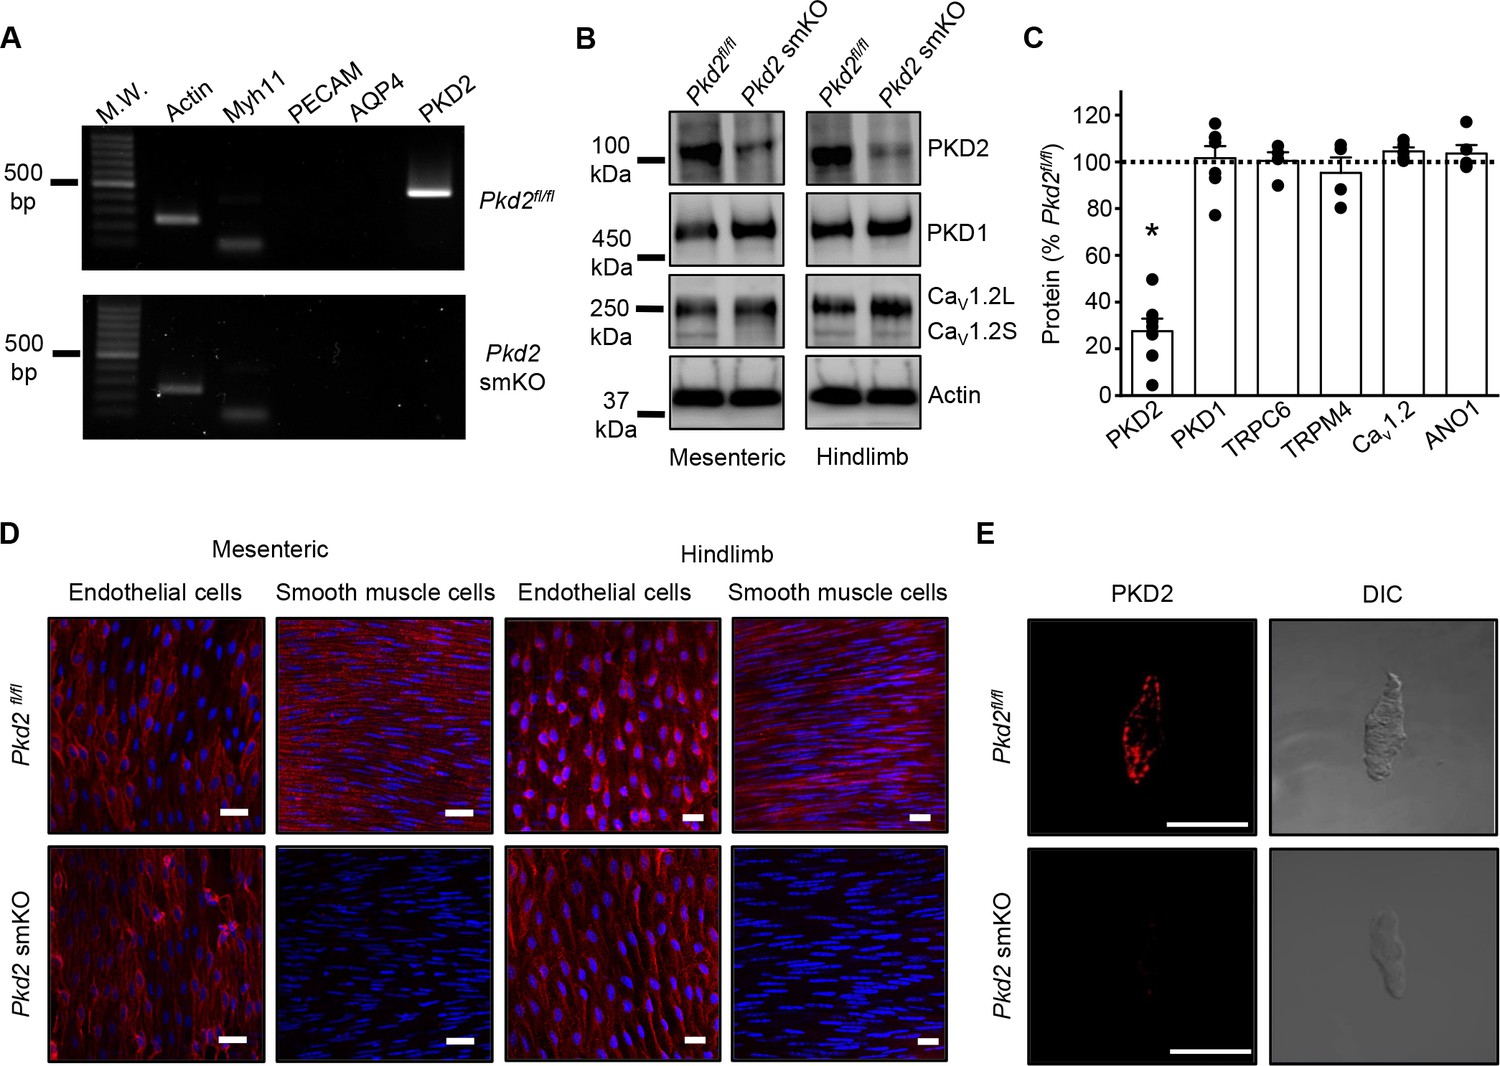
Activation of Cre recombinase abolishes PKD2 in arterial myocytes of Pkd2fl/fl:myh11cre/ERT2 mice.
(A) RT-PCR showing the absence of PKD2 transcript in isolated myocytes from tamoxifen-treated Pkd2fl/fl:myh11-cre/ERT2 mice. (B) Western blots illustrating the effect of tamoxifen-treatment in Pkd2fl/fl and Pkd2fl/fl:myh11-cre/ERT2 mice on PKD2, CaV1.2L (full-length CaV1.2) and CaV1.2S (short CaV1.2) proteins in mesenteric and hindlimb arteries. (C) Mean data for proteins in mesenteric arteries of tamoxifen-treated Pkd2fl/fl:myh11-cre/ERT2 mice when compared to those in tamoxifen-treated Pkd2fl/fl mice. n = 4–7. * indicates p<0.05 versus Pkd2fl/fl. (D) En-face immunofluorescence imaging illustrating that PKD2 protein (red, Alexa Fluor 555) is abolished in myocytes of mesenteric and hindlimb arteries in tamoxifen-treated Pkd2fl/fl:myh11-cre/ERT2 mice (representative of 6 mesenteric and six hindlimb arteries). In contrast, PKD2 protein in endothelial cells is unaltered. Nuclear staining (DAPI) is also shown. Scale bars = 20 µm. (E) Confocal and DIC images illustrating that PKD2 protein (Alexa Fluor 555) is abolished in isolated mesenteric artery myocytes of tamoxifen-treated Pkd2fl/fl:myh11-cre/ERT2 mice (representative data from 5 Pkd2fl/fl and 5 Pkd2fl/fl:myh11-cre/ERT2 mice). Scale bars = 10 µm.
Figure 1—figure supplement 1
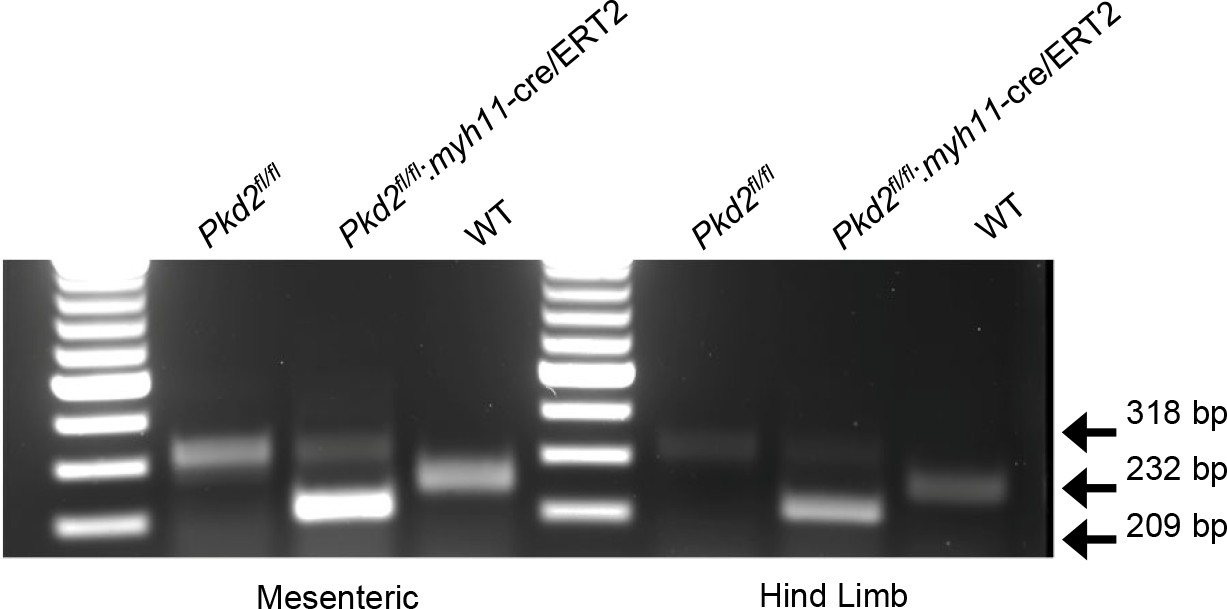
Genotyping of mouse lines.
Ethidium bromide gel illustrating PCR products in vasculature of C57BL/6J (WT) mice and tamoxifen-treated Pkd2fl/fl and Pkd2fl/fl:myh11cre/ERT2 mice.
Figure 1—figure supplement 2
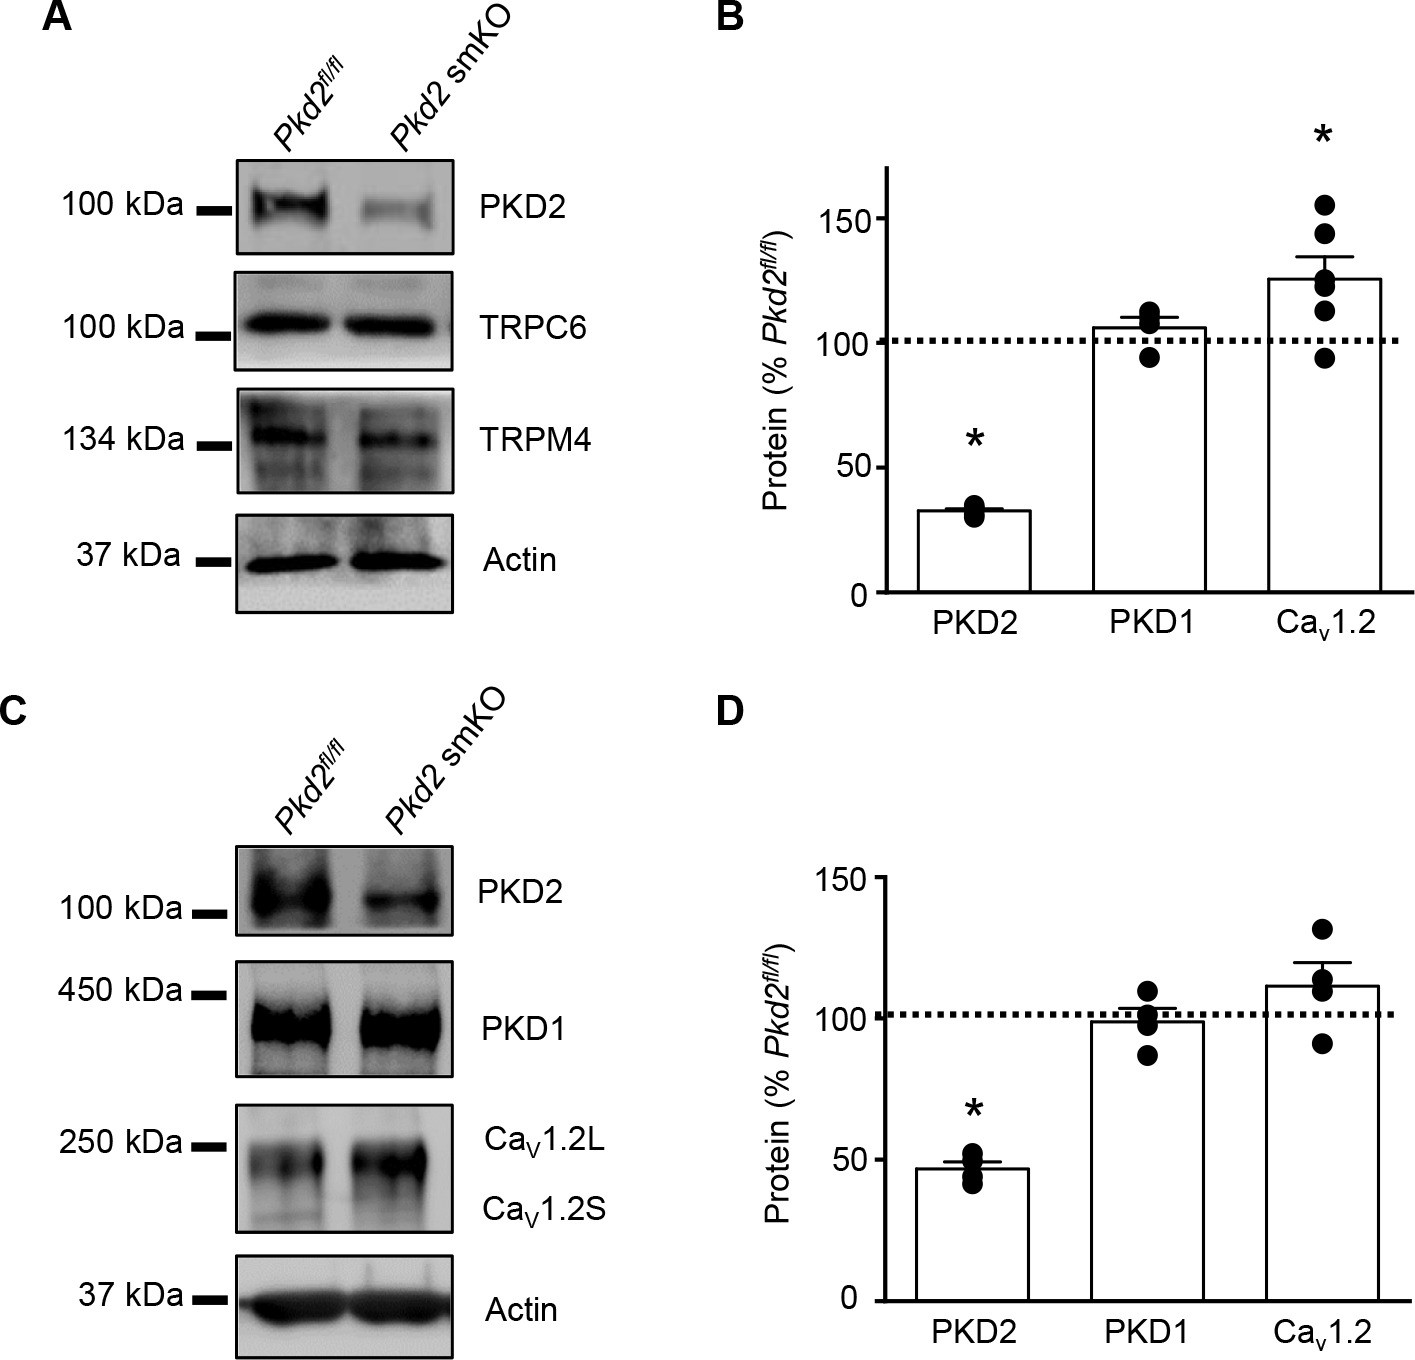
PKD2 protein is lower in aorta and mesenteric and hindlimb arteries from tamoxifen-treated Pkd2fl/fl:myh11-cre/ERT2 mice.
(A) Western blots illustrating PKD2 protein was lower in mesenteric arteries of tamoxifen-treated Pkd2fl/fl:myh11-cre/ERT2 mice, whereas other proteins were similar. (B) Mean data for proteins in hindlimb arteries of Pkd2 smKO mice (n = 4–6). (C) Western blots of proteins in aorta. Cav1.2L, full-length Cav1.2; Cav1.2S, short Cav1.2. (D) Mean data from aorta (n = 4). * indicates p<0.05 versus Pkd2fl/fl.
Figure 1—figure supplement 3
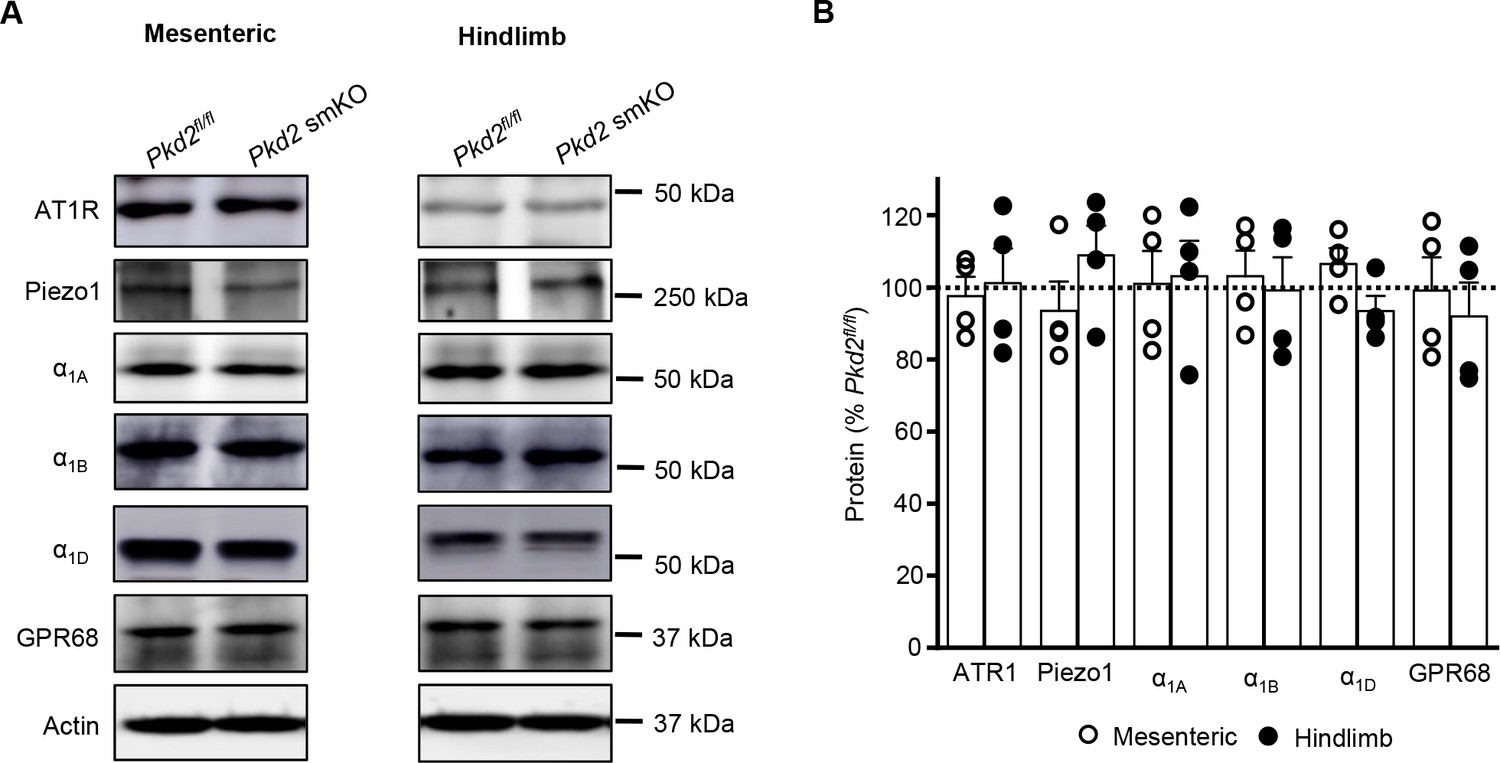
Several proteins that regulate arterial contractility are unchanged in tamoxifen-treated Pkd2fl/fl:myh11-cre/ERT2 mice.
(A) Western blots illustrating Angiotensin II type one receptor (AT1R), Piezo1, α1-adrenergic receptor A (α1A), α1-adrenergic receptor B (α1B), α1-adrenergic receptor D (α1D) and G protein-coupled receptor 68 (GPR68) protein levels in mesenteric and hindlimb arteries of Pkd2fl/fland Pkd2fl/fl:myh11-cre/ERT2 mice. (B) Mean data from mesenteric and hindlimb arteries (n = 4 per group).
Figure 2 with 1 supplement

Pkd2 smKO mice are hypotensive with normal cardiac function and renal histology.
(A) Original telemetric blood pressure recordings from Pkd2 smKO and Pkd2fl/fl mice. (B) Mean systolic and diastolic blood pressures in Pkd2fl/fl (n = 11) and Pkd2 smKO (n = 12) mice. * indicates p<0.05 versus Pkd2fl/fl. (C) Mean arterial blood pressures (MAP) in Pkd2fl/fl (n = 11) and Pkd2 smKO (n = 12) mice during day and night (gray) cycles. ZT: Zeitgeber Time. * indicates p<0.05 versus Pkd2fl/fl for all data points. (D) Mean echocardiography data. Cardiac output (CO), fractional shortening (FS), ejection fraction (EF) and heart rate (HR). (Pkd2fl/fl, n = 5; Pkd2 smKO mice, n = 4). (E) Representative images of H and E stained kidney cortex used for histological assessment (n = 3 mice used for for each group).
Figure 2—figure supplement 1
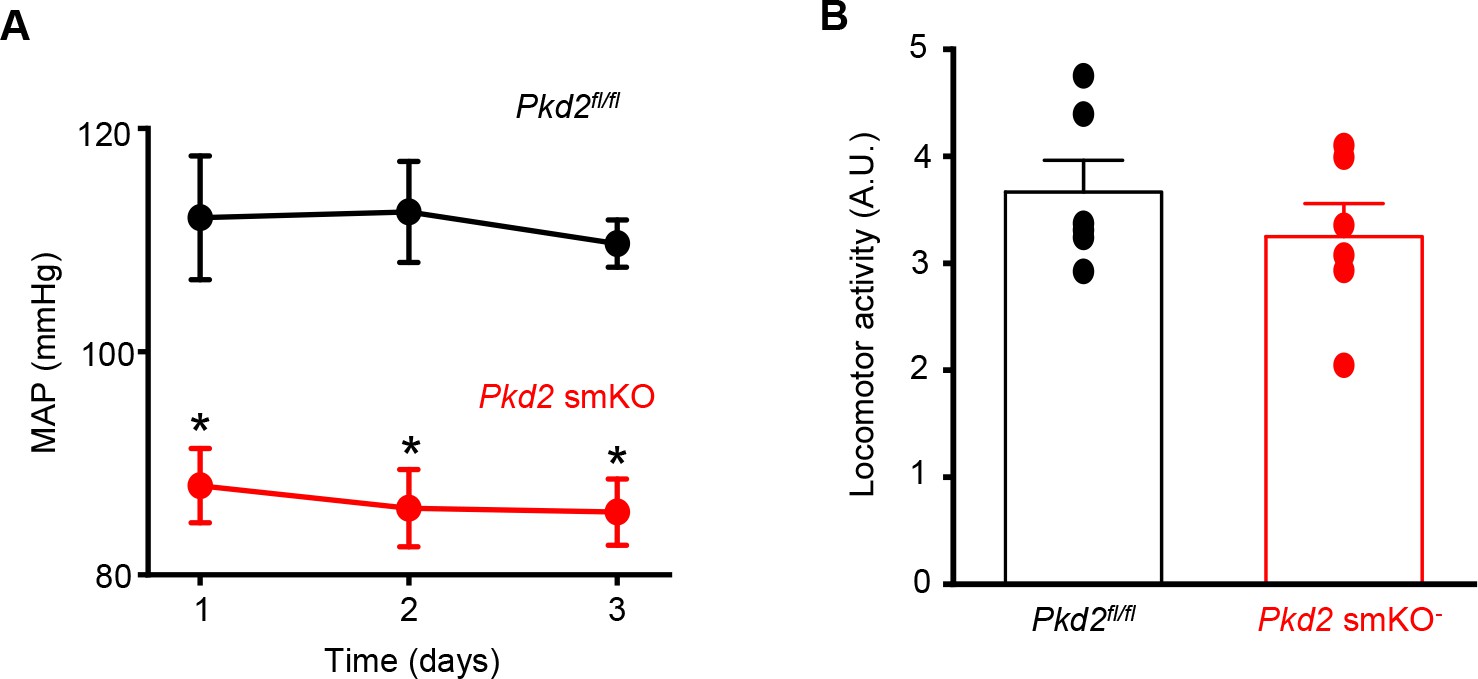
Lower blood pressure is sustained in Pkd2 smKO mice.
(A) Mean arterial blood pressure (MAP) in Pkd2 smKO and Pkd2fl/fl mice (n = 6 per group). * indicates p<0.05 versus Pkd2fl/fl. (B) Mean data of locomotor activity, n = 6 per group.
Figure 3 with 1 supplement
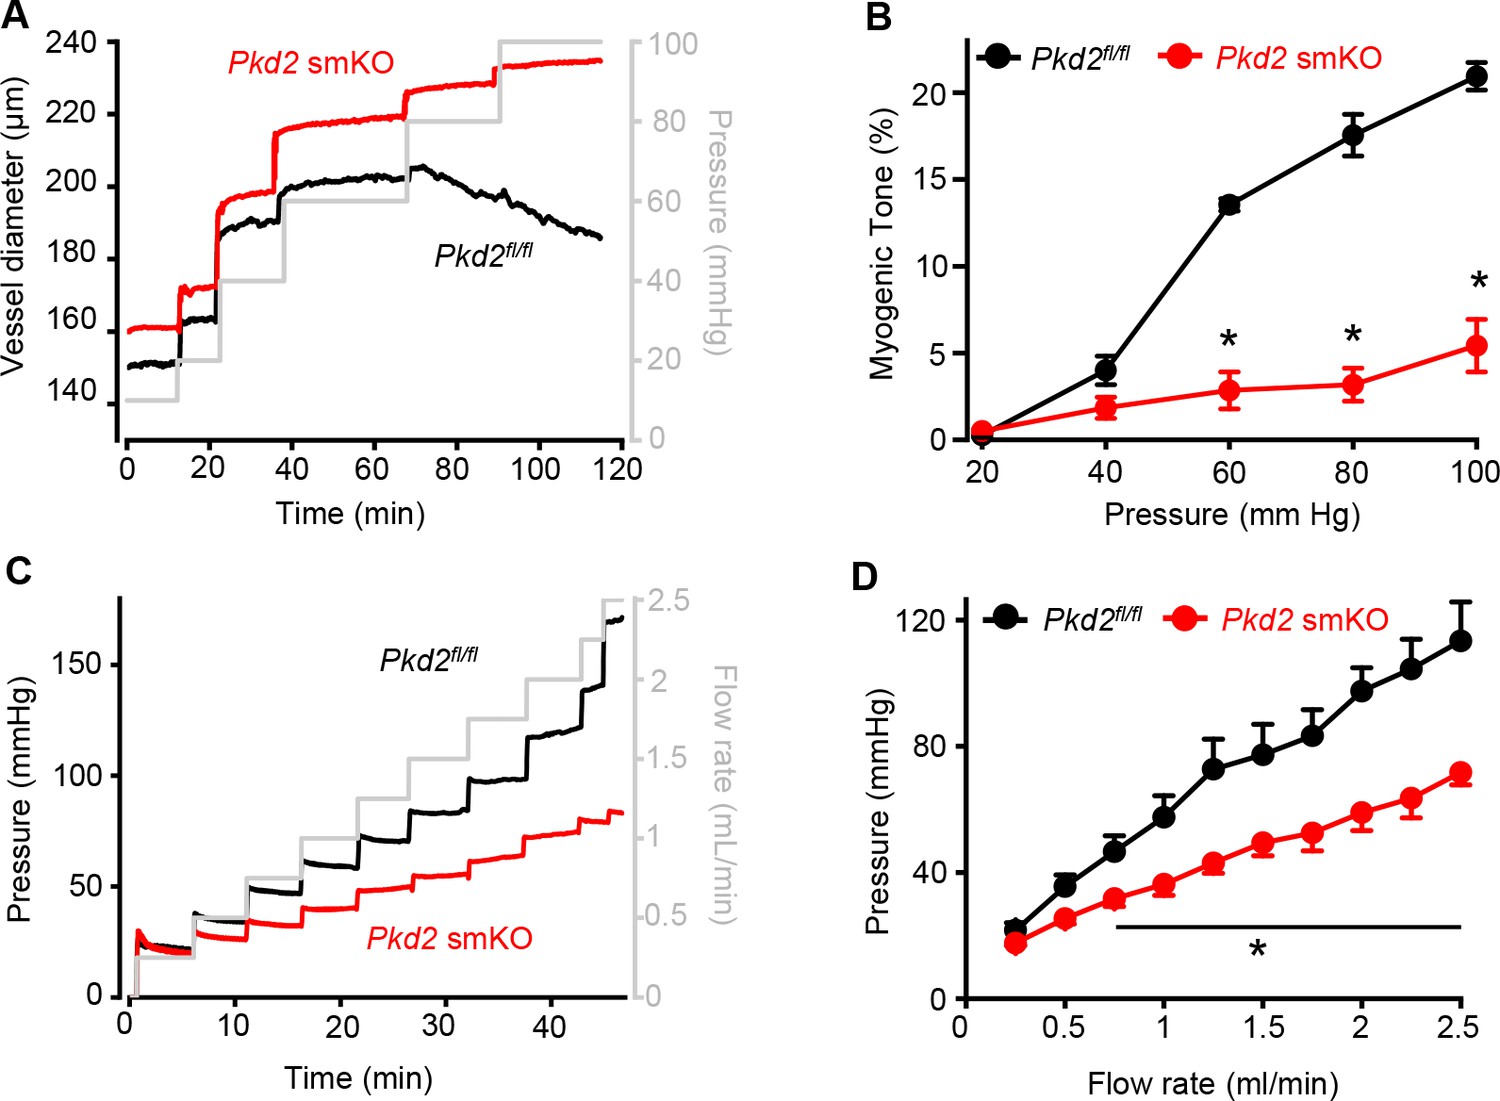
Pressure-induced vasoconstriction is attenuated in Pkd2 smKO mouse hindlimb arteries.
(A) Representative traces illustrating diameter responses to intravascular pressure in gastrocnemius arteries of Pkd2fl/fl and Pkd2 smKO mice. (B) Mean data for myogenic tone in gastrocnemius arteries (Pkd2fl/fl, n = 5; Pkd2 smKO, n = 6). * indicates p<0.05 versus Pkd2fl/fl. (C) Representative traces illustrating hindlimb perfusion pressure in response to increasing flow. (D): Mean data for hindlimb perfusion pressure (Pkd2fl/fl, n = 6; Pkd2 smKO, n = 4). * indicates p<0.05 versus Pkd2fl/fl.
Figure 3—figure supplement 1
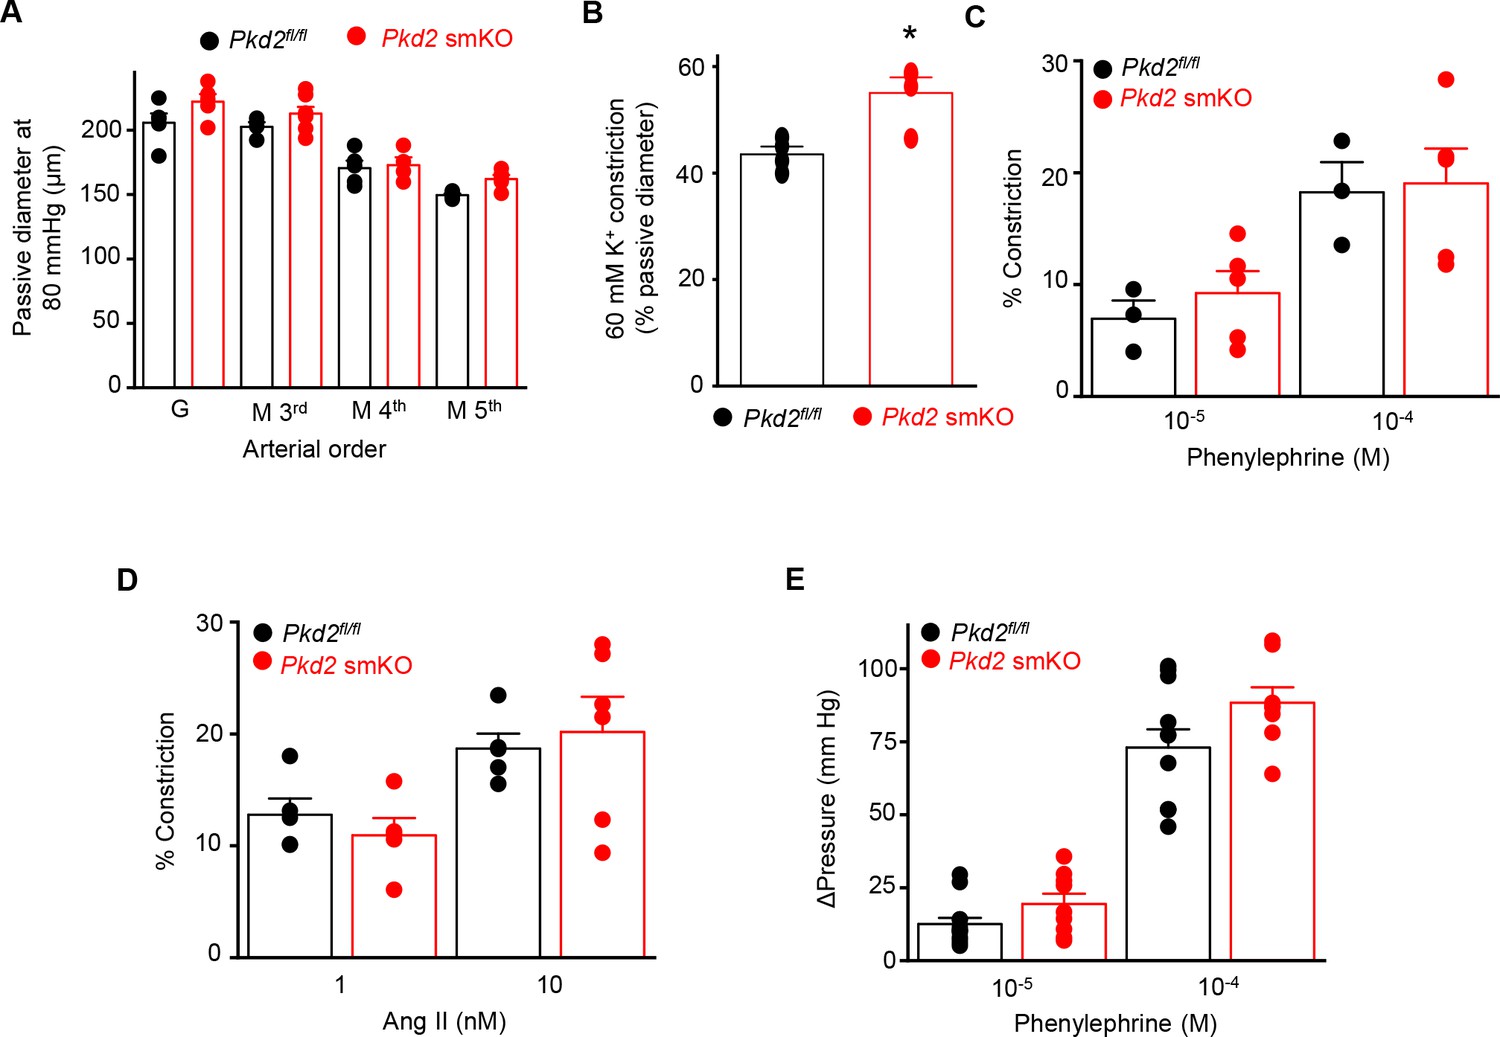
Myocyte PKD2 knockout does not alter phenylephrine or angiotensin II-induced vasoconstriction in hindlimb arteries.
(A) Mean passive diameter at 80 mmHg of first-order gastrocnemius arteries (G) and third-, fourth-and fifth-order mesenteric arteries (M) (Pkd2fl/fl: G, n = 5; M3rdn = 4; M4thn = 5; M5thn = 5 and Pkd2 smKO: G, n = 5; M3rd n = 7; M4th n = 4; M5th n = 5). (B) Mean data for 60 mM K+-induced constriction in pressurized (100 mmHg) gastrocnemius arteries from Pkd2fl/fl (n = 4) and Pkd2 smKO (n = 4) mice. * indicates p<0.05 versus Pkd2fl/fl. (C) Mean data of phenylephrine-induced constriction in pressurized gastrocnemius arteries (Pkd2fl/fl n = 4, Pkd2 smKO n = 5). (D) Mean data of angiotensin II-induced constriction in gastrocnemius arteries pressurized to 100 mmHg (Pkd2fl/fl, n = 5 and Pkd2 smKO, n = 5–6). (E) Mean data of phenylephrine-induced pressure responses in intact hindlimb (Pkd2fl/fl, n = 11–13 and Pkd2 smKO, n = 8–9).
Figure 4 with 1 supplement
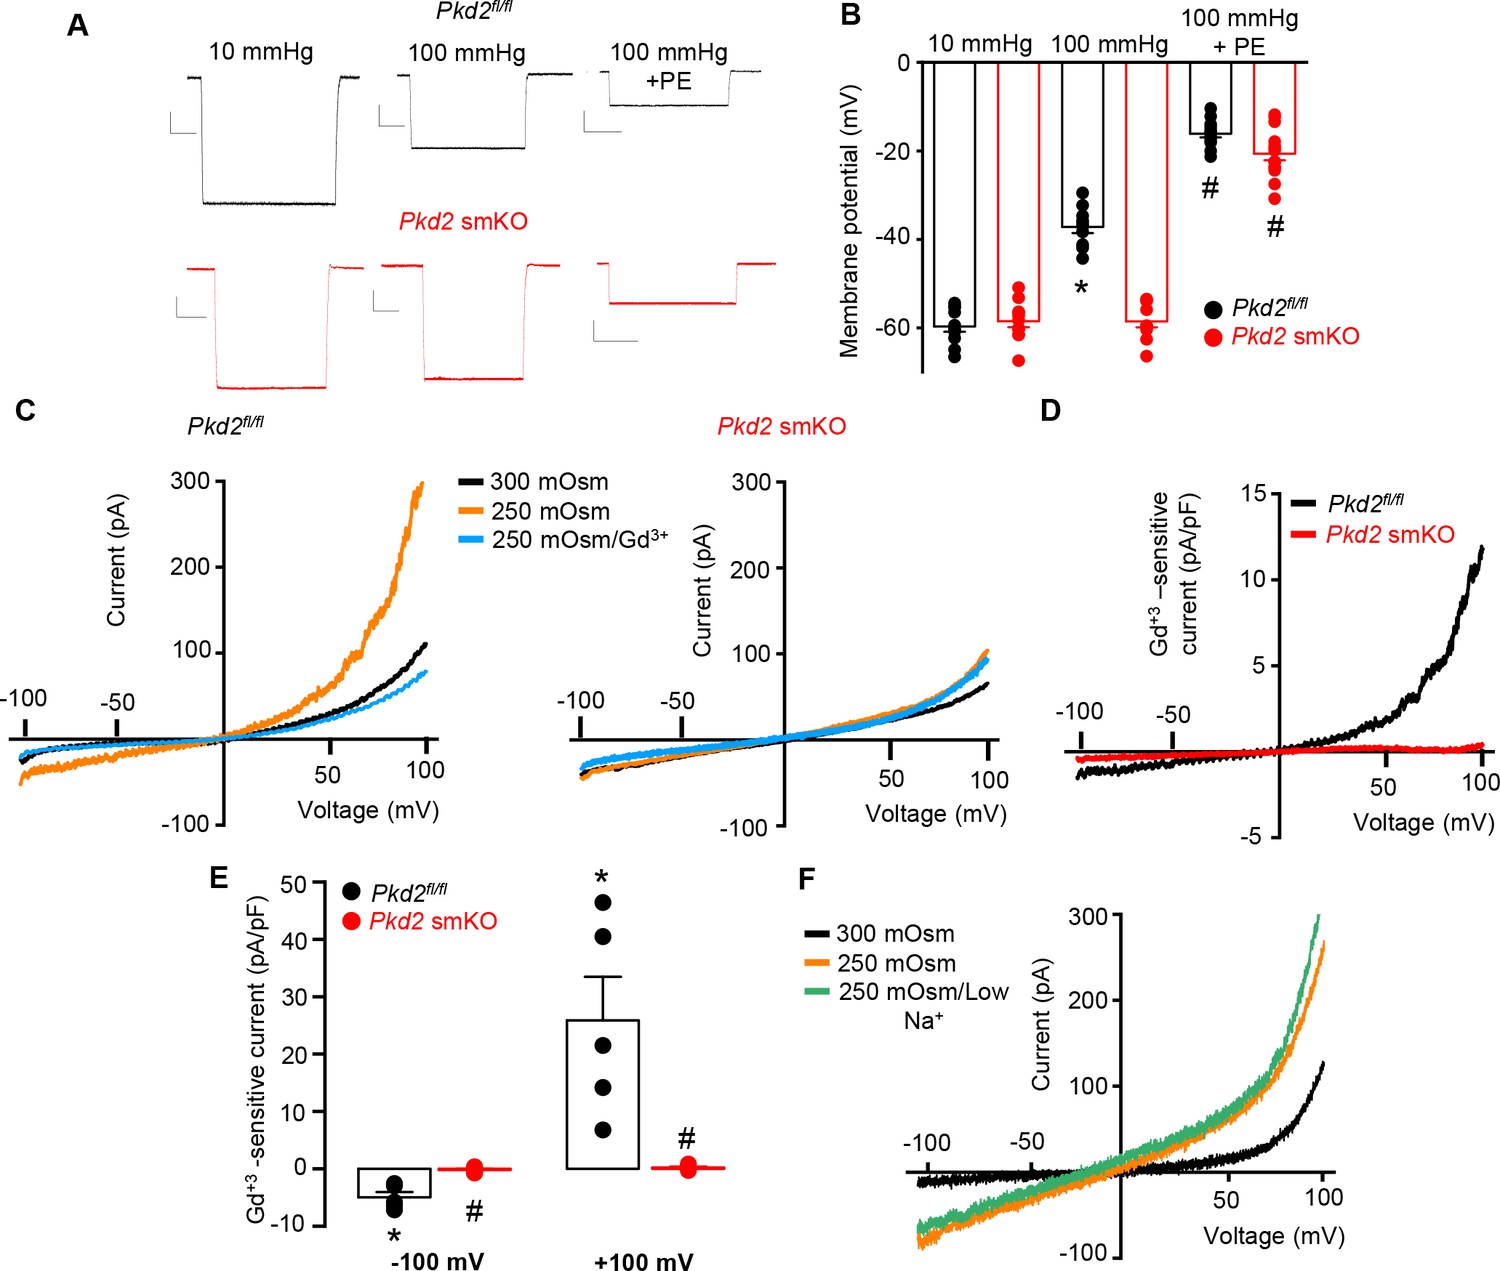
PKD2 channels contribute to pressure-induced hindlimb artery depolarization and swelling-activated Na + currents in hindlimb artery myocytes.
(A) Representative traces of microelectrode impalements under indicated conditions illustrating that pressure-induced depolarization is attenuated in gastrocnemius arteries of Pkd2 smKO mice. Phenylephrine (PE) = 1 µM. Scale bars: Y = 10 mV, X = 20 s. (B) Mean data for membrane potential recordings in pressurized hindlimb arteries in the absence or presence of PE (Pkd2fl/fl: 10 mmHg, n = 11; 100 mmHg, n = 10; 100 mmHg + PE, n = 13 and Pkd2 smKO: 10 mmHg, n = 11; 100 mmHg, n = 10; 100 mmHg + PE, n = 14). * indicates p<0.05 versus 10 mmHg in Pkd2fl/fl. # indicates p<0.05 versus 100 mmHg in the same genotype. (C) Representative ICats recorded between −100 and +100 mV in isotonic (300 mOsm), hypotonic (250 mOsm) and hypotonic bath solution with Gd3+ (100 µM) in the same Pkd2fl/fl and Pkd2 smKO mouse hindlimb artery myocytes. (D) Representative I-V relationships of Gd+3 -sensitive Icats activated by hypotonic solution in Pkd2fl/fl and Pkd2 smKO hindlimb myocytes. (E) Mean data for Gd3+-sensitive ICats recorded in hypotonic solution in Pkd2fl/fl and Pkd2 smKO myocytes (n = 5 for each). * indicates p<0.05 versus 250 mOsm, # p<0.05 versus Pkd2fl/fl. (F) Representative I-V relationships between −100 and +100 mV in isotonic (300 mOsm), hypotonic (250 mOsm) and hypotonic bath solution with low (40 mM) Na+ in the same Pkd2fl/fl mouse hindlimb artery myocyte.
Figure 4—figure supplement 1
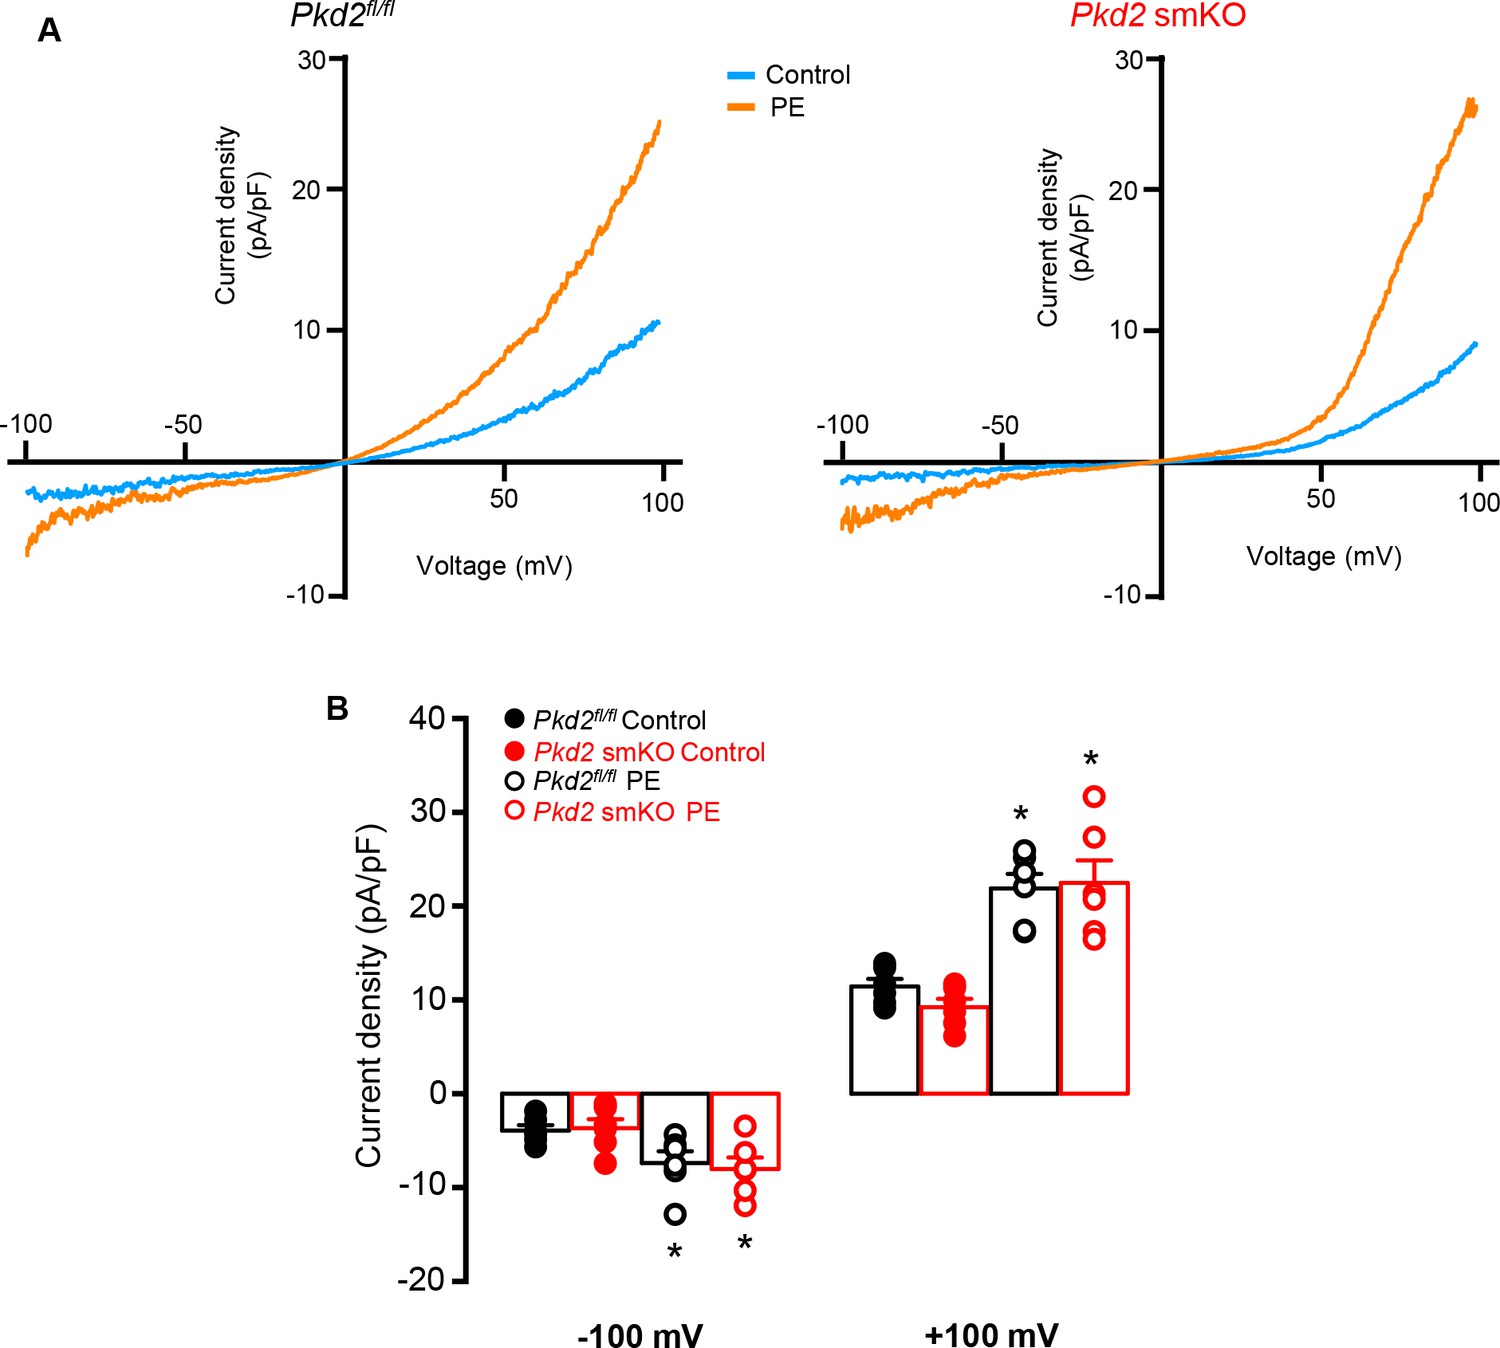
PKD2 knockout does not alter phenylephrine (PE)-activated ICat in isolated hindlimb artery myocytes.
(A) Representative I-V relationships recorded between −100 and +100 mV in the same hindlimb artery myocytes of Pkd2fl/fl or Pkd2 smKO mice in control and PE (10 µM). (B) Mean data for current density at −100 and +100 mV (Pkd2fl/fl, n = 6 and Pkd2 smKO, n = 6). * indicates p<0.05 versus control in the same genotype.
Figure 5 with 1 supplement

Pressure-induced vasoconstriction is unaltered, whereas phenylephrine-induced vasoconstriction is attenuated, in mesenteric arteries of Pkd2 smKO mice.
(A) Mean vasoconstriction over a range of pressures in resistance-size mesenteric arteries from Pkd2fl/fl (n = 7) and Pkd2 smKO (n = 9) mice. (B) Original recordings of concentration-dependent, phenylephrine (PE)-induced contraction in mesenteric artery rings. (C) Mean PE-induced contraction (Pkd2fl/fl, n = 5; Pkd2 smKO, n = 6; *p<0.05 versus Pkd2fl/fl). (D) Representative phenylephrine-induced vasoconstriction in pressurized (80 mmHg) fifth-order mesenteric arteries. (E) Mean PE-induced vasoconstriction in pressurized (80 mmHg) fourth-and fifth-order mesenteric arteries (Pkd2fl/fl, n = 6; Pkd2 smKO, n = 6; *p<0.05 versus Pkd2fl/fl at the same PE concentration).
Figure 5—figure supplement 1
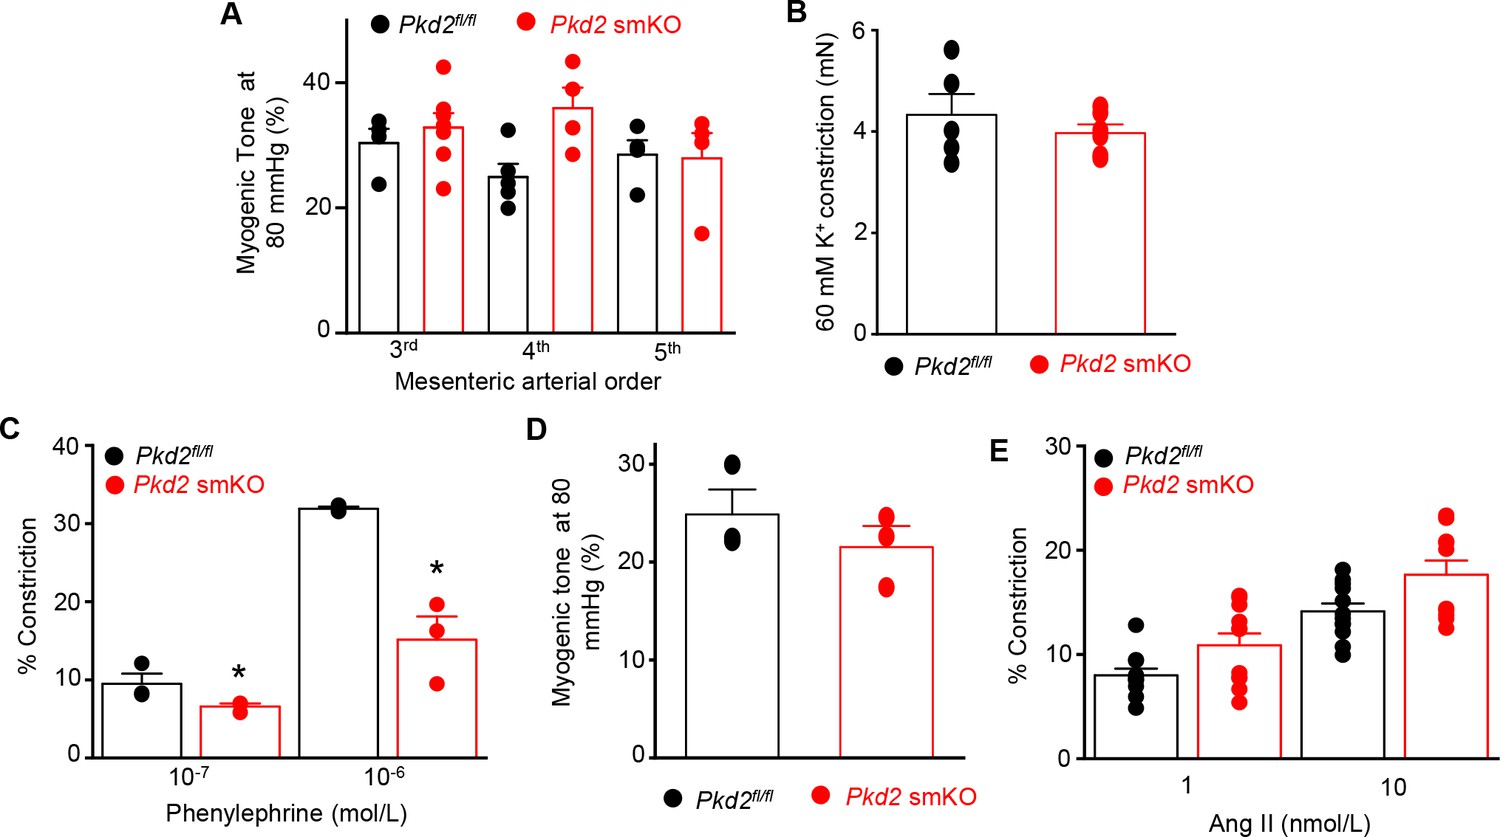
Myocyte PKD2 knockout attenuates phenylephrine-induced vasoconstriction, but does not alter pressure or angiotensin II-induced vasoconstriction in mesenteric arteries.
(A) Mean myogenic tone at 80 mmHg illustrating that myogenic tone is similar in third-, fourth-and fifth-order mesenteric arteries and unaltered by PKD2 knockout (Pkd2fl/fl: 3rd n = 4; 4th n = 5; 5th n = 4 and Pkd2 smKO: 3rd n = 7; 4th n = 4; 5th n = 4). (B) Mean data for 60 mM K+-induced constriction in first-and second order mesenteric artery rings (Pkd2fl/fln = 5; Pkd2 smKO n = 6). (C) Mean data for phenylephrine-induced vasoconstriction in pressurized, endothelium-denuded 4th order mesenteric arteries (Pkd2fl/fl, n = 3 and Pkd2 smKO, n = 3). * indicates p<0.05 versus Pkd2fl/fl. (D) Mean myogenic tone at 80 mmHg in endothelium-denuded 4th order mesenteric arteries (Pkd2fl/fl, n = 3 and Pkd2 smKO, n = 3). (E) Mean data for angiotensin II-induced vasoconstriction in mesenteric arteries (Pkd2fl/fl, n = 11–12 and Pkd2 smKO, n = 10–11).
Figure 6 with 1 supplement
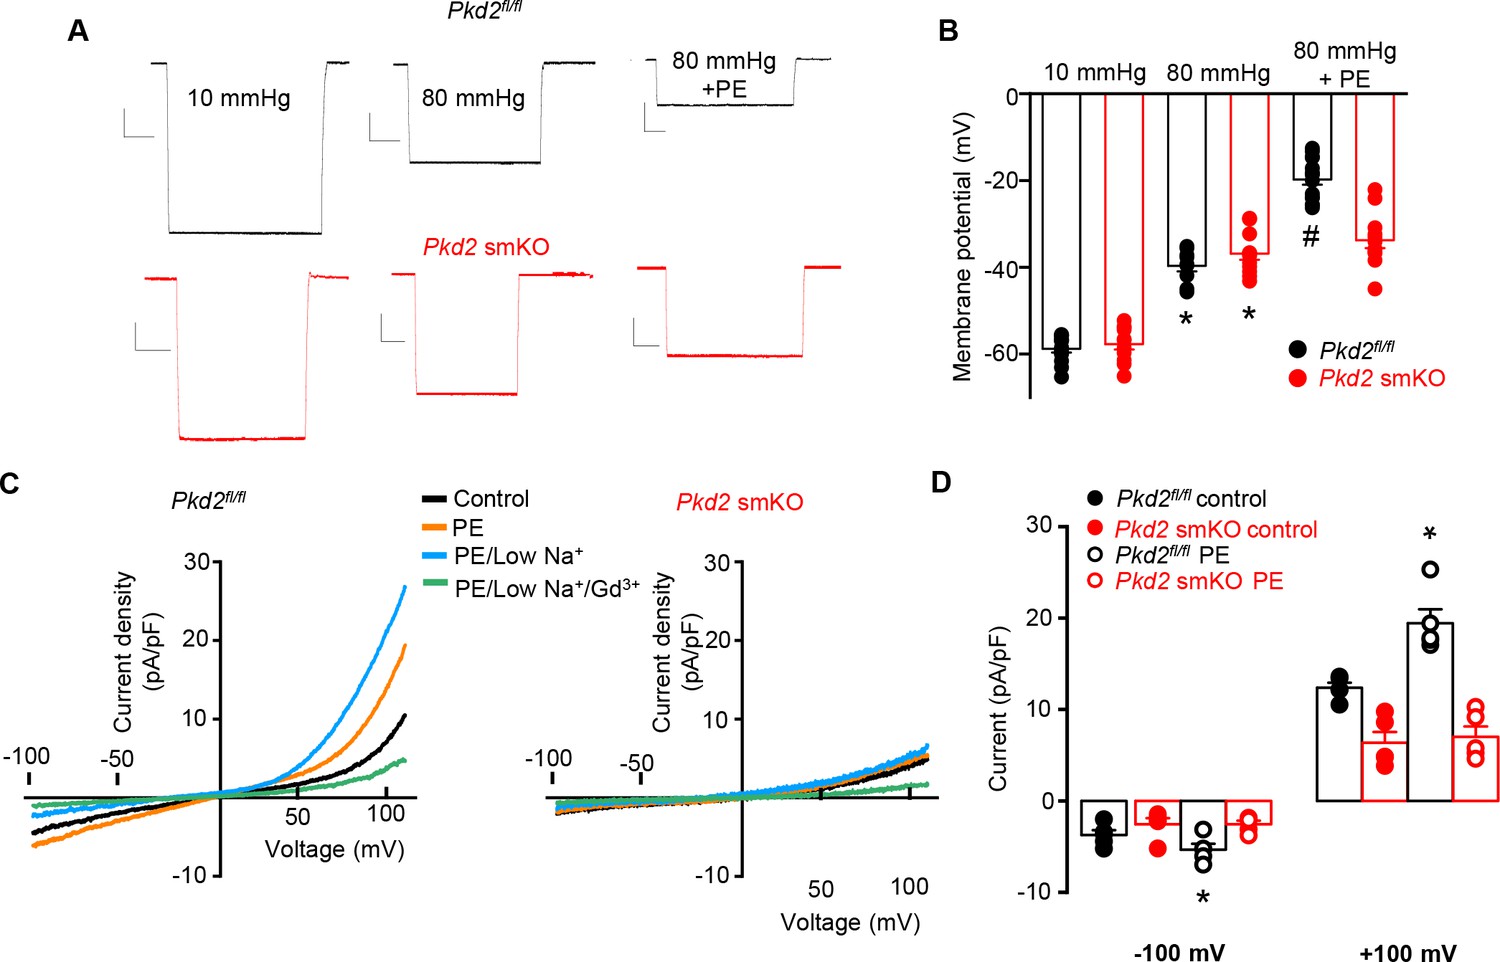
PKD2 channels contribute to phenylephrine-induced mesenteric artery depolarization and INa in mesenteric artery myocytes.
(A) Representative traces of microelectrode impalements illustrating that phenylephrine (PE, 1 µM)-induced depolarization is attenuated in mesenteric arteries of Pkd2 smKO mice. Scale bars: Y = 10 mV, X = 20 s. (B) Mean membrane potential recordings in pressurized (10 and 80 mmHg) mesenteric arteries and in PE at 80 mmHg (Pkd2fl/fl: 10 mmHg, n = 13; 80 mmHg, n = 9; 80 mmHg + PE, n = 15. Pkd2 smKO: 10 mmHg, n = 11; 80 mmHg, n = 12; 80 mmHg + PE, n = 12). *p<0.05 versus 10 mmHg in the same genotype. # p<0.05 versus 80 mmHg in the same genotype. (C) Original current recordings obtained between −100 and +100 mV in the same Pkd2fl/fl and Pkd2 smKO myocytes in control, PE (10 μM), low Na+ (40 mM)+PE and low Na+ (40 mM)+PE + Gd3+ (100 µM). (D) Mean paired data (Pkd2fl/fl, n = 5; Pkd2 smKO, n = 5; *p<0.05 versus control in the same genotype).
Figure 6—figure supplement 1
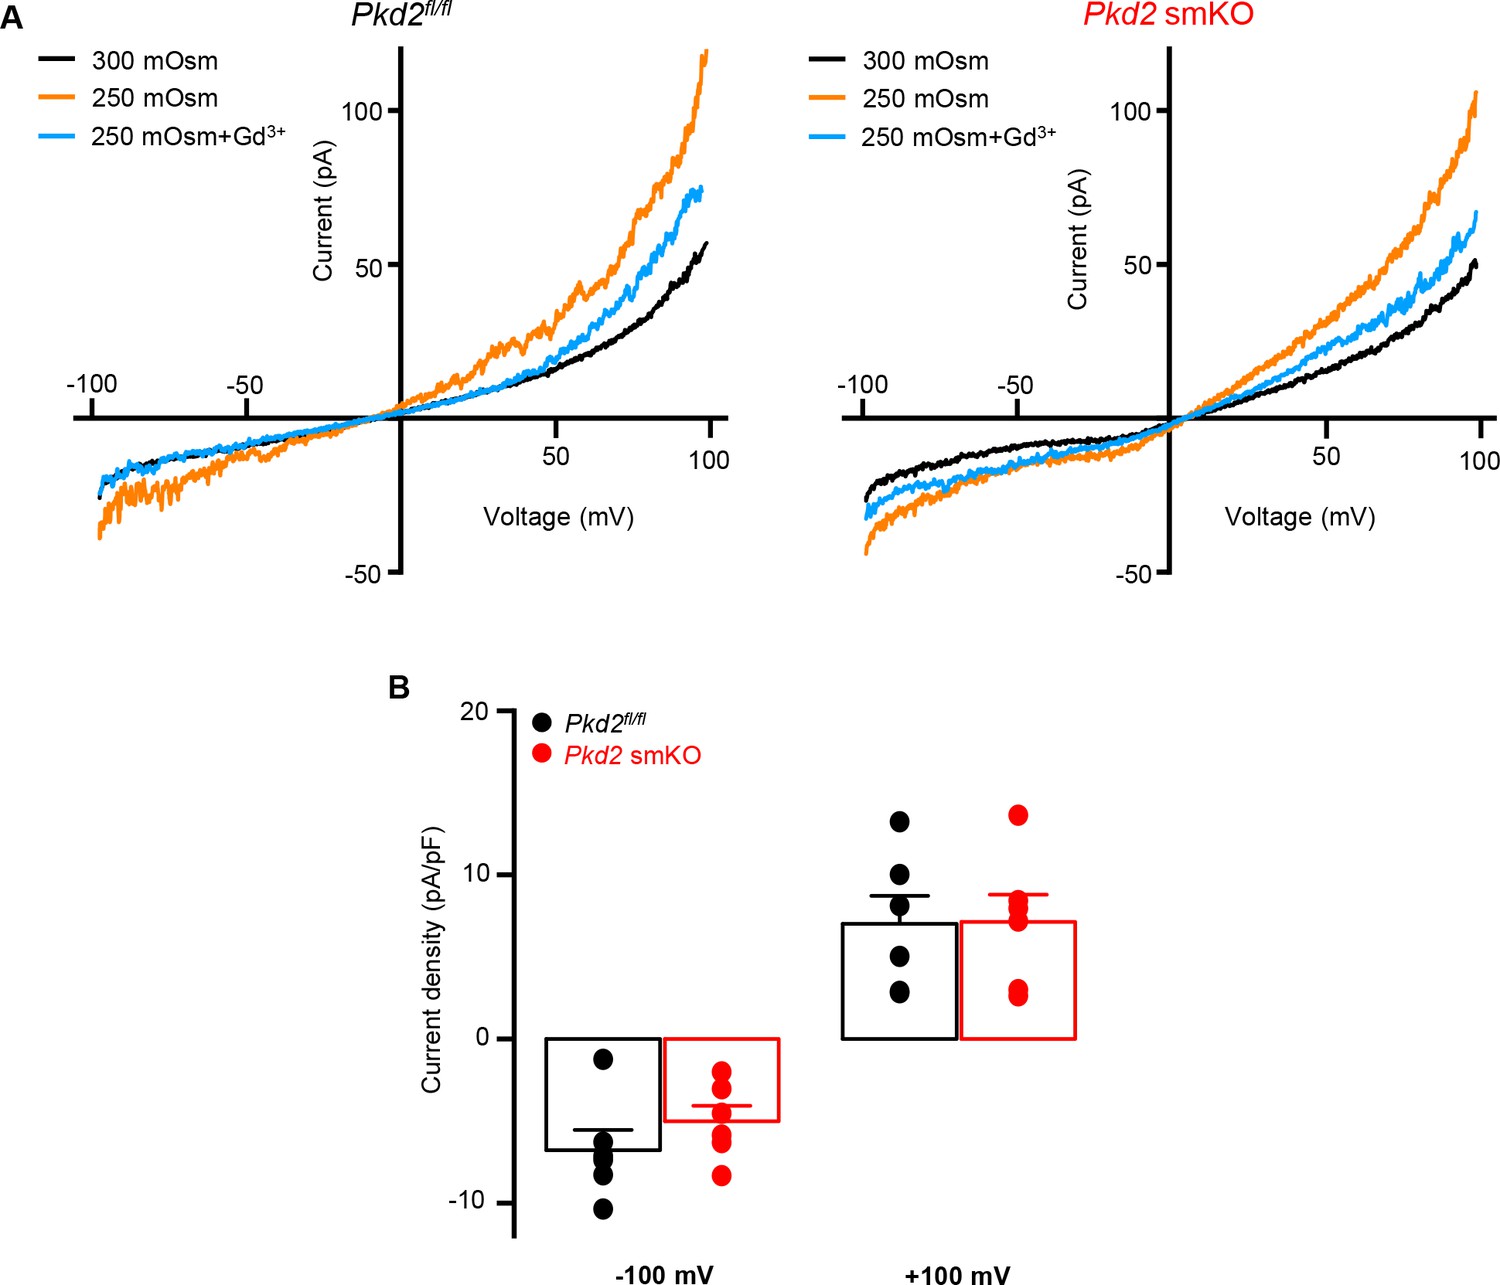
PKD2 knockout does not alter swelling-activated Icat in isolated mesenteric artery myocytes.
(A) Representative I-V relationships from the same isolated mesenteric artery myocytes of Pkd2fl/fl or Pkd2 smKO mice in isosmosmotic (300 mOsm), hyposmotic (250 mOsm) and hyposmotic (250 mOsm) + Gd3+ (100 µM) solutions. (B) Mean data for hyposmoticactivated Gd3+ (100 µM)-sensitive cationic current density at −100 and +100 mV (Pkd2fl/fl, n = 6 and Pkd2 smKO, n = 6).
Figure 7
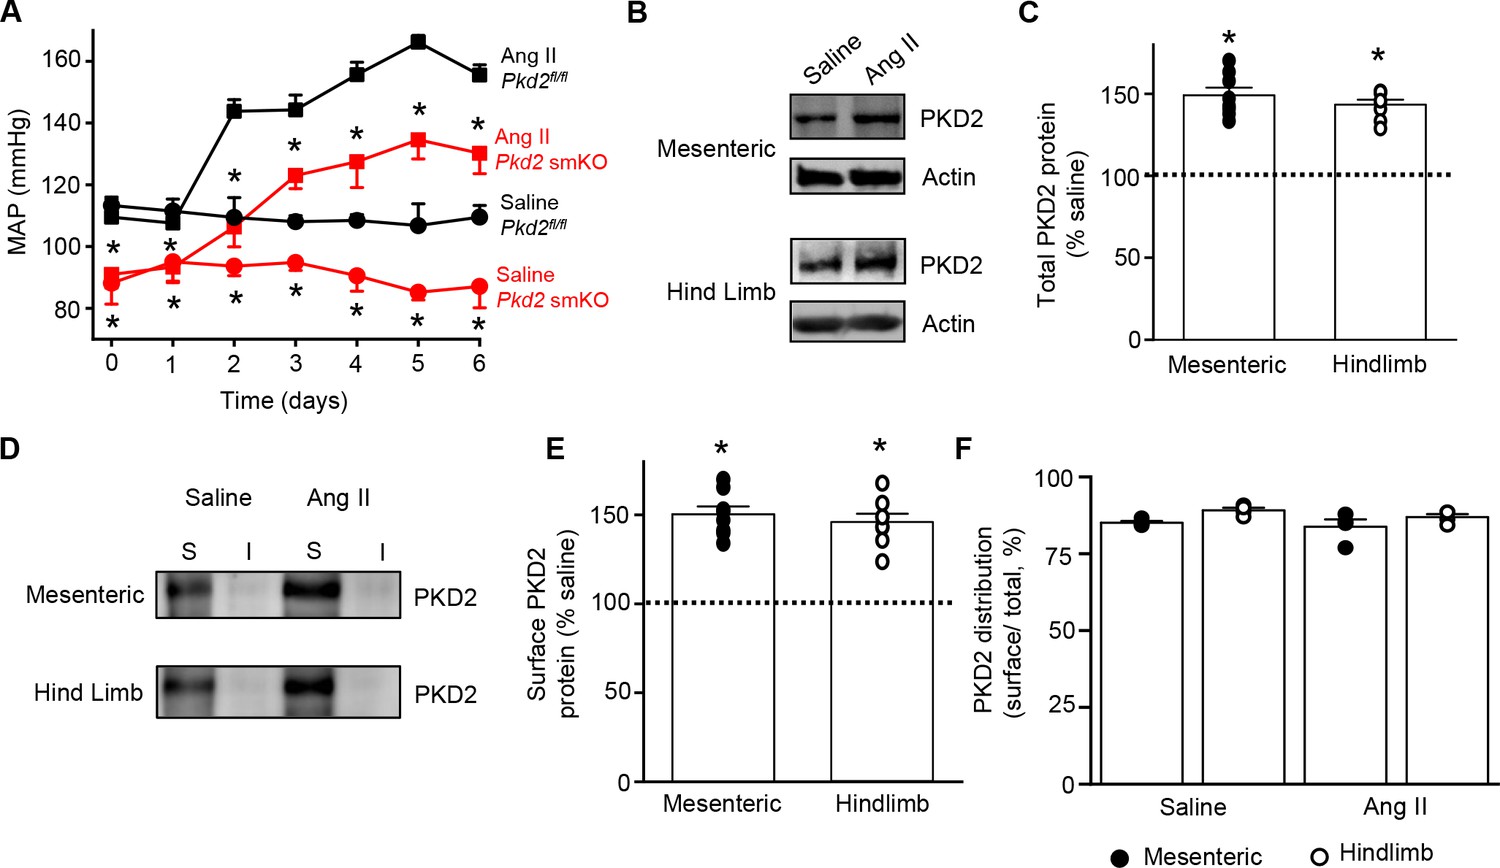
Angiotensin II-induced hypertension is attenuated in Pkd2 smKO mice.
(A) Telemetric blood pressure time course showing the development of angiotensin II-induced hypertension in Pkd2fl/fl (n = 6) and Pkd2 smKO mice (n = 9). Osmotic minipumps containing either saline or angiotensin II were implanted one day prior to day 0. * indicates p<0.05 versus Pkd2fl/fl in the same condition. (B) Western blots illustrating total PKD2 protein in mesenteric and hindlimb arteries of saline-and angiotensin II-treated control mice. (C) Mean total PKD2 protein in mesenteric and hindlimb arteries of angiotensin II-treated mice compared to saline control (n = 8 for each group). * indicates p<0.05 versus saline in the same arterial preparation. (D) Western blots showing surface and intracellular PKD2 protein in arteries of saline-and angiotensin II-treated mice. (E) Mean surface PKD2 protein in mesenteric and hindlimb arteries of angiotensin II-treated mice compared to saline control (n = 8 for each group). * indicates p<0.05 versus saline in the same arterial preparation. (F) Mean data illustrating the percentage of total PKD2 located at the surface in mesenteric and hindlimb arteries of saline-and angiotensin II-treated mice (n = 4 for each group).
Figure 8
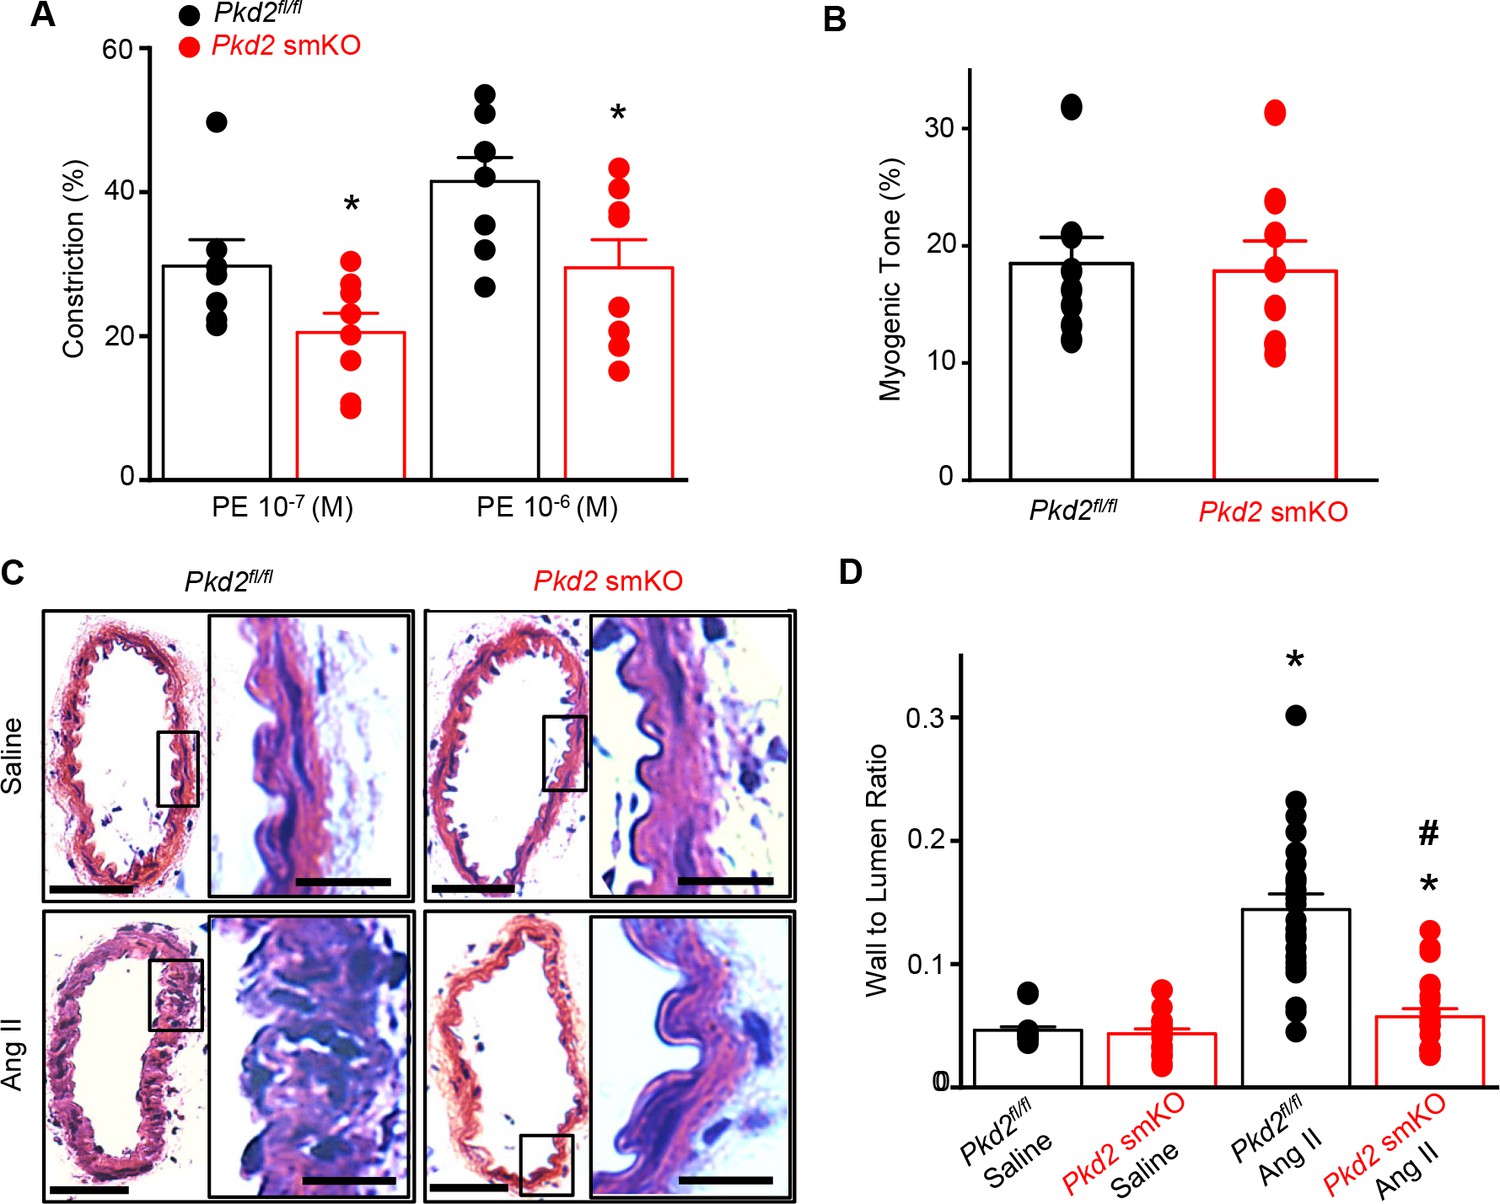
Arterial myocyte PKD2 knockout attenuates vasoconstriction and arterial wall remodeling during hypertension.
(A) Mean phenylephrine-induced vasoconstriction in pressurized (80 mmHg) mesenteric arteries from angiotensin II-treated mice (Pkd2fl/fl, n = 7–8; Pkd2 smKO, n = 8).
Tables
Table 1
Plasma hormones and plasma and urine electrolytes.
https://doi.org/10.7554/eLife.42628.008| Pkd2fl/fl | Pkd2 smKO | |
|---|---|---|
| Plasma hormones (pg/ml) | ||
| Angiotensin II | 202.5 ± 17.2 (n = 16) | 204.7 ± 12.1 (n = 15) |
| Aldosterone | 341.0 ± 18.2 (n = 16) | 365.6 ± 14.0 (n = 10) |
| ANP | 107.2 ± 9.4 (n = 18) | 118.3 ± 12.3 (n = 18) |
| Plasma electrolytes (mM) | ||
| Na+ | 142.3 ± 1.0 (n = 7) | 152.0 ± 5.5 (n = 6) |
| K+ | 6.4 ± 0.4 (n = 7) | 6.8 ± 0.3 (n = 6) |
| Cl- | 78.8 ± 0.7 (n = 7) | 84.1 ± 4.3 (n = 6) |
| Urine electrolytes (mM) | ||
| Na+ | 136.9 ± 9.3 (n = 15) | 147.0 ± 16.2 (n = 15) |
| K+ | 563.2 ± 30.2 (n = 15) | 548.6 ± 37.6 (n = 15) |
| Cl- | 455.4 ± 24.7 (n = 15) | 479.1 ± 42.0 (n = 15) |
Key resources table
| Reagent type (species) or resource | Designation | Source or reference | Identifiers | Additional information |
|---|---|---|---|---|
| Strain, strain background (Mus musculus) | Pkd2fl/fl | John Hopkins PKD Core | PMID 20862291 | Mice with Pkd2 gene flanked by loxP regions |
| Strain, strain background (M. musculus) | Myh11-cre/ERT2 | Jackson Laboratories. PMID 18084302 | Stock # 019079 RRID:IMSR_JAX:019079 | Mice with tamoxifen-inducible Cre recombinase that is expressed under the smooth muscle myosin heavy polipeptide 11 (Myh11) promoter. |
| Strain, strain background (M. musculus) | Pkd2fl/fl:Myh11-cre/ERT2 | This paper | Mouse line created in-house by mating Pkd2fl/fl with Myh11-cre/ERT2. Mice with inducible smooth muscle-specific deletion of PKD2. | |
| Antibody | anti PKD2 (rabbit polyclonal) | Baltimore PKD Core | Rabbit mAB 3374 CT-14/4, | IF 1:200 dilution |
| Antibody | anti PKD2 (mouse monoclonal) | Santa Cruz | Cat. # sc-100415 RRID:AB_1127284 | WB 1:100 dilution, IF 1:100 dilution |
| Antibody | anti PKD1 (mouse monoclonal) | Santa Cruz | Cat. # sc-130554 RRID:AB_2163355 | WB 1:100 dilution |
| Antibody | anti CaV1.2 (mouse monoclonal) | UC Davis/NIH NeuroMab | Cat# 73–053. RRID:AB_10672290 | WB 1:100 dilution |
| Antibody | anti ANO1 (rabbit monoclonal) | Abcam | Cat. # ab64085 RRID:AB_1143505 | WB 1:100 dilution |
| Antibody | anti TRPC6 (rabbit polyclonal) | Abcam | Cat. # ab62461 RRID:AB_956401 | WB 1:1000 dilution |
| Antibody | anti TRPM4 (rabbit polyclonal) | Abcam | Cat. # ab106200 RRID:AB_10865760 | WB 1:500 dilution |
| Antibody | anti Actin (mouse monoclonal) | Millipore Sigma | Cat. # MAB1501 RRID:AB_2223041 | WB 1:5000 dilution |
| Antibody | Alexa 555 secondary antibodies (anti rabbit and anti mouse) | Thermofisher | Cat. # A-21429 (RRID:AB_141761) and # A-31570 (RRID:AB_2536180) | IF 1:400 dilution |
| Other | Nuclear staining (DAPI) | Thermofisher | Cat. # 3571 RRID:AB_2307445 | IF 1:1000 dilution |
| Commercial assay or kit | EZ-Link Sulfo-NHS -LC-LC-Biotin | Thermofisher | Cat. # 21338 | |
| Commercial assay or kit | EZ-Link Maleimide-PEG2-Biotin | Thermofisher | Cat. # 21901BID | |
| Commercial assay or kit | Mouse Angiotensin II ELISA kit | Elabscience | Cat. # E-EL-M2612 | |
| Commercial assay or kit | Mouse Atrial Natriuretic Peptide ELISA kit | Elabscience | Cat. # E-EL-M0166 | |
| Commercial assay or kit | Mouse Aldosterone ELISA kit | Mybiosource | Cat. # MBS775626 | |
| Chemical compound, drug | Angiotensin II | Sigma-Aldrich | Cat. # A9525 |
Additional files
-
Supplementary file 1
Primers used for RT PCR.
The PKD2 forward primer recognizes nucleotides in exon 9 and 10 and the reverse primer was aligned with a sequence in exon 13.
- https://doi.org/10.7554/eLife.42628.019
-
Transparent reporting form
- https://doi.org/10.7554/eLife.42628.020
Download links
A two-part list of links to download the article, or parts of the article, in various formats.
Downloads (link to download the article as PDF)
Open citations (links to open the citations from this article in various online reference manager services)
Cite this article (links to download the citations from this article in formats compatible with various reference manager tools)
Arterial smooth muscle cell PKD2 (TRPP1) channels regulate systemic blood pressure
eLife 7:e42628.
https://doi.org/10.7554/eLife.42628


