A cross-modality enhancement of defensive flight via parvalbumin neurons in zonal incerta
- University of Southern California, United States
Figures
Figure 1 with 2 supplements

Tactile stimulation enhances sound-induced flight response via SSp.
(A) Left, illustration of the head-fixed animal behavioral paradigm. Right, plots of running speed under noise presentation without (black) and with (red) concurrent whisker stimulation for an example animal. Red line marks the duration of noise/whisker stimulation. (B) Summary of peak noise-induced running speed in the absence and presence of whisker stimulation. **p=0.0011, two-sided paired t-test, n = 7 animals. (C) Summary of total travel distance. **p=0.0072, two-sided paired t-test, n = 7 animals. (D) Left, illustration of the experimental paradigm: SSp was silenced with infusion of muscimol (red) as shown in the confocal image (upper left, scale: 500 µm). Right, plots of speed without (black) and with (red) whisker stimulation for an example animal. (E) Summary of peak speed in the absence and presence of whisker stimulation. ‘n.s.', not significant, two-sided paired t-test, n = 5 animals. (F) Summary of total travel distance. ‘n.s.', not significant, two-sided paired t-test, n = 5 animals. Open symbols represent mean ± s.d. for all panels.
-
Figure 1—source data 1
Data for Figure 1 and Figure 1—figure supplements 1 and 2.
- https://doi.org/10.7554/eLife.42728.005
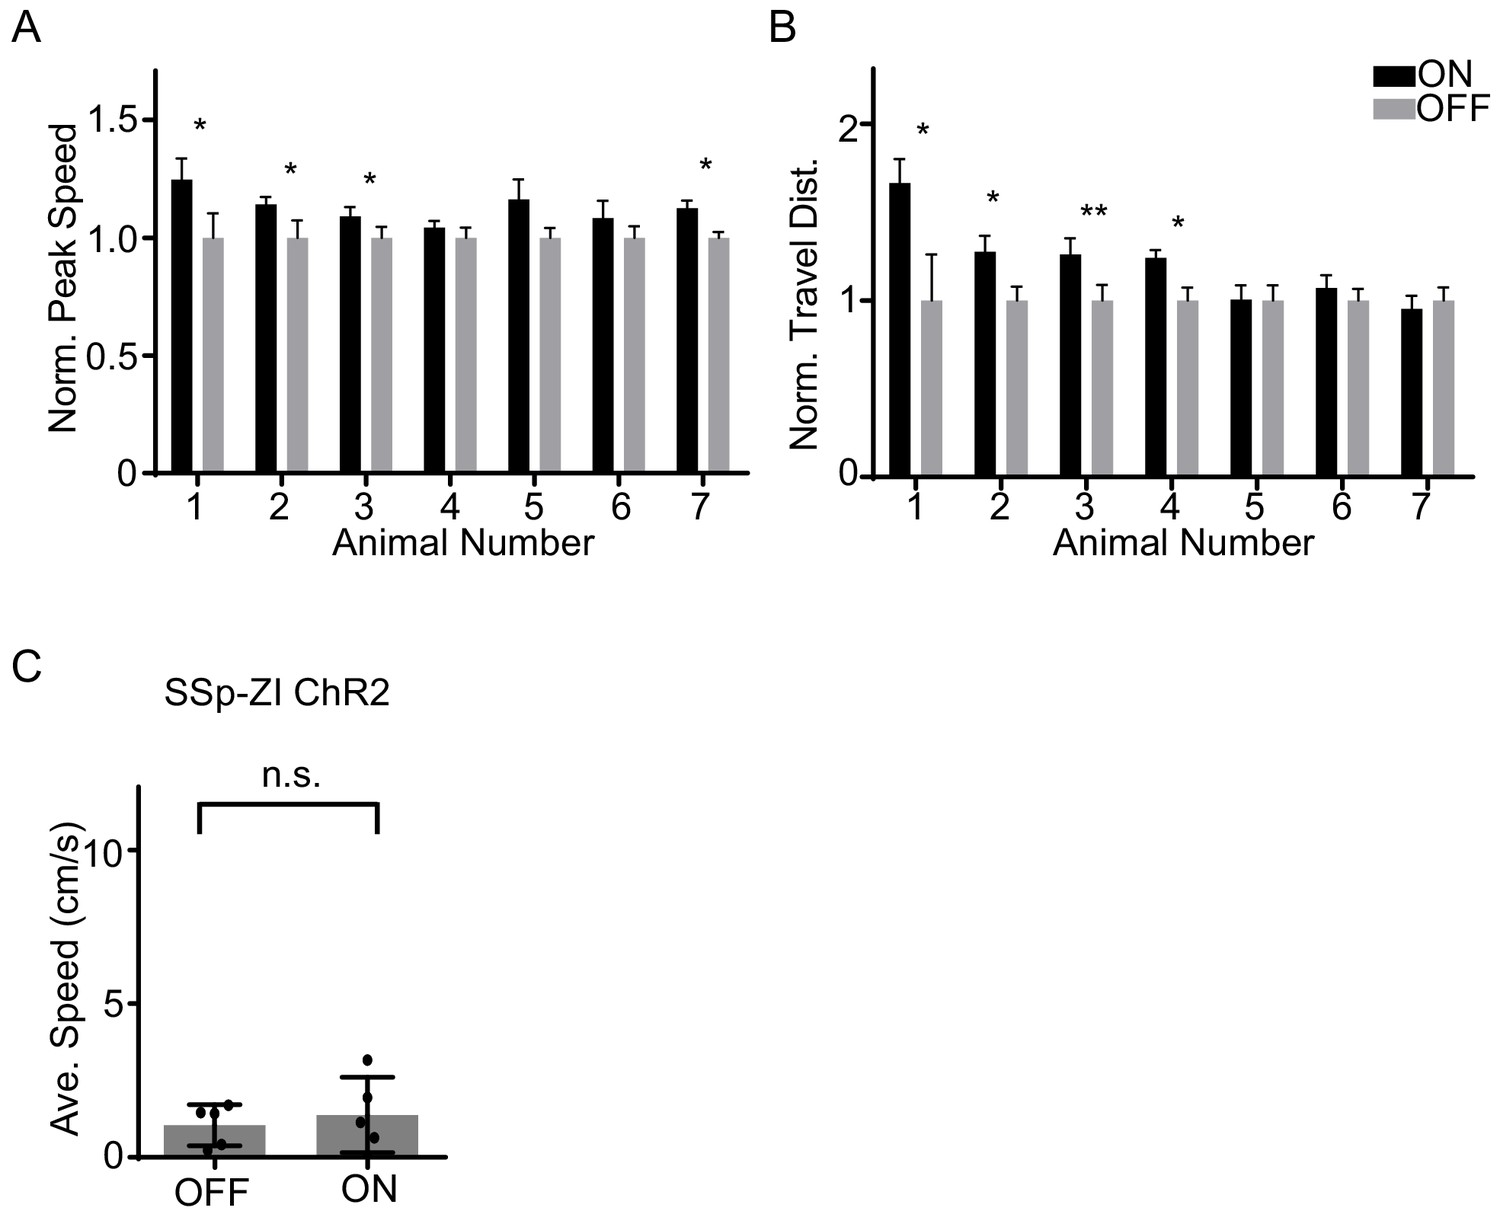
Figure 1—figure supplement 1

Control experiments and analysis of individual animals.
(A) Illustration of the auditory and whisker stimulation paradigm. Right, photograph of the whisker stimulation detail. (B) Summary of baseline locomotion speed without (contr) and with (whisk) whisker stimulation. ‘n.s.', non-significant, two-sided paired t-test, n = 6 animals. Error bars represent mean ± s.d. (C) Normalized peak speed (averaged by trials) for each individual animal without (gray) and with (black) whisker stimulation. ***p<0.001, *p<0.05, two-sided unpaired t-test. Error bars represent mean ± s.e.m. (D) Normalized total travel distance for each animal. ***p<0.001, **p<0.01, *p<0.05, two-sided unpaired t-test. Error bars represent mean ± s.e.m.
Figure 1—figure supplement 2
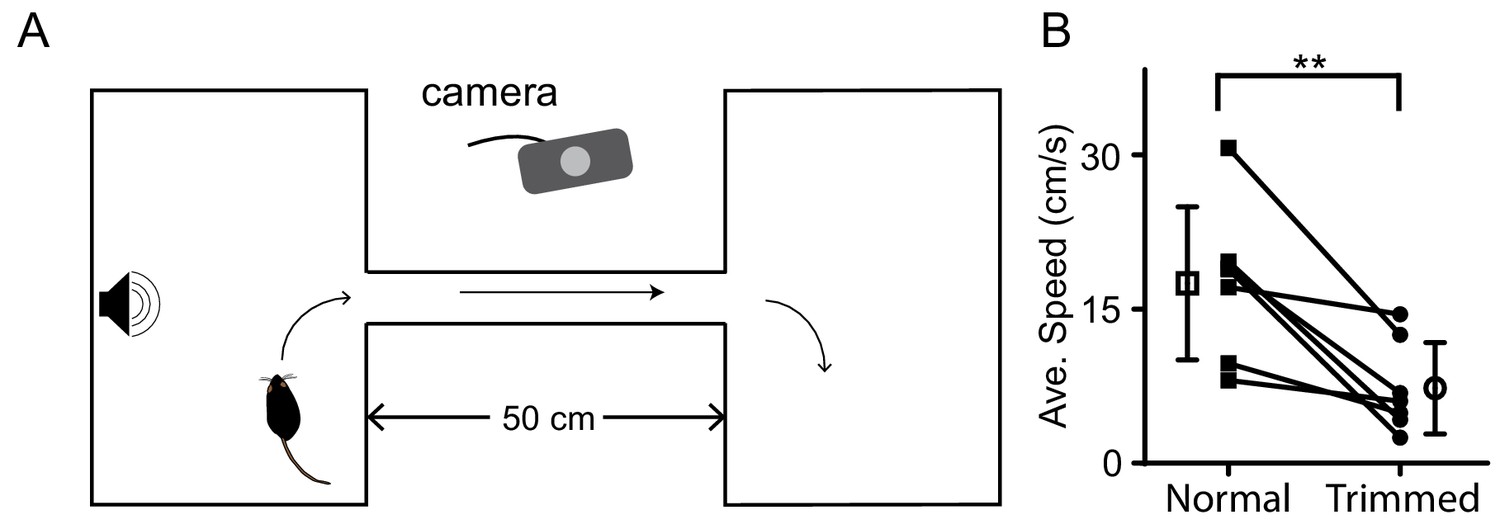
A flght test in freely moving mice.
(A) Illustration of the two-chamber flight test. (B) Summary of average speed for flight crossing the channel before and after whisker trimming. Data points for the same animal are connected with a line. **p<0.01, two-sided paired t-test, n = 7 animals. Error bars represent mean ± s.d.
Figure 2 with 1 supplement

The SSp-ZIv projection mediates the tactile enhancement of sound-induced flight.
(A) Illustration of the injection paradigm. (B) Anterogradely labeled axon terminals in rostral (left), dorsal and ventral (middle), as well as caudal (right) sectors of ZI. Scale bar, 200 µm. Blue shows Nissl staining; red shows PV+ neuron or axon distribution. (C) Left, illustration of the experimental paradigm: optic fibers were implanted to stimulate ChR2-expressing SSp axons in ZI. Right, plots of speed without (black) and with (blue) LED stimulation for an example animal. (D) Summary of peak noise-induced speed in the absence and presence of LED stimulation of SSp-ZI terminals. **p=0.003195, two-sided paired t-test, n = 7 animals. (E) Summary of the travel distance. *p=0.01854, two-sided paired t-test, n = 7 animals. (F) Left, ZIv was silenced with muscimol (red) as shown in the confocal image (lower, scale: 500 µm). Right, plots of speed without (black) and with (red) whisker stimulation for an example animal. (G) Summary of peak speed in the absence and presence of whisker stimulation. ‘n.s.”, not significant, two-sided paired t-test, n = 5 animals. (H) Summary of total travel distance. ‘n.s.”, not significant, two-sided paired t-test, n = 5 animals. (I) Experimental paradigm for slice recording. (J) Average LED-evoked EPSC in an example ZIv PV+ neuron before and after (lower) perfusion of CNQX. Arrow points to the onset of LED light. Recording was made in the presence of TTX and 4-AP. Scale: 25 pA, 25 ms. (K) Amplitudes of LED-evoked EPSCs of 8 responding neurons out of 10 recorded ZIv PV+ cells. Bars represent s.d. for all panels.
-
Figure 2—source data 1
Data for Figure 2 and Figure 2—figure supplement 1.
- https://doi.org/10.7554/eLife.42728.008
Figure 2—figure supplement 1
Analysis of individual animals and control experiment of LED stimulation alone.
(A) Normalized peak speed for each animal without (gray) and with (black) LED light stimulation. *p<0.05, two-sided unpaired t-test. Error bars represent mean ± s.e.m. (B) Normalized total travel distance for each animal. **p<0.01, *p<0.05, two-sided unpaired t-test. (C) Baseline locomotion speed without (OFF) and with (ON) LED light stimulation. ‘n.s.', non-significant, two-sided paired t-test, n = 7 animals.
Figure 3 with 3 supplements

PV+ neurons in ZIv mediate the tactile enhancement of flight behavior.
(A) Left, experimental paradigm. Right, Plots of speed without (black) and with (blue) LED stimulation for an example animal. Blue line marks the duration of noise/LED stimulation. (B) Summary of peak noise-induced speed in the absence and presence of LED stimulation of ZIv PV+ neurons. ***p=0.0009, two-sided paired t-test, n = 6 animals. (C) Summary of total travel distance. **p=0.0042, two-sided paired t-test, n = 6 animals. (D) Left, experimental paradigm. Right, plots of speed without (black) and with (green) LED stimulation for an example animal. Green line marks the duration of noise/LED stimulation. (E) Summary of peak noise-induced speed in the absence and presence of LED inhibition. ***p=0.0004, two-sided paired t-test, n = 5 animals. (F) Summary of total travel distance. *p=0.0136, two-sided paired t-test, n = 5 animals. (G) Left, expressing DREADDi in ZIv PV+ neurons. Right, plots of speed without (black) and with (red) whisker stimulation for an example animal. (H) Summary of peak noise-induced speed in the absence and presence of whisker stimulation with ZIv PV+ neurons inhibited by CNO. ‘n.s.”, not significant, two-sided paired t-test, n = 8 animals. (I) Summary of total travel distance. ‘n.s.”, not significant, two-sided paired t-test, n = 8 animals. Open symbols represent mean ± s.d. (J) Upper, optrode recording in the head-fixed animal. Lower, raster plot of an example ZIv PV+ neuron to 20 Hz LED stimulation in seven trials. Scale: 50 ms. (K) Peri-stimulus spike time histogram for an example PV+ neuron in response to whisker (red), noise (yellow) and whisker plus noise (black) stimulation. Bin size = 100 ms. (L) Summary of evoked firing rates of recorded PV+ neurons (within the stimulation window). ***p<0.0001, one-way ANOVA with post hoc test, n = 22 cells.
-
Figure 3—source data 1
Data for Figure 3 and Figure 3—figure supplements 1–3.
- https://doi.org/10.7554/eLife.42728.013
Figure 3—figure supplement 1

Tests of efficacies of ChR2 and ArchT stimulation and analysis of individual animals.
(A) Confocal images showing the expression of ChR2 (green) and tdTomato (red) in ZIv in a PV-Cre::Ai14 animal. White arrows point to cells showing colocalization of ChR2 and tdTomato. Scale: 50 µm. (B) Upper, blue light induced spiking in an example ChR2-expressing neuron. Each blue dot represents a blue light pulse. Scale: 20 mV, 100 ms. Lower, summary of probability of spiking in response to 10 pulses (at 20 Hz) of blue light stimulation (n = 5 neurons). (C) Upper, green light (500 ms duration) induced hyperpolarization in an example ArchT-expressing neuron. Lower, summary of maximum level of hyperpolarization induced by light for 4 recorded neurons. (D) Normalized peak speed for each animal without (gray) and with (black) blue LED light stimulation for the ChR2 group. **p<0.01, *p<0.05, two-sided unpaired t-test. Error bars represent mean ± s.e.m. (E) Normalized total travel distance for each animal without (gray) and with (black) blue LED light stimulation for the ChR2 group. **p<0.01, *p<0.05, two-sided unpaired t-test. Error bars represent mean ± s.e.m. (F) Normalized peak speed for each animal without (gray) and with (black) green LED light stimulation for the ArchT group, **p<0.01, *p<0.05, two-sided unpaired t-test. Error bars represent mean ± s.e.m. (G) Normalized total travel distance for each animal without (gray) and with (black) green LED light stimulation for the ArchT group. *p<0.05, two-sided unpaired t-test. Error bars represent mean ± s.e.m.
Figure 3—figure supplement 2

Control experiments of LED stimulation alone.
(A, B) Summary of average locomotion speed without and with LED simulation alone for the ChR2 (A, n = 5 animals) and ArchT (B, n = 5 animals) group. ‘n.s.', non-significant, two-sided paired t-test. Error bars represent mean ± s.d.
Figure 3—figure supplement 3
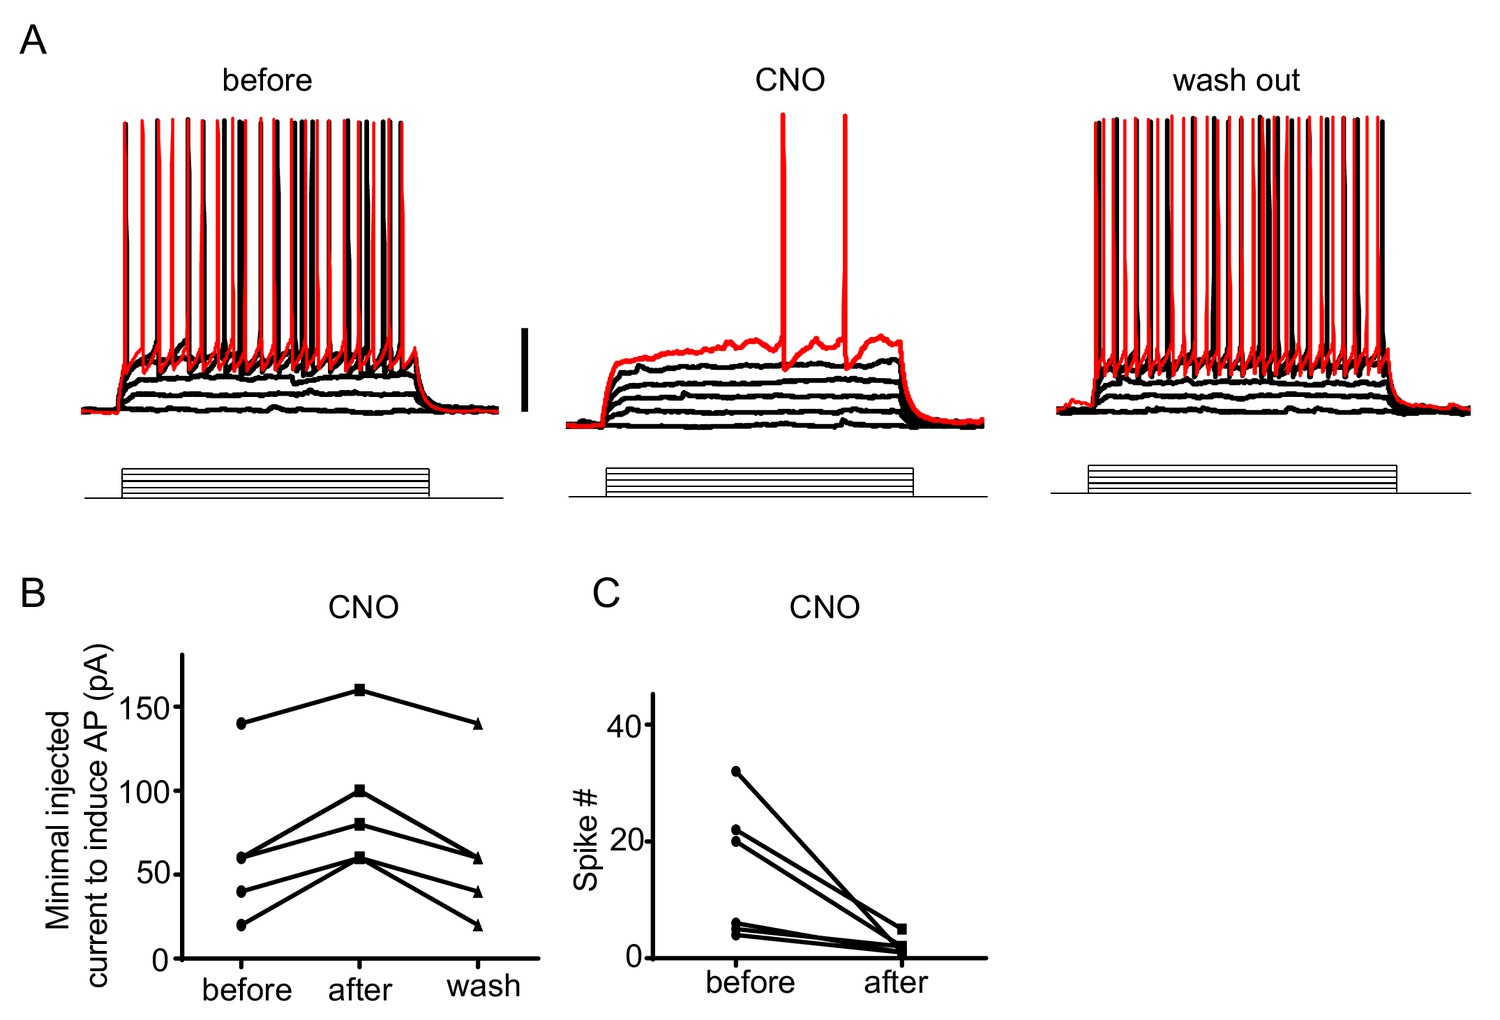
Test of efficacy of chemogenetic silencing.
(A) Current-clamp recording traces for an example hM4D(Gi)-expressing neuron in response to a series of current injections (500 ms duration) with amplitudes ranging from 0 to 120 pA with a step of 20 pA, before (left) and after (middle) CNO perfusion and after washing out CNO (right). Scale: 20 mV. Red color labels the trace at the maximum level of current injection. (B) Summary of minimum amplitude of current injection needed to induce spiking before and after CNO infusion and after washing out CNO. (C) Summary of number of spikes induced by current injection at the same level (which was the threshold level after CNO application) before and after CNO application (n = 6 neurons).
Figure 4 with 2 supplements
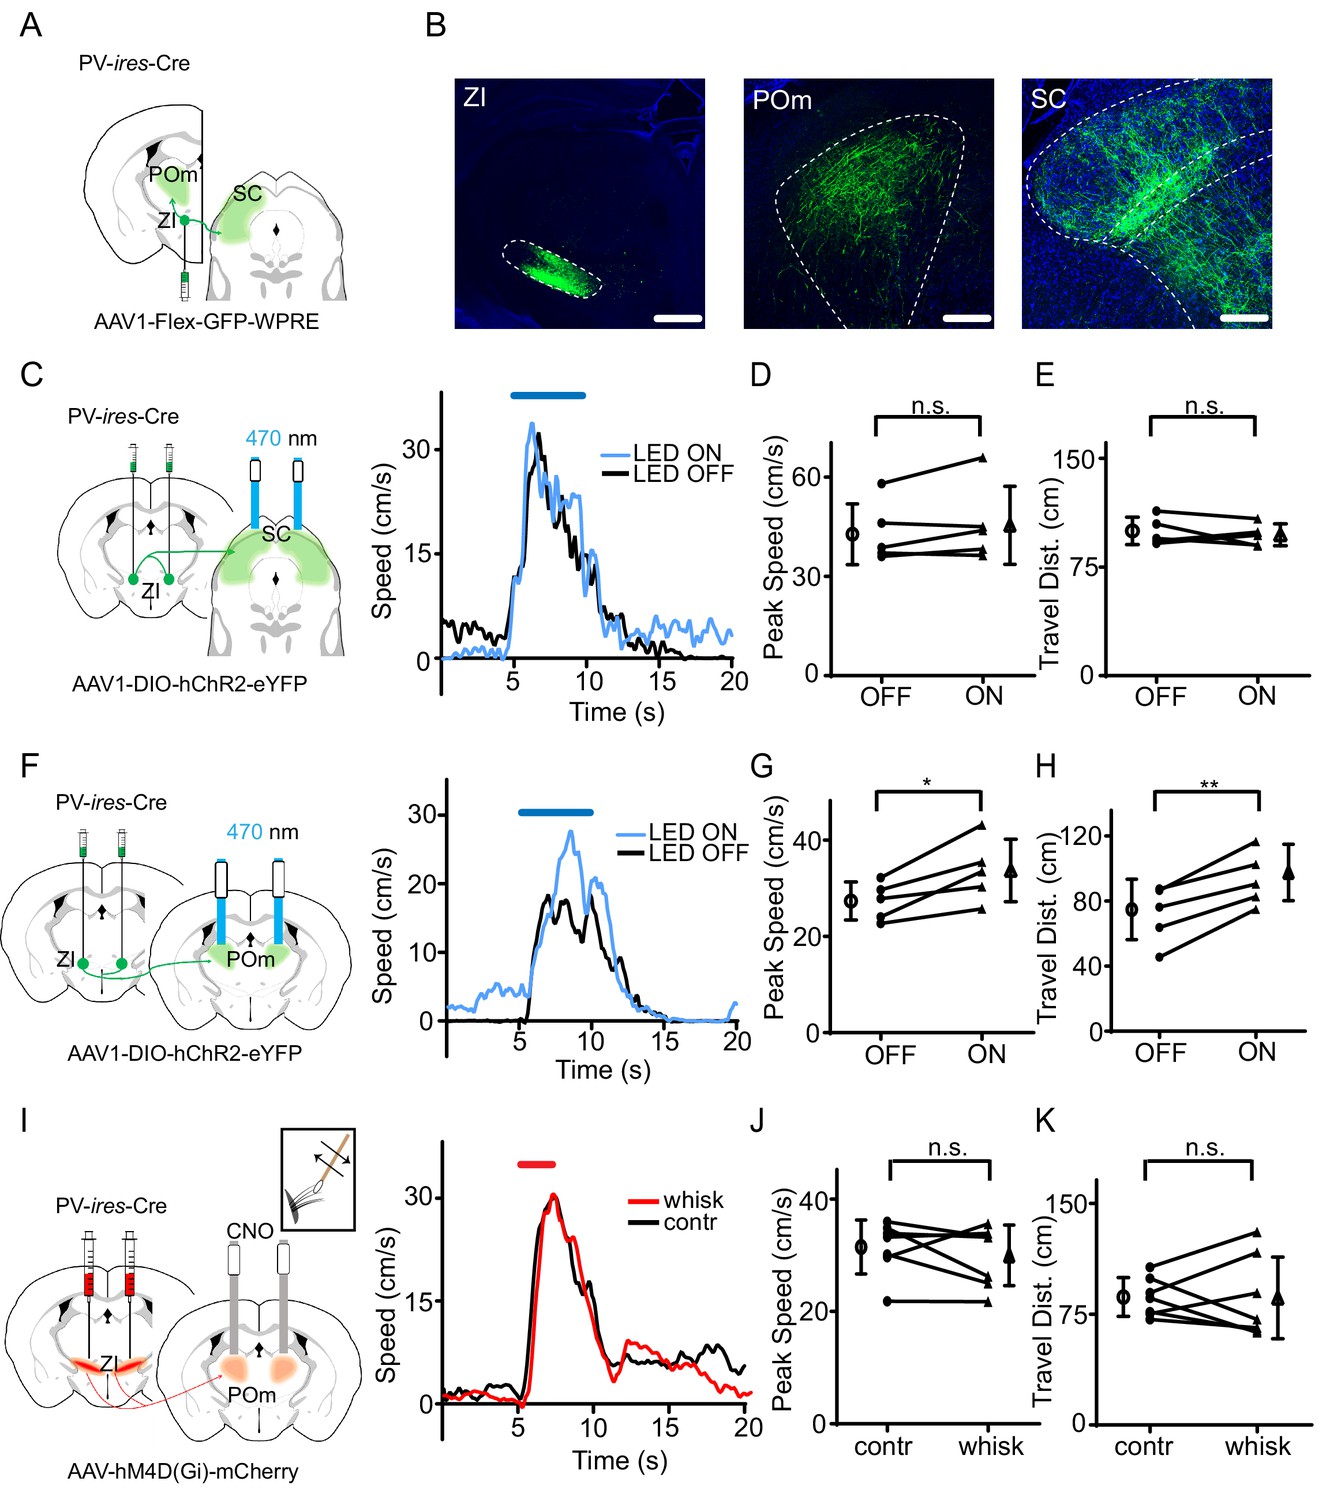
The projection of ZIv PV+ neurons to POm enhances sound-induced flight.
(A) Illustration of injection paradigm. (B) Confocal images showing GFP expression at the injection site (left; scale: 500 µm) and in major target regions (middle and right; scale: 200 µm). Blue shows Nissl staining. SC, superior colliculus; POm, posterior medial nucleus of thalamus. (C) Left, stimulating ChR2-expressing ZI PV+ neuron axons in SC. Right, plots of speed without (black) and with (blue) LED stimulation for an example animal. (D) Summary of peak noise-induced speed in the absence and presence of LED activation of ZIv-SC axons. ‘n.s.”, not significant, two-sided paired t-test, n = 5 animals. (E) Summary of total travel distance. Two-sided paired t-test, n = 5 animals. (F) Left, stimulating ChR2-expressing ZI PV+ neuron axons in POm. Right, plots of speed without (black) and with (blue) LED stimulation for an example animal. (G) Summary of peak noise-induced speed in the absence and presence of LED activation of ZI-POm axons. *p=0.0198, two-sided paired t-test, n = 5 animals. (H) Summary of total travel distance. **p=0.0034, two-sided paired t-test, n = 5 animals. (I) Left, silencing DREADDi-expressing ZI PV+ neuron axons in POm. Right, plots of speed without (black) and with (red) whisker stimulation after local infusion of CNO in POm for an example animal. (J) Summary of peak noise-induced speed in the absence and presence of whisker stimulation when silencing ZIv-POm axons. ‘n.s.', not significant, two-sided paired t-test, n = 7 animals. (K) Summary of total travel distance. ‘n.s.', not significant, two-sided paired t-test, n = 7 animals. Open symbols represent mean ± s.d. for all panels.
-
Figure 4—source data 1
Data for Figure 4 and Figure 4—figure supplements 1 and 2.
- https://doi.org/10.7554/eLife.42728.017
Figure 4—figure supplement 1
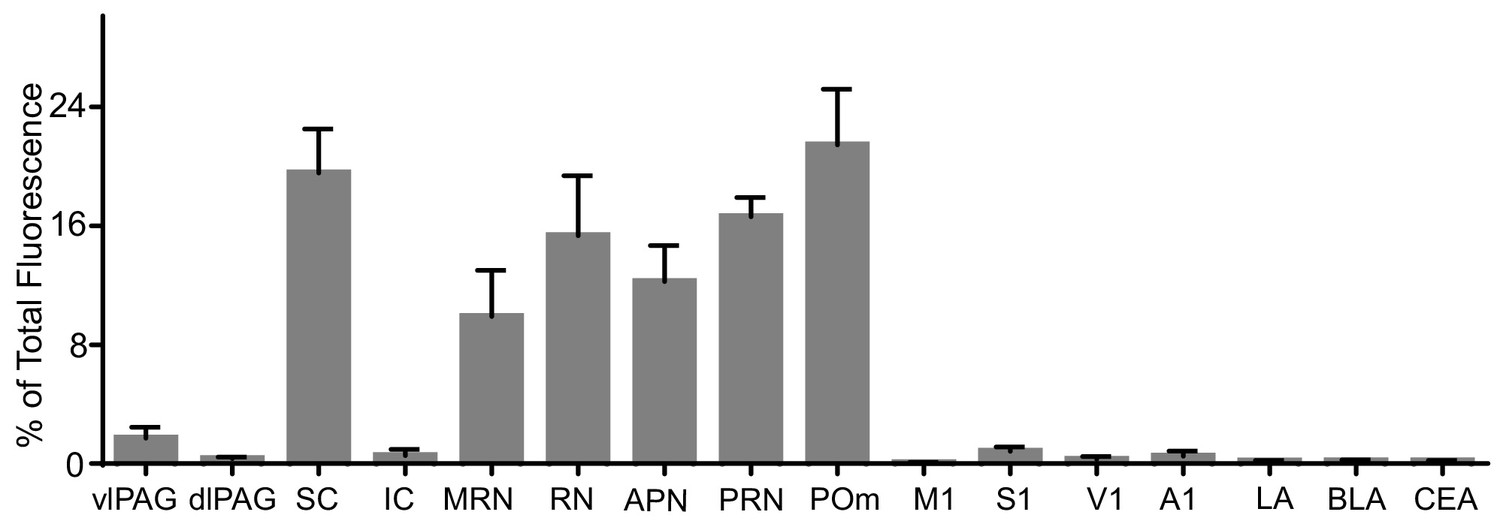
Quantification of relative fluorescence density of GFP-labeled processes in different downstream regions of ZIv PV+ neurons (n = 4 animals).
Bar = s.d. Abbreviations: vlPAG, ventrolateral periaqueductal gray; dlPAG, dorsolateral periaqueductal gray; IC, inferior colliculus; MRN, midbrain reticular nucleus; RN, red nucleus; APN, anterior pretectal nucleus; PRN, pontine reticular nucleus; M1, primary motor cortex; S1, primary somatosensory cortex; V1, primary visual cortex; A1, primary auditory cortex; LA, lateral amygdalar nucleus; BLA, basolateral amygdalar nucleus; CEA, central amygdalar nucleus.
Figure 4—figure supplement 2

Analysis of individual animals and control experiment of LED stimulation alone.
(A) Normalized peak speed for each animal without (gray) and with (black) blue LED light stimulation. *p<0.05, two-sided unpaired t-test. Error bars represent mean ± s.e.m. (B), Normalized total travel distance for each animal without (gray) and with (black) blue LED light stimulation. **p<0.01, *p<0.05, two-sided unpaired t-test. Error bars represent mean ± s.e.m. (C), Summary of average locomotion speed without and with LED light stimulation alone. ‘n.s.”, non-significant, two-sided paired t-test, n = 5 animals. Error bars represent mean ± s.d. Supplementary and source data files.
Tables
Key resources table
| Reagent type (species) or resource | Designation | Source or reference | Identifiers | Additional information |
|---|---|---|---|---|
| Strain (mouse) | Pvalb-ires-Cre | Jachson Laboratory | Stock No.008069 | |
| Strain (mouse) | Ai14 | Jachson Laboratory | Stock No.007914 | |
| Strain (mouse) | C57BL/6J | Jachson Laboratory | Stock No.000664 | |
| Recombinant DNA reagent | AAV2/1-CamKII-hChR2-eYFP-WPRE-hGh | UPenn Vector Core | ||
| Recombinant DNA reagent | AAV1-CAG-FLEX-eGFP-WPRE-bGH | UPenn Vector Core | ||
| Recombinant DNA reagent | AAV2/1-pEF1α-DIO-hChR2-eYFP | UPenn Vector Core | ||
| Recombinant DNA reagent | AAV1-CAG-FLEX-ArchT-GFP | UNC vector Core | ||
| Recombinant DNA reagent | pAAV-hSyn-hM4D(Gi)-mCherry | Addgene | Plasmid #50475 | |
| Other (stains) | NeuroTrace 640/660 Deep-Red Fluorescent Nissl Stain | ThermoFisher | N21483 | IHC 1:500 |
| Chemical compound, drug | Muscimol | ThermoFisher | M23400 | |
| Chemical compound, drug | Tetrodotoxin | Torcris | Cat. No.1078 | 1 µM |
| Chemical compound, drug | 4-Aminopyridine (4-AP) | Torcris | Cat. No. 0940 | 1 mM |
| Chemical compound, drug | cyanquixaline (CNQX) | Sigma-Aldrich | C239 | 20 µM |
| Chemical compound, drug | clozapine-N-oxide (CNO) | Torcris | Cat. No. 4936 | 1 mg/kg IP; 3 µM local infusion; 5 µM in slice recording |
| Software | Offline Sorter | Plexon | version 4 | |
| Software | MATLAB | Mathworks | version R2017a |
Additional files
-
Supplementary file 1
Analysis of temporal profiles of speed traces in different sets of experiments.
Data are presented as mean ± SD. Two-sided paired t-test were performed to compared values between control and manipulation conditions. The type of experiment is shown by the corresponding figure number in main figures.
- https://doi.org/10.7554/eLife.42728.018
-
Transparent reporting form
- https://doi.org/10.7554/eLife.42728.019
Download links
A two-part list of links to download the article, or parts of the article, in various formats.
Downloads (link to download the article as PDF)
Open citations (links to open the citations from this article in various online reference manager services)
Cite this article (links to download the citations from this article in formats compatible with various reference manager tools)
A cross-modality enhancement of defensive flight via parvalbumin neurons in zonal incerta
eLife 8:e42728.
https://doi.org/10.7554/eLife.42728


