Sae2/CtIP prevents R-loop accumulation in eukaryotic cells
- Howard Hughes Medical Institute, The University of Texas at Austin, United states
- The University of Texas at Austin, United States
- National Cancer Institute, National Institutes of Health, United States
- University of Arkansas for Medical Sciences, United States
Figures
Figure 1 with 2 supplements
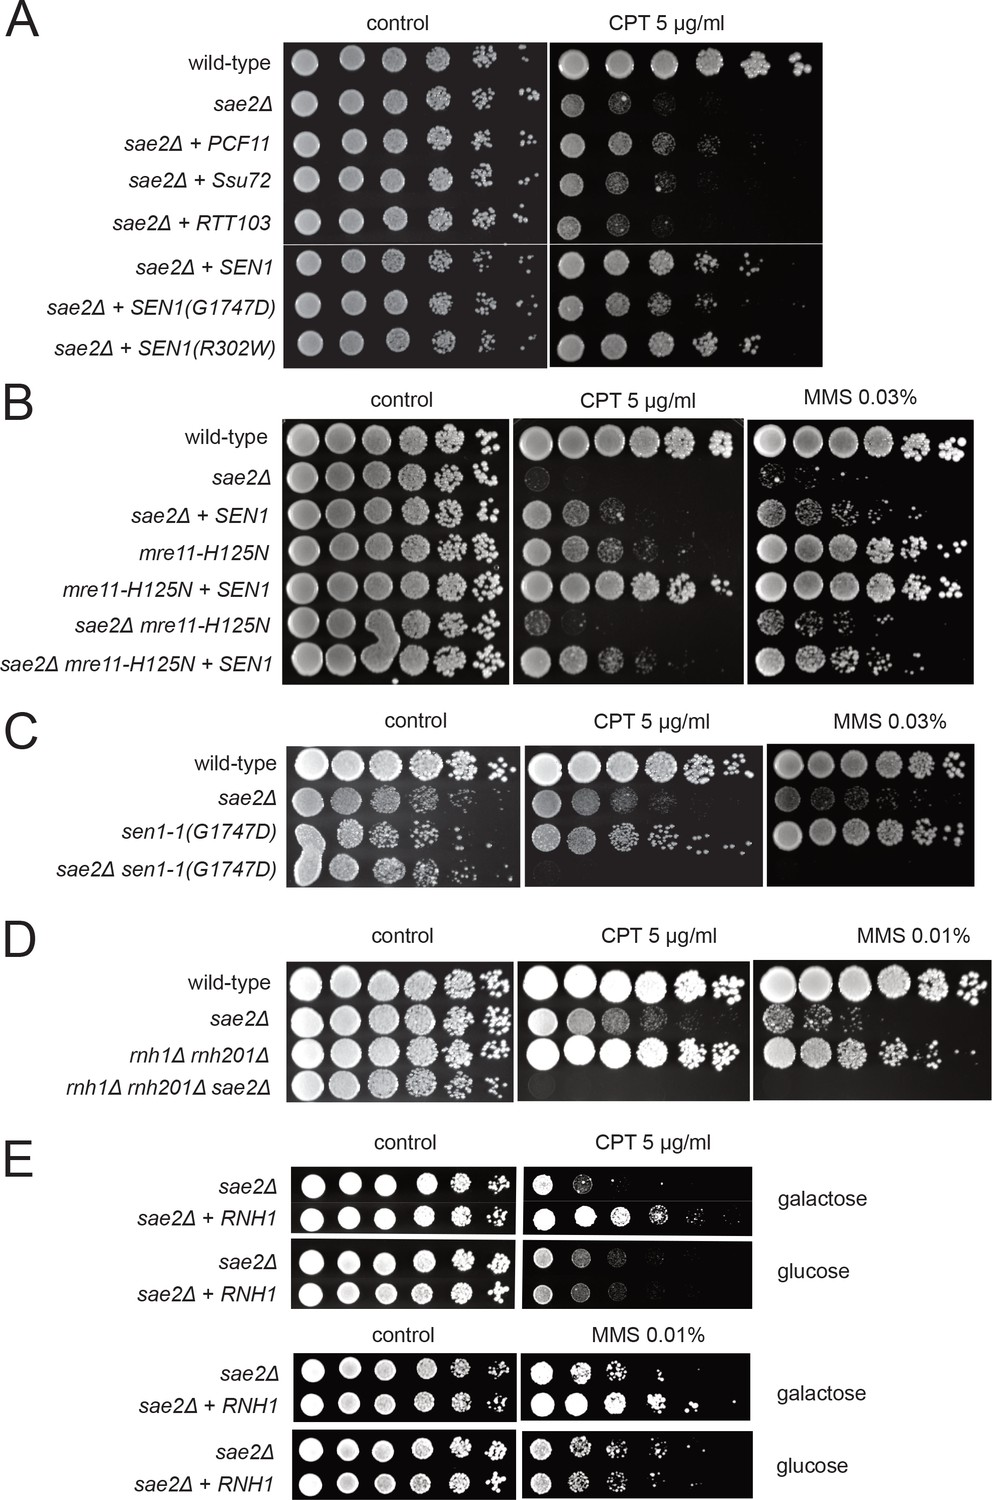
Transcription termination factors suppress DNA damage sensitivity of sae2Δ and mre11 nuclease-deficient strains.
(A) Full-length PCF11, SSU72, RTT103, SEN1, and sen1 mutants G1747D and R302W were expressed from a 2μ plasmid in sae2Δ cells. Fivefold serial dilutions of cells expressing the indicated Sae2 alleles were plated on nonselective media (control) or media containing camptothecin (CPT, 5.0 μg/ml) and grown for 48 hr (control) or 70 hr (CPT). (B) SEN1 was expressed from a 2μ plasmid in sae2Δ, mre11-H125N, and sae2Δ mre11-H125N cells and analyzed for CPT sensitivity as in (A). (C) Wild-type, sae2Δ, sen1-1(G1747D), and sae2Δ sen1-1(G1747D) strains were analyzed as in (A). (D) Wild-type, sae2Δ, Δrnh1 Δrnh201, and sae2Δ Δrnh1 Δrnh201 strains were analyzed as in (A). (E) sae2Δ strains with RNH1 expressed under the control of the GAL promoter were tested for sensitivity to CPT and MMS, on either galactose or glucose plates indicated.
Figure 1—figure supplement 1
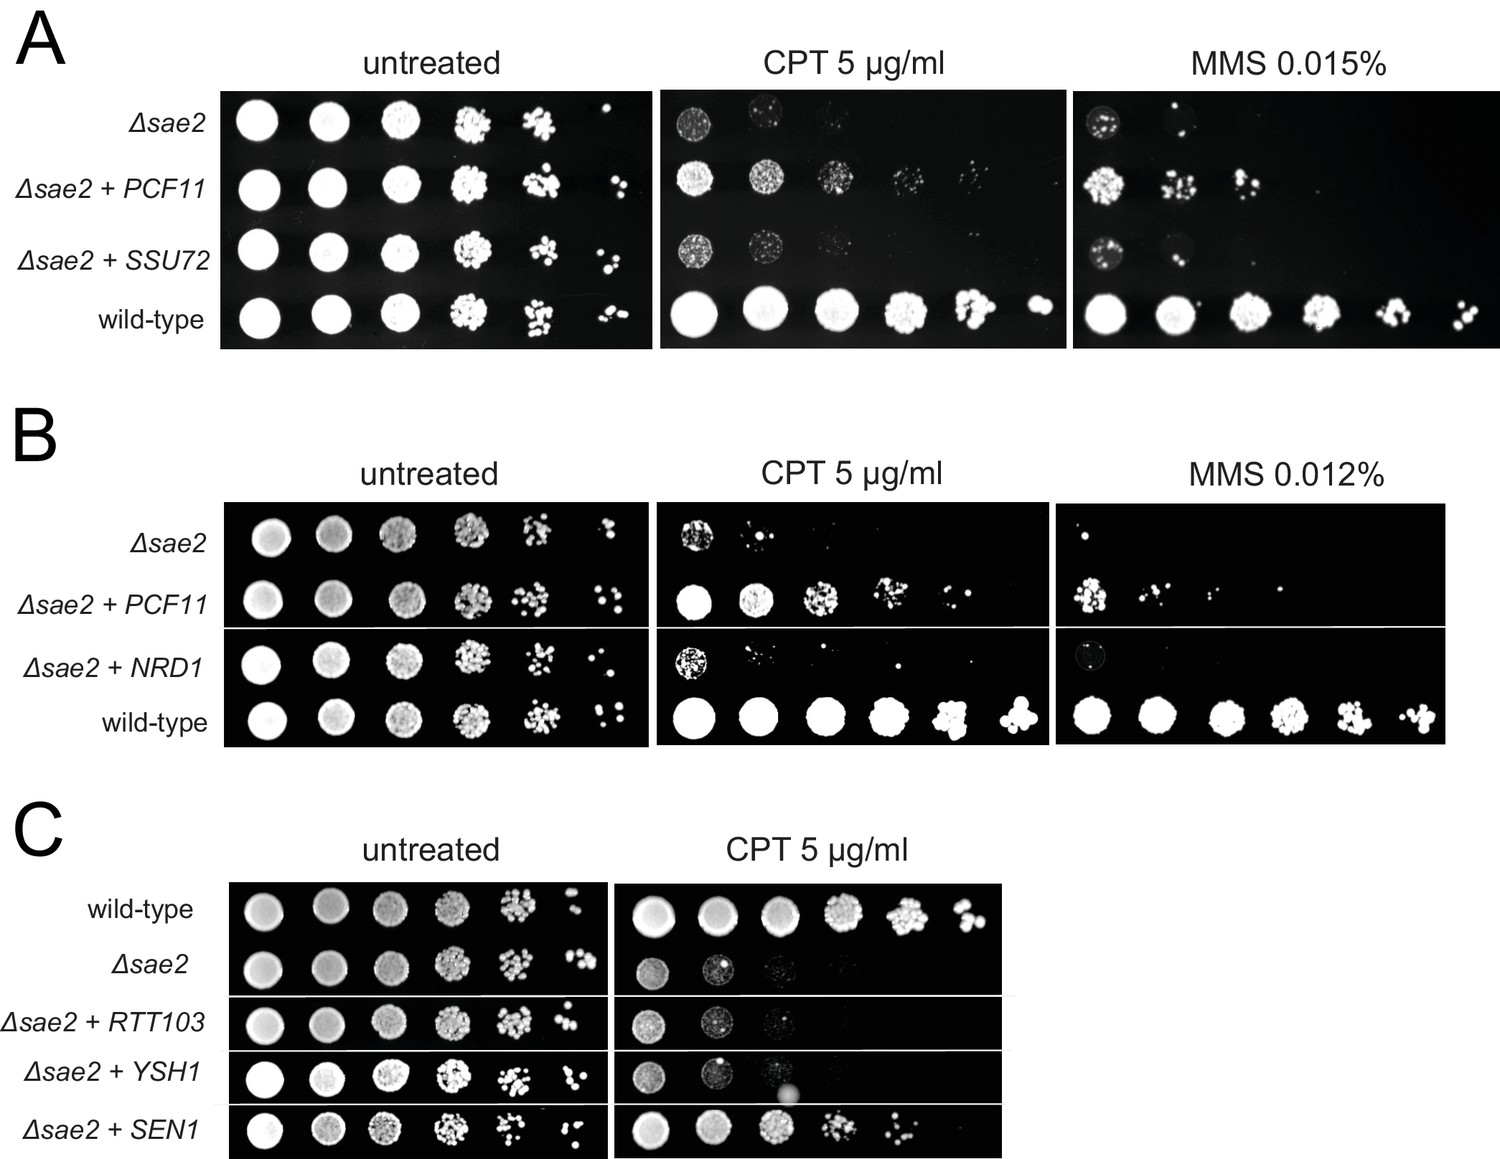
Overexpression of SSU72, NRD1, RTT103, or YSH1 does not complement Δsae2 strains for DNA damage sensitivity.
Overexpressed genes were expressed from a 2μ plasmid. Fivefold serial dilutions of yeast strains were plated on nonselective media (untreated) or media containing camptothecin or MMS and grown for 48 hr (untreated), 70 hr (CPT) or 90 hr (MMS) as indicated.
Figure 1—figure supplement 2
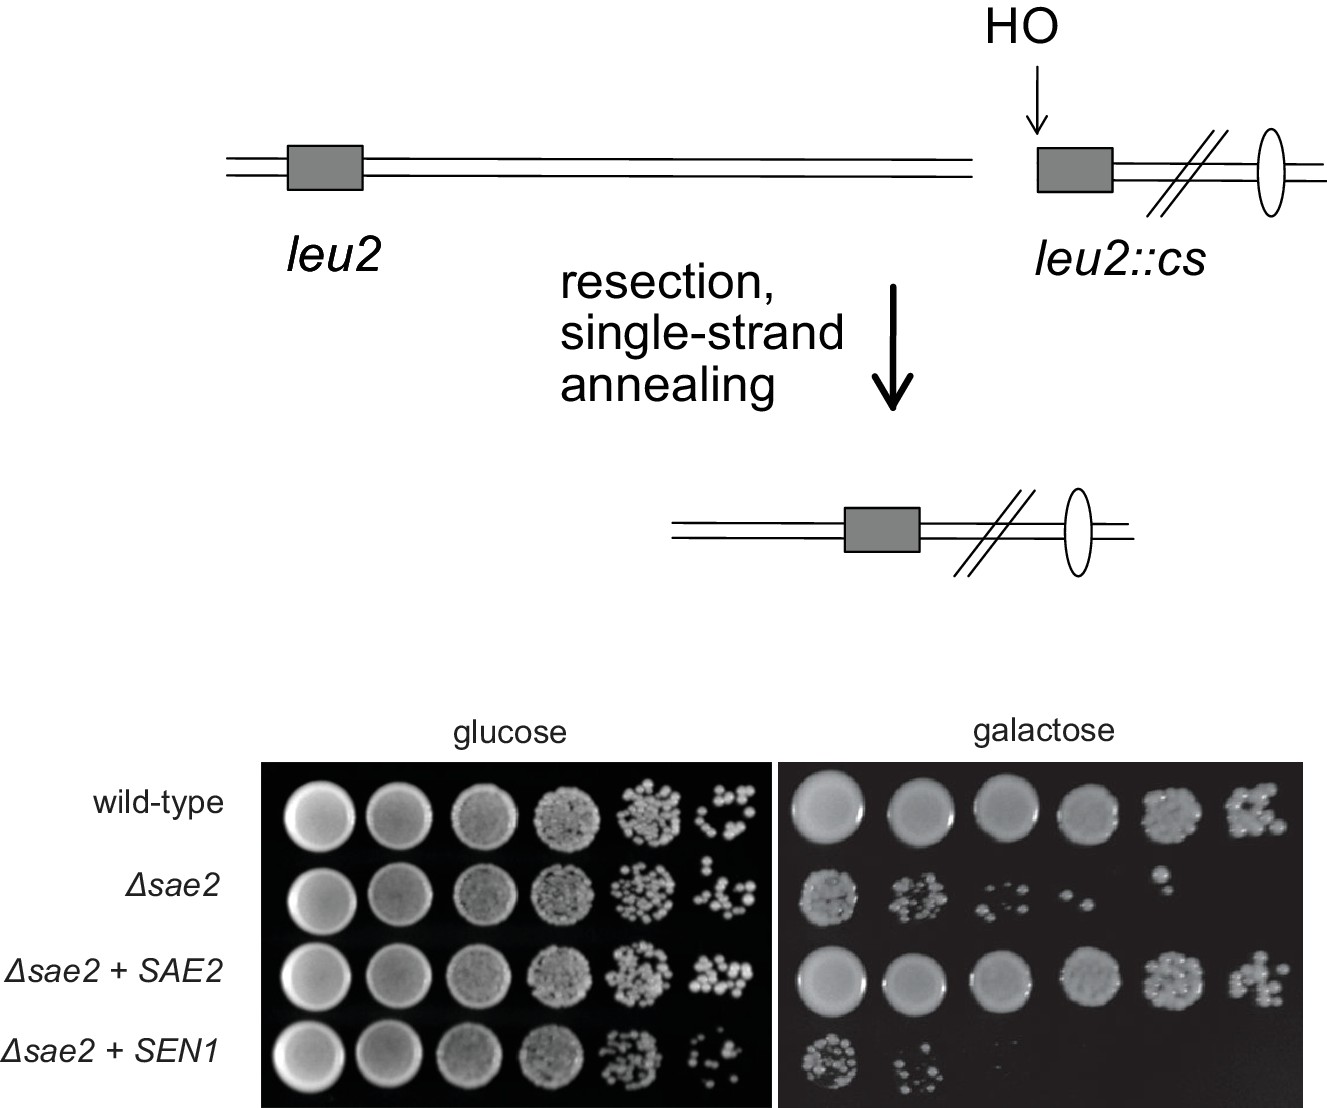
SEN1 overexpression does not complement the resection deficiency in Δsae2 yeast strains.
Wild-type, Δsae2, Δsae2 + wild type SAE2, and Δsae2 + SEN1 strains containing a galactose-inducible HO endonuclease and an HO cut site in a LEU2 cassette separated from a homologous LEU2 cassette 25 kb away (YMV80) (Vaze et al., 2002b) were tested for survival of growth on galactose by plating 5-fold serial dilutions on either glucose or galactose-containing plates as indicated. Previous work has shown that the survival deficit of Δsae2 strains in this context is due to a reduced level of DNA end resection (Clerici et al., 2005).
Figure 2
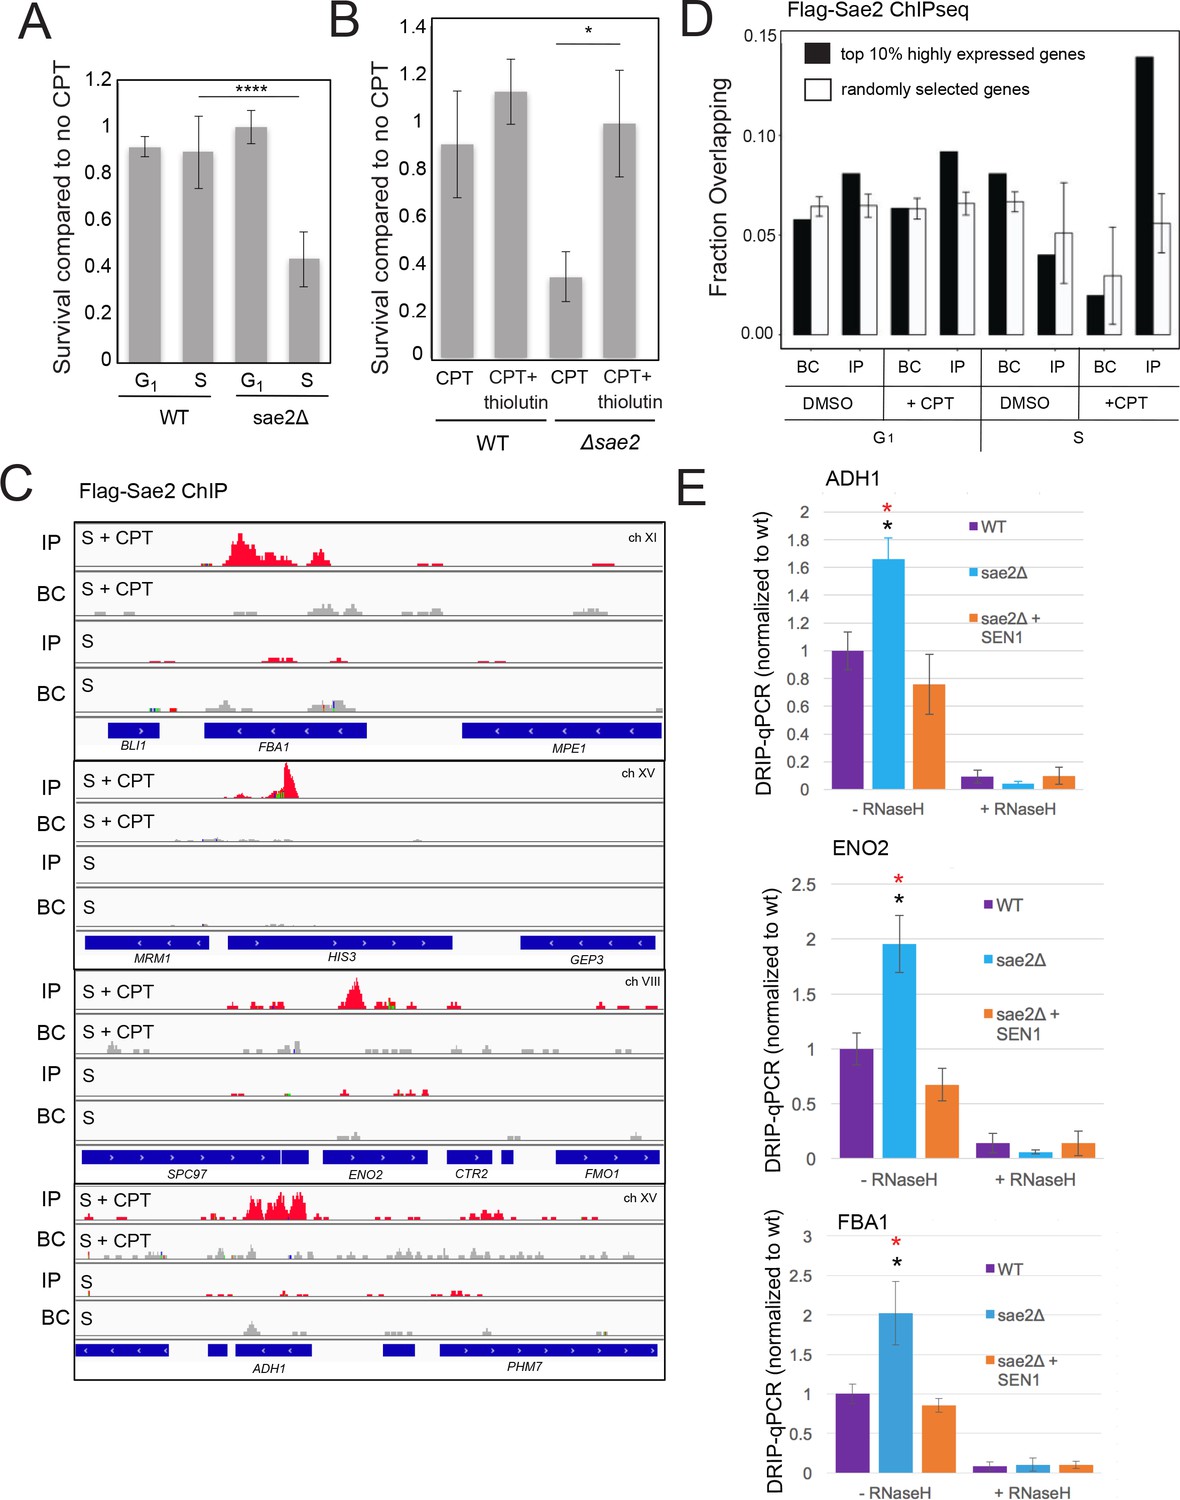
Sae2 associates with sites of high levels of transcription which accumulate R-loops in the absence of Sae2.
(A) The survival of wild-type and sae2Δ strains was measured by exposing cells to camptothecin (100 μM for 2 hr) while in G1 phase or S phase and plating cells on rich media. The percentage of viable colonies is shown relative to cells exposed to DMSO only, with three biological replicates (error bars represent standard deviation). (B) The survival of wild-type and sae2Δ strains was measured in the absence or presence of active transcription by exposing S phase cells to thiolutin (2.5 μg/ml for 30 min) or DMSO prior to camptothecin exposure in S phase as in (A). (C) Representative examples of Sae2-ChIP at the FBA1, HIS3, ENO2, and ADH1 genes in sae2Δ cells expressing Flag-Sae2, in S phase with CPT exposure as in (A). Reads from the immunoprecipitated sample are shown (IP) in comparison to control immunoprecipitations performed in the absence of Flag antibody (bead control, BC). (D) Data from Sae2 ChIP-seq was compared to previous data on transcription levels in wild-type yeast cells (Nagalakshmi et al., 2008; Pelechano et al., 2010; Miura et al., 2008)(See Supplementary file 2). The overlap between peaks identified by Sae2 ChIP-seq were compared to the top 10% of transcribed genes (486 genes; excluding rDNA loci) or a randomly chosen set of genes. The randomized set comparison was performed 1000 times. (E) R-loops were quantified at various loci using S9.6 immunoprecipitation in wild-type, sae2Δ, and sae2Δ + SEN1 yeast strains, all with CPT treatment in S phase, as indicated. Levels of DNA sites enriched in S9.6 immunoprecipitations are shown relative to levels in wild-type cells using primers specific for ADH1 (ADH1-2), ENO2 (ENO2-3), and FBA1 (FBA1-2). Error bars represent standard deviation from four biological replicates. * indicates p < 0.05 comparing sae2Δ to wild-type (black asterisks) or comparing sae2Δ to sae2Δ plus SEN1 (red asterisks) using 2-tailed Student's t-tests. S9.6 immunoprecipitations were also performed with RNaseH pretreatment of chromatin, ‘+RNaseH’.
Figure 3
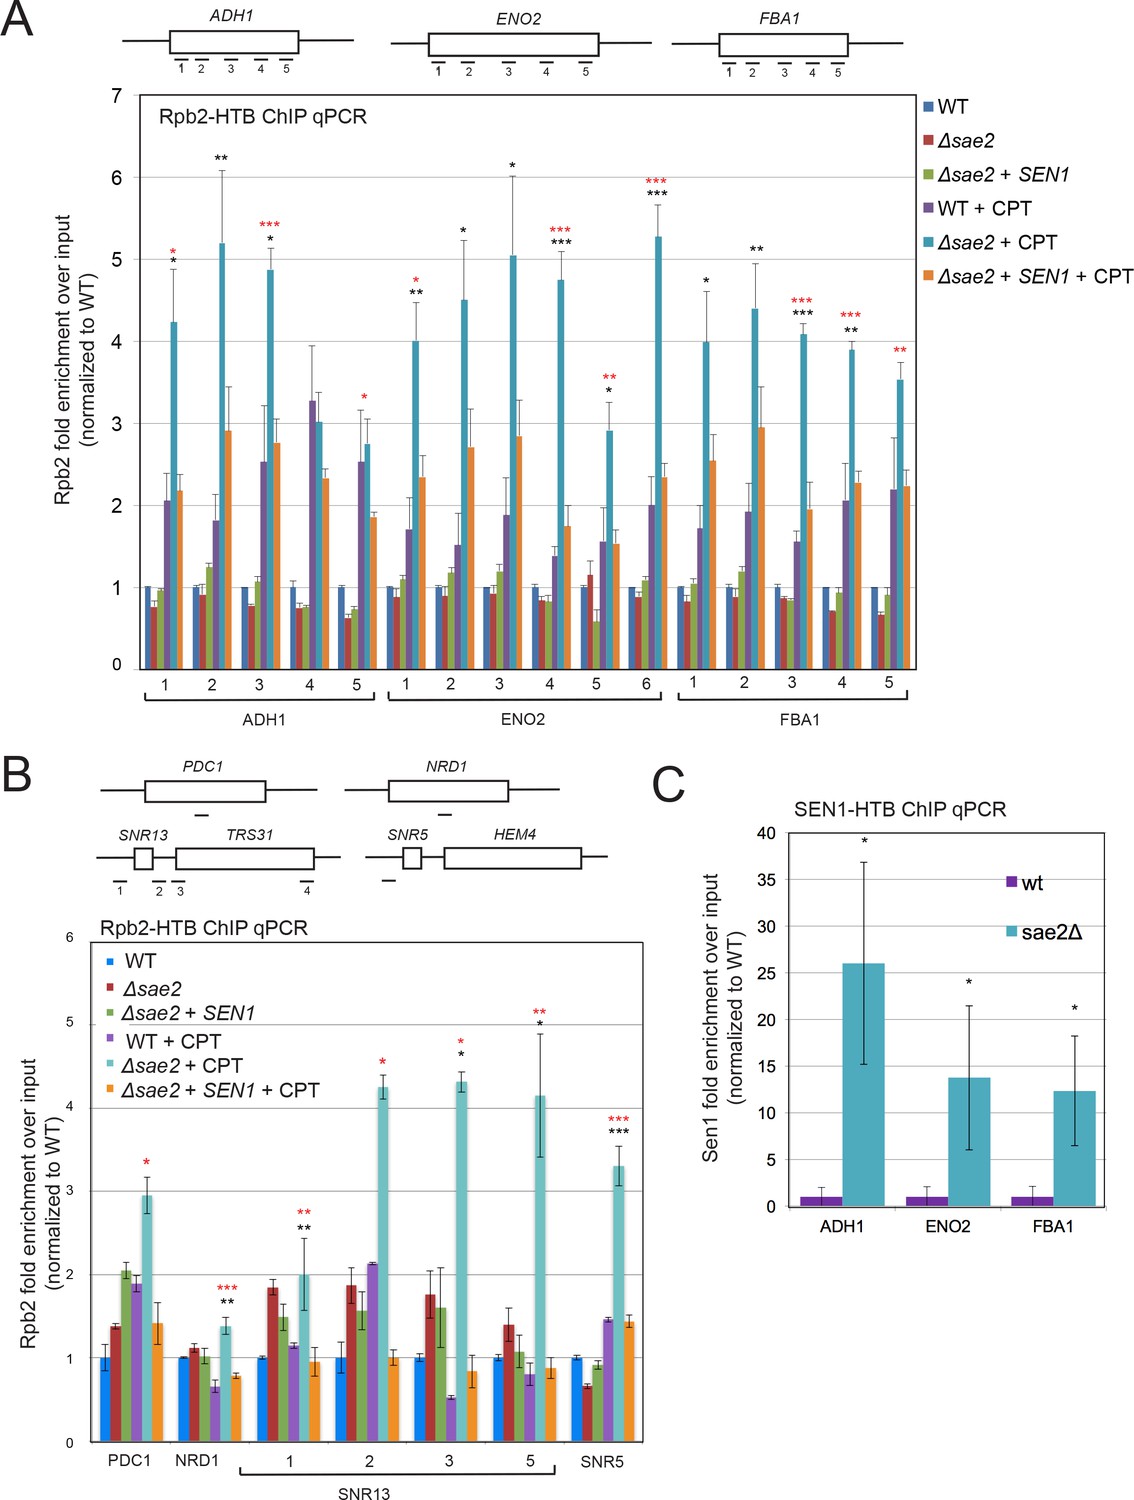
RNA Polymerase stalling at highly transcribed genes is exacerbated in sae2Δ strains with DNA damage.
(A) HTB-tagged Rpb2 (a component of RNA Pol II) levels were measured at various genes during S phase in wild-type and sae2Δ strains with or without CPT exposure and in the presence or absence of overexpressed Sen1, as indicated. Enrichment relative to input DNA is shown, with all values normalized to values obtained with the wild-type strain in the absence of damage. Error bars represent standard error from six immunoprecipitations, two biological samples with three technical replicates of the IP per sample. Approximate locations of primer sets relative to the gene are shown. * indicates p < 0.05, **p < .005, ***p < 0.0005, comparing sae2Δ to wild-type (black asterisks) or comparing sae2Δ to sae2Δ plus SEN1 (red asterisks) using 2-tailed Student's t-tests. (B) HTB-tagged Rpb2 levels were measured at various genes as in (A). SNR5 and SNR13 are non-coding nucleolar RNAs. (C) HTB-tagged Sen1 levels were measured at various genes as in (A) with CPT treatment. Primer sets used were ADH1-2, ENO2-4, and FBA1-3.
Figure 4 with 2 supplements

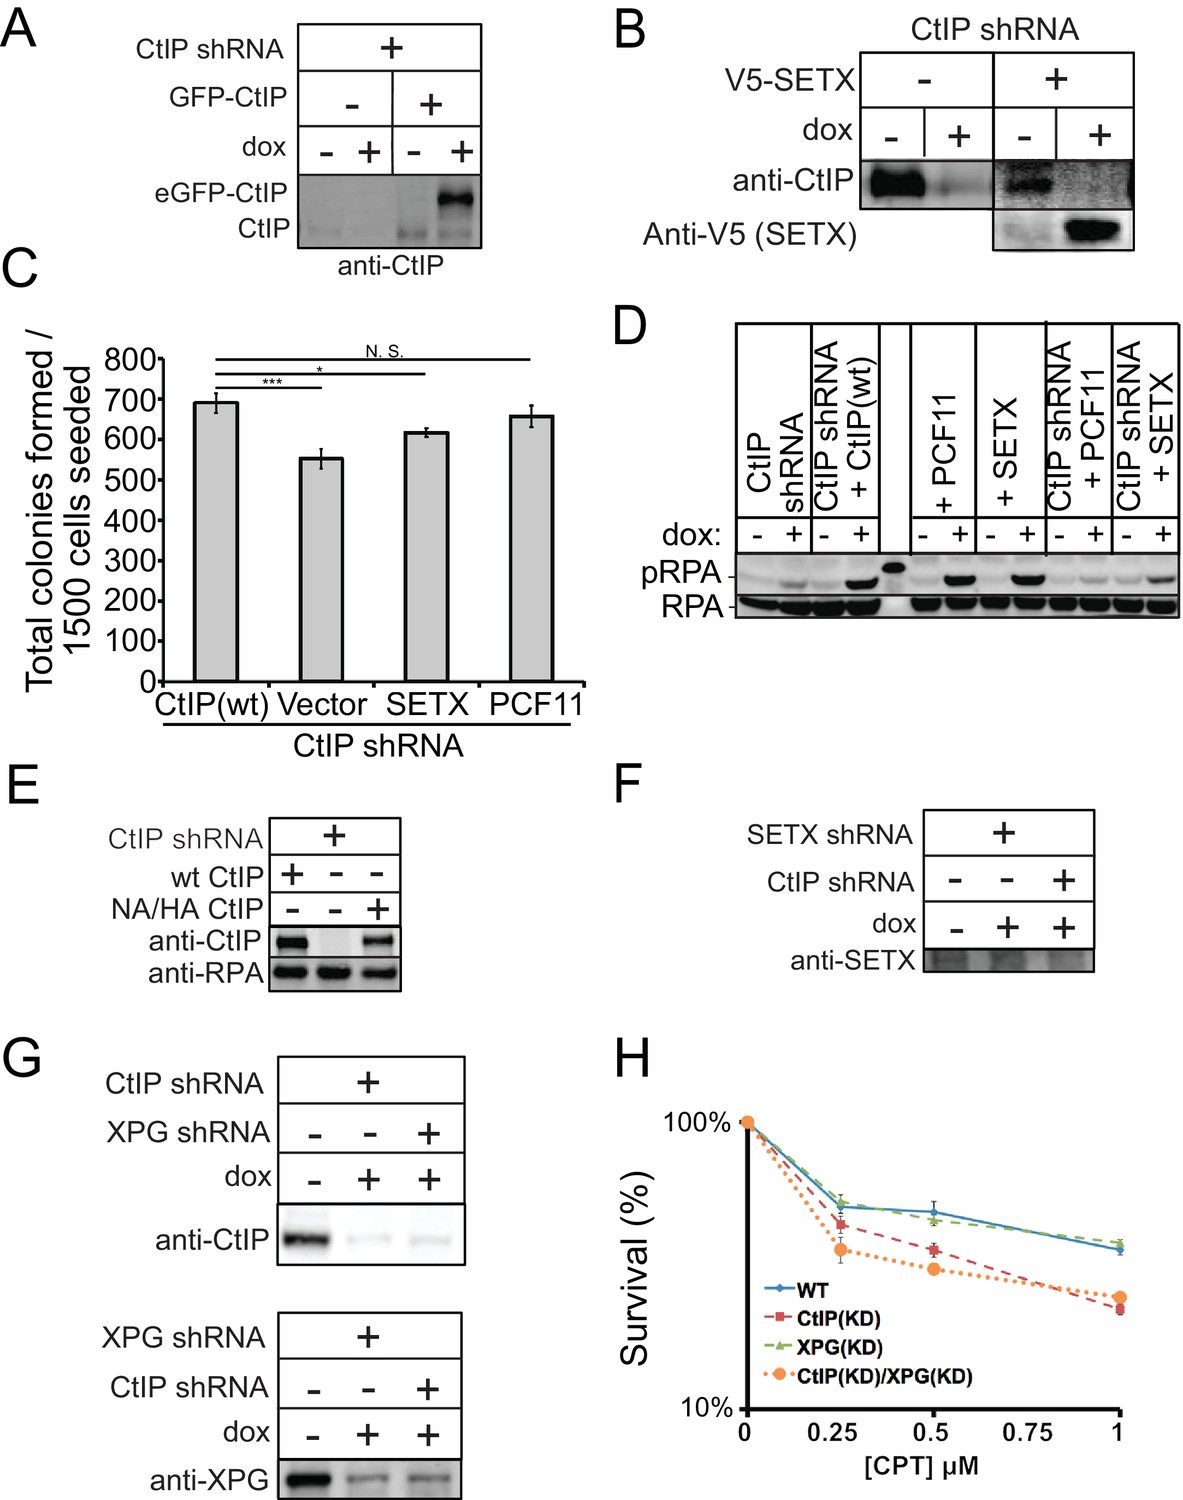
CtIP deficiency induces R-loop accumulation at sites of DNA damage.
(A) CtIP-depleted U2OS cells complemented with vector only or constructs overexpressing eGFP-CtIP, PCF11, or Senataxin (C-terminus) as indicated were exposed to increasing concentrations of CPT (1 hr). Cell viability was determined by clonogenic survival assay in comparison to untreated cells. Results are shown from three biological replicates and error bars represent S. D. (B) Wild-type or CtIP-depleted U2OS cells were pre-treated with DRB (20 μM) prior to CPT exposure and cell viability was determined as in (A). (C) Live cell imaging was performed with U2OS cells stably expressing RNaseHD10R-E48R-mCherry. The circle indicates the site of laser damage. (D) CtIP-depleted U2OS cells were complemented with eGFP-CtIP, PCF11, or Senataxin (C-terminus) as indicated and RNaseHD10R-E48R-mCherry accumulation at the laser damage was quantified. The average of 4 cells is shown and error bars represent S. E. M. (E) RNaseHD10R-E48R-mCherry accumulation at laser damage sites was measured in CtIP-depleted U2OS cells complemented with wild-type or nuclease deficient (‘NA/HA’) eGFP-CtIP as in (D); n > 12, error bars represent S.E.M. (F) Wild-type or CtIP-depleted U2OS cells were pre-treated with DRB (20 μM) prior to measurement of RNaseHD10R-E48R-mCherry accumulation at laser damage sites as in (D); n > 5; error bars represent S.E.M. (G) RNaseHD10R-E48R-mCherry accumulation at laser damage sites was measured in wild-type or CtIP-depleted, XPG-depleted, or Senataxin (SETX)-depleted U2OS cells as in (D); n = 5; error bars represent S.E.M. (H) RNaseHD10R-E48R-mCherry accumulation at laser damage sites was measured in wild-type, CtIP-depleted, XPG-depleted, or both CtIP/XPG-depleted U2OS cells as in (D); n > 8, error bars represent S.E.M. Results shown are representative of several experiments performed.
Figure 4—figure supplement 1
Senataxin overexpression partially rescues growth but not resection in CtIP-depleted human cells.
(A) CtIP depletion and the expression of eGFP-tagged wild-type CtIP was monitored by western blot with antibody directed against CtIP (Active Motif, #61141). (B) CtIP depletion with shRNA was performed in U2OS cells and validated by western blot with antibody specific for human CtIP. The C-terminal domain of Senataxin (a.a. 1851–2677) with a V5 tag was induced from a tetracycline-induced promoter in a stably integrated transgene and verified with antibody directed against V5. (C) Cell viability assays were performed in U2OS cells with CtIP depletion and overexpression of Senataxin c-term or full-length PCF11 as indicated. * and *** denote p < 0.05 or 0.001, respectively, using Student's two-tailed T test with comparisons as indicated. (D) Global resection was monitored by western blot for phospho-S4/S8 RPA32 antibody in U2OS cells depleted of shCtIP and complemented with GFP-CtIP, PCF11, or C-term of Senataxin (E) Depletion of CtIP and expression of wild-type (wt), or nuclease deficient (NA/HA) CtIP was monitored by western blot with antibody directed against CtIP. (F) (G) Depletion of Senataxin, CtIP, and XPG were monitored by western blot with antibodies directed against CtIP, XPG (GeneTex, #GTX110609) and Senataxin (Novus Biologicals, #NB100-57542), respectively. (H) CtIP, XPG, or CtIP/XPG-depleted U2OS cells were exposed to increasing concentrations of CPT (1 hr). Cell viability was determined by clonogenic survival assay in comparison to untreated cells. Results are shown from three biological replicates and error bars indicate S.D.
Figure 4—figure supplement 2
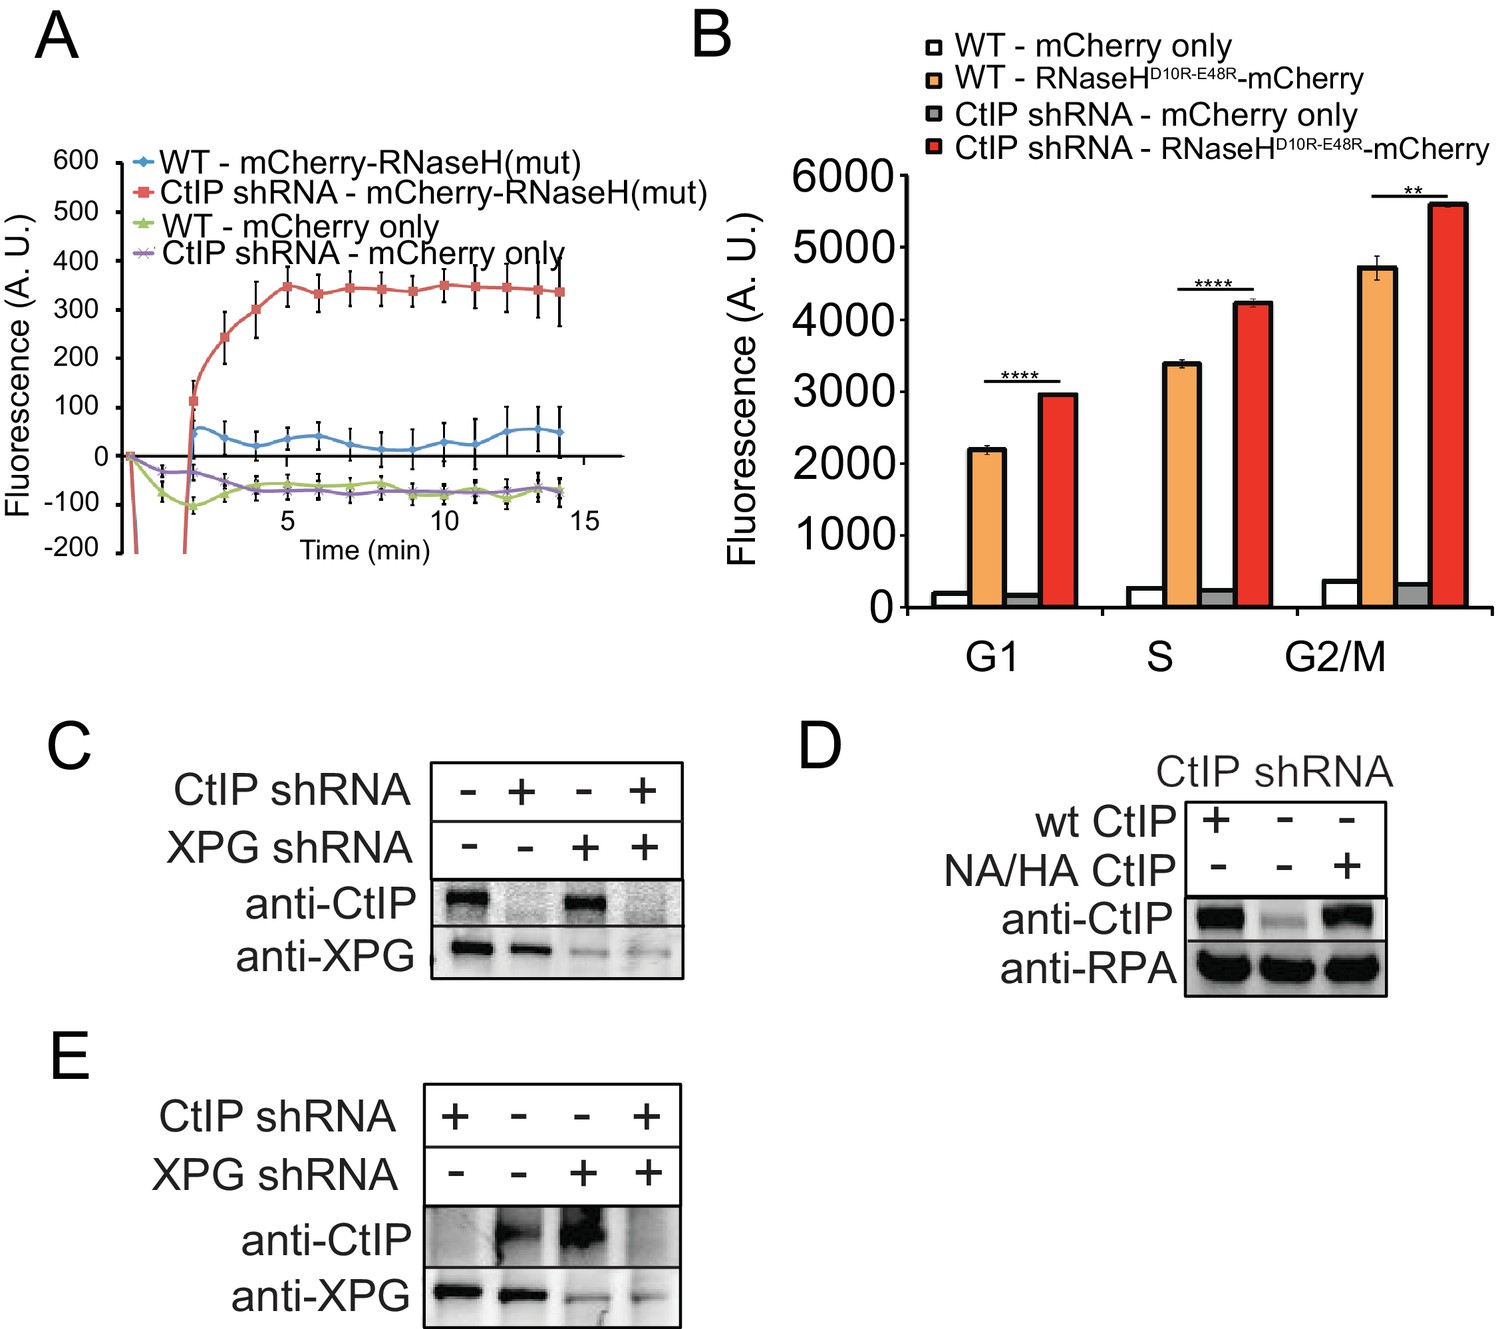
There is no effect of CtIP depletion on mCherry independent of RNaseH.
(A) Imaging of RNaseHD10R-E48R-mCherry or mCherry only was performed in U2OS cells with CtIP depletion as indicated. 7 and 3 cells were imaged for RNaseHD10R-E48R-mCherry and mCherry-only conditions, respectively. (B) Quantification of RNA/DNA hybrids using RNaseHD10R-E48R-mCherry or mCherry only, stably expressed in human U2OS cells by FACS in cells with CtIP depletion by shRNA. Cells were evaluated in G1, S, and G2 cell cycle phases as determined by DNA content (FxCycle Far Red Stain). ** and **** denote p < 0.01 or 0.0001, respectively, using Student's two-tailed T test with comparisons as indicated. (C) CtIP and XPG depletion with shRNA was performed in U2OS cells and validated by western blot with antibody specific for human CtIP or XPG, respectively. (D) CtIP depletion with shRNA and expression of wild-type or nuclease-deficient (NA/HA) mutant was performed in U2OS cells and validated by western blot with antibody specific for human CtIP. (E) CtIP and XPG depletion with shRNA was performed in U2OS cells and validated by western blot with antibody specific for human CtIP or XPG, respectively Figure 4—figure supplement 1.
Figure 5 with 1 supplement
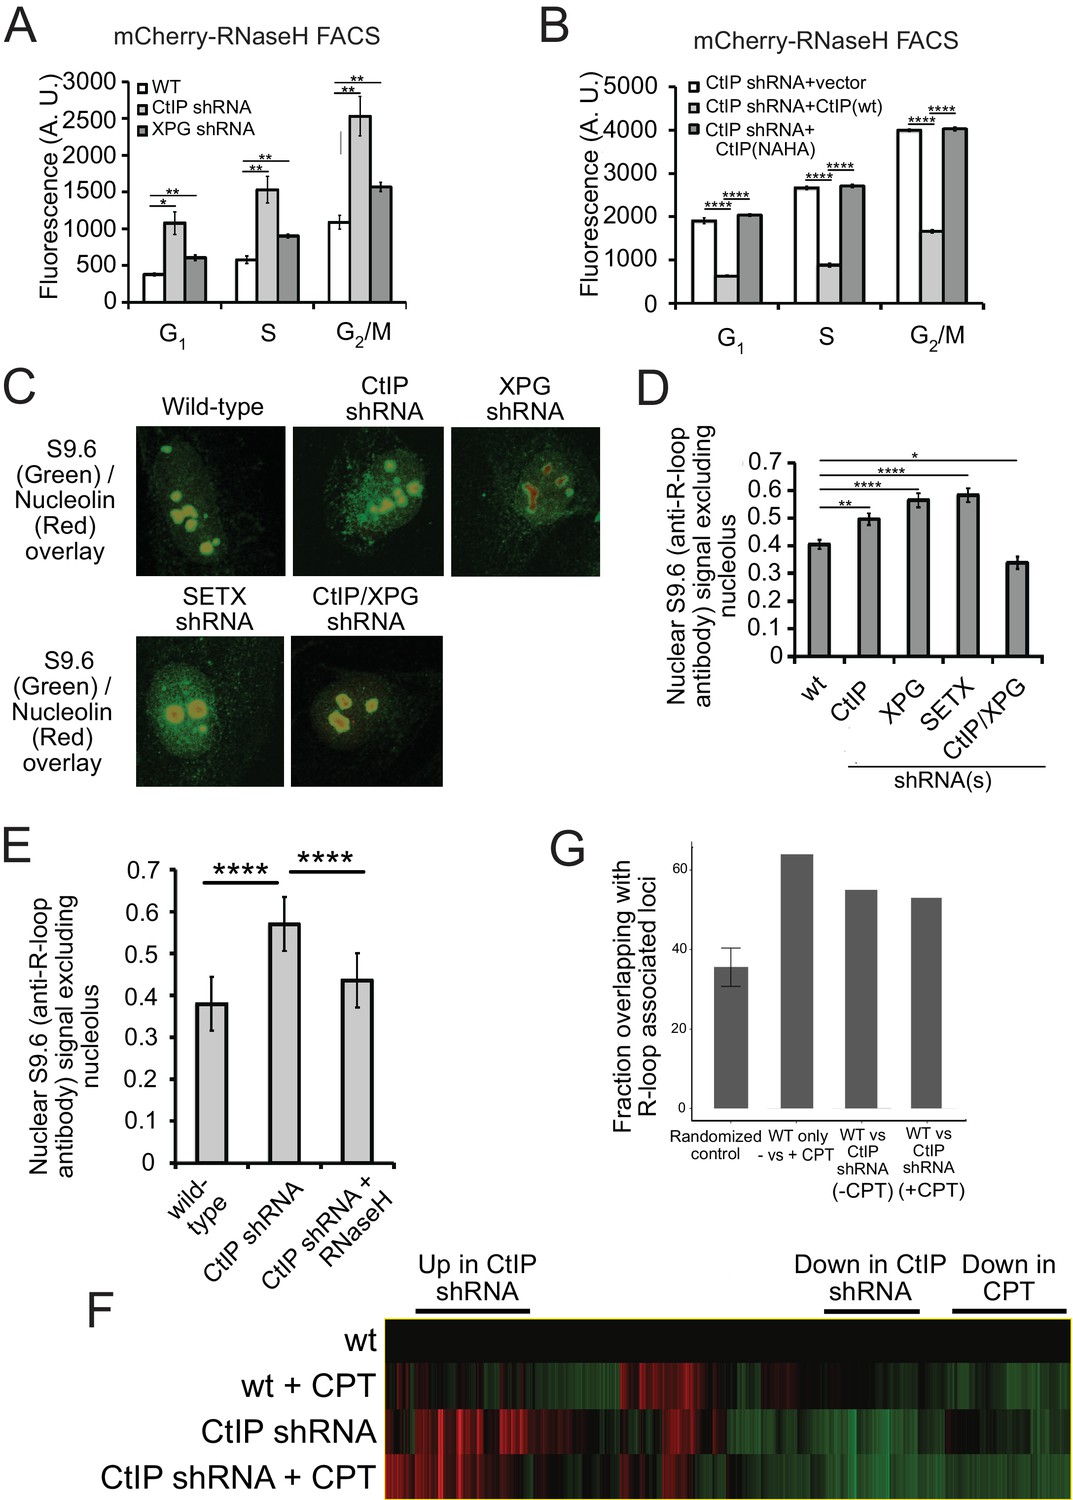
CtIP depletion affects R-loop accumulation and transcription in human cells.
(A) DNA-RNA hybrids were quantified in undamaged U2OS cells by monitoring chromatin-bound RNaseHD10R-E48R-mCherry by FACS. 10,000 cells were counted in each of 3 biological replicates; error bars represent S.D. * and ** denote p < 0.05 or 0.01, respectively in Student's two-tailed T test with comparisons as indicated. (B) RNA/DNA hybrids were quantified in undamaged, CtIP-depleted U2OS cells complemented with either vector only, eGFP-CtIP(wt), or nuclease-deficient eGFP-CtIP(NA/HA) as in (A). 10,000 cells were counted in each of 3 biological replicates; error bars represent S. D. **** denotes p < 0.0001 using Student's two-tailed T test with comparisons as indicated. (C) S9.6 antibody was used to monitor RNA-DNA hybrids in wild-type or CtIP-depleted U2OS cells. Anti-Nucleolin was used as a marker for the nucleolus. (D) Quantification of S9.6 antibody signal in wild-type, CtIP-depleted, XPG-depleted, Senataxin-depleted, or double CtIP/XPG-depleted U2OS cells as indicated. Signal overlapping the nucleolin signal was excluded from the analysis; n > 50, Error bars represent S.E.M. *, **, and **** denote p < 0.05, 0.01, and 0.0001, respectively, using Student's two-tailed T test with comparisons as indicated. (E) Quantification of S9.6 antibody signal in wild-type, CtIP-depleted, or CtIP-depleted plus RNaseH overexpression in U2OS cells as in (D). (F) Wild-type or CtIP-depleted U2OS cells were exposed to CPT (5 µM) or were untreated before harvesting of cellular mRNA. Analysis of transcripts by RNA-seq and hierarchical clustering of transcripts from 21,412 genes is shown as a heat map (red for over-expressed, black for unchanged expression, and green for under-expressed genes) in comparison to wild-type undamaged cells (see Supplementary file 3). (G) Statistical comparisons of overlap between the top 100 differentially expressed genes as ranked by DESeq differential expression p-value and DRIPc-seq peaks from GEO dataset GSE70189. Randomly picked genes were compared to this dataset (‘randomized control’) with the average of 35.56% and standard deviation 4.76% (estimated from 1000 simulations). Genes with significant differences between wild-type and CtIP-depleted cells were identified in the absence of DNA damage (‘WT vs CtIP shRNA (-CPT’)) as well as with CPT treatment (‘WT vs CtIP shRNA (+CPT’)) and were compared with the DRIPc-seq dataset. All three values are above the 99% confidence intervals for the null hypothesis that the genes showing the most evidence of differential expression overlapped the peak regions at the same rate as randomly selected genes.
Figure 5—figure supplement 1
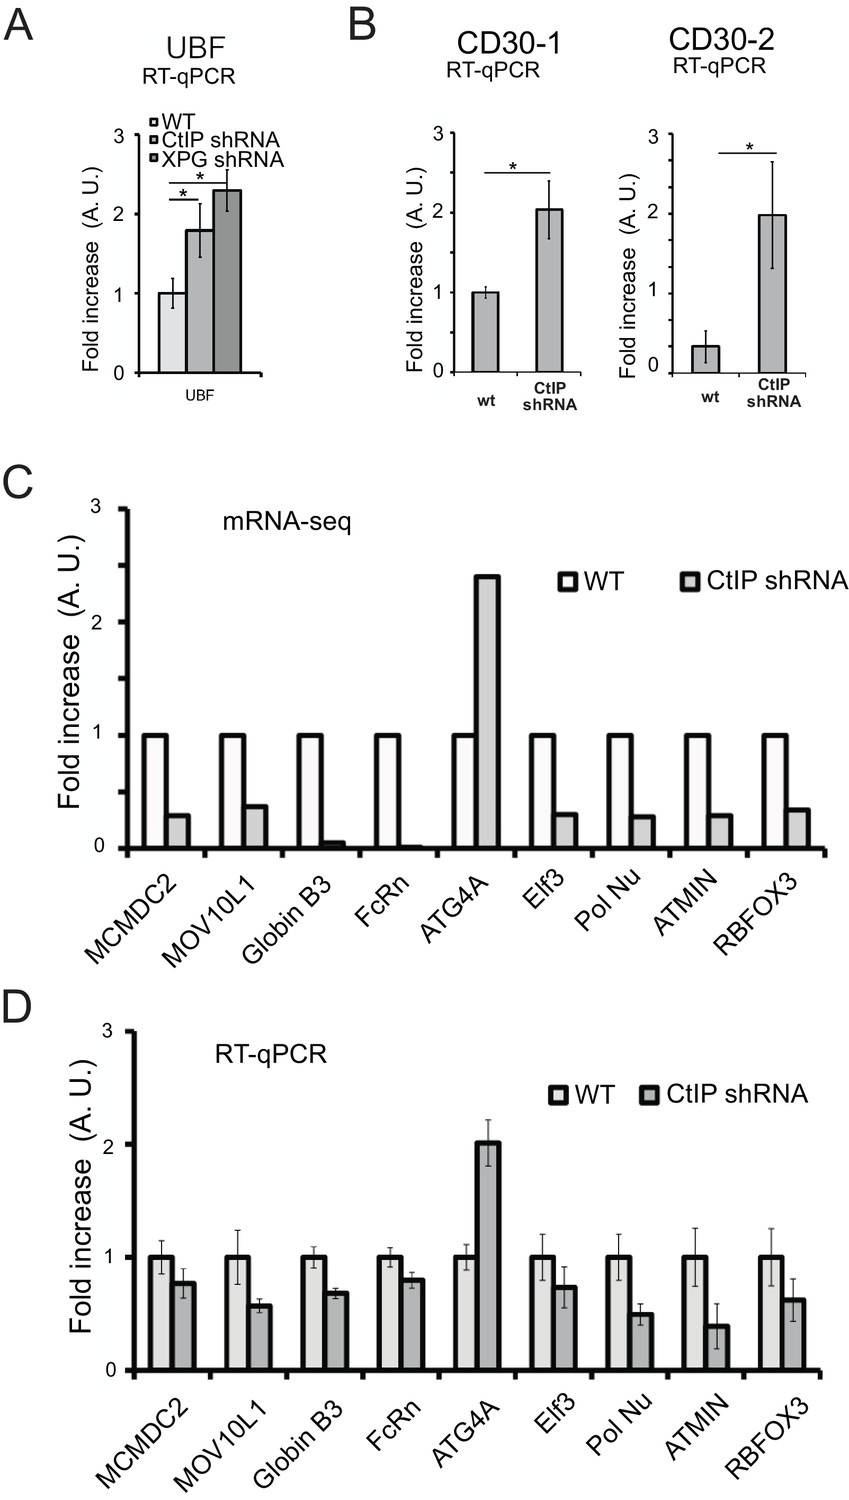
CtIP-depleted human cells show alterations in transcription of endogenous genes.
(A) (B) Quantification of mRNA expression by RT-qPCR in U2OS cells with or without CtIP shRNA as indicated, measuring transcripts at the UBF and CD30 genes. (C) Quantification of mRNA expression in U2OS cells with or without CtIP shRNA as indicated, from the RNAseq dataset (Supplementary file 3). (D) Quantification of mRNA expression in U2OS cells with or without CtIP shRNA as indicated, using RT-qPCR. Data shown is an average of 6 replicates, with error bars indicating S. D. * and *** denote p < 0.05 or 0.001, respectively, using Student's two-tailed T test with comparisons as indicated.
Figure 6 with 3 supplements
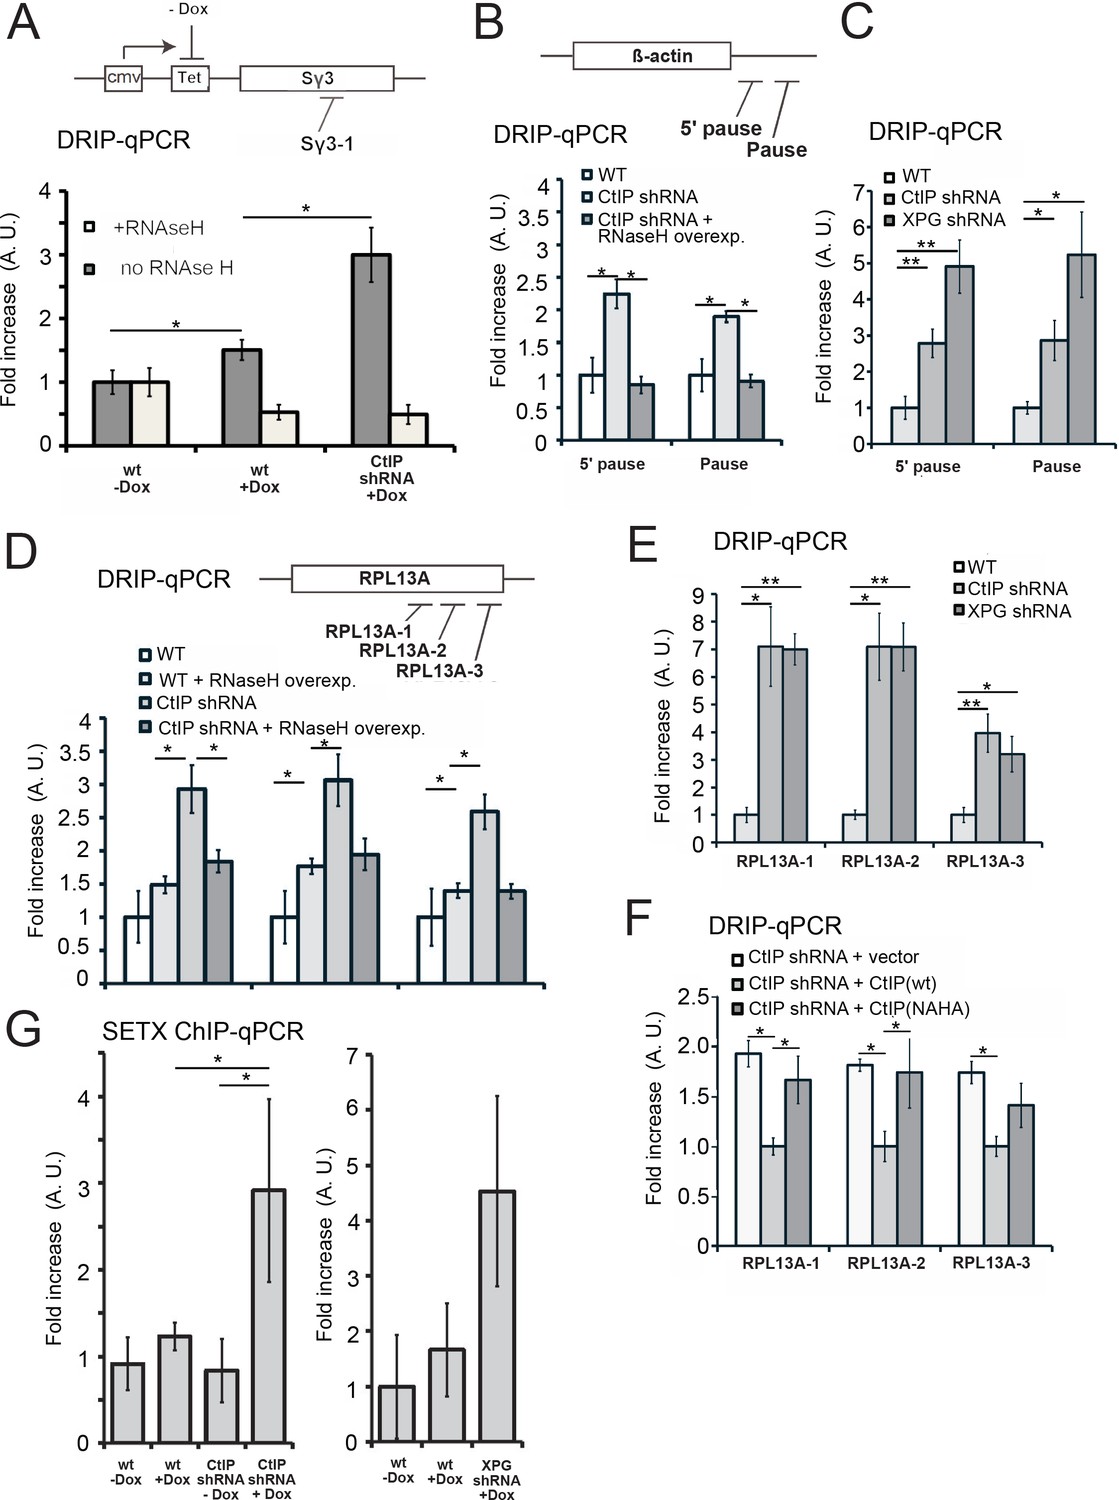
CtIP depletion induces accumulation of R-loops in human cells.
(A) RNA/DNA hybrids were quantified by DRIP-qPCR in U2OS cells containing a stably integrated, doxycycline-inducible transgene containing murine Sγ3 repeats. R-loop accumulation was measured by immunoprecipitation with the S9.6 antibody and qPCR for the Sγ3 region in the absence or presence of transcription (-/+Dox) in wild-type or CtIP-depleted cells; n > 6, error bars represent S.E.M. (B) Quantification of RNA/DNA hybrids in U2OS cells at endogenous loci using DRIP-qPCR. Levels of hybrids were measured at the ß-actin gene, with CtIP or XPG depletion, and with RNaseH overexpression in cells, as indicated; n > 3, error bars represent S. D. (C), (D), (E). DRIP-qPCR of sites in the RPL13A gene are shown with CtIP or XPG depletion and RNaseH overexpression in cells as indicated. In (F), CtIP-depleted cells were complemented with wild-type eGFP-CtIP or nuclease-deficient NA/HA mutant. (G) Senataxin ChIP was performed in cells containing the doxycycline-inducible transgene containing murine Sγ3 repeats. Levels of SETX occupancy were quantified in the presence or absence of doxycycline and with CtIP depletion as indicated and are represented as fold changes relative to wild-type cells in the absence of dox. n = 3, error bars represent standard deviation. * and ** denote p < 0.05 or 0.01, respectively, using Student's two-tailed T test with comparisons as indicated.
Figure 6—figure supplement 1
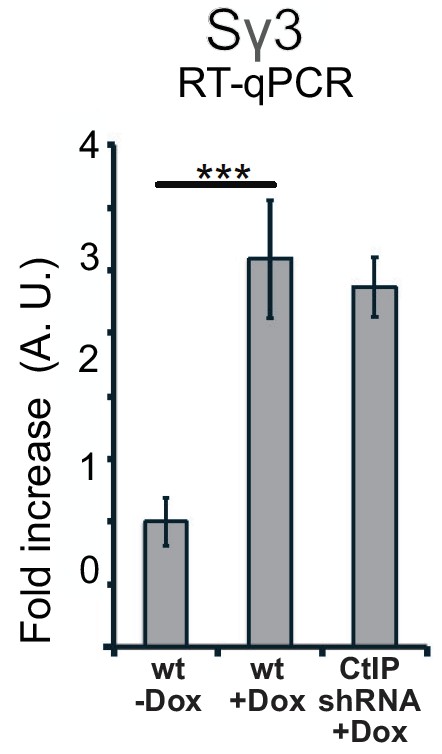
Sγ3 transcript levels are similar in wild-type and CtIP-depleted cells.
(A) Quantification of mRNA expression by RT-qPCR. A dox-inducible construct with murine Sγ3 repeats was stably integrated in U2OS cells, and the levels of the Sγ3 mRNA transcripts were measured in the absence or presence of transcription (dox) under wild-type or CtIP-depleted conditions. n > 6, Error bars represent S.D.
Figure 6—figure supplement 2
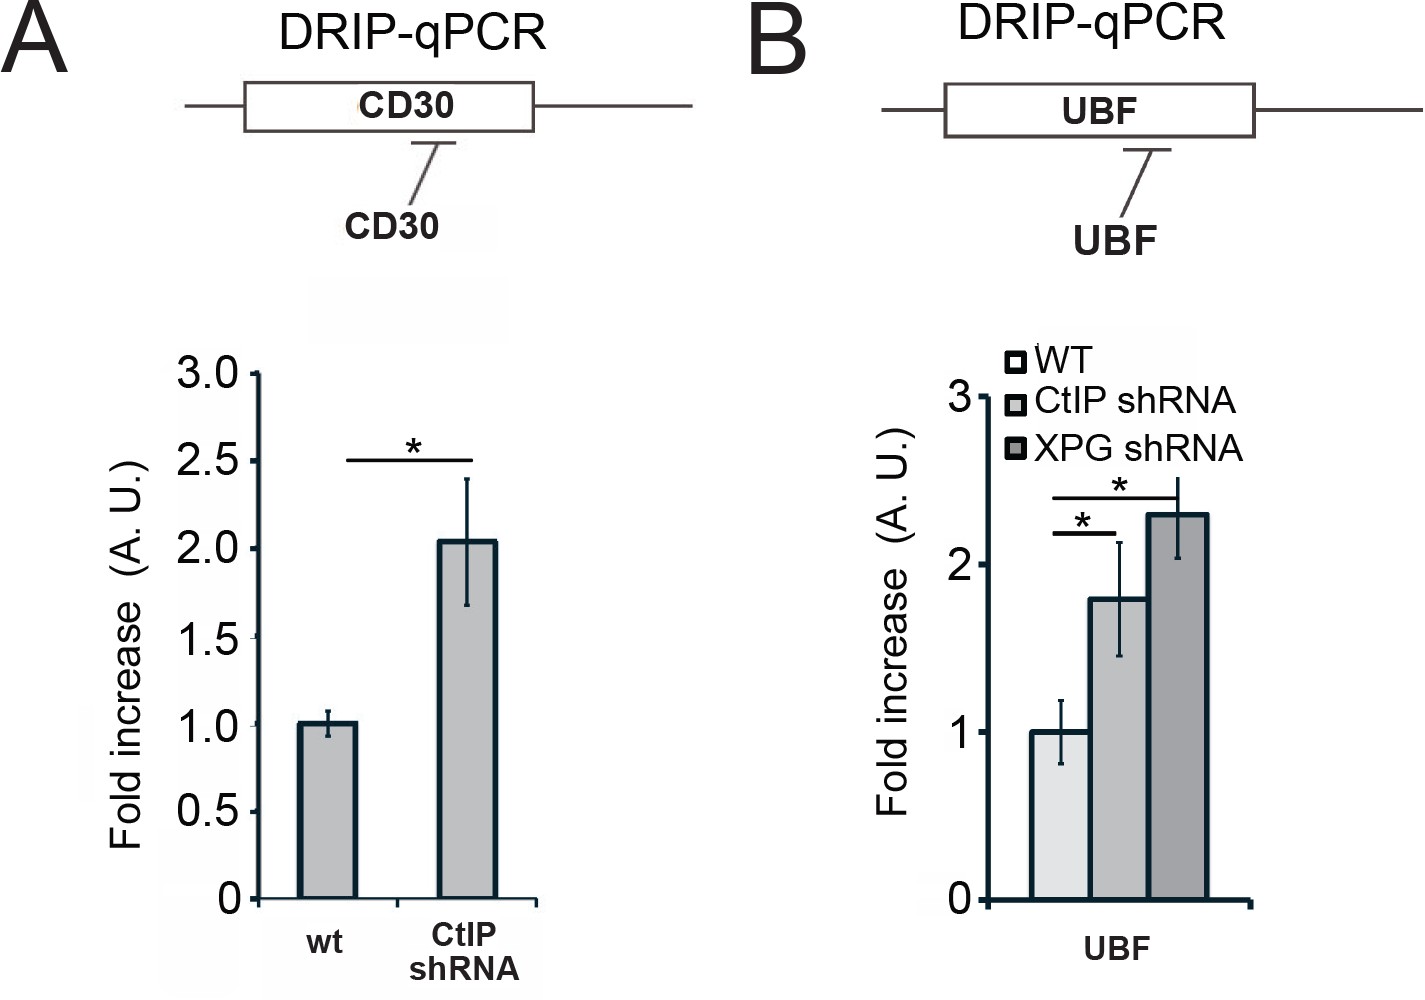
CtIP depletion generates R-loops at the CD30 and UBF loci in human cells.
Levels of RNA-DNA hybrids were measured with DRIP-qPCR as in Figure 6 at the CD30 (A) and the UBF (B) loci; n > 3, error bars represent S. D. * denotes p < 0.05 using Student's two-tailed T test with comparisons as indicated.
Figure 6—figure supplement 3
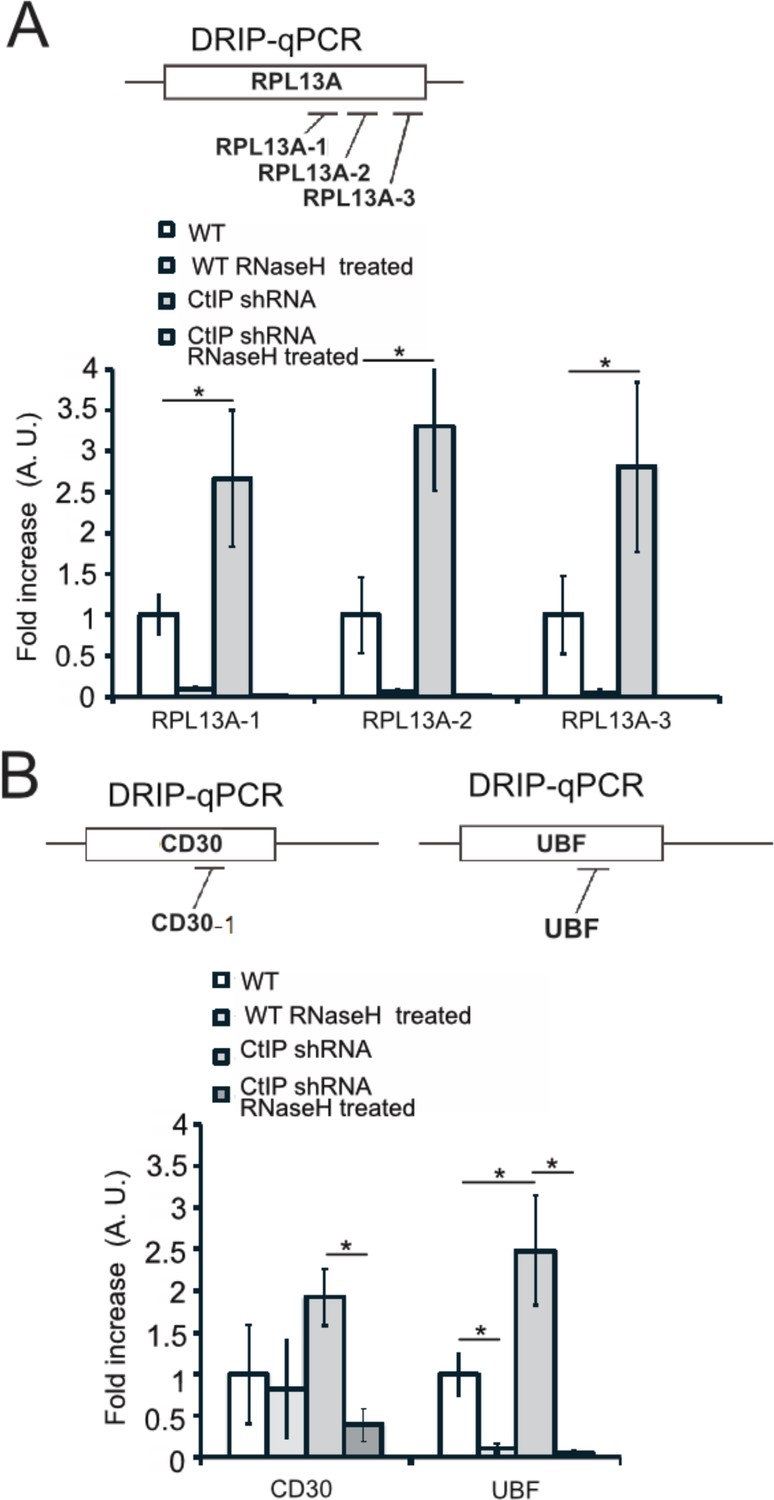
DRIP-qPCR signal is eliminated by RNaseH treatment in vitro.
(A) Diagram of qPCR primer locations in the RPL13A gene. DRIP-qPCR was performed in wild-type and CtIP-depleted cells as in Figure 6. Half of the sample was treated with RNaseH in vitro before the addition of the S9.6 antibody, ‘+RNaseH’ as indicated. n = 3, error bars represent standard deviation. * denotes p < 0.05 using Student's two-tailed T test with comparisons as indicated. (B) Diagram of qPCR primer locations in the CD30 and UBF genes. DRIP-qPCR was performed in wild-type and CtIP-depleted cells as in Figure 6. Half of the sample was treated with RNaseH in vitro before the addition of the S9.6 antibody, ‘+RNaseH’ as indicated. n = 3, error bars represent standard deviation. * denotes p < 0.05 using Student's two-tailed T test with comparisons as indicated.
Figure 7
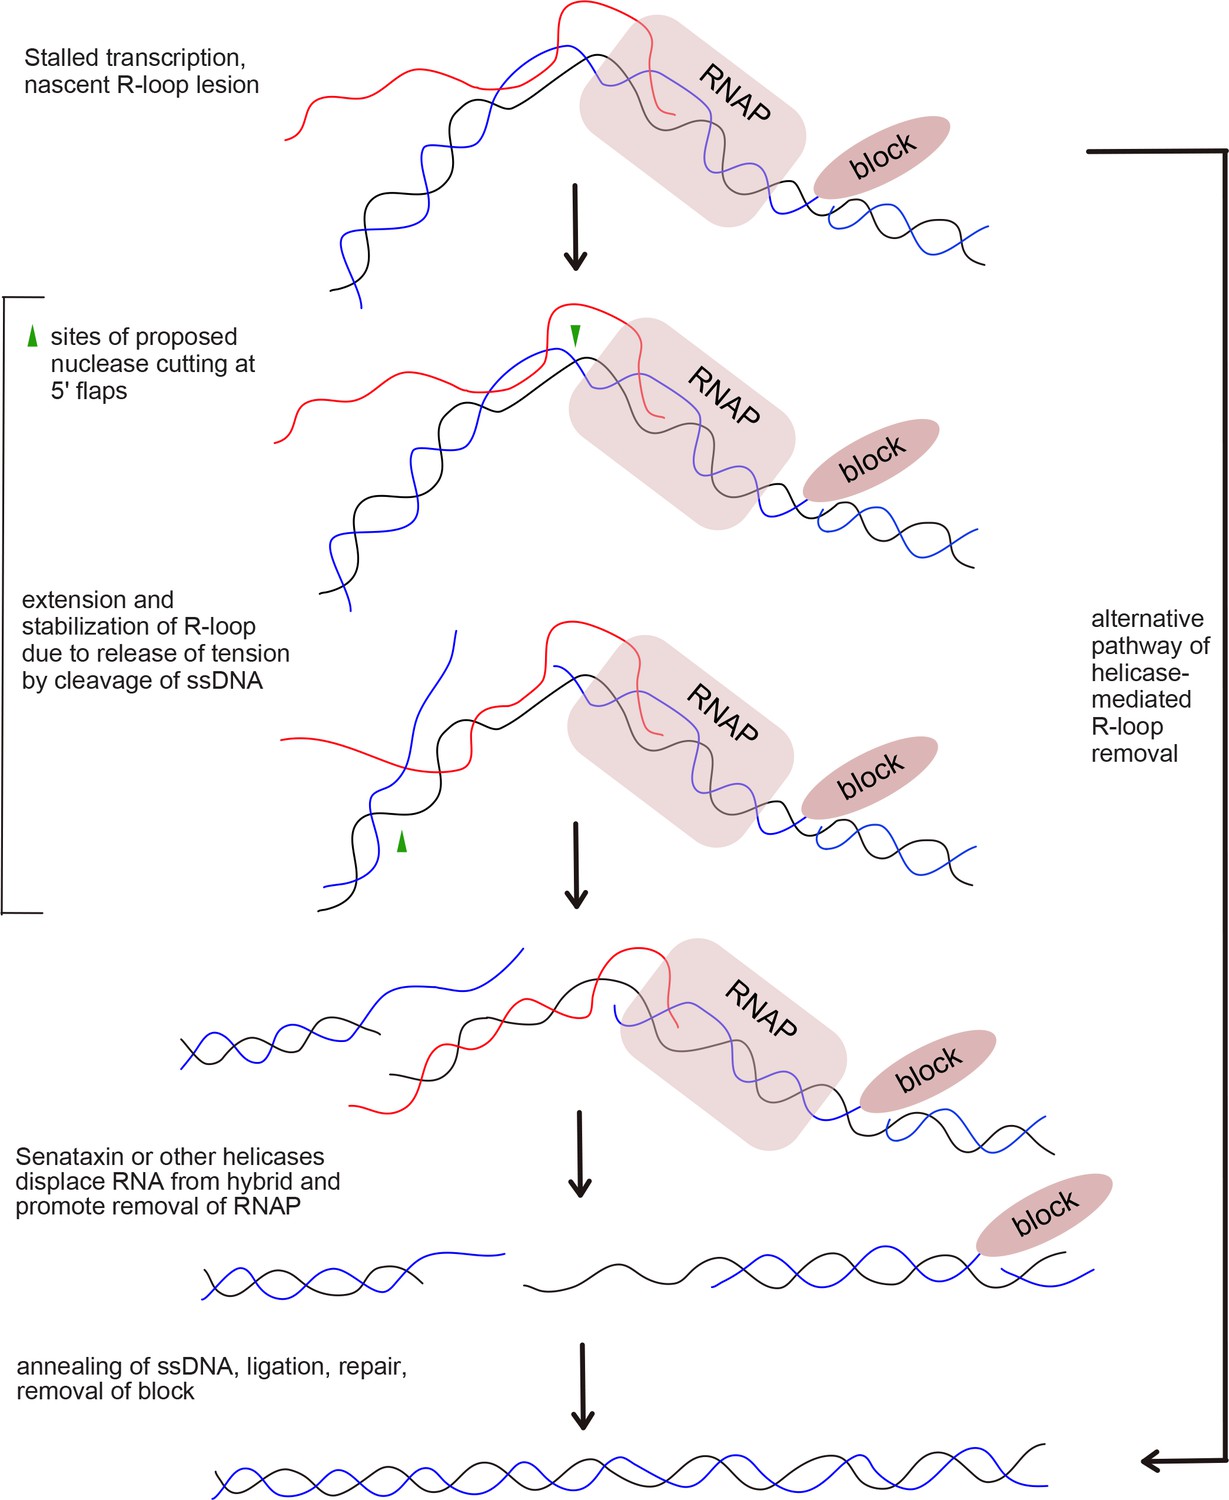
Proposed model of R-loop processing.
Polymerase stalling at sites of nicks, topoisomerase adducts (TopI adduct shown here on non-template strand), or other lesions generates a nascent R-loop structure (RNA shown in red). Cleavage of this nascent structure at one of 2 exposed 5ʹ flaps by nucleases, suggested in this work to be CtIP or XPG, can generate a stabilized, extended RNA-DNA hybrid because of the release of torsional constraint in the DNA template. Senataxin (or other helicases) preferentially access the RNA-DNA hybrid in this stabilized intermediate and remove the RNA, promoting reannealing of the displaced non-template strand and single-strand DNA repair. In this hypothetical model we do not know if one or both strands are cut, the timing or regulation of RNA polymerase removal, or the exact regulation of Senataxin activity at the lesion. A theoretical, alternative pathway of Sae2/CtIP-independent R-loop removal involving Senataxin is shown at right.
Figure 8
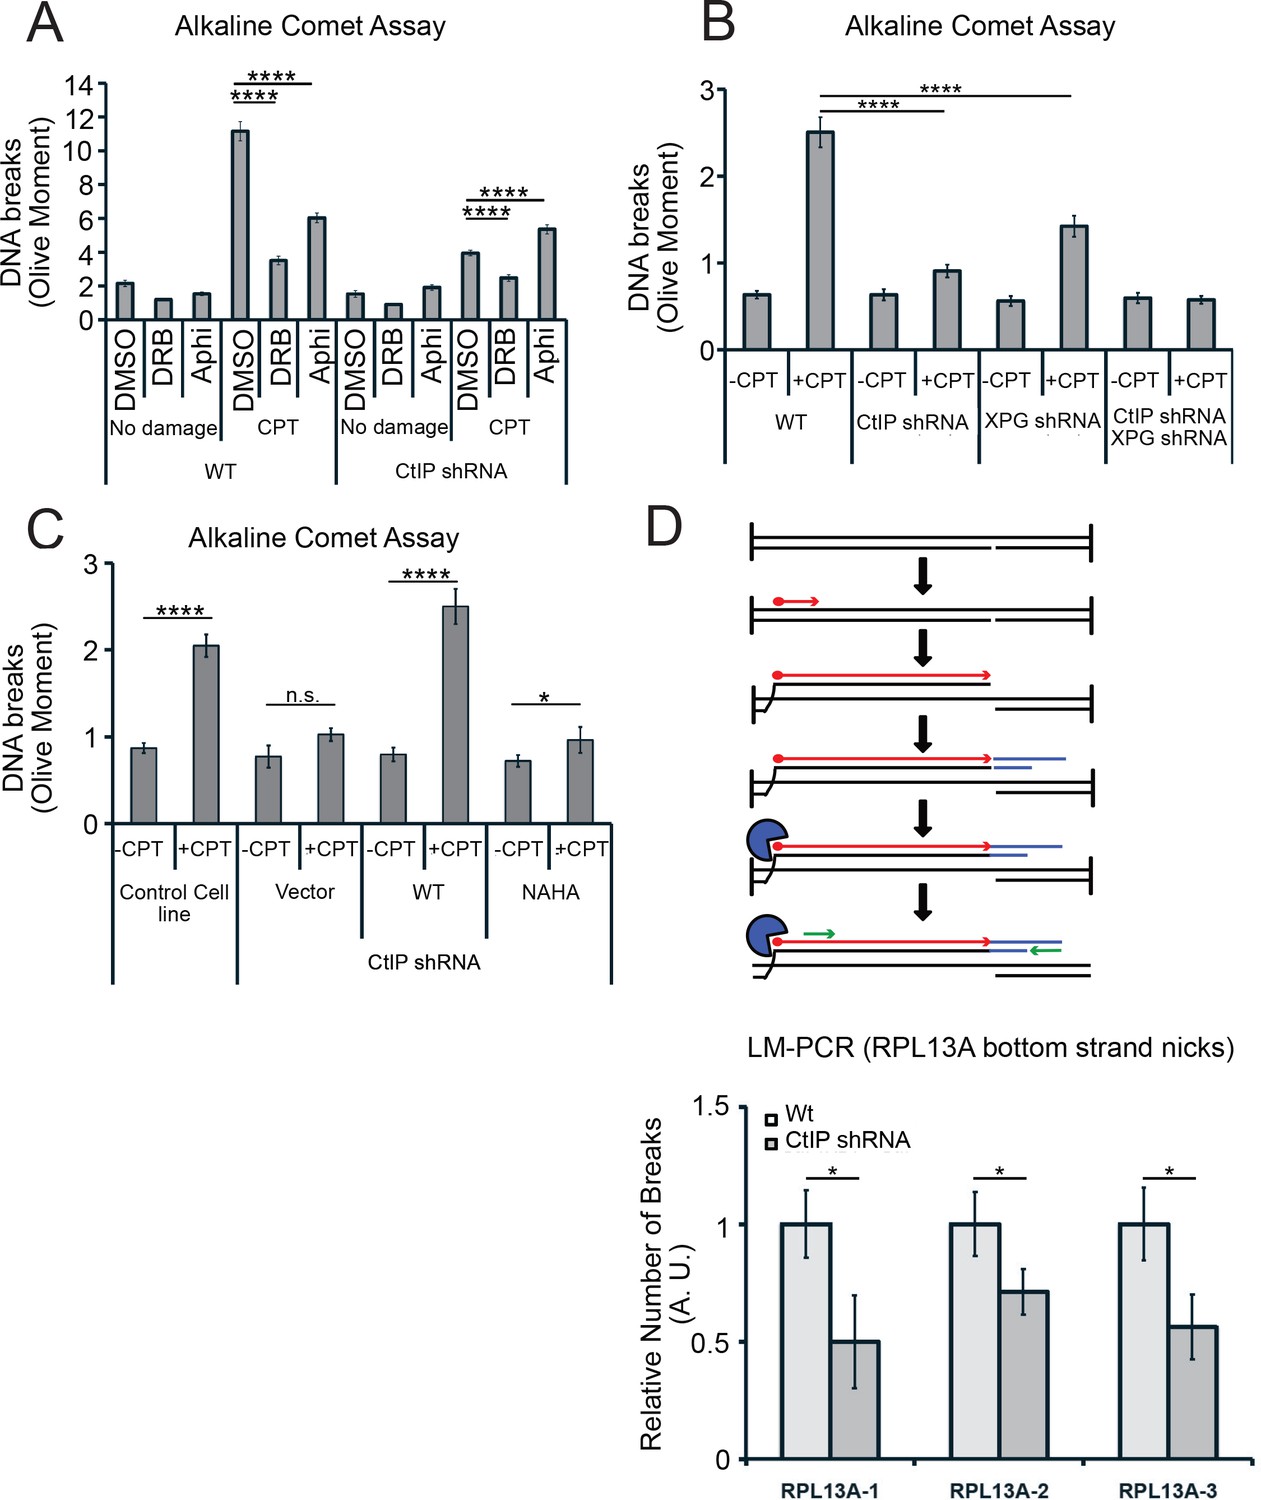
CtIP and its nuclease activity promote ssDNA break formation.
(A) DNA breaks were quantified in wild-type and CtIP-depleted U2OS cells by alkaline comet assay. Cells were untreated (DMSO) or exposed to 5 µM CPT for 1 hr, with DRB (20 µM) or aphidicolin (2 µg/mL) pretreatment as indicated. Olive moments were calculated by analyzing at least 100 comets for each sample; error bars represent S.E.M. (B) Quantification of ssDNA breaks by alkaline comet assay was performed in wild-type, CtIP-depleted, XPG-depleted, or CtIP/XPG-depleted U2OS cells as in (A). (C) Quantification of ssDNA breaks by alkaline comet assay was performed in wild-type or CtIP-depleted U2OS cells complemented with wild-type eGFP-CtIP or nuclease-deficient NA/HA mutant CtIP as in (A). (D) A schematic representation of Ligation-mediated (LM)-PCR assay (top). Primer extension with a biotinylated primer (in red) from genomic DNA produces a double-stranded DNA end that is isolated with streptavidin and amplified by ligation-mediated PCR (asymmetric duplex and nested primers are presented in blue and green, respectively). LM-PCR assay measuring DNA breaks on the bottom strand of the RPL13A gene (bottom). DNA single-strand breaks were measured by LM-PCR at the endogenous RPL13A locus in wild-type or CtIP-depleted cells; n = 6, error bars represent S.E.M. * and **** denote p < 0.05 or 0.0001, respectively, using Student's two-tailed T test with comparisons as indicated.
Author response image 1
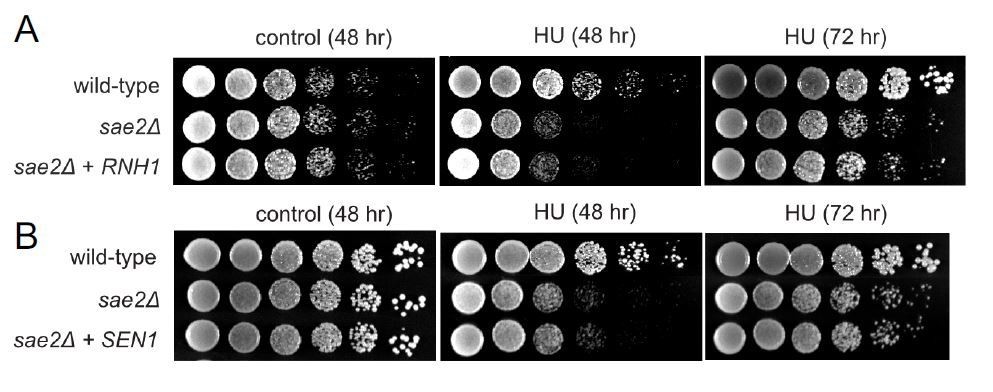
Overexpression of RNH1 or SEN1 does not suppress the sensitivity of Δsae2 strains to hydroxyurea (HU) exposure.
(A). RNH1 was induced from the GAL1 promoter on a CEN plasmid in Δsae2 compared to Δsae2 with vector only. Viability with or without HU (100 mM) was assessed at 48 hours or 72 hours as indicated. All plates contain galactose. (B). SEN1 was overexpressed from a CEN plasmid inΔsae2 compared to Δsae2 with vector only. Viability with or without CPT (5 μg/ml) was assessed at 48 or 72 hours as indicated on glucose-containing media.
Author response image 2

CtIP, XPG, or Senataxin-depleted cells exhibit higher levels of RNA-DNA hybrids.
(A) Human U2OS cells expressing shRNA specific for CtIP with or without RNaseH expression as indicated were analyzed using immunofluorescence with S9.6 antibody and with antinucleolin antibody which stains the nucleoli. S9.6 signal overlapping with nucleolin signal was substracted from the total signal and the data was normalized to the size of the nucleus. (B) Quantification of >50 cells from each cell line was performed. Error bars represent S.E.M. **** denotes p < 0.0001 using Student's two-tailed T test with comparisons as indicated.
Author response image 3
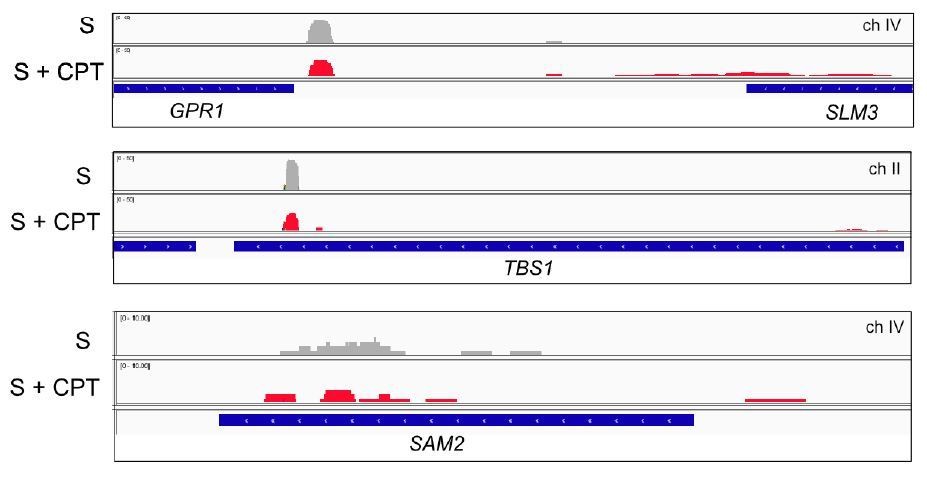
Browser view of Sae2-ChIP at the GPR1, TBS1, and SAM2 genes in sae2Δ cells expressing Flag-Sae2, in S phase with CPT exposure compared to S phase with no DNA damage.
Reads from the immunoprecipitated sample are shown (IP) in comparison to control immunoprecipitations performed in the absence of Flag antibody (bead control, BC).
Author response image 4
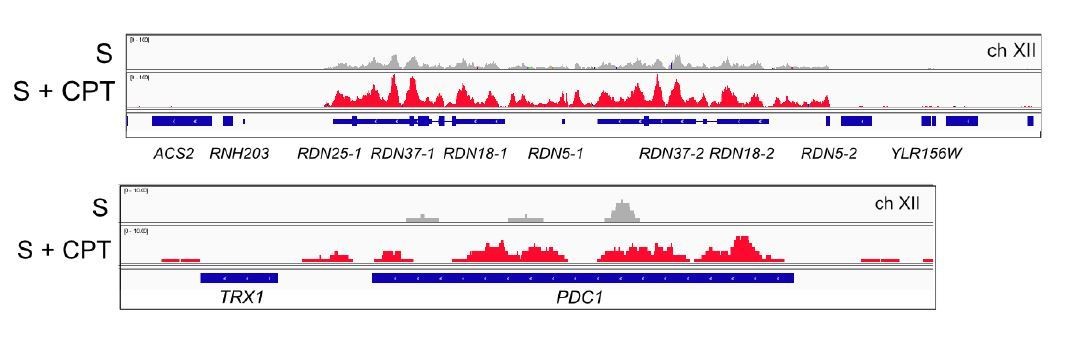
Browser views of Sae2-ChIP at the rDNA locus and the PDC1 locus on ch.XII in sae2Δ cells expressing Flag-Sae2, in S phase with CPT exposure compared to S phase with no DNA damage.
https://doi.org/10.7554/eLife.42733.027Tables
Key resources table
| Reagent type (species) or resource | Designation | Source or reference | Identifiers | Additional information |
|---|---|---|---|---|
| Strain, strain background (yeast) | yeast strains see supplementary file 1 | |||
| Cell line (human) | U2OS | ATCC | ||
| Cell line (human) | HEK-293T | ATCC | ||
| Cell line (human) | U2OS T-RexTM Flp-in | Jeff Parvin | U2OS Flp-in | Invitrogen tet-on system |
| Transfected construct (human) | pTP3146 | this study | GFP-CtIP | see Materials and methods |
| Transfected construct (human) | pTP3663 | this study | Flag-Bio-CtIP | see Materials and methods |
| Transfected construct (human) | pTP3665 | this study | Flag-Bio-CtIP(N289A/H290A) | see Materials and methods |
| Transfected construct (human) | pTP3531 | this study | C-term of Senataxin in pcDNA5/FRT/TO | see Materials and methods |
| Transfected construct (human) | pTP4195 | this study | PCF11 in pcDNA5/FRT/TO | see Materials and methods |
| Transfected construct (E. Coli) | pTP3492 | this study | wild-type RNaseH-mCherry in pcDNA5/FRT/TO | see Materials and methods |
| Transfected construct | pTP3494 | this study | mCherry only in pcDNA5/FRT/TO | see Materials and methods |
| Transfected construct (E. Coli) | pTP3493 | this study | RNaseHI-D10R-E48R in pcDNA5/FRT/TO | see Materials and methods |
| Transfected construct (E. Coli) | pTP3660 | this study | RNaseHI-D10R- E48R in lentivirus vector | see Materials and methods |
| Transfected construct | pRSITEP--U6Tet-(sh)-EF1-TetRep-2A-shRNA-CtIP | Cellecta | inducible shRNA for CtIP | see Materials and methods |
| Transfected construct | pTP3703 | this study | inducible shRNA for XPG | see Materials and methods |
| Transfected construct | pTP3677 | this study | inducible shRNA for SETX | see Materials and methods |
| Transfected construct | pTP4195 | this study | Sγ3 sequence in pcDNA5/FRT/TO | see Materials and methods |
| Other | primers see supplementary file 4 |
Additional files
-
Supplementary file 1
Yeast strain list.
- https://doi.org/10.7554/eLife.42733.018
-
Supplementary file 2
Sae2 ChIP-seq data.
- https://doi.org/10.7554/eLife.42733.019
-
Supplementary file 3
CtIP RNA-seq data.
- https://doi.org/10.7554/eLife.42733.020
-
Supplementary file 4
Oligonucleotides.
- https://doi.org/10.7554/eLife.42733.021
-
Transparent reporting form
- https://doi.org/10.7554/eLife.42733.022
Download links
A two-part list of links to download the article, or parts of the article, in various formats.
Downloads (link to download the article as PDF)
Open citations (links to open the citations from this article in various online reference manager services)
Cite this article (links to download the citations from this article in formats compatible with various reference manager tools)
Sae2/CtIP prevents R-loop accumulation in eukaryotic cells
eLife 7:e42733.
https://doi.org/10.7554/eLife.42733


