Conserved allosteric pathways for activation of TRPV3 revealed through engineering vanilloid-sensitivity
- National Institute of Neurological Disorders and Stroke, National Institutes of Health, United States
- University of Utah, United States
Figures
Figure 1 with 1 supplement
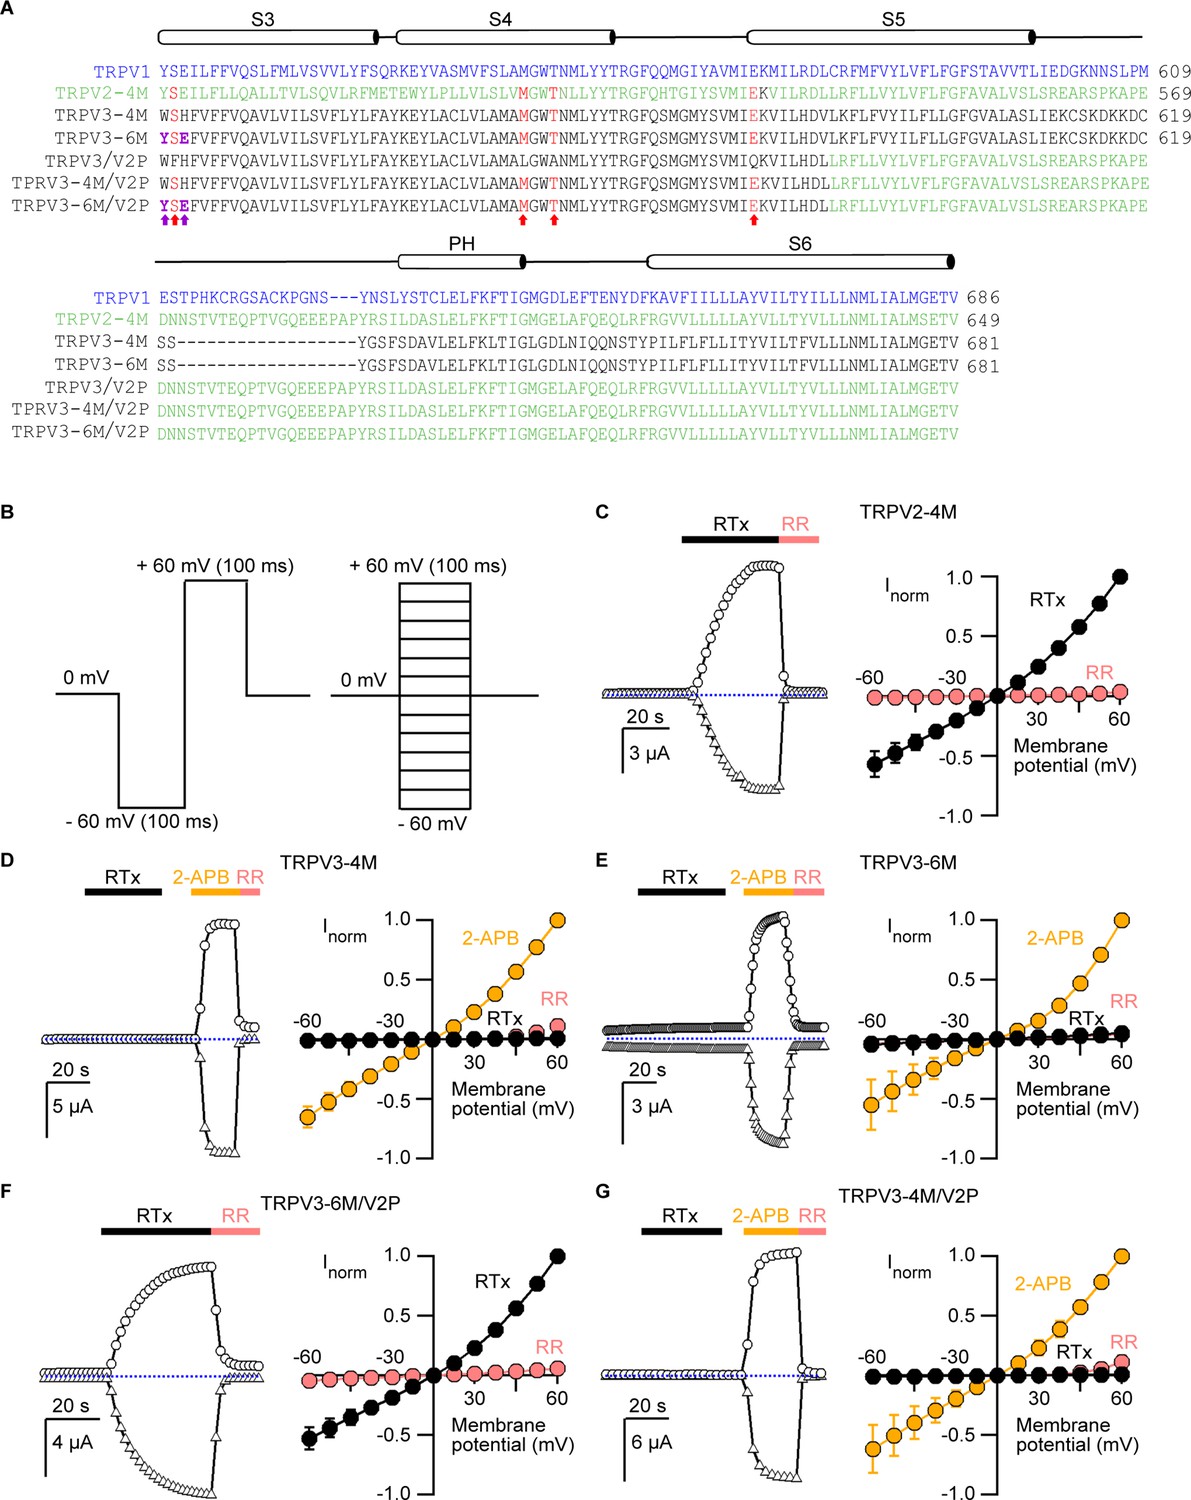
Engineering an RTx-binding site into the TRPV3 channel.
(A) Sequence alignment of S3 through S6 TM helices of rat TRPV1 (blue), rat TRPV2-4M (F472S/L507 M/S510T/Q530E, green), mouse TRPV3-4M (F522S/L557M/S560T/Q580E, black), mouse TRPV3-6M (W521Y/H523E/F522S/L557M/A560T/Q580E, black) and mouse TRPV3 chimeras containing the pore domain of rat TRPV2 (TRPV3/V2P). Key residues involved in RTx binding in TRPV2-4M and TRPV3-4M that were mutated to the corresponding residues in TRPV1 are shown in red, with the two additional mutations (W521Y/H523E) in TRPV3-6M shown in purple and bold. (B) Voltage protocols used to measure time courses for activation (left) or I-V relations (right). In both cases voltage steps were elicited every 2 s. (C-G, left panel) Representative time courses of activation in response to RTx (100 nM) or 2-APB (3 mM) measured at ±60 mV. 50 μM ruthenium red (RR) was applied at the end of each recording to inhibit the channel. The dotted horizontal line indicates the zero-current level. The thick colored horizontal lines indicate the application of agonists or RR. (C-G, right panel) Mean normalized I–V relations obtained in the presence of 100 nM RTx (black), 3 mM 2-APB (yellow) and 50 μM RR (red-filled symbols). Currents were normalized to the current value in the presence of a saturating concentration of 2-APB (3 mM) or RTx (100 nM) at +60 mV. Data are expressed as mean ± S.E.M (n = 4–8 cells).
Figure 1—figure supplement 1
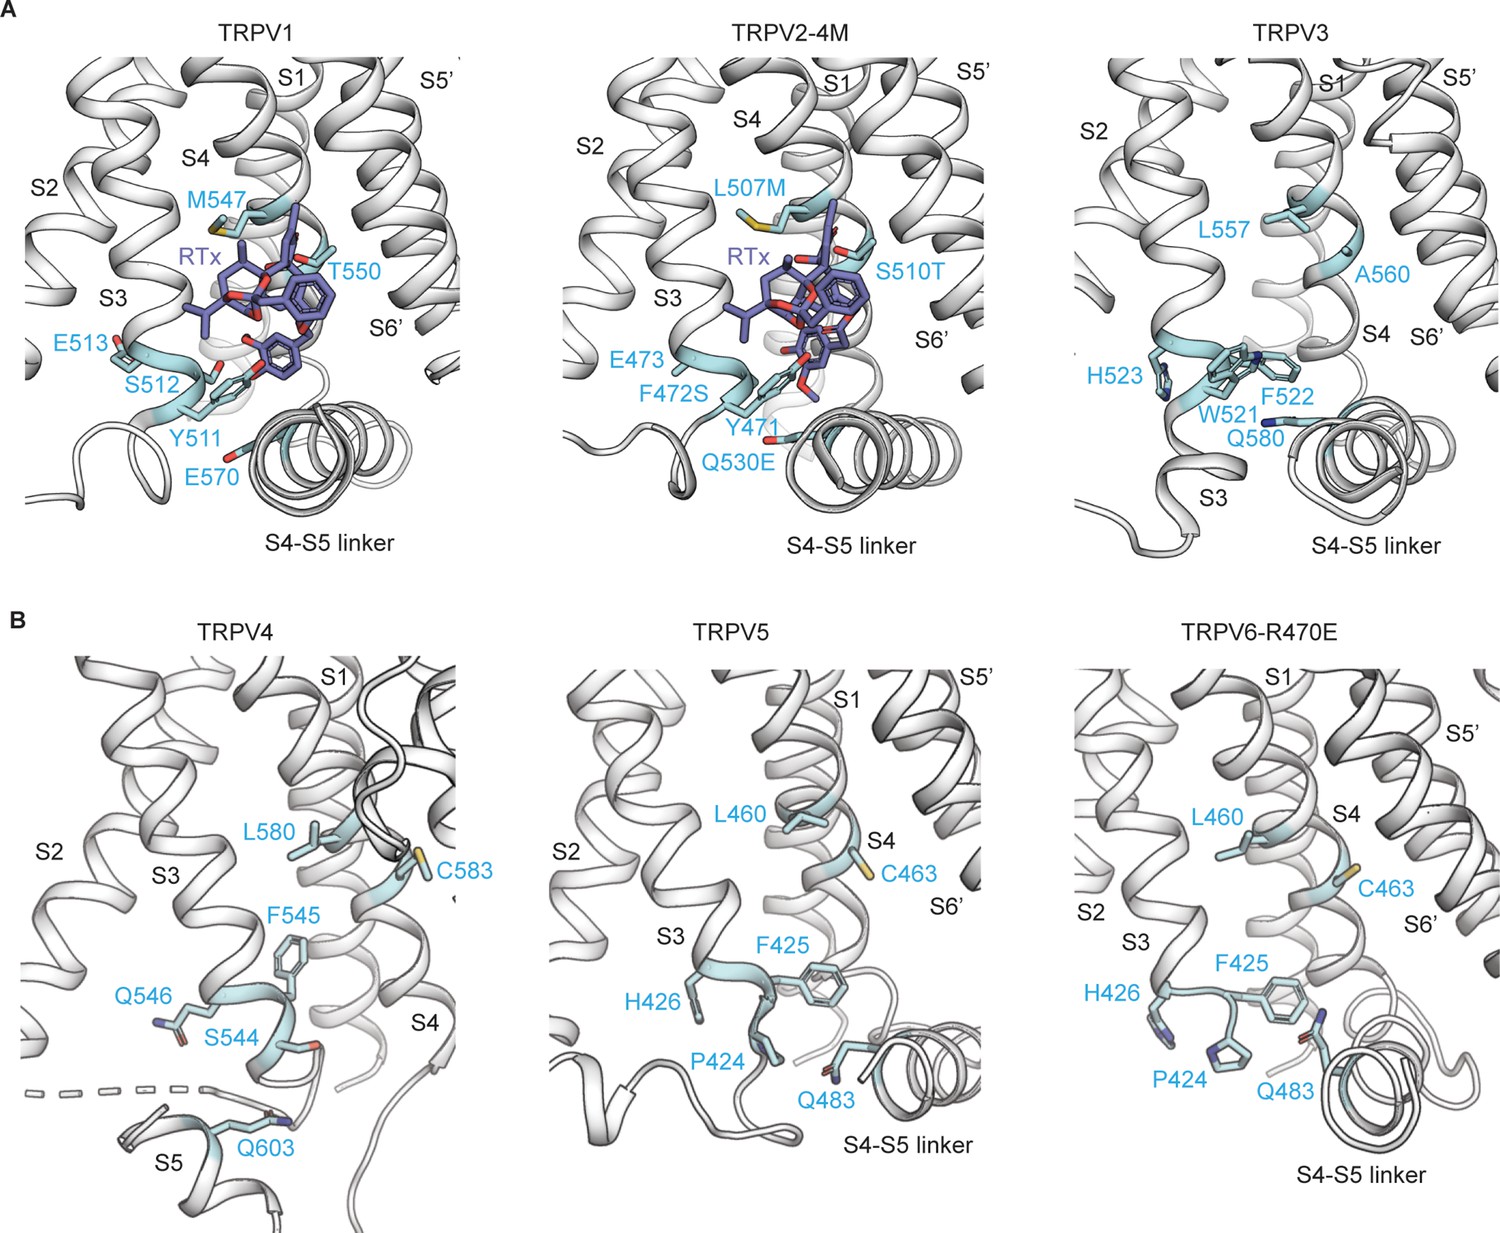
The vanilloid-binding pocket in the TRPV family.
(A) Cartoon representation of the vanilloid-binding pocket formed by the S1–S4 helices of one subunit and the pore domain of the adjacent subunit (S5’ and S6’) depicted for rat TRPV1 (in complex with RTx and DkTx, PDB: 5IRX) (Gao et al., 2016), rabbit TRPV2-4M (in complex with RTx, PDB: 6BWJ) (Zubcevic et al., 2018b) and mouse TRPV3 (in complex with 2-APB, together with the Y564A mutation, PDB: 6DVZ) (Singh et al., 2018). The residues corresponding to the 6M mutations are depicted in light blue. RTx is shown in dark blue. Structures are shown in equivalent orientations based on structural alignments obtained in Pymol with the cealign command. (B) Cartoon representation of the regions corresponding to the vanilloid-binding pocket for zebrafish TRPV4 (PDB: 6BBJ) (Deng et al., 2018), rabbit TRPV5 (in complex with econazole, PDB: 6B5V) (Hughes et al., 2018a) and human TRPV6 (R470E mutant, PDB: 6BOA) (McGoldrick et al., 2018), aligned as in (A). The residues equivalent to the 6M mutations are shown as sticks in light blue. The S6’ was omitted from the TRPV4 figure to allow clearer visualization of the pocket.
Figure 2 with 2 supplements

Identification of key residues for RTx activation in the pore domain of TRPV3-6M.
(A) Sequence alignment of the S3 to S6 TM helices for rTRPV1, rTRPV2-4M, mTRPV3-6M, WT mTRPV3, TRPV3-5PM and TRPV3-4PM. Residues labeled with stars are conserved in TRPV1 and TRPV2 but different in TRPV3; black stars – mutations that did not influence RTx activation; blue - mutations that enabled moderate (light blue) or strong (dark blue) responses to RTx. The purple highlights denote the 6M mutations. (B) Representative time courses of activation of TRPV3-6M channels with individual pore mutations. Channels were stimulated by RTx (100 nM) and 2-APB (3 mM), and blocked with RR (50 μM) as indicated by the colored horizontal lines. Currents were measured at +60 (circles) and −60 mV (triangles) as in Figure 1. The dotted horizontal lines indicate the zero-current level. (C) Summary of the current magnitudes activated in response to RTx relative to saturating 2-APB at +60 mV from experiments as in (B). Values for individual oocytes are shown as open circles and mean ±S.E.M. as squares (n = 3–6). (D) Side view of a cartoon representation of the transmembrane domain of a mTRPV3 subunit (apo, closed structure, PDB: 6DVW) (Singh et al., 2018). The side-chains of residues that enable strong RTx activation when mutated are shown in dark blue, for those that enable weak RTx activation in light blue and for mutations without effect in light grey. Residues within the RTx-binding pocket that were mutated in the 6M construct are highlighted in purple. Helices are shown with 20% transparency, to visualize all side-chains.
Figure 2—figure supplement 1
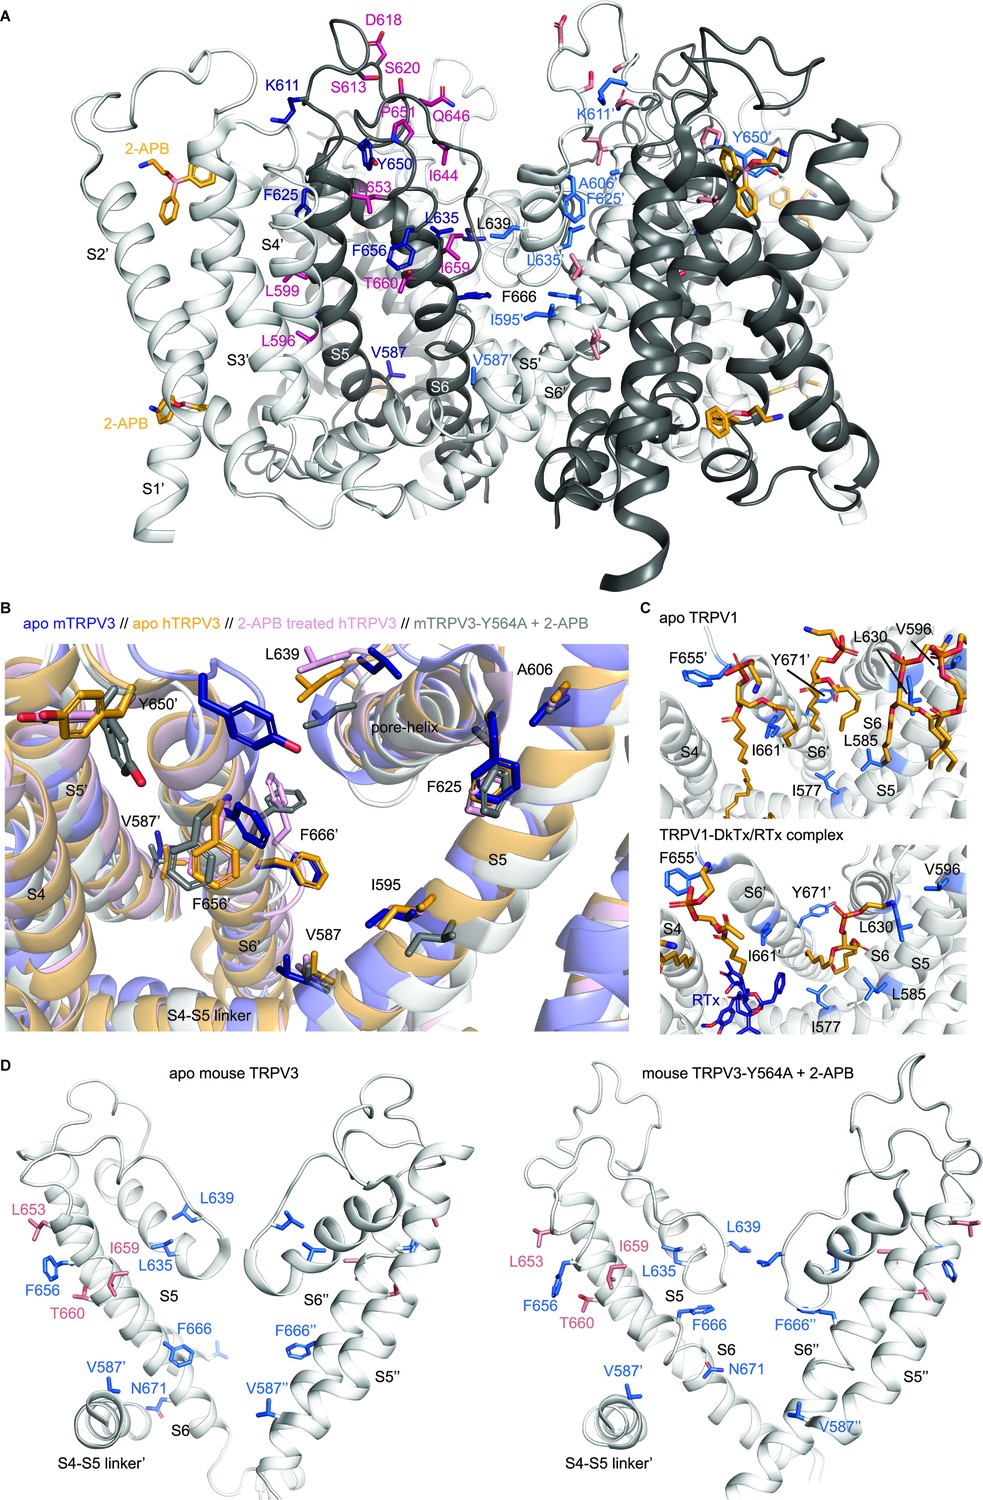
Structural mapping of point mutations in the pore domain of TRPV3.
(A) Side view of the transmembrane domain of the 2-APB-bound, open structure of mouse TRPV3-Y564A channel (PDB: 6DVZ) (Singh et al., 2018). Adjacent subunits are colored white or dark-grey for contrast. The two 2-APB molecules per subunit assigned to non-protein densities in the transmembrane domain are shown as sticks in orange, with the third 2-APB molecule below the transmembrane domain not shown. Residues that enabled responses to RTx when mutated in TRPV3-6M are shown in sticks for the two subunits at the front, colored either in dark-blue (dark-grey subunit) or lighter blue (white subunit). Residues that did not affect responses to RTx when mutated are shown either in magenta (dark-grey subunit, with labels) or pink (white subunit). Residue labels for F666 and L639, which face the ion-conduction pathway, are shown in black. (B) Structural changes in mouse and human TRPV3 at a protein/membrane interface facing the RTx-binding site. Structures for apo mouse TRPV3 (dark blue, PDB: 6DVW), 2-APB-bound, open mouse TRPV3-Y564A (white, PDB: 6DVZ) (Singh et al., 2018), apo human TRPV3 (yellow, PDB: 6MHO) and 2-APB-sensitized human TRPV3 (pink, PDB: 6MHS) (Zubcevic et al., 2018a) were superimposed using the cealing function in Pymol. Residues and transmembrane helices from one of the two adjacent subunits depicted in the figure are denoted by an apostrophe. Residues that when mutated enabled RTx responses in TRPV3-6M and that are facing that interface are shown in stick representation. (C) Lipids assigned to non-protein densities at the same interface as in (B) shown as orange sticks for the structures of apo TRPV1 (top panel, PDB: 5IRZ) and RTx/DkTx-bound TRPV1 (bottom panel, PDB: 5IRX) in nanodiscs (Gao et al., 2016). Equivalent residues to those that enabled responses to RTx when mutated in TRPV3-6M are shown as sticks in light-blue, and RTx in dark-blue. The labels for the two adjacent subunits depicted are differentiated by an apostrophe. (D) Conformational changes in the pore of mouse TRPV3 as a result of activation by 2-APB (Singh et al., 2018). The pore domains of two opposite subunits are depicted, with the S4-S5 linker of a third subunit shown for reference. Residues in the S6 helices, selectivity filter and pore helices that enabled RTx activation are shown in blue, and those without effect in pink. The side-chain of N671 is also shown to highlight the change in the pore-facing residues in S6 as a result of the α to π transition from the apo (PDB: 6DVW) to the 2-APB-activated state (PDB: 6DVZ).
Figure 2—figure supplement 2
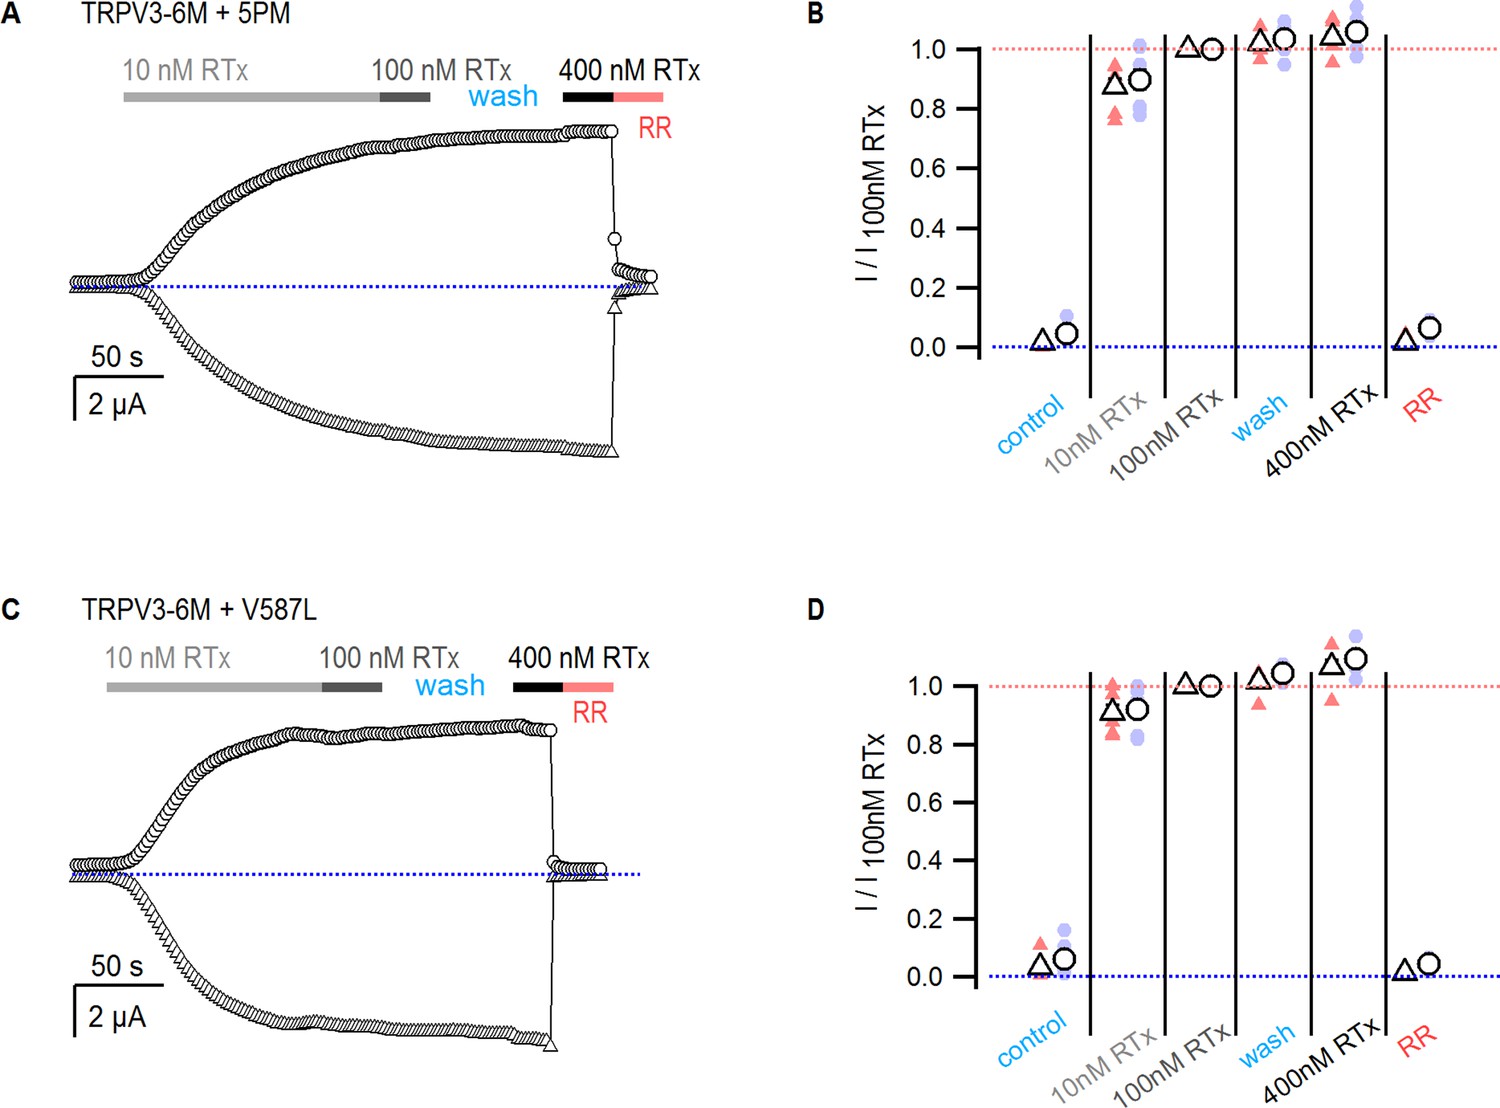
RTx exhibits high apparent affinity and slow dissociation.
(A, C) Representative time-courses for activation of (A) TRPV3-6M + 5 PM and (B) TRPV3-6M + V587L by three concentrations of RTx obtained at −60 (triangles) and +60 mV (circles), followed by inhibition by ruthenium red (50 µM). The blue-dotted lines denote the zero-current level. (B, D) Current magnitude relative to that activated by 100 nM RTx at −60 (triangles) and +60 mV (circles) for the conditions indicated in the figure, obtained from time courses as in (A) and (C). The mean ± S.E.M. are shown as open symbols, and data from individual oocytes are shown as colored circles (n = 7–8). The blue and red-dotted lines denote the zero and one levels, respectively.
Figure 3 with 2 supplements
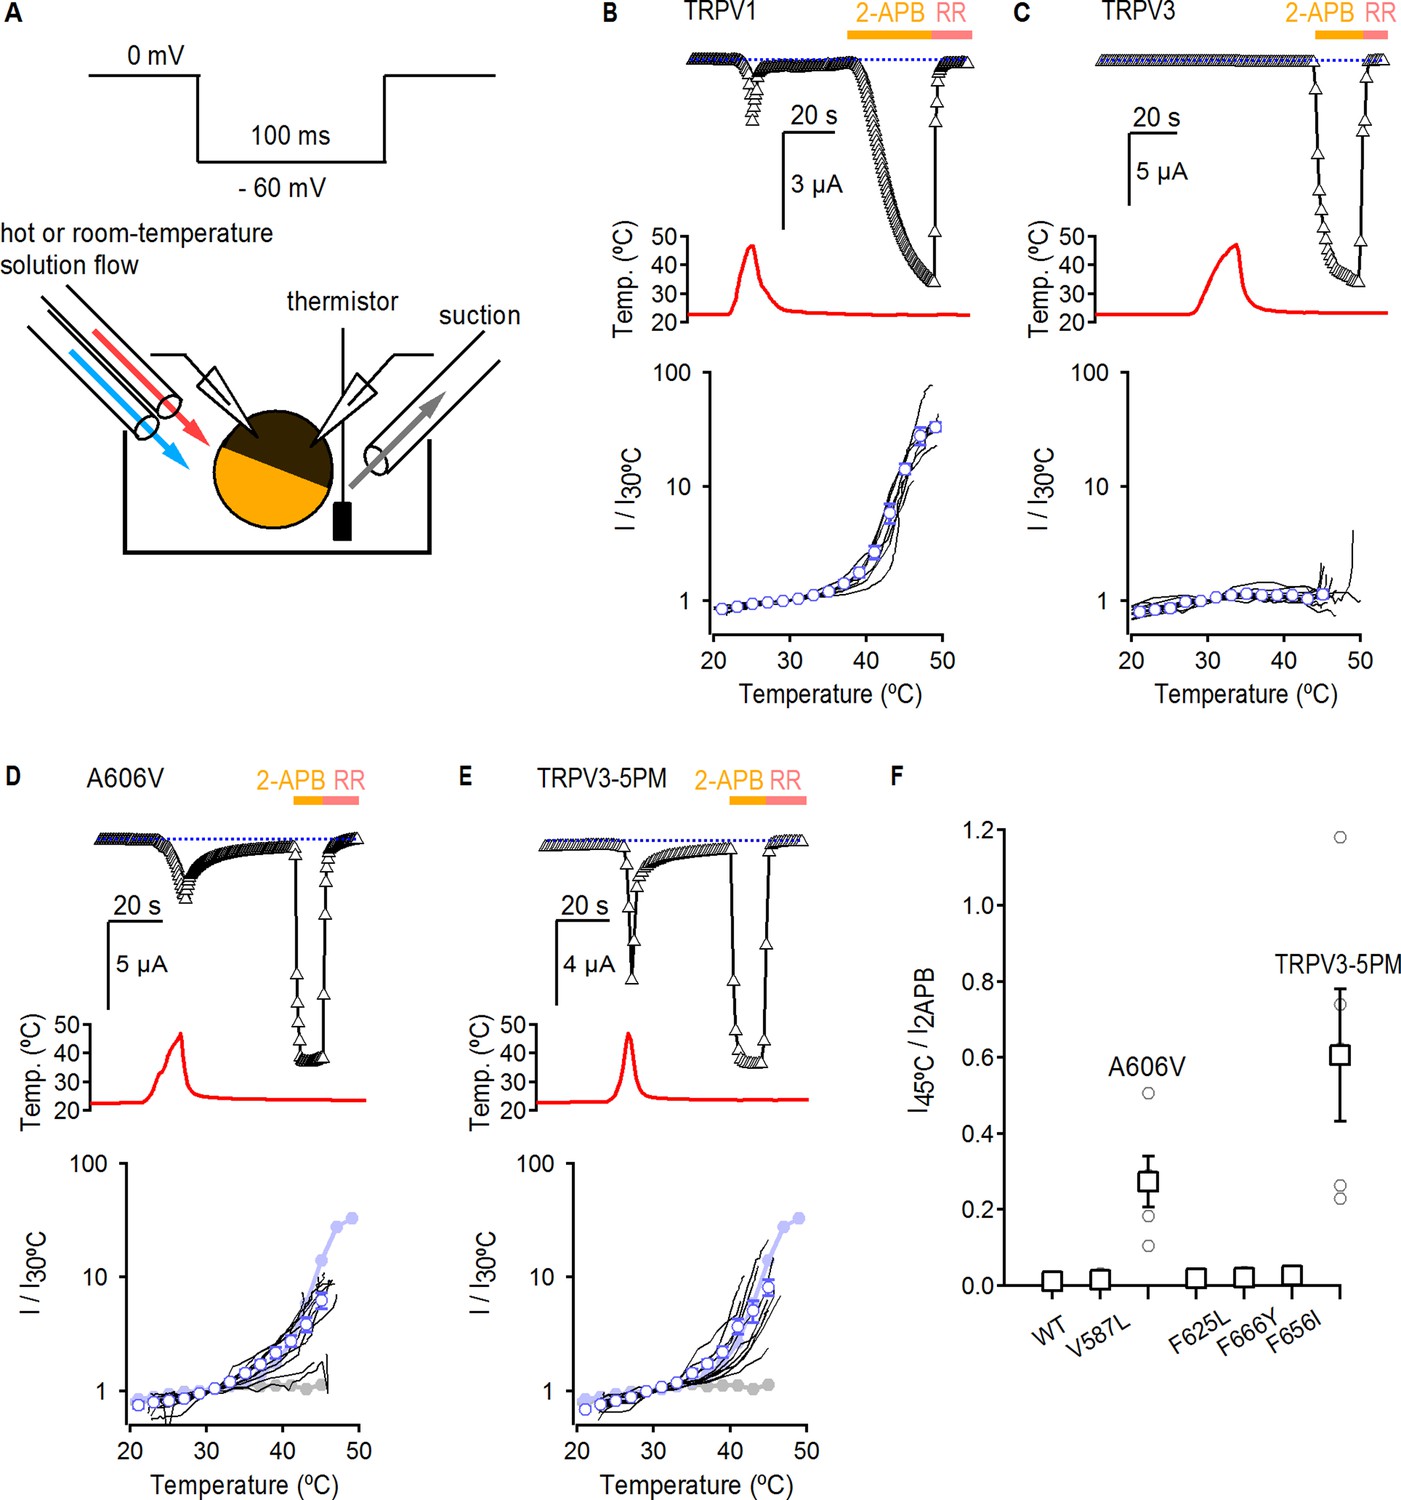
Temperature sensitivity of TRPV3 constructs.
(A) Voltage protocol used for recording the temperature responses (top), and a cartoon of the temperature-control system used for the experiments (bottom). Temperature was controlled by using two perfusion lines immersed in baths at high- or room-temperature (Zhang et al., 2018), and temperature was measured with a thermistor positioned close to the oocyte. (B) Representative time-course obtained from a TRPV1-expressing oocyte (upper panel), showing the response to a heating stimulus, followed by the application of 3 mM 2-APB and RR (50 µM). The dotted line indicates the zero-current level. The recorded temperature is shown in the middle panel. The bottom panel shows the currents in a log-scale at −60 mV normalized to their value at 30°C plotted as a function of temperature, obtained from experiments as in the upper panel. Data from individual cells are shown as black curves, and the mean ± S.E.M as blue open circles (n = 7). (C–E) Representative current- (top panel) and temperature- (middle panel) time courses obtained from the constructs indicated. The lower panel shows the I-temperature relations in a log-scale obtained from experiments as in the upper panel (n = 5–11). In (D) and (E), the curves in solid circles correspond to the mean I vs T relations for WT TRPV1 (light blue) and TRPV3 (grey). (F) Summary of current responses to heat (45°C) relative to saturating 2-APB (3 mM) at room temperature. Values for individual oocytes are shown as open circles and mean ±S.E.M. as open squares (n = 4–5).
Figure 3—figure supplement 1
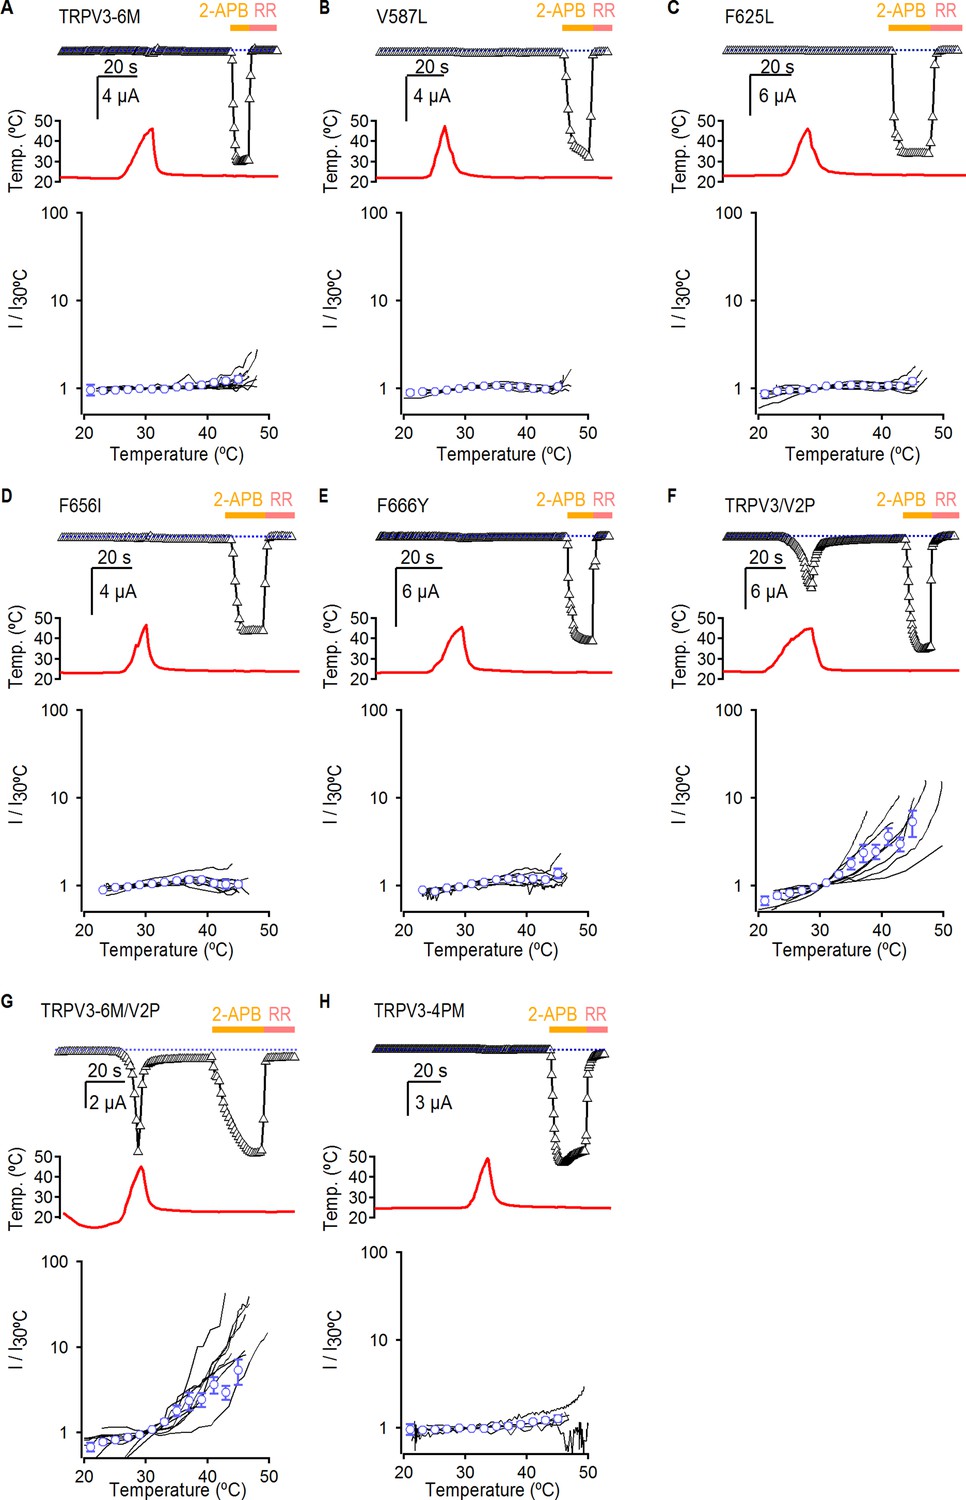
Temperature-activation of TRPV3 constructs.
(A–H) The top panels show representative time-courses obtained as in Figure 3, depicting the response to temperature and 2-APB of TRPV3 constructs. The dotted lines indicate the zero-current level. The middle panels show the temperature measured during each experiment depicted on the top panels. The bottom panels show current-temperature relations in a log-scale at −60 mV obtained from experiments as in the upper panels. Individual cells are shown as black curves, with currents normalized to their amplitude at 30°C, and the mean ± S.E.M are shown as open blue circles (n = 5–11).
Figure 3—figure supplement 2
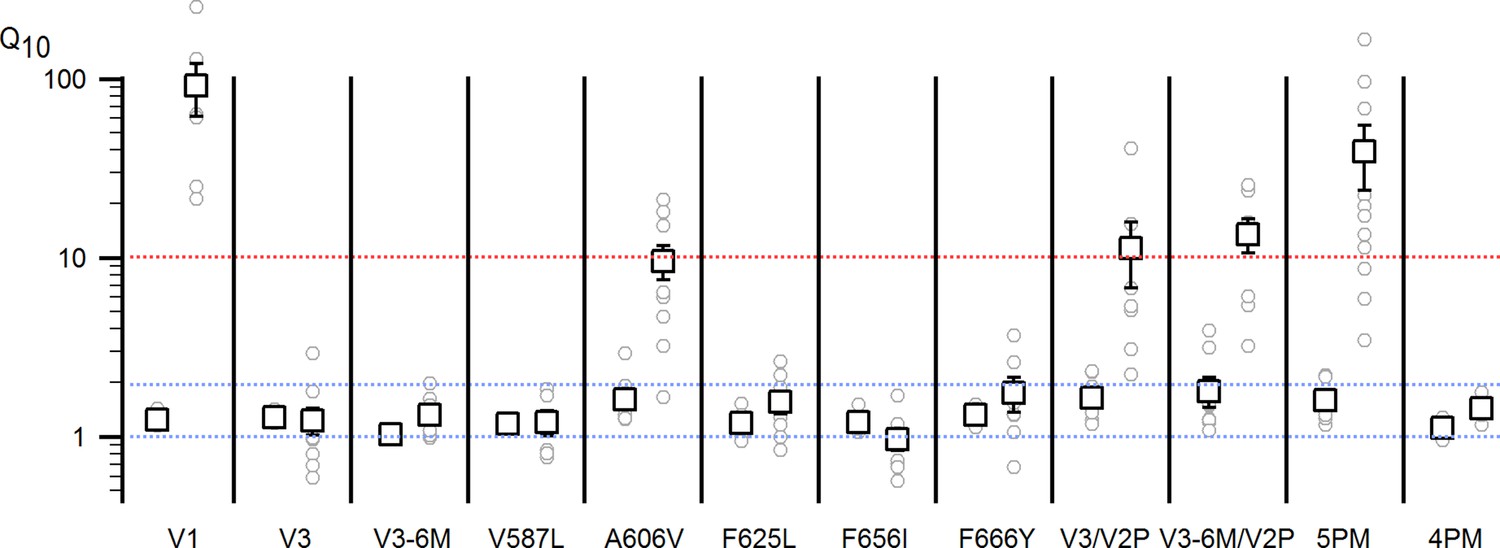
Q10 values.
Two Q10 values were calculated for each construct in Figure 3 and Figure 3—figure supplement 1 to provide a qualitative assessment of the their temperature-sensitivity between ~20–35 (left) and 38–45°C (right). Squares are the mean ± S.E.M. (n = 5–11), and the grey circles are the values for each individual experiment. The first Q10 reflects mostly the temperature-dependence of ion diffusion and leak currents, which has a value between 1 and 2, denoted by the dotted blue lines, since there are few temperature-dependent channel openings in the range between 20°C and 34°C for most constructs. The second Q10 has either values ≥10 (denoted by the dotted red line) for the constructs that exhibit robust heat-activated responses, or between 1 and 2 for constructs not activated by temperatures < 50°C.
Figure 4 with 1 supplement
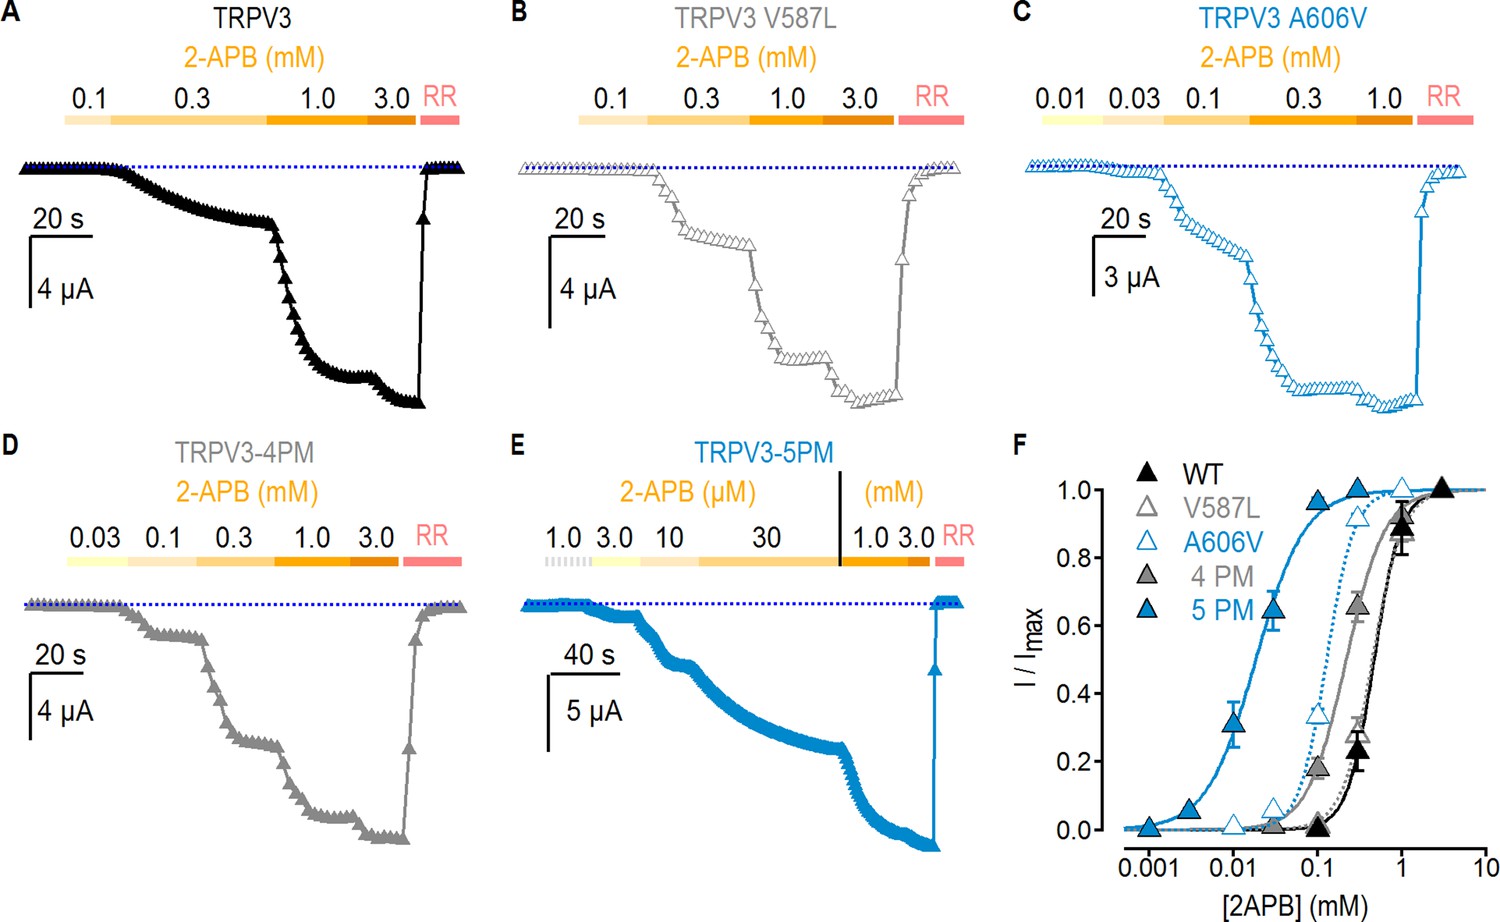
Effect of pore mutations on TRPV3 2-APB sensitivity.
(A–E) Representative current time courses at −60 mV at increasing concentrations of 2-APB, followed by block with RR (50 µM), as indicated by the colored horizontal lines. The blue-dotted lines indicate the zero-current level. Currents were held at 0 mV and voltage was stepped to −60 mV for 100 ms every 2 s. (F) Mean normalized concentration-response relations for 2-APB measured from experiments as in (A–E). Data are shown as mean ± S.E.M. (n = 4–6). The continuous curves are fits to the Hill equation with EC50 and s (slope) values as follows: TRPV3, EC50 = 464 ± 12 µM, s = 2.63; TRPV3-4PM, EC50 = 210 ± 20 µM, s = 1.84; TRPV3-A606V, EC50 = 132 ± 7, s = 2.72; TRPV3-5PM, EC50 = 19 ± 2 µM, s = 1.32; TRPV3-V587L, EC50 = 443 ± 13 µM, s = 2.28.
Figure 4—figure supplement 1
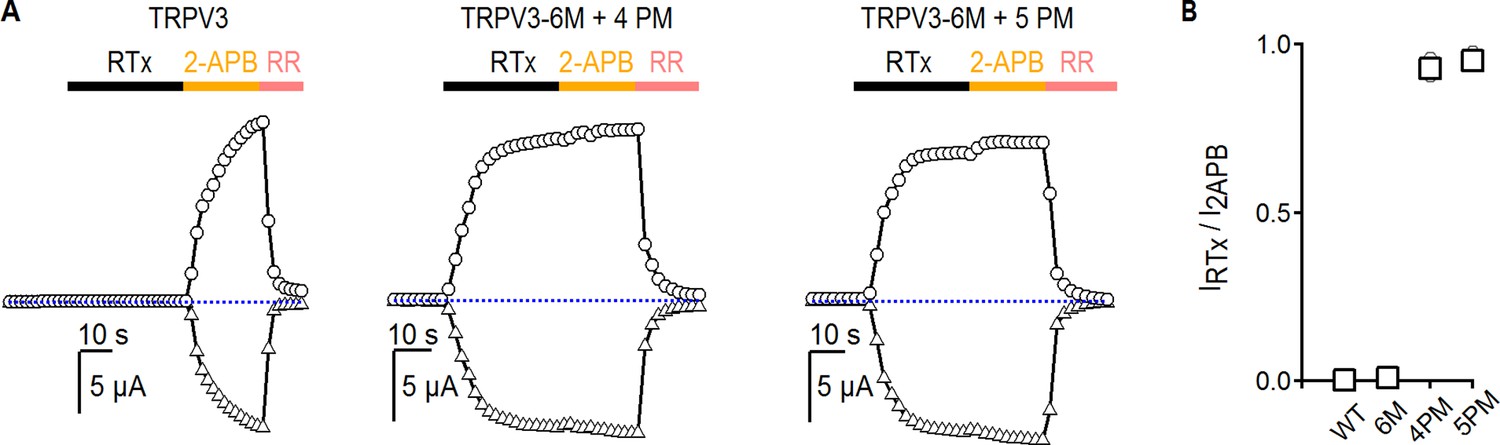
Relative maximal activation by RTx and 2-APB for TRPV3 constructs.
(A) Representative time courses (−60, triangles;+60 mV, circles) of activation by RTx (100 nM) and 2-APB (3 mM), followed by block with RR (50 µM). The dotted horizontal lines indicate the zero-current level. (B) Summary of the sensitivity of TRPV3 constructs at +60 mV to RTx relative to 2-APB from experiments as in (A). Values for individual oocytes are shown as open grey circles and the mean ± S.E.M. as bars (n = 3–4).
Figure 5 with 1 supplement
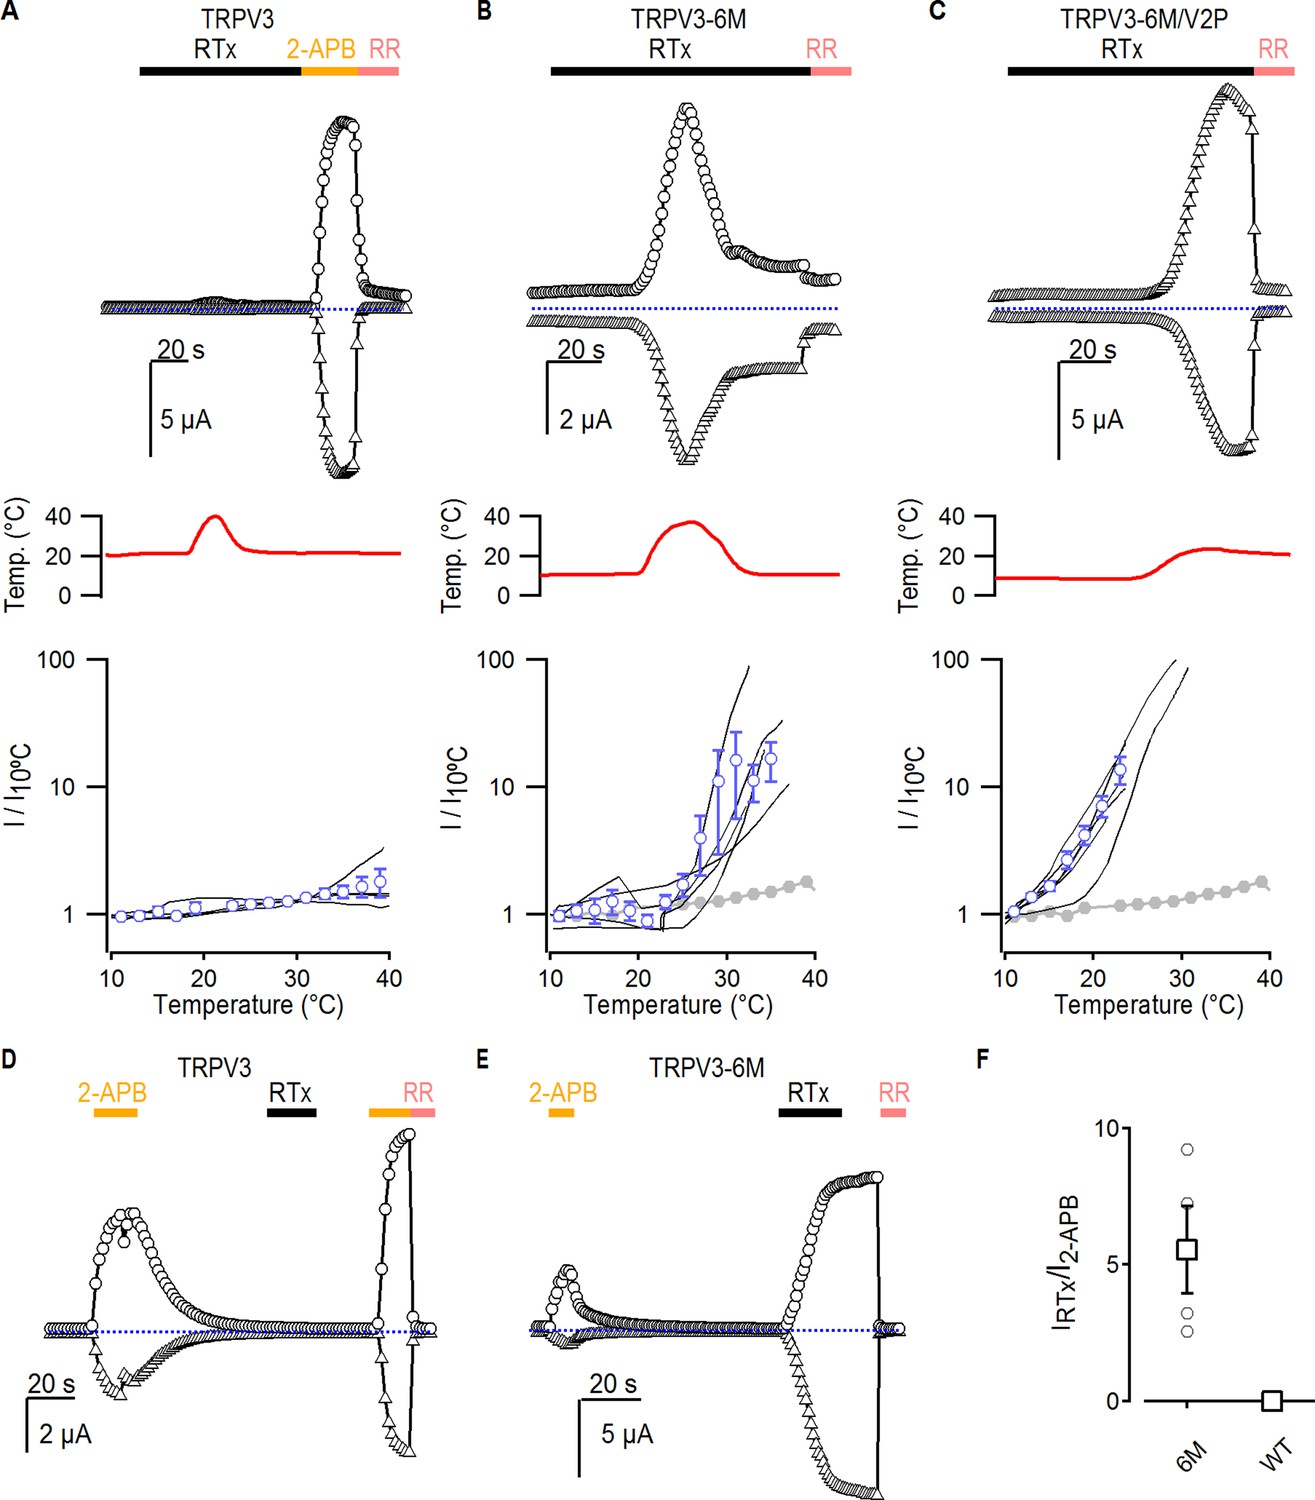
Interaction between RTx, temperature and 2-APB in TRPV3 channels.
(A–C) Representative time courses for (A) WT TRPV3, (B) TRPV3-6M and (C) TRPV3-6M/V2P activation in response to 100 nM RTx and changes in temperature, which is shown in the middle panel. WT TRPV3 was also activated by 2-APB (3 mM), and all currents were blocked by RR (50 µM). Time courses were obtained at +60 (circles) and −60 mV (triangles) as described in Figure 1B, and temperature was controlled and monitored as in Figure 3. The blue-dotted horizontal lines indicate the zero-current level. The bottom panel shows normalized current vs temperature relations in a log scale at −60 mV obtained from experiments as in the upper panels. Individual cells are shown as black curves, with currents normalized to their amplitudes at 10°C, and the mean ± S.E.M. is shown in blue open circles (n = 3–4). For (B) and (C), the mean I vs T for WT TRPV3 is depicted in solid grey circles. (D, E) Representative time courses of activation of (D) WT TRPV3 and (E) TRPV3-6M in response to 2-APB (3 mM), RTx (100 nM), and RR (50 µM) at ±60 mV. (F) Summary of the current amplitude ratios for TRPV3 and TRPV3-6M activation by RTx relative to 2-APB. Values for individual oocytes are shown as open circles, the mean ± S.E.M. in open squares (n = 4–6).
Figure 5—figure supplement 1
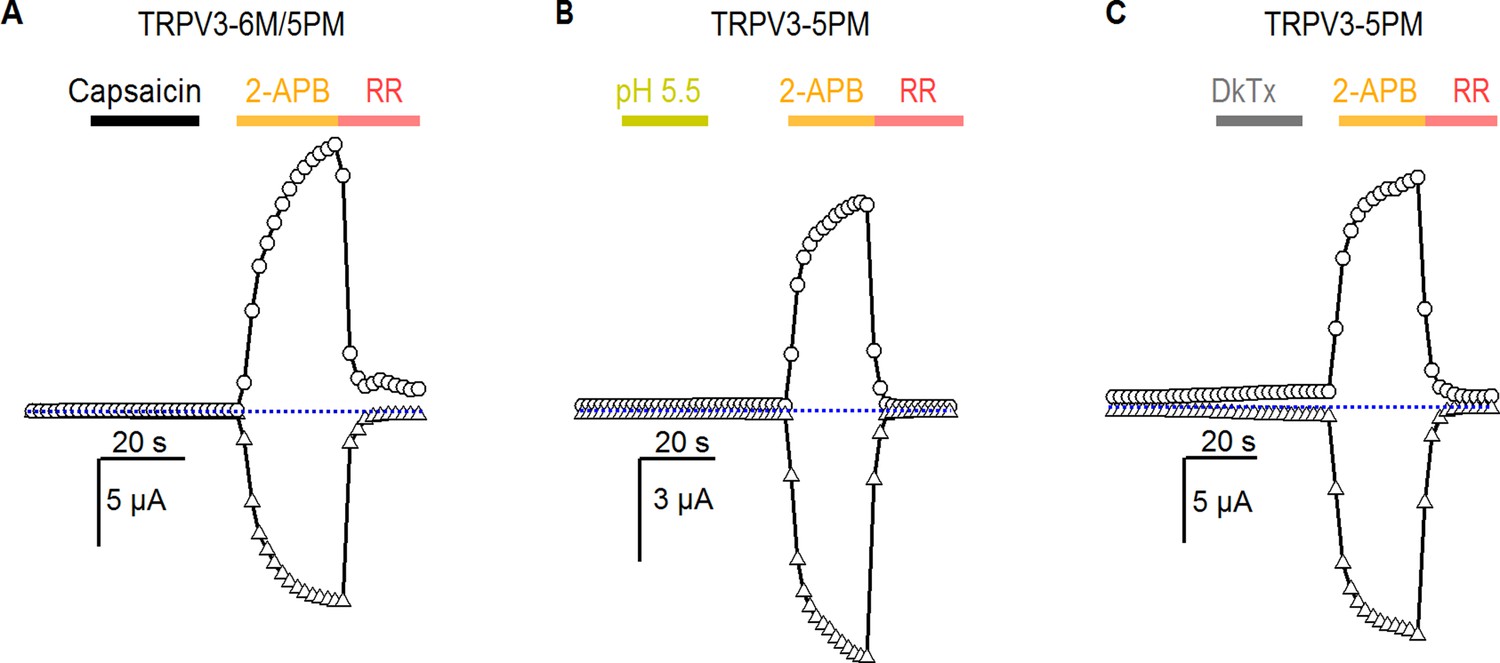
Pore mutants of TRPV3 do not enable sensitivity to other TRPV1-specific agonists.
(A) Representative current time courses at +60 mV (circles) and −60 mV (triangles) showing that TRPV3-6M/5PM channels cannot be activated by a high concentration of capsaicin (20 μM). The dotted line denotes the zero-current level. (B, C) Representative time courses at +60 mV (circles) and −60 mV (triangles) showing that TRPV3-5PM channels cannot be activated by (B) low pH or (C) the double-knot toxin (1 µM, DkTx). 2-APB was used at 3 mM, and RR at 50 µM.
Additional files
-
Transparent reporting form
- https://doi.org/10.7554/eLife.42756.014
Download links
A two-part list of links to download the article, or parts of the article, in various formats.
Downloads (link to download the article as PDF)
Open citations (links to open the citations from this article in various online reference manager services)
Cite this article (links to download the citations from this article in formats compatible with various reference manager tools)
Conserved allosteric pathways for activation of TRPV3 revealed through engineering vanilloid-sensitivity
eLife 8:e42756.
https://doi.org/10.7554/eLife.42756


