Membrane bridging by Munc13-1 is crucial for neurotransmitter release
- University of Texas Southwestern Medical Center, United States
- Charité - Universitätsmedizin, Germany
- NeuroCure Cluster of Excellence, Germany
Figures
Figure 1 with 1 supplement
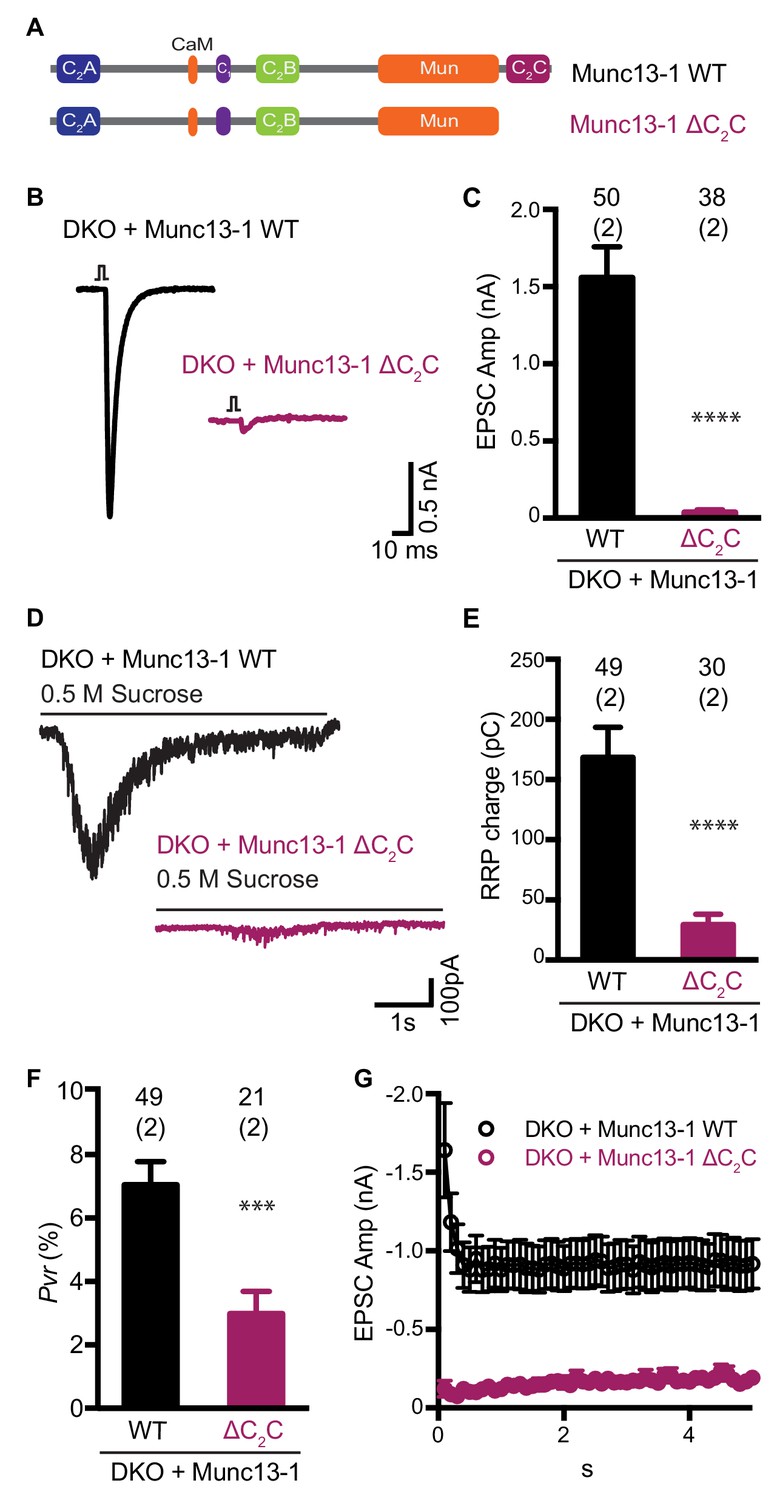
Functional effects caused by deleting the Munc13-1 C2C domain.
(A) Cartoon depicting the domain structure of Munc13-1 and Munc13-1 ∆C2C. (B), Example EPSC traces recorded from Munc13-1/2 DKO autaptic hippocampal neurons expressing either Munc13-1 WT (black) or Munc13-1 ∆C2C (burgundy red). (C) Plot showing the average EPSC amplitudes obtained from the DKO neurons rescued with Munc13-1 WT or Munc13-1 ∆C2C. (D) Example traces of synaptic current responses induced by 5 s application of 500 mM sucrose from DKO neurons rescued with the WT and the C2C truncated mutant indicated above. (E) Plot of the average RRP charge for both groups. (F) Plot of the calculated Pvr in % for Munc13-1 WT and C2C truncated mutant. (G) Graph showing the absolute EPSC amplitudes in response to a train of 50 action potentials (APs) with an inter-stimulus interval (ISI) of 100 ms (10 Hz) for the WT and truncated C2C domain mutant. Numbers at the top of the bars represent the number of neurons pooled together for each group. Numbers in parentheses represent the number of cultures or replicates used. All data are mean ± SEM. Significance and p values were determined by Mann-Whitney test. ****p<0.0001: ***p<0.001.
-
Figure 1—source data 1
Numerical description and statistics of data presented in Figure 1.
- https://doi.org/10.7554/eLife.42806.004
Figure 1—figure supplement 1
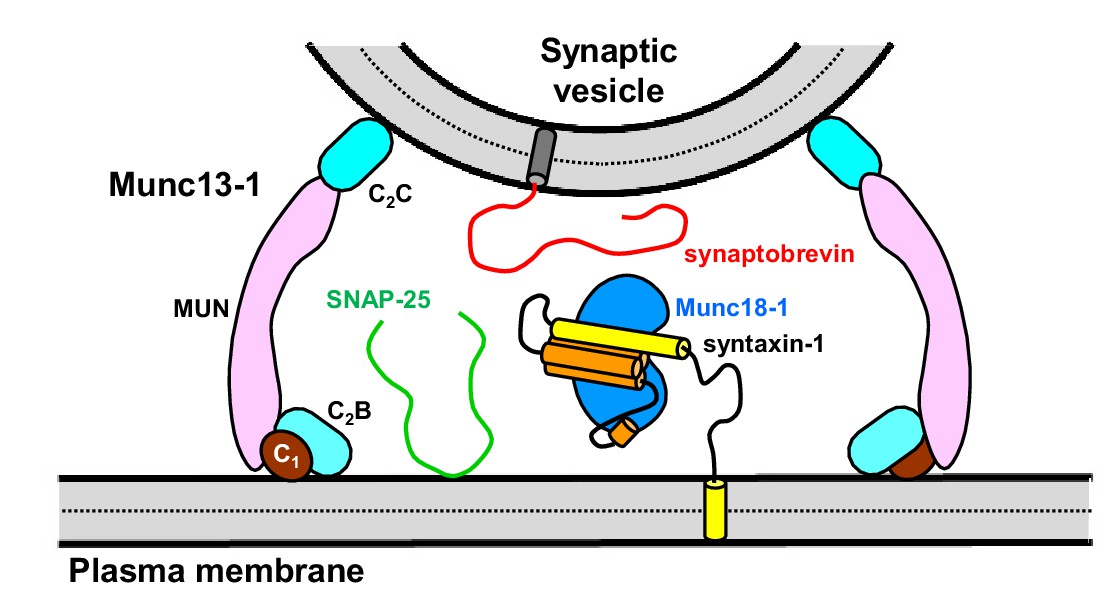
Model illustrating how the Munc13-1 C-terminal region can bridge the synaptic vesicle and plasma membranes.
The different domains of the Munc13-1 C-terminal region are colored in brown (C1), cyan (C2B), pink (MUN) and blue (C2C). The diagram also shows other components of the release machinery in the state postulated to exist before SNARE complex assembly, with Munc18-1 (blue) bound to syntaxin-1 folded in a closed conformation (yellow and orange), and SNAP-25 (green) and synaptobrevin (red) unstructured.
Figure 2 with 1 supplement

The MUNC2C fragment binds to liposomes.
(A) Ribbon diagram of a structural model of the Munc13-1 C2C domain built based on the crystal structure of the RIM1 C2B domain (Guan et al., 2007) (PDB accession code 2Q3X) and the sequence homology between the two C2 domains. The side chains of the residues that were mutated in this study are shown as stick models. (B) Analysis of the resins used for GST-pulldown assays of liposome binding. Equal amounts of GST-affinity resins loaded with WT or R1598E/F1658E MUNC2C were analyzed by SDS-PAGE and coomassie blue staining. (C,D) Fluorescence emission spectra showing that GST-affinity resins loaded with WT MUNC2C bind to rho-liposomes and that the R1598E/F1658E mutation abolishes binding. GST-affinity resins that were protein free (black curves) or were loaded with WT MUNC2C (blue curves) or R1598E/F1658E MUNC2C (red curves) were incubated with rho-liposomes. The WT and mutant GST-MUNC2C resins were loaded with four-fold larger amounts of proteins for the experiments of panel (D) than for those of panel (C). Samples were centrifuged and fluorescence emission spectra of the flow through were acquired. Note that comparable amounts of rho-liposomes were eluted from the protein-free and R1598E/F1658E GST-MUNC2C resins, whereas much less rho-liposomes were eluted from the WT GST-MUNC2C resins.
Figure 2—figure supplement 1
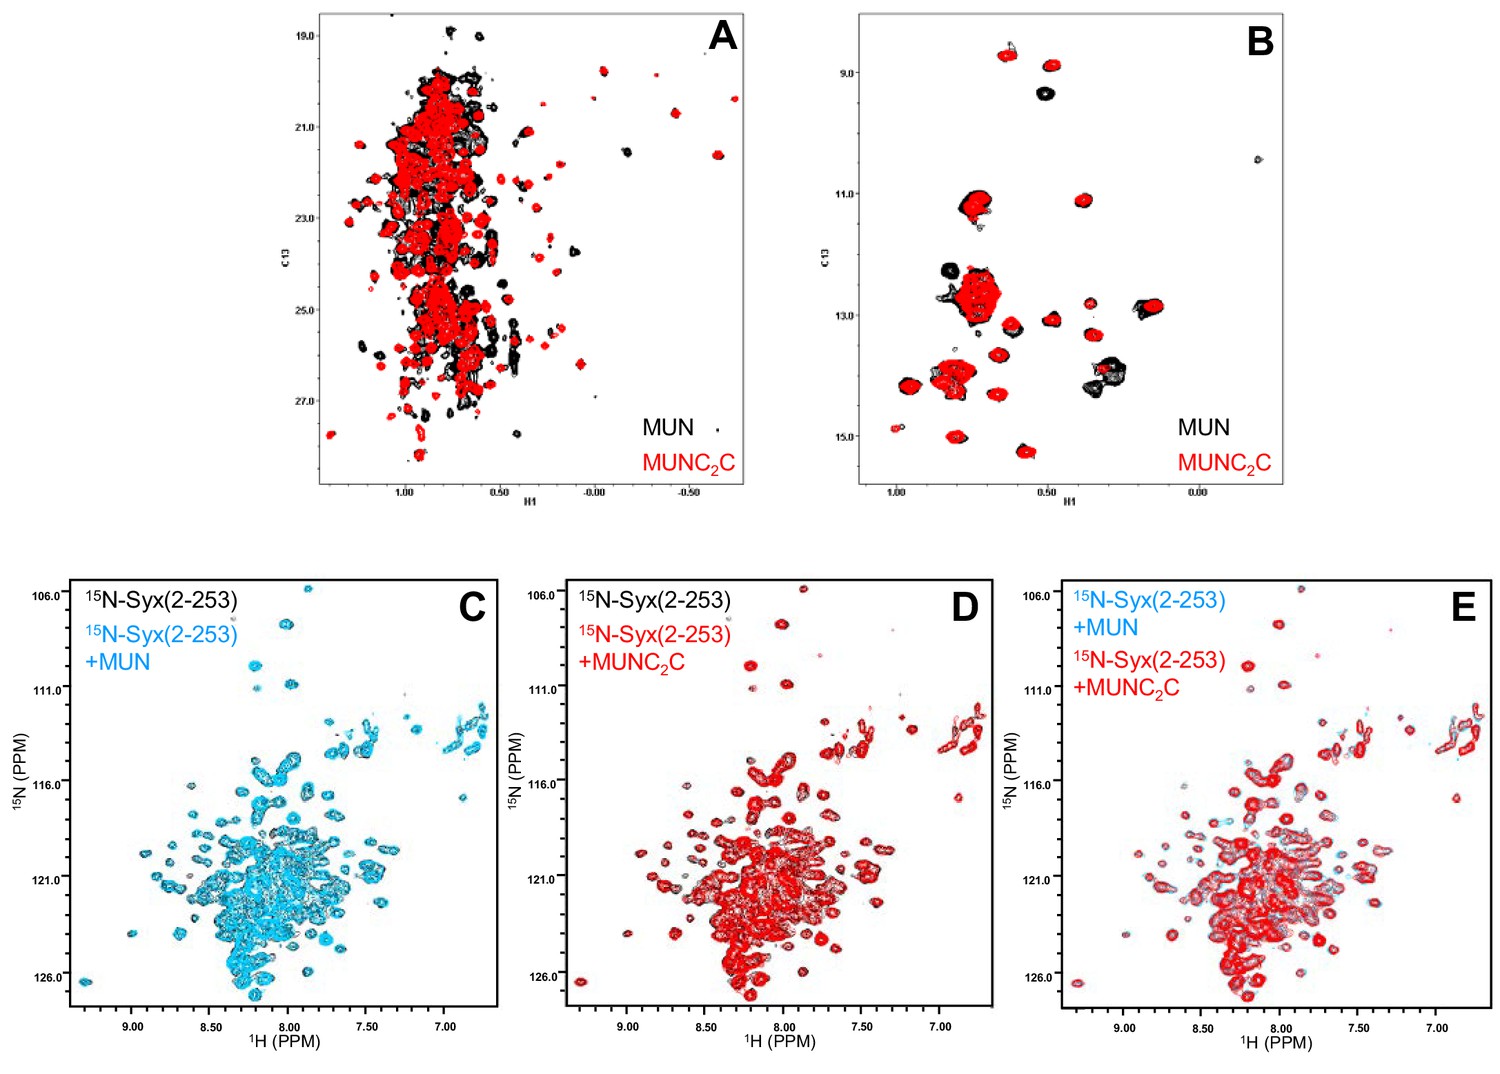
NMR analysis of the Munc13-1 MUNC2C fragment and binding to syntaxin-1.
(A,B) 1H-13C HMQC spectra of perdeuterated, 2H,13CH3-ILV-labeled samples of the Munc13-1 MUN domain (red contours) and MUNC2C fragment (black contours). Note that the spectrum of the MUNC2C domain fragment contains additional cross-peaks that appear in well-resolved regions and show that the C2C domain is structured, and that some cross-peaks of the MUN domain shift, indicating that it packs against the C2C domain. (C–E) 1H-15N TROSY-HSQC spectra of 15N-labeled syntaxin-1 (2–253) (black contours) in the absence or presence of Munc13-1 MUN domain (blue contours) or MUNC2C fragment (red contours). Note that both the MUN domain and the MUNC2C fragment cause only slight broadening of the syntaxin-1 (2–253) cross-peaks (C,D), resulting in very similar spectra (E).
Figure 3
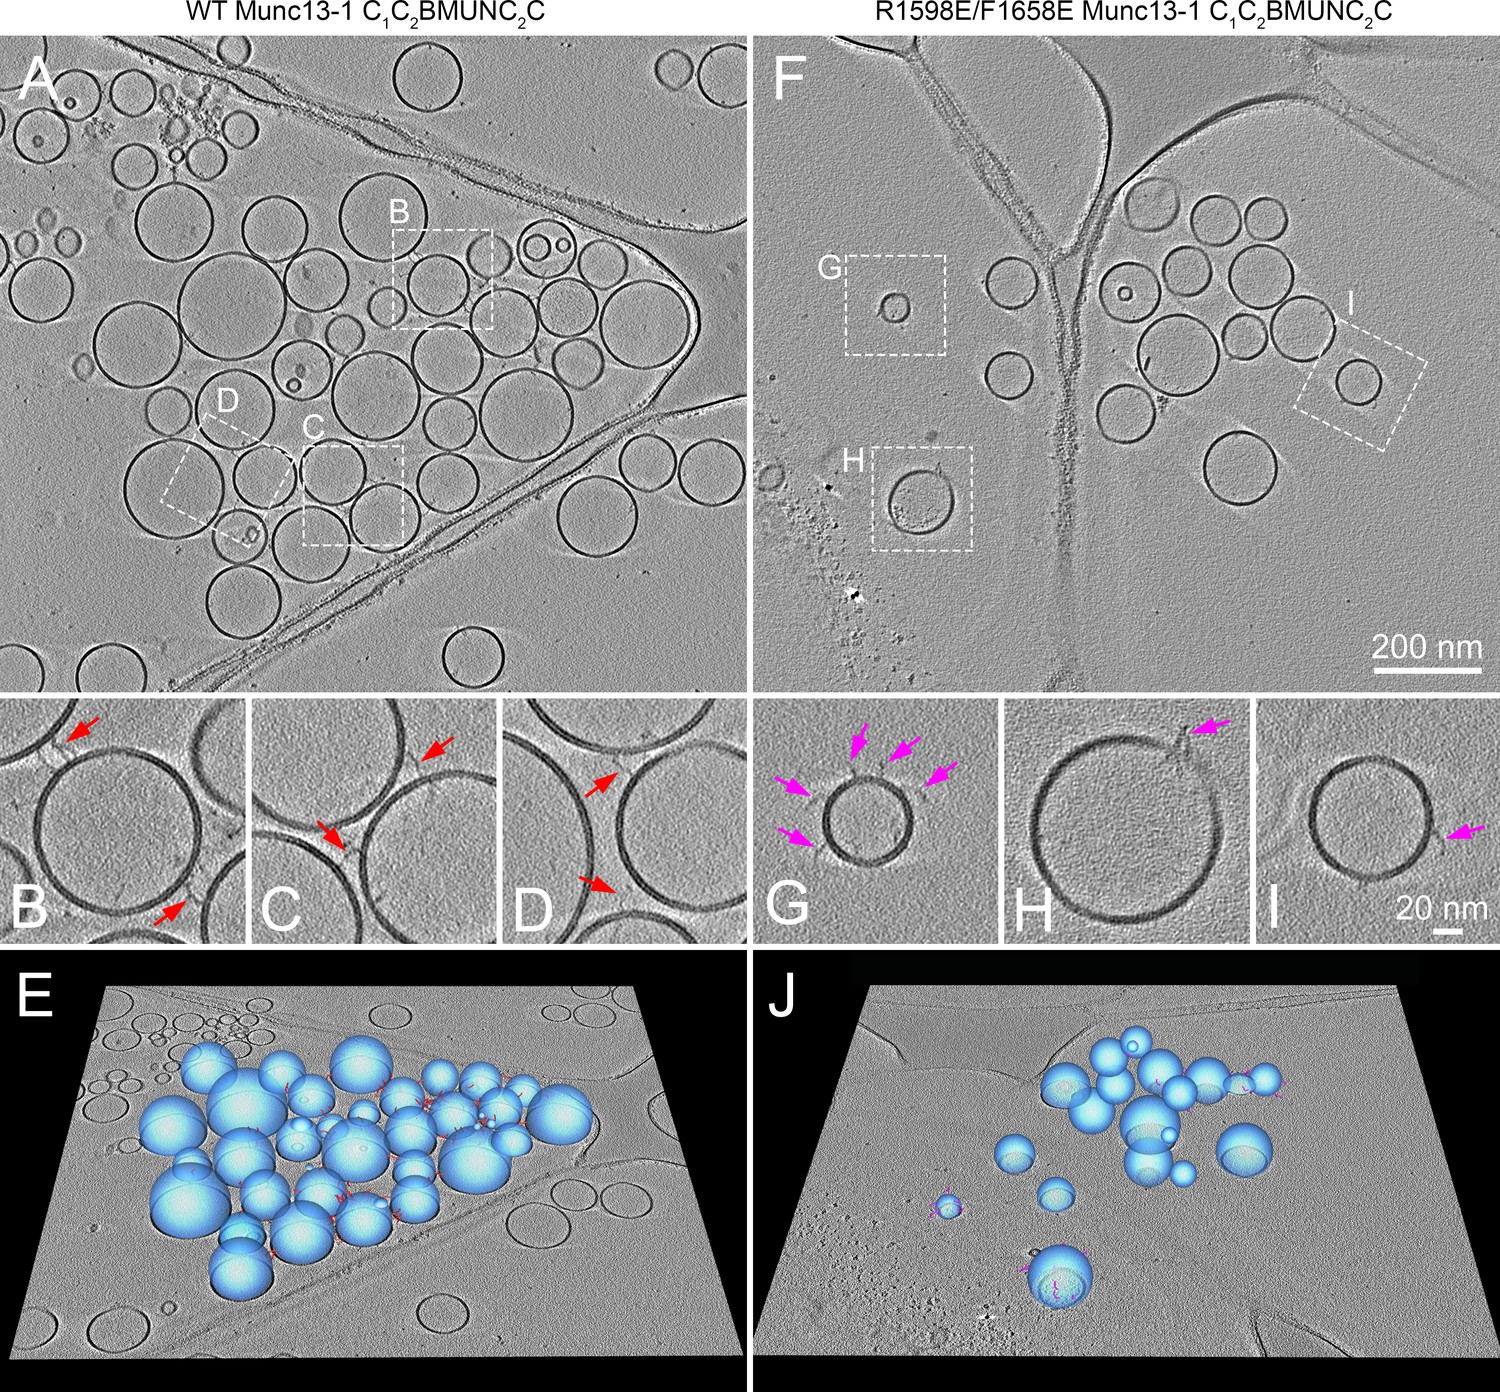
Cryo-ET reconstructions showing that Munc13-1 C1C2BMUNC2C can bridge two membranes.
Specimens were prepared following our standard protocol to analyze lipid and content mixing between V- and T-liposomes in the presence of Munc18-1, NSF, αSNAP, 0.1 μM EGTA, and either WT (A–E) or R1598E/F1658E mutant (F–J) Munc13-1 C1C2BMUNC2C (see Materials and methods). (A,F) Tomographic slices provide an overview of the reaction mixtures including WT (A) or R1598E/F1658E mutant (F) Munc13-1 C1C2BMUNC2C. (B–D, G–I) Zoom-in of the regions outlined in (A) and (F), respectively. However, note that the tomographic slices may vary slightly in z-height to optimize the visualization of the elongated densities corresponding to Munc13-1 C1C2BMUNC2C. The majority of elongated densities of the WT protein bridge two liposomes (red arrows in B–D), whereas the elongated densities of the R1598E/F1658E mutant protein are bound to a single liposome (pink arrows in G–I). (E,J) 3D graphical models of the tomographic reconstructions show the vesicles (blue) and elongated densities of WT (red) and R1598E/F1658E mutant (pink) Munc13-1 C1C2BMUNC2C in 3D.
Figure 4 with 2 supplements
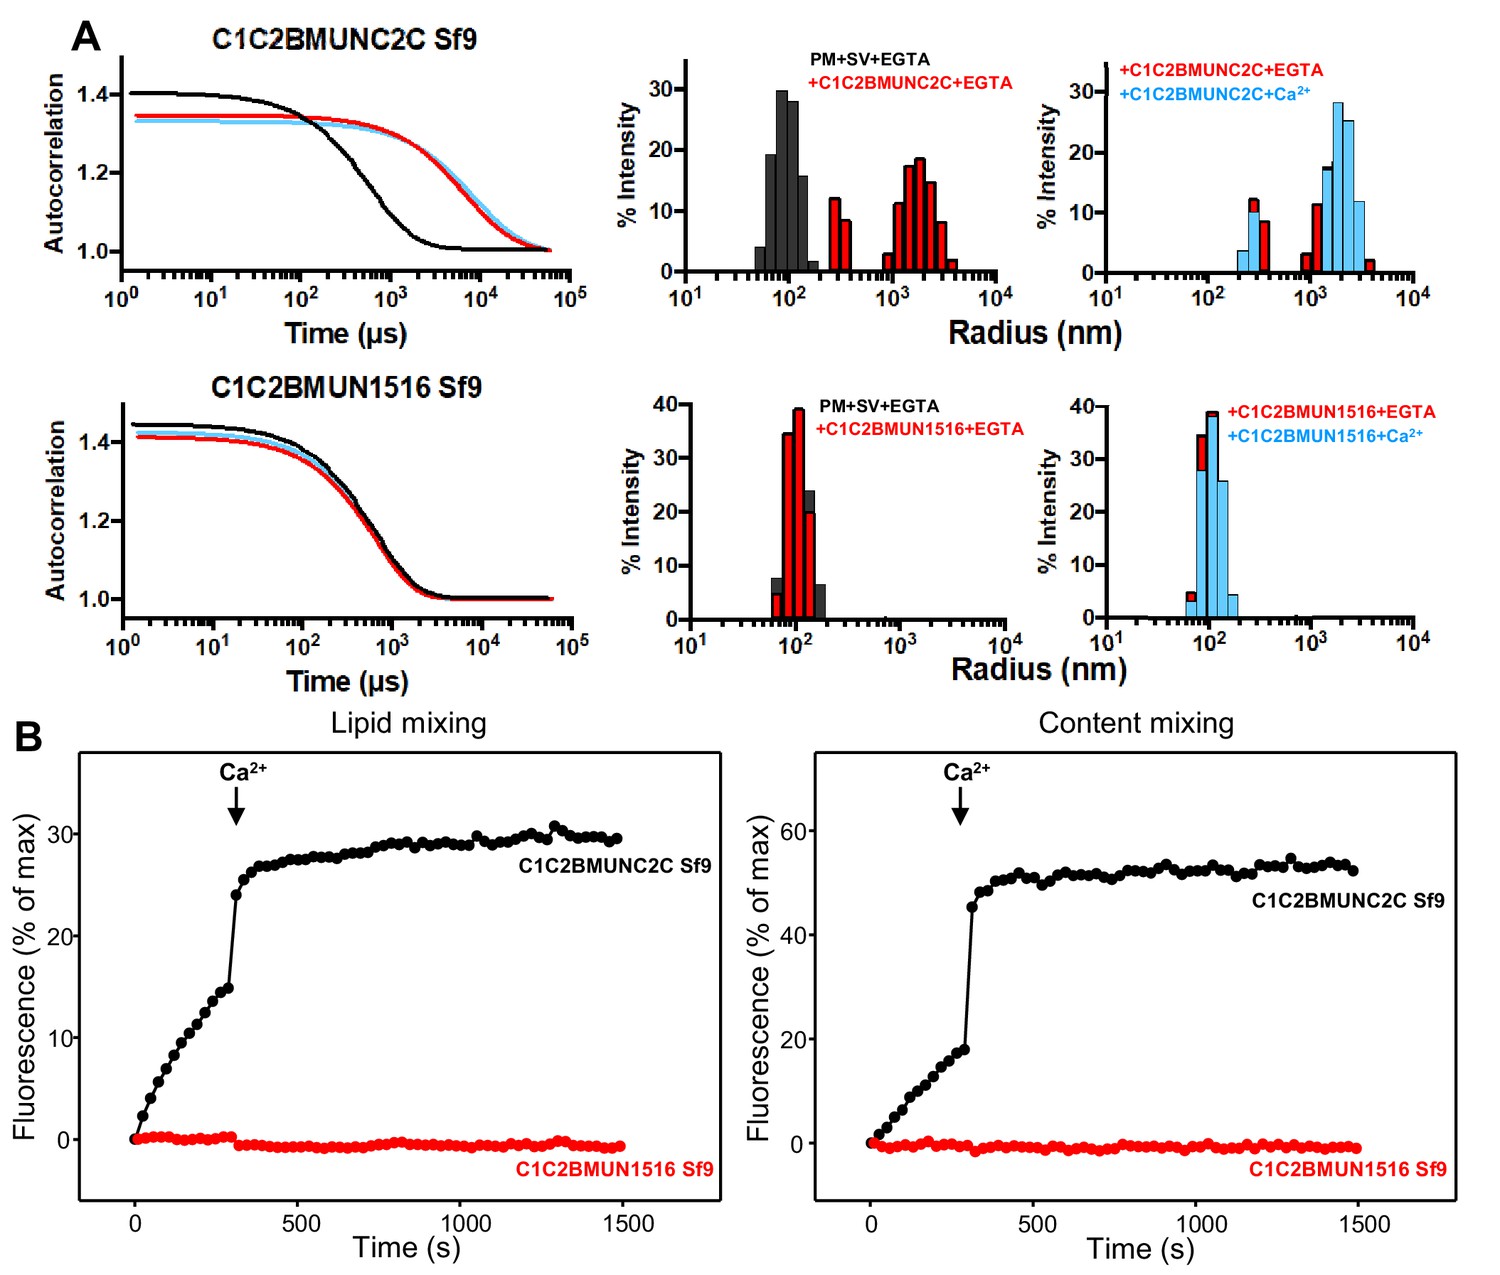
The Munc13-1 C2C domain is required for membrane bridging by the Munc13-1 C-terminal region.
(A) DLS analysis of the ability of the Munc13-1 C1C2BMUNC2C or C1C2BMUN1516 fragments expressed in Sf9 cells to cluster SV- and PM-liposomes. The diagrams on the left show the autocorrelation curves observed for a mixture of the SV- and PM-liposomes alone in the presence of EGTA (black curves), or SV- and PM-liposomes together with the indicated Munc13-1 fragment in the presence of 0.1 mM EGTA (red curves) or 0.5 mM Ca2+ (blue curves). The diagrams on the right show the particle size distributions corresponding to these curves, with the same color coding. (B) The C2C domain is required for the ability of the Munc13-1 C-terminal region to support liposome fusion in a reconstituted assay. Lipid mixing (left) between V- and T-liposomes was measured from the fluorescence de-quenching of Marina Blue-labeled lipids and content mixing (right) was monitored from the development of FRET between PhycoE-Biotin trapped in the T-liposomes and Cy5-Streptavidin trapped in the V-liposomes. The assays were performed in the presence of Munc18-1, NSF, αSNAP and the indicated Munc13-1 fragments. Experiments were started in the presence of 100 μM EGTA and 5 mM streptavidin, and Ca2+ (600 μM) was added after 300 s.
Figure 4—figure supplement 1
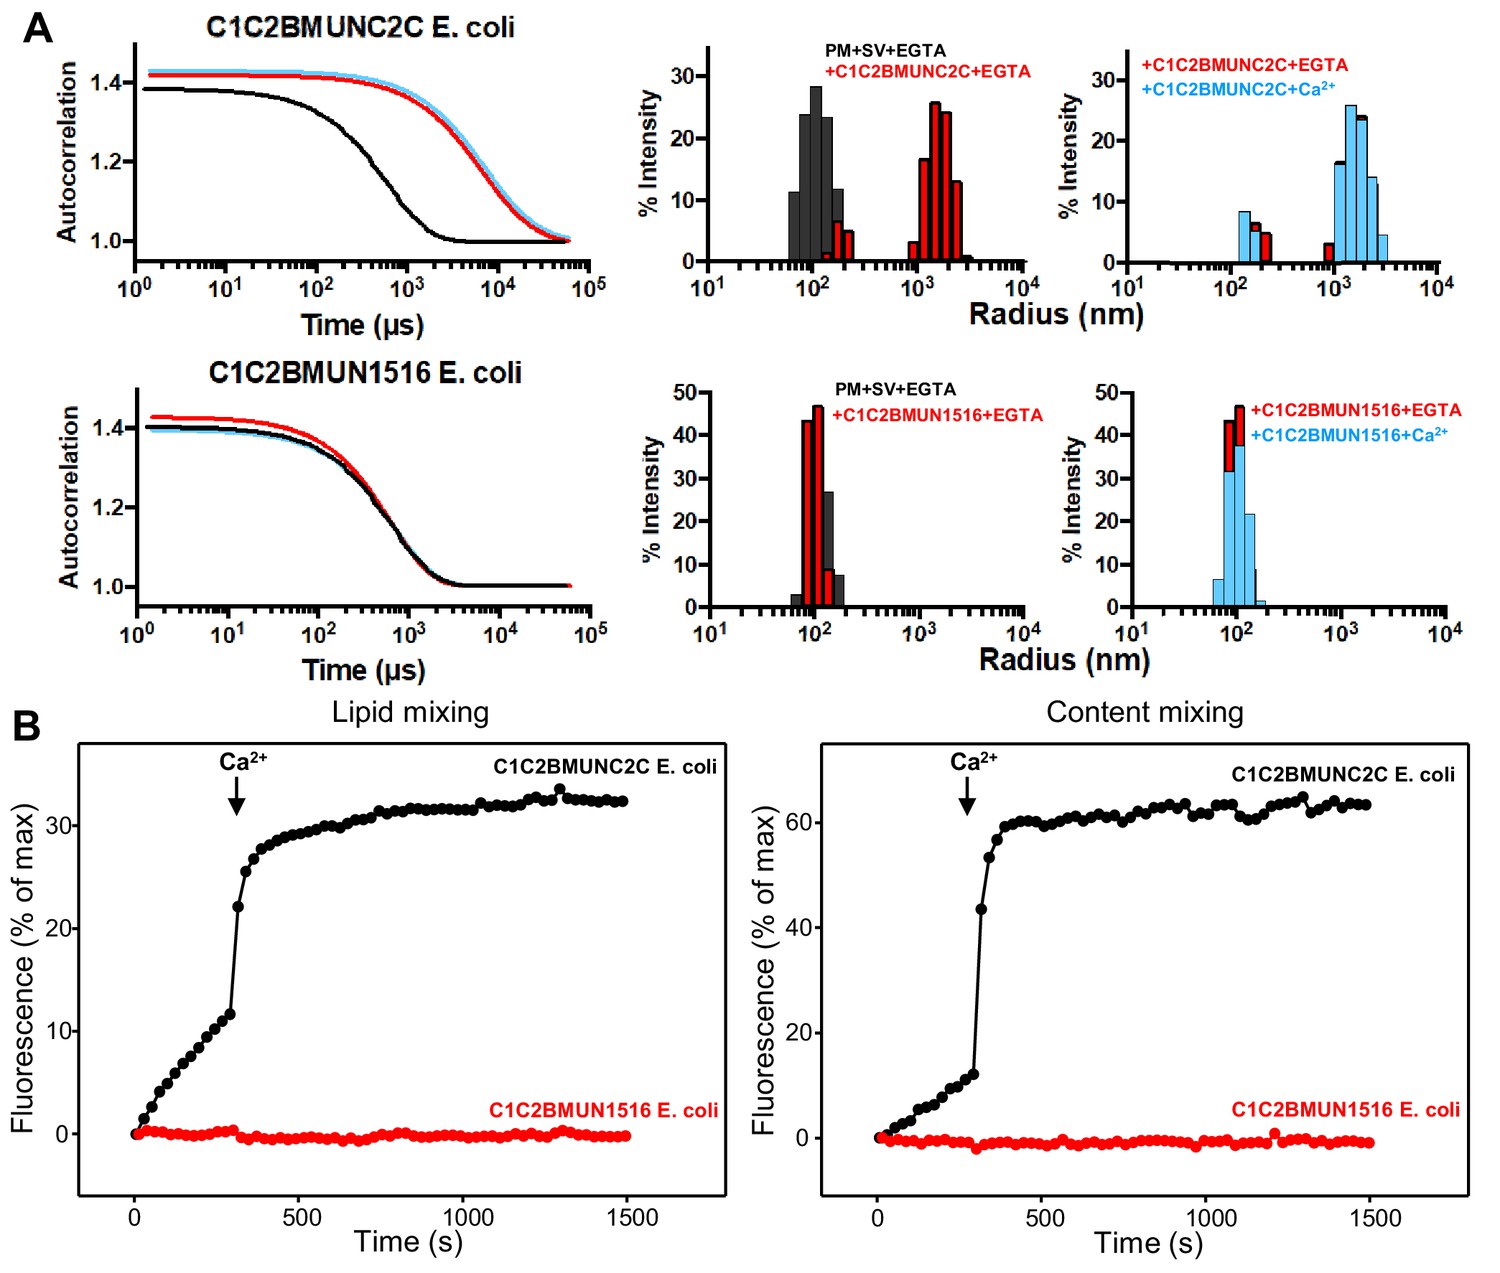
C1C2BMUNC2C and C1C2BMUN1516 expressed in E. coli behave similarly to the same proteins expressed in Sf9 cells.
(A) DLS analysis of the ability of the Munc13-1 C1C2BMUNC2C or C1C2BMUN1516 fragments expressed in E. coli to cluster SV- and PM-liposomes. The diagrams on the left show the autocorrelation curves observed for a mixture of the SV- and PM-liposomes alone in the presence of EGTA (black curves), or SV- and PM-liposomes together with the indicated Munc13-1 fragment in the presence of 0.1 mM EGTA (red curves) or 0.5 mM Ca2+ (blue curves). The diagrams on the right show the particle size distributions corresponding to these curves, with the same color coding. (B) The C2C domain is required for the ability of the Munc13-1 C-terminal region to support liposome fusion in a reconstituted assay. Lipid mixing (left) between V- and T-liposomes was measured from the fluorescence de-quenching of Marina Blue-labeled lipids and content mixing (right) was monitored from the development of FRET between PhycoE-Biotin trapped in the T-liposomes and Cy5-Streptavidin trapped in the V-liposomes. The assays were performed in the presence of Munc18-1, NSF, αSNAP and the indicated Munc13-1 fragments. Experiments were started in the presence of 100 μM EGTA and 5 mM streptavidin, and Ca2+ (600 μM) was added after 300 s.
Figure 4—figure supplement 2
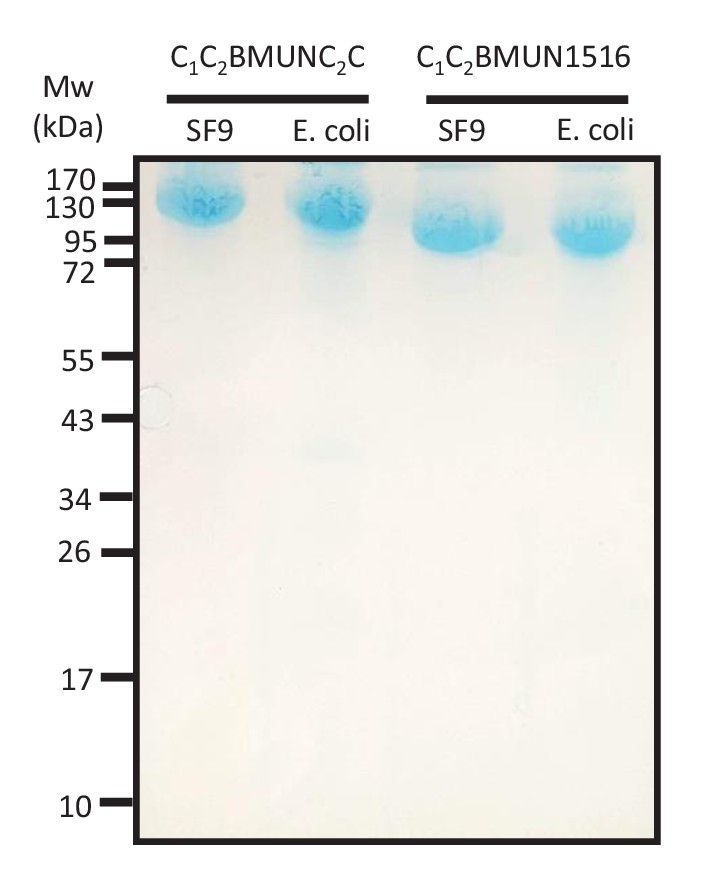
The C1C2BMUN1516 fragments bind to PM-liposomes.
Liposome co-sedimentation assays were performed with Munc13-1 C1C2BMUNC2C and C1C2BMUN1516 fragments expressed in Sf9 insect cells and E. coli, and the pellets were analyzed by SDS-PAGE followed by coomassie blue staining. The positions of molecular weight markers are indicated on the left.
Figure 5
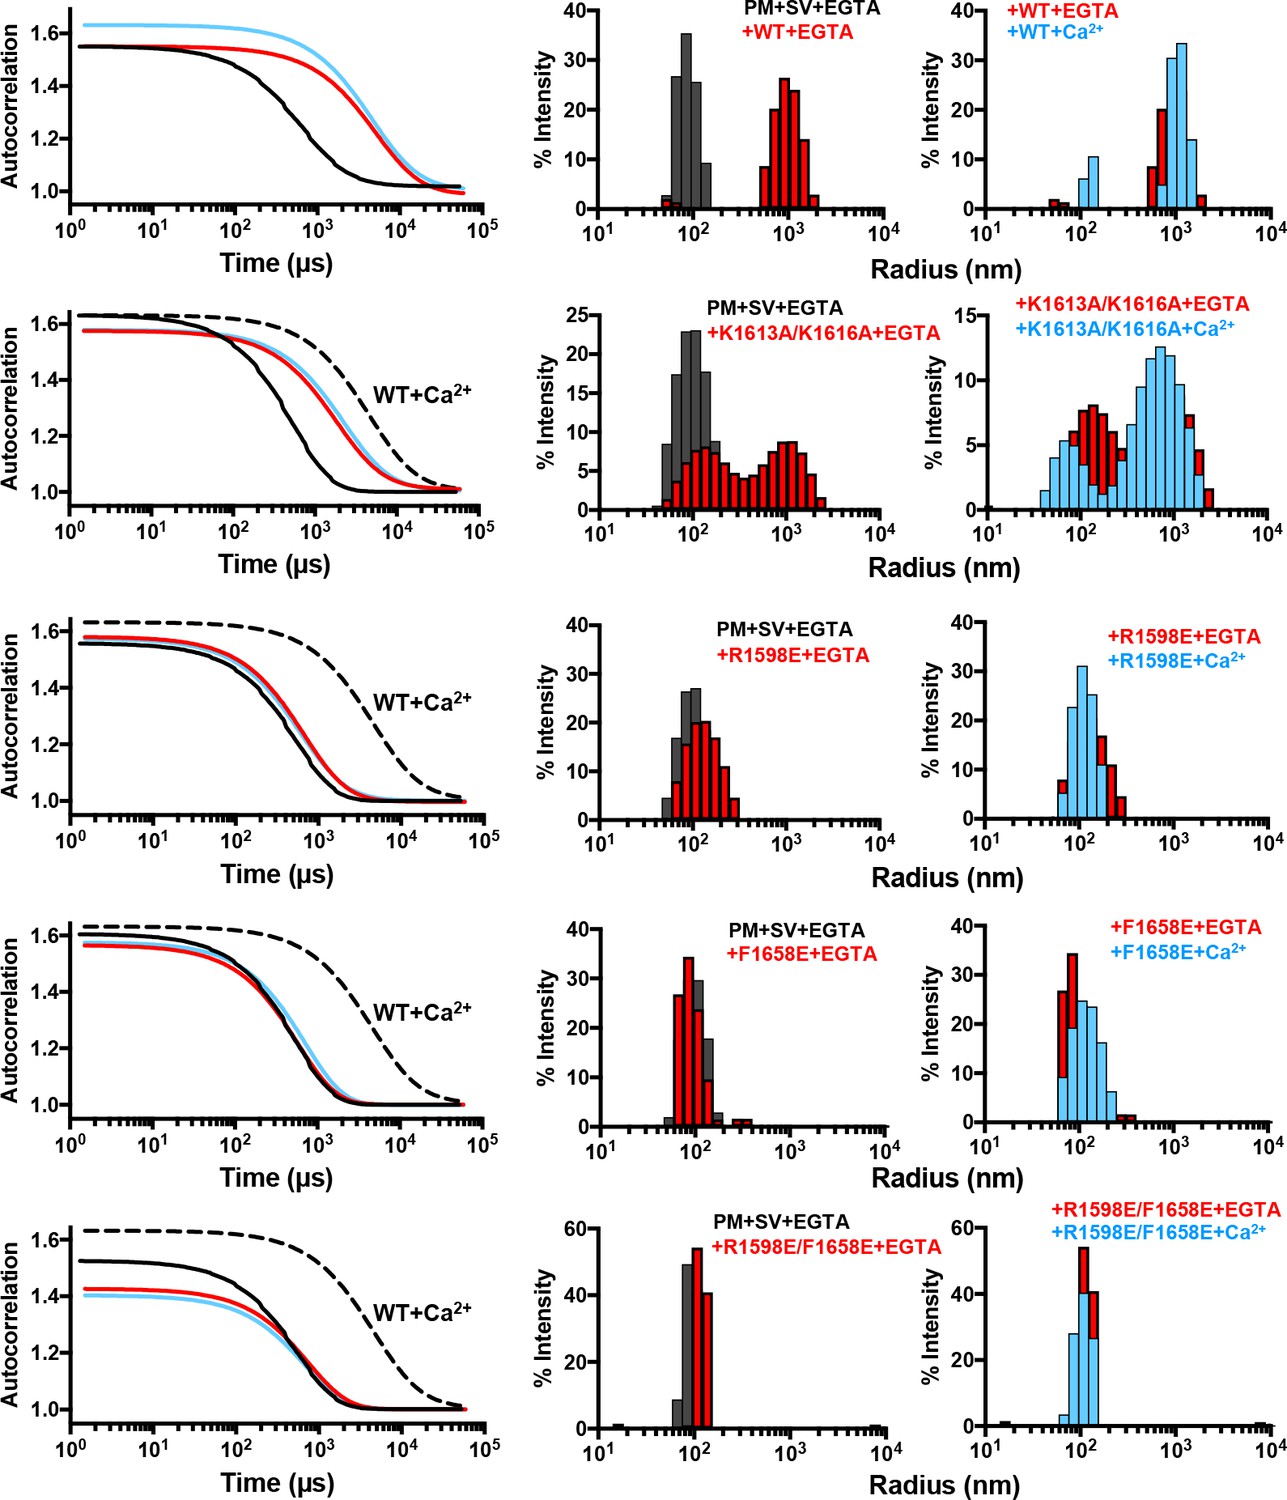
Mutations in putative membrane-binding sites of the Munc13-1 C2C domain disrupt the membrane-bridging activity of the Munc13-1 C-terminal region.
DLS analysis of the ability of WT and mutant Munc13-1 C1C2BMUNC2C fragments to cluster SV- and PM-liposomes. The plots on the left show the autocorrelation curves observed for a mixture of the V- and T-liposomes alone in the presence of EGTA (black curves), or SV- and PM-liposomes together with the indicated Munc13-1 fragment in the presence of 0.1 mM EGTA (red curves) or 0.5 mM Ca2+ (blue curves). In the plots corresponding to the mutants, the data obtained with WT C1C2BMUNC2C in the presence of Ca2+ are shown by the dashed black curves for comparison. The diagrams on the right show the particle size distributions corresponding to these curves, with the same color coding.
Figure 6 with 1 supplement

Mutations in putative membrane-binding sites of the Munc13-1 C2C domain disrupt the ability of the Munc13-1 C-terminal region to support liposome fusion in a reconstituted assay.
(A) Lipid mixing (left) between V- and T-liposomes was measured from the fluorescence de-quenching of Marina Blue-labeled lipids and content mixing (right) was monitored from the development of FRET between PhycoE-Biotin trapped in the T-liposomes and Cy5-Streptavidin trapped in the V-liposomes. The assays were performed in the presence of Munc18-1, NSF, αSNAP and 0.1 μM concentrations of WT or mutant Munc13-1 fragments, as indicated by the color codes. Experiments were started in the presence of 100 μM EGTA and 5 mM streptavidin, and Ca2+ (600 μM) was added after 300 s. (B) Analogous lipid and content mixing assays performed with different concentrations of mutant Munc13-1 C1C2BMUNC2C fragments as indicated. Note that the scale of the y-axis was expanded in the lower plots to help to visualize the small amounts of lipid and content mixing observed.
Figure 6—figure supplement 1
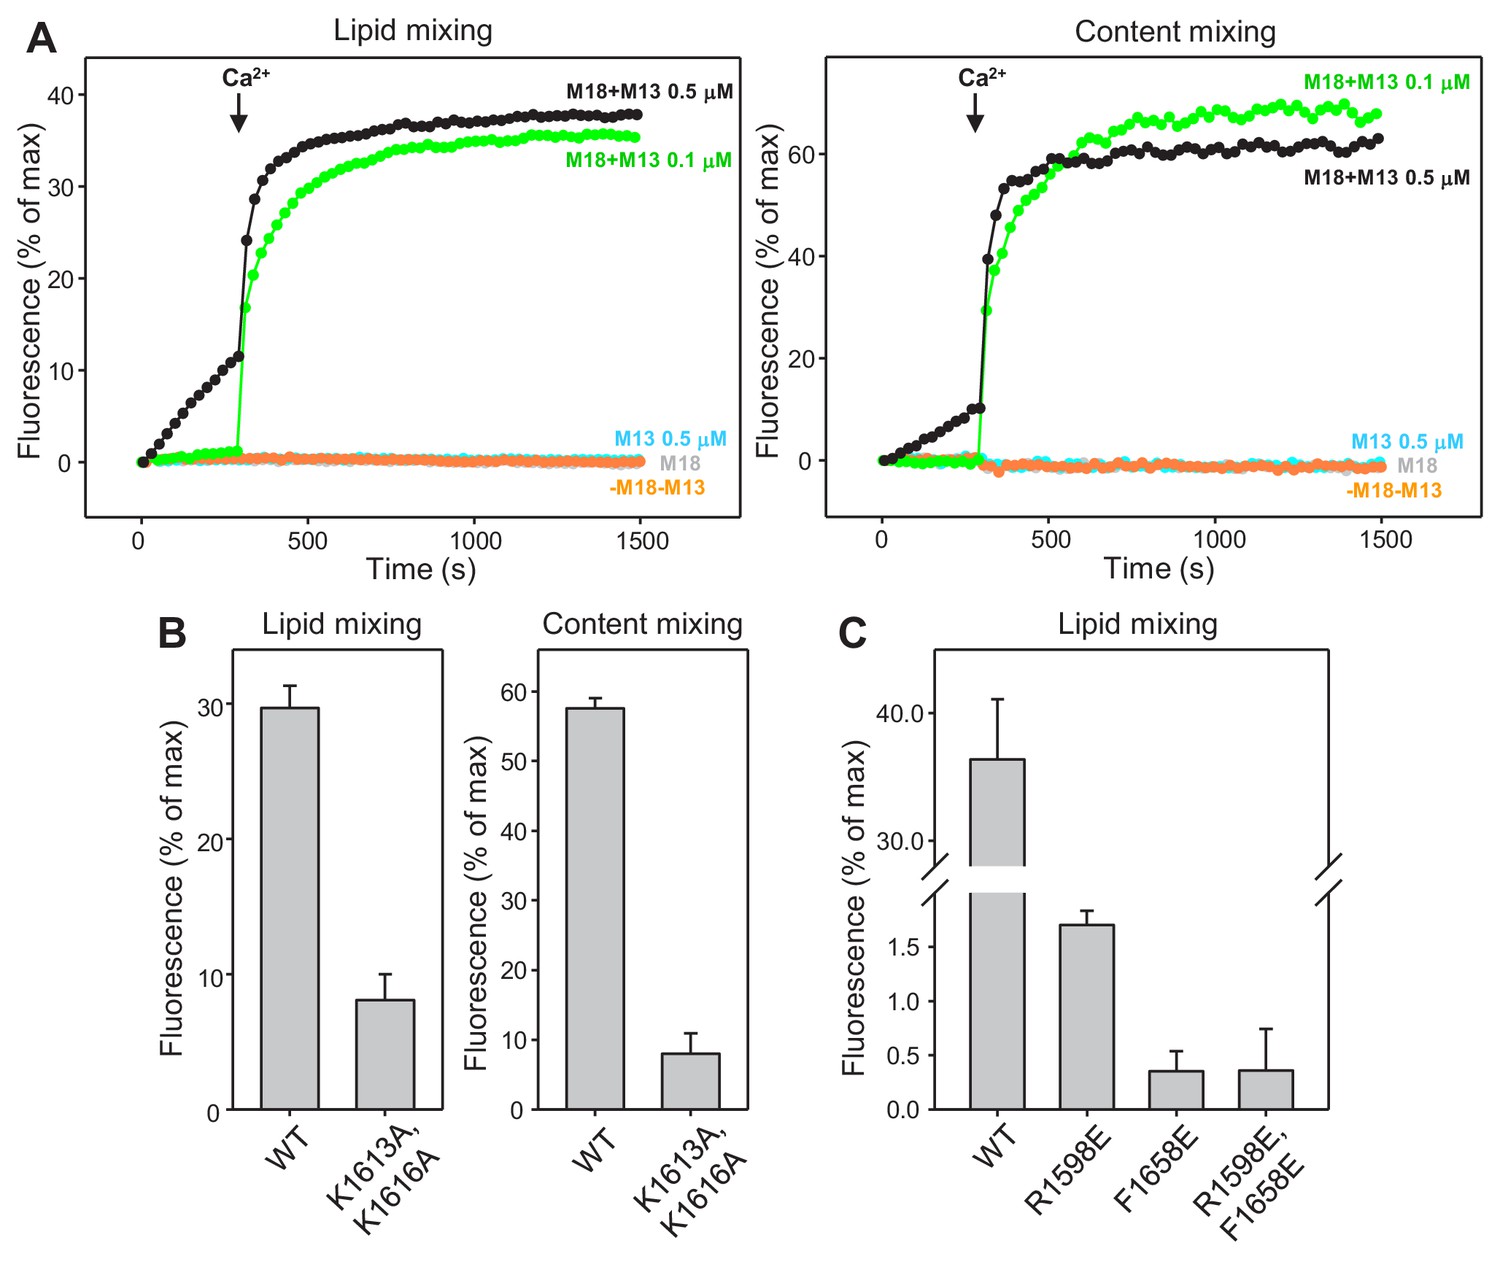
Mutations in putative membrane-binding sites of the Munc13-1 C2C domain disrupt the ability of the Munc13-1 C-terminal region to support liposome fusion in a reconstituted assay.
(A) Lipid mixing (left) between V- and T-liposomes was measured from the fluorescence de-quenching of Marina Blue-labeled lipids and content mixing (right) was monitored from the development of FRET between PhycoE-Biotin trapped in the T-liposomes and Cy5-Streptavidin trapped in the V-liposomes. The assays were performed in the presence of NSF and αSNAP with or without Munc18-1 (M18) and without or with WT Munc13-1 C1C2BMUNC2C fragment (M13) at 0.1 or 0.5 μM concentration. Experiments were started in the presence of 100 μM EGTA and 5 mM streptavidin, and Ca2+ (600 μM) was added after 300 s. The control experiments with Munc18-1 and no Munc13-1 (M18), with 0.5 μM Munc13-1 C1C2BMUNC2C and no Munc18-1 (M13 0.5 μM), or without Munc18-1 and Munc13-1 (-M18-M13) illustrate the strict requirement for both proteins to observe liposome fusion in these assays. (B) Quantification of the lipid and content mixing observed after 500 s in reconstitution assays performed with 0.1 μM WT or K1613A/K1616A mutant Munc13-1 C1C2BMUNC2C fragment as in Figure 6A. (C) Quantification of the lipid mixing observed after 1000 s in reconstitution assays performed with 0.5 μM WT or R1598E, F1658E and R1598E/F1658E mutant Munc13-1 C1C2BMUNC2C fragments as in Figure 6B. In (B,C) bars represent averages of the normalized fluorescence observed after 500 s (200 s after Ca2+ addition) in experiments performed at least in triplicate. Error bars represent standard deviations.
Figure 7 with 2 supplements

Electrophysiological analysis of the functional effects of mutations in the putative membrane-binding loops of the Munc13-1 C2C domain.
(A–C) Representative mEPSCs (A), EPSCs (B), and postsynaptic currents evoked by 0.5 M sucrose (C) in Munc13-1/2 DKO neurons expressing WT (black), R1598E mutant (blue), F1658E mutant (green) or R1598E/F1658E mutant (red) Munc13-1. (D–G) Mean mEPSC frequencies (D), EPSC amplitudes (E), RRP charges (F) and Pvr (G), measured in the Munc13-1/2 DKO neurons rescued with WT Munc13-1 and the indicated Munc13-1 mutants. (H) Paired-pulse ratios of Munc13-1/2 DKO neurons rescued with the WT Munc13-1 and the indicated Munc13-1 mutants. (I) Normalized EPSC amplitudes in response to a 10 Hz AP train in Munc13-1/2 DKO neurons rescued with WT (black), R1598E mutant (blue), F1658E mutant (green) or R1598E/F1658E mutant (red) Munc13-1. Numbers above the bars represent number of neurons pooled together of each group. Numbers in parentheses represent number of cultures or replicates used. All data are mean ±SEM. Significance and p values were determined by Kruskal Wallis test followed by a multiple comparison. *p<0.05, **p<0.01; ***p<0.001.
-
Figure 7—source data 1
Numerical description and statistics of data presented in Figure 7.
- https://doi.org/10.7554/eLife.42806.017
Figure 7—figure supplement 1
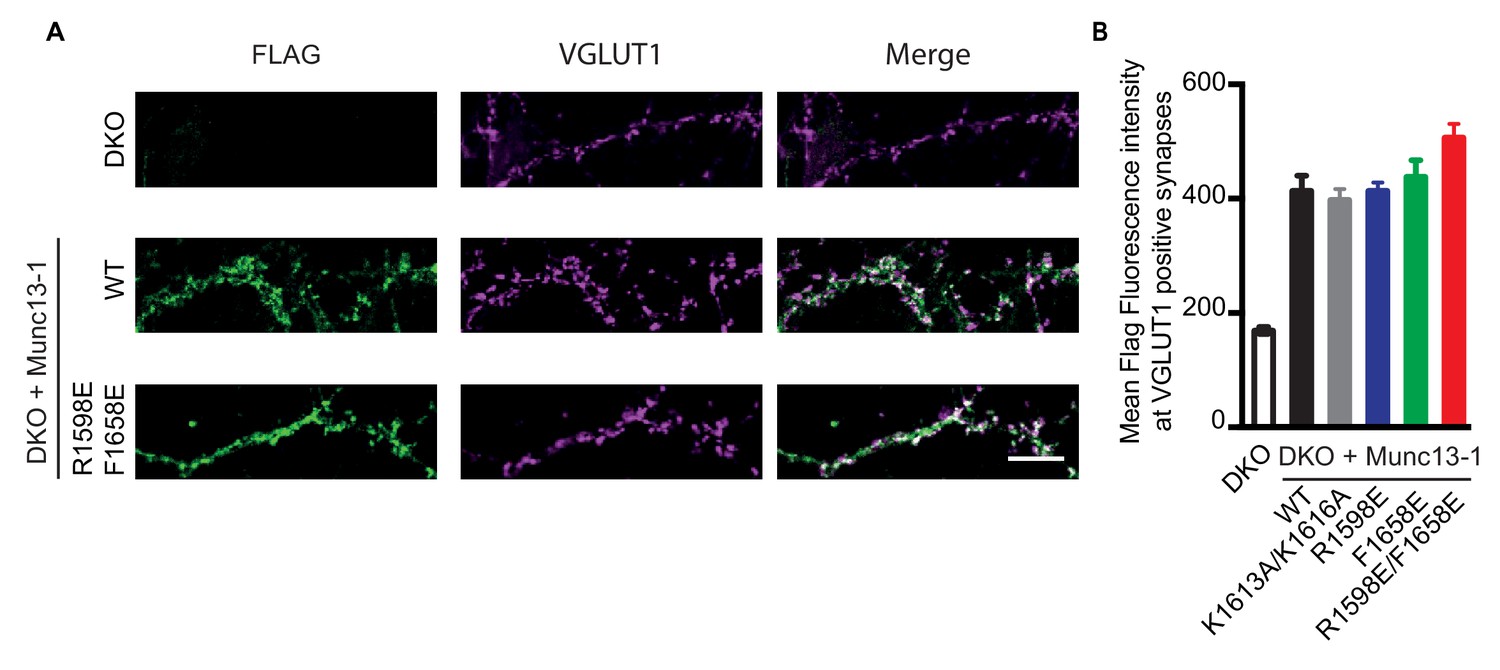
Localization and expression levels of WT Munc13-1 and Munc13-1 mutants in rescue experiments.
(A) Representative images of Munc13-1/2 DKO and Munc13-1/2 DKO hippocampal neurons rescued with FLAG-tagged Munc13-1 WT or Munc13-1 R1598E/F1658E double point mutant, showing synaptic structures with the double labeling for FLAG and the glutamatergic presynaptic marker VGLUT1. Each column of images shows the labeling of FLAG in green, VGLUT1 in magenta and merge. Scale bar, 10 μm. (B) Quantification of mean FLAG fluorescent intensity per cell of Munc13-1/2 DKO and Munc13-1/2 DKO rescued with Munc13-1 WT and C2C mutants at VGLUT1 positives compartments. FLAG mean intensity was analyzed in 50 VGLUT1-positives synapses per cell, in 10 different cells per group in two independent cultures. No statistically significant differences between the different groups were observed by a Kruskal Wallis test.
Figure 7—figure supplement 2
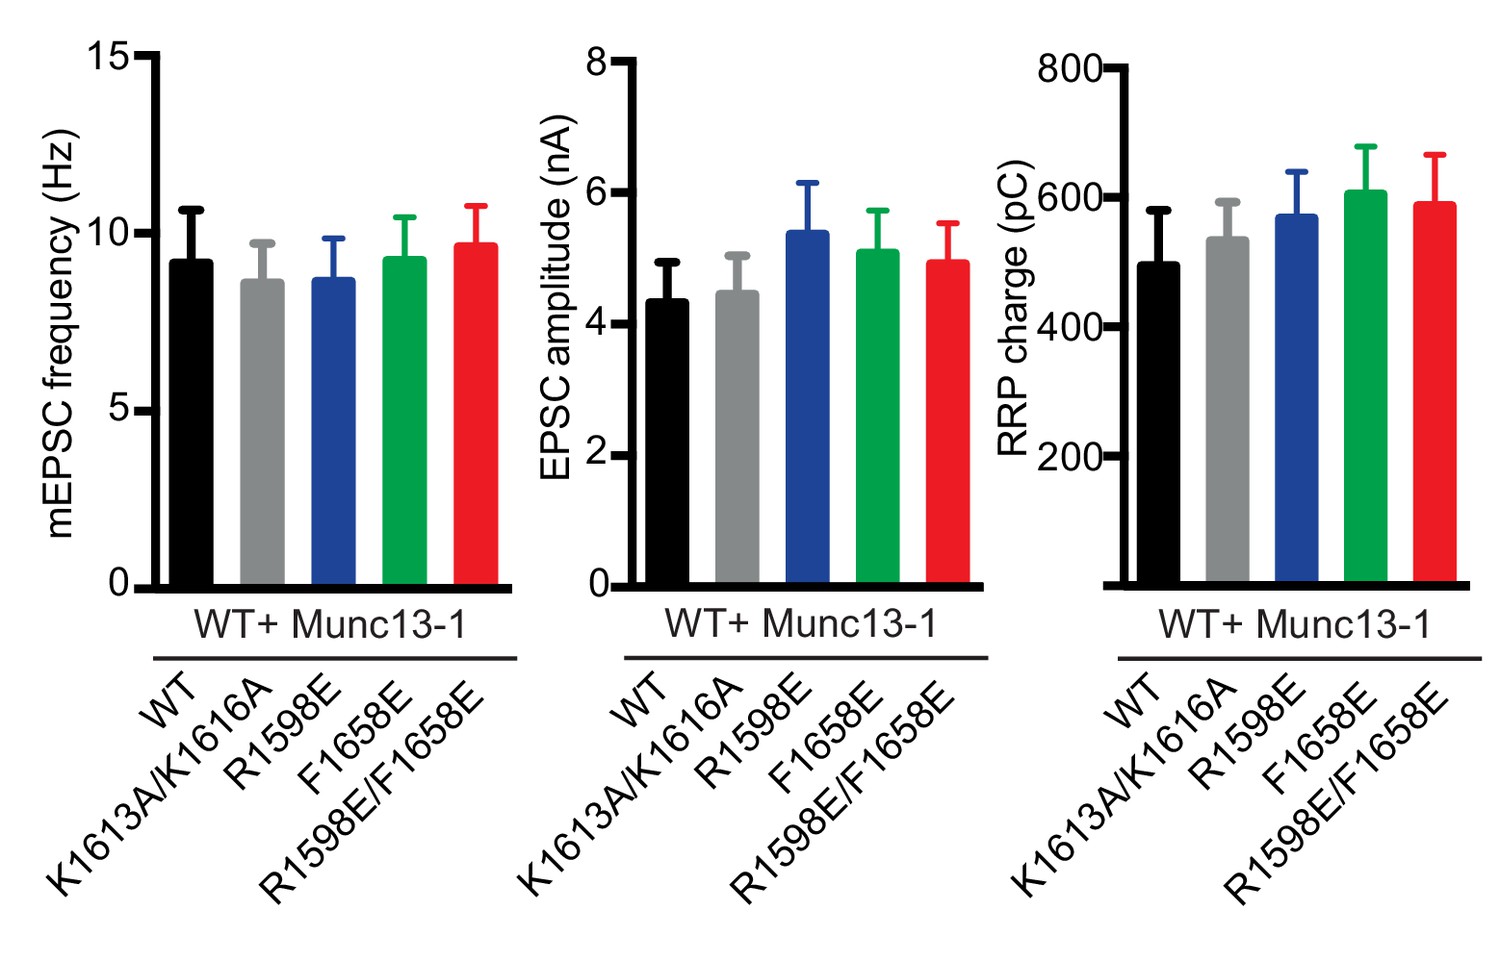
Electrophysiological analysis of the functional effects of overexpressing Munc13-1 bearing mutations in the putative membrane-binding loops and the polybasic region of the C2C domain.
Summary plots of average mEPSC frequencies, EPSC amplitudes and RRP charges from WT autaptic hippocampal neurons with overexpression of either Munc13-1 WT or the indicated Munc13-1 C2C point mutants. The data from approximately 40 neurons per group were pooled together from two independent cultures. Values indicate mean ±SEM. No statistically significant differences between the different groups were observed by a Kruskal Wallis test.
Figure 8
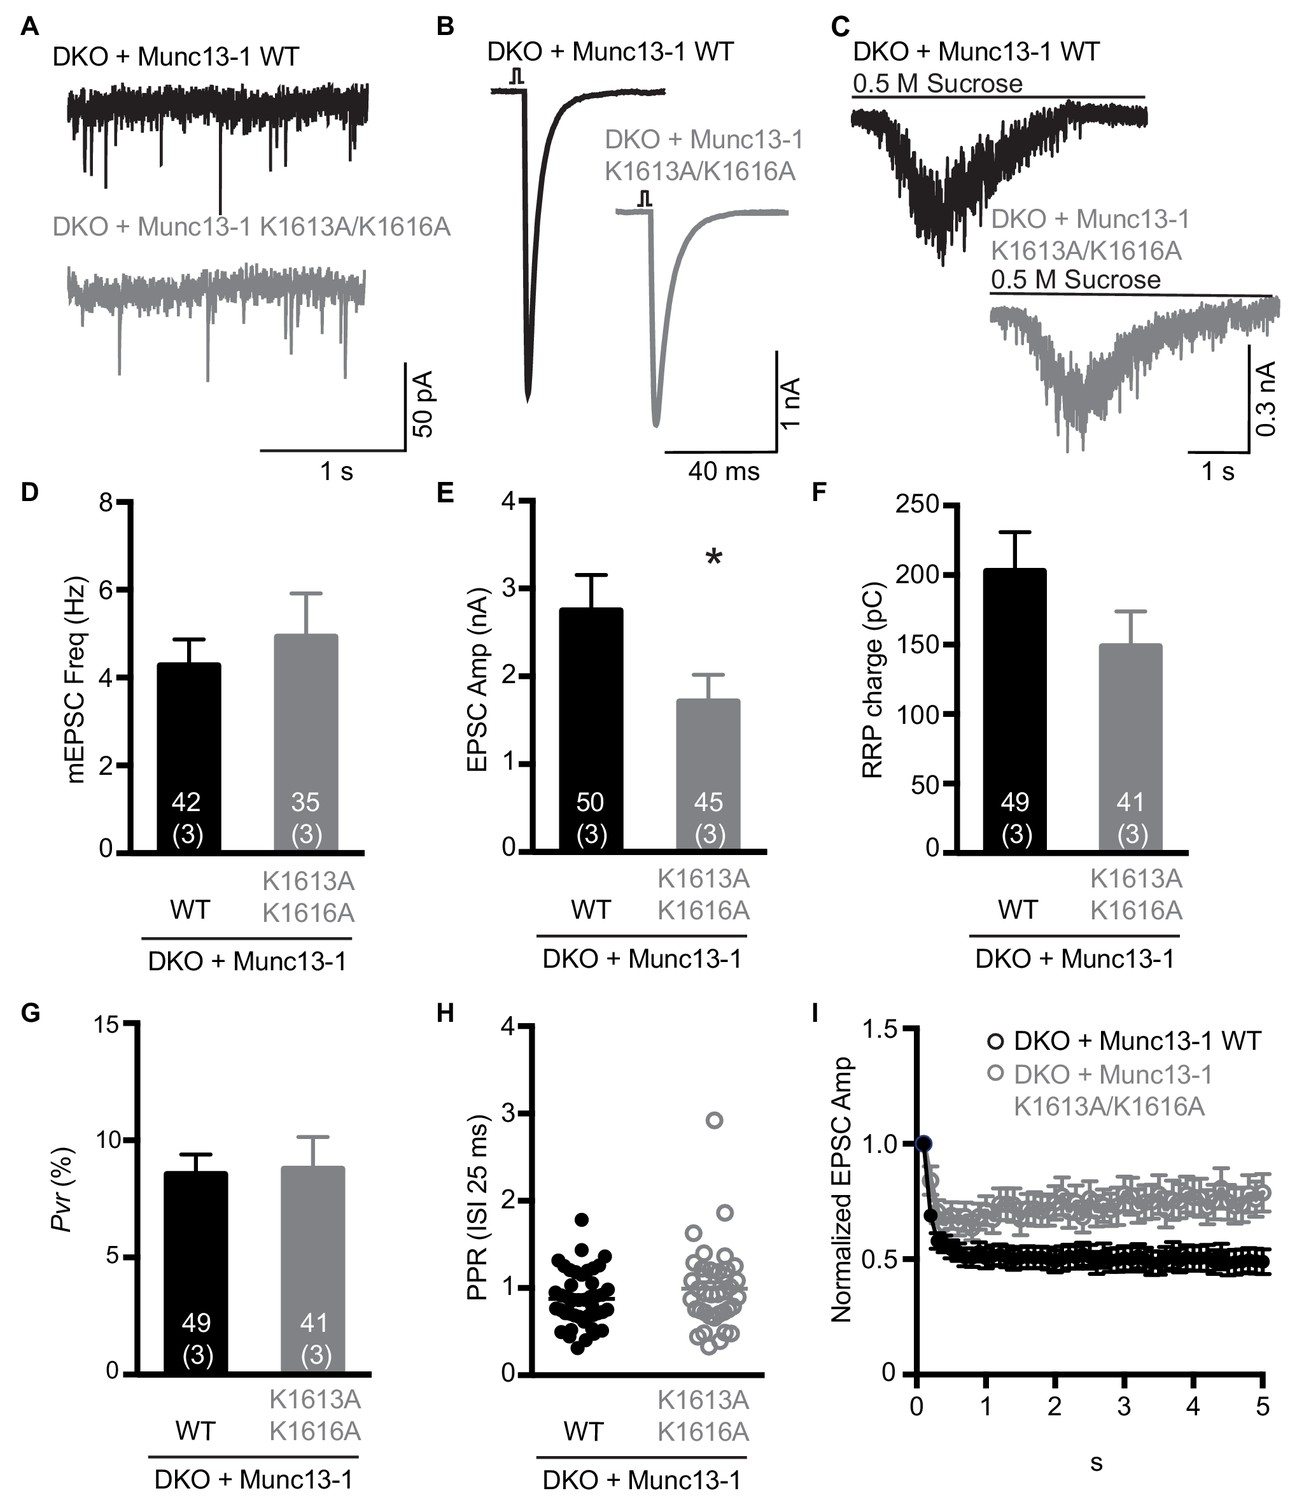
Electrophysiological analysis of the functional effects of mutations in the polybasic region of the Munc13-1 C2C domain.
(A–C) Examples of mEPSC (A), EPSCs (B) and sucrose induced currents (C) recorded from DKO neurons expressing WT Munc13-1 (black) or a Munc13-1 with a double point mutation at the polybasic stretch within the C2C domain, Munc13-1 K1613A/K1616A (grey). (D–F) Plots showing the average mEPSC frequencies (D), EPSC amplitudes (E) and RRP charges (F), obtained from the DKO neurons rescued with WT or K1613A/K1616A mutant Munc13-1. (G) Calculated Pvr in % for Munc13-1 WT and for the polybasic mutant K1613A/K1616A. (H) Graph showing the average paired-pulse ratios calculated from 2 APs with ISI of 25 ms (40 Hz) of DKO rescued with WT or K1613A/K1616A mutant Munc13-1. (I) Analysis of EPSC amplitudes in response to a train of 50 AP with an ISI of 100 ms (10 Hz) normalized to the first EPSC and plotted over time for the WT or K1613A/K1616A mutant Munc13-1 rescues. Numbers within the bars represent the number of neurons pooled together of each group. Numbers in parentheses represent the number of cultures or replicates used. All data are mean ± SEM. Significance and p values were determined by Mann Whitney test. *p<0.05.
-
Figure 8—source data 1
Numerical description and statistics of data presented in Figure 8.
- https://doi.org/10.7554/eLife.42806.019
Figure 9
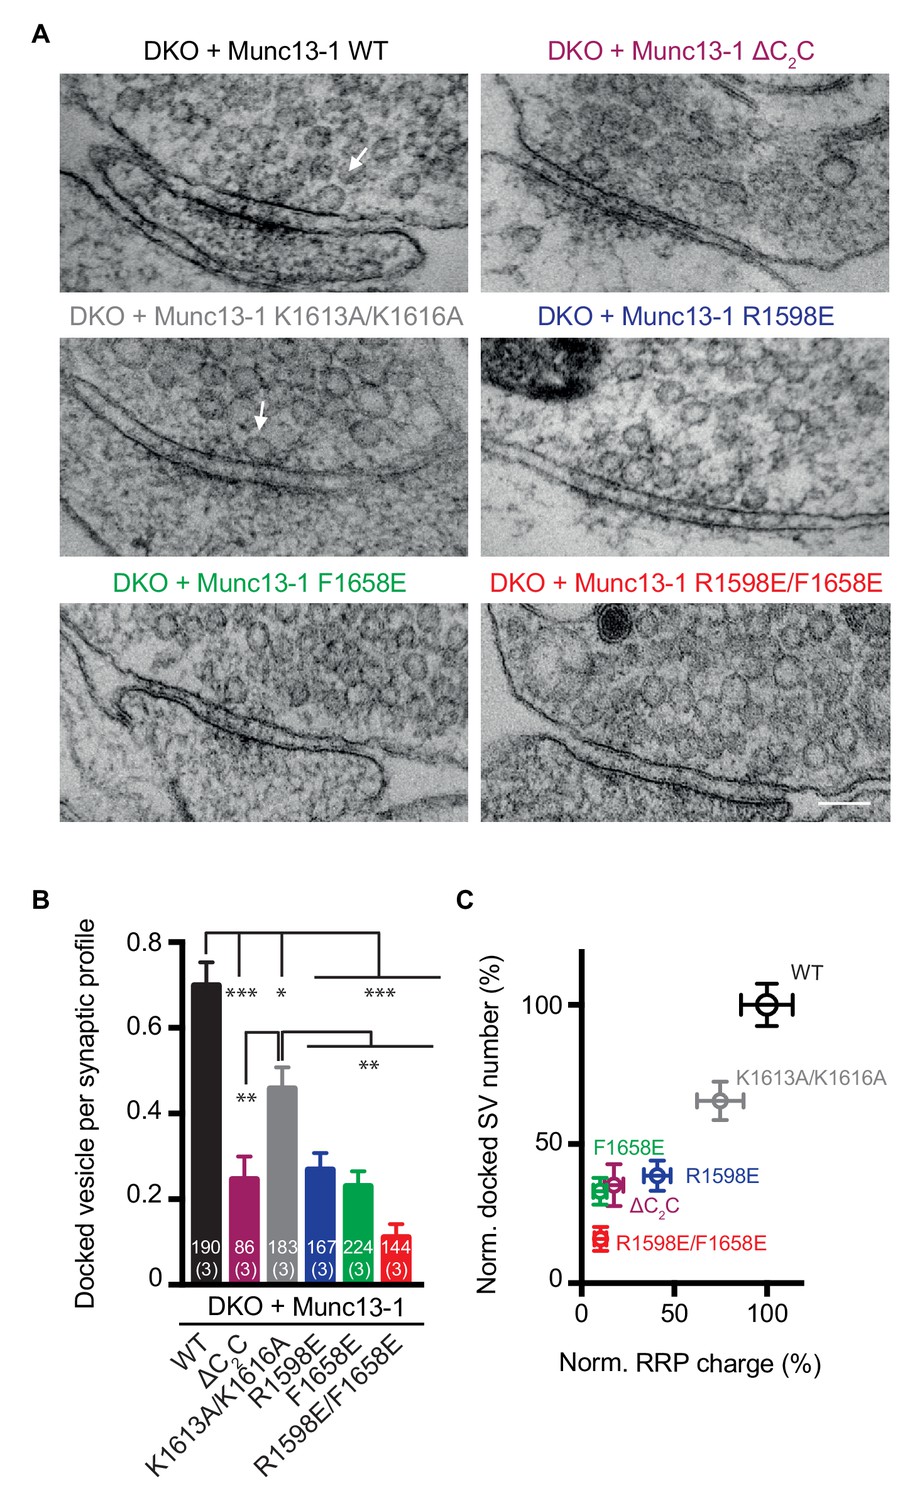
Effects of mutations in the Munc13-1 C2C domain on synaptic vesicle docking.
(A) Electron micrographs of synapses from DKO hippocampal cultures rescued with WT Munc13-1 and the indicated Munc13-1 C2C mutants. White arrows indicate docked synaptic vesicles making contact with plasma membrane active zones. Scale bar represents 100 nm. (B) Mean number of docked synaptic vesicles per synaptic profile for WT Munc13-1 and the indicated Munc13-1 C2C mutants. (C) Plot showing the correlation between primed and docked synaptic vesicles measured after the rescues with WT Munc13-1 and the indicated Munc13-1 mutants. Numbers in bars are the number of synapses pooled together for each group. Numbers in parentheses represent the number of cultures or replicates used. Error bars represent s.e.m. Significance and p values were determined by Kruskal Wallis test followed by a multiple comparison. Values indicate mean ± SEM. *p<0.05; **p<0.01; ***p<0.001; ****p<0.0001.
-
Figure 9—source data 1
Numerical description and statistics of data presented in Figure 9.
- https://doi.org/10.7554/eLife.42806.021
Additional files
-
Transparent reporting form
- https://doi.org/10.7554/eLife.42806.022
Download links
A two-part list of links to download the article, or parts of the article, in various formats.
Downloads (link to download the article as PDF)
Open citations (links to open the citations from this article in various online reference manager services)
Cite this article (links to download the citations from this article in formats compatible with various reference manager tools)
Membrane bridging by Munc13-1 is crucial for neurotransmitter release
eLife 8:e42806.
https://doi.org/10.7554/eLife.42806


