A systematic approach to identify recycling endocytic cargo depending on the GARP complex
- University of Osnabrück, Germany
Figures
Figure 1
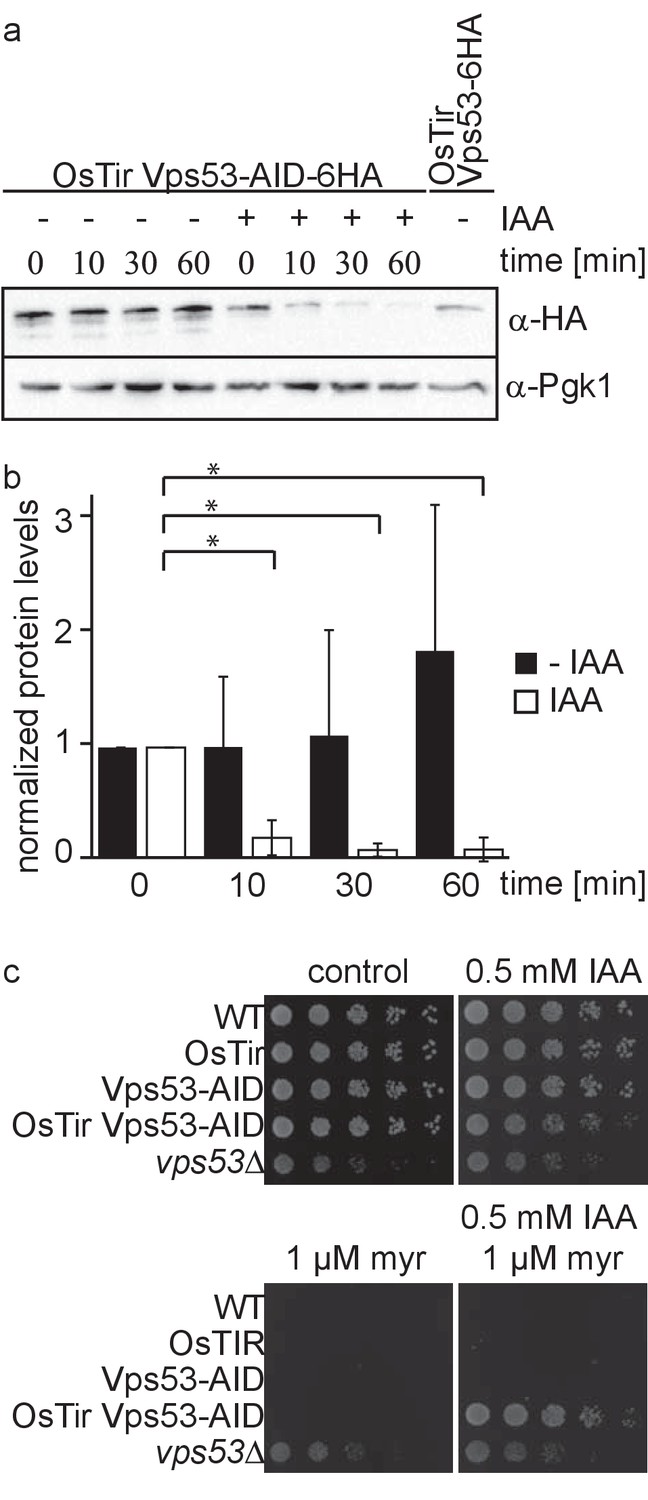
Vps53 can be depleted using the auxin induced degron system.
(a) AID tagged Vps53 is rapidly degraded after addition of IAA. OsTir Vps53-AID-6HA cells were treated with IAA or ethanol (control) for the indicated times. Cells were lysed and equal amounts of proteins were loaded and analyzed by western blotting using antibodies against the HA tag or Pgk1 as a loading control. An OsTir Vps53-6HA strain was used as a control to exclude any effect of the AID tag on protein abundance. (b) Quantification of a (n = 7 experiments). Vps53-AID-HA band intensities were quantified and normalized to Pgk1 signals. Vps53-AID-6HA levels start to significantly decrease after 10 min of IAA induction (p=0.000009824). (c) Auxin induced degradation of Vps53 pheno-copies a VPS53 deletion. Wild-type cells, cells expressing OsTir, cells harboring the Vps53-AID-6HA tag, cells expressing OsTir and Vps53-AID-6HA and vps53Δ cells were serial diluted on control plates, plates containing 500 µM IAA, plates containing 1 µM myriocin and plates containing 500 µM IAA and 1 µM myriocin.
Figure 2
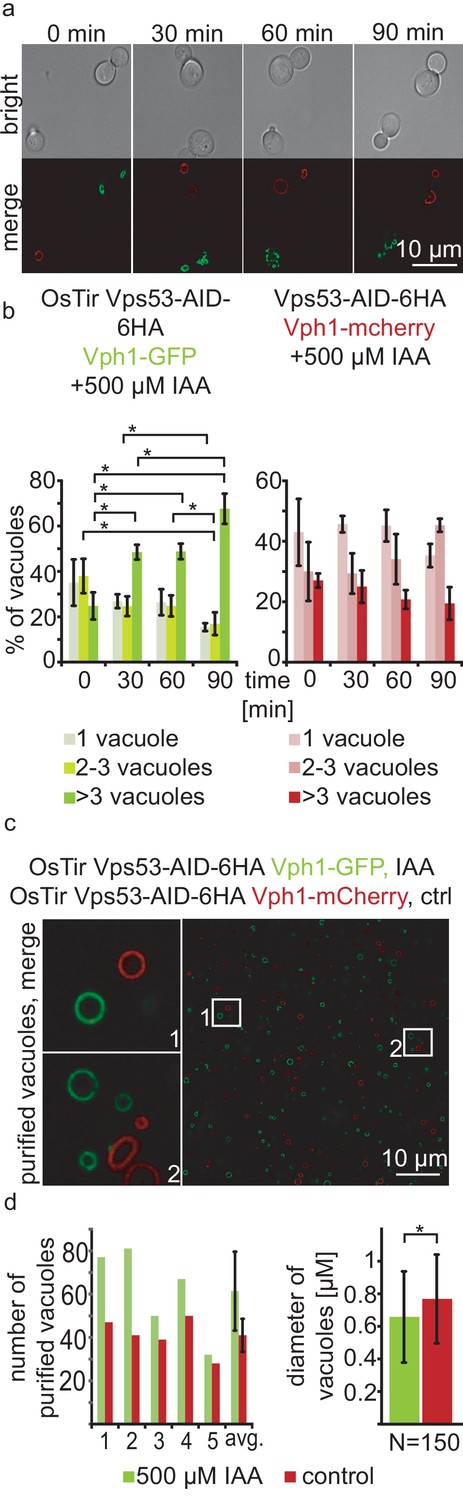
Acute depletion of Vps53 leads to vacuolar fragmentation.
(a) Yeast cells expressing Vps53-AID-6HA together with the OsTir ligase and Vph1-GFP (green vacuoles) and cells expressing only Vps53-AID-6HA and Vph1-mCherry were mixed and treated with 500 µM IAA for 0, 30, 60 and 90 mins. Brightfield images (upper panels) and merged images are shown (lower panels). Only cells expressing OsTir and Vps53-AID-6HA show fragmented vacuoles. Scale bar = 10 µM (b) Quantification of a. Vacuole fragmentation from three different experiments (error bars show standard deviation). Shown is the percentage of cells with one vacuole, 2–3 vacuoles or more than three vacuoles (green = a strain harboring OsTir Vps53-AID-6HA; red = a strain harboring only Vps53-AID-6HA). The amount of cells with more than three (=fragmented) vacuoles increases over time in the functional AID-strain (n = 30–200 cells per setting) (c) Vacuoles can be purified after auxin induced degradation of Vps53. Fluorescent microscopy of purified vacuoles from IAA or mock treated Vps53-AID-6HA strains. Cells with the functional AID-strain and GFP-marked vacuoles were incubated with IAA. Cells with the functional AID-strain and mCherry-marked vacuoles were mock treated with EtOH as control. Vacuoles were isolated from the two strains that were mixed prior to lysis. (d) Quantification of the amount (left) and the diameter (right) of purified vacuoles. In average from five different samples the amount of vacuoles from IAA induced cells is slightly higher than control vacuoles. Purified vacuoles from mock treated and IAA treated cells show no significant difference in vacuolar diameter.
Figure 3
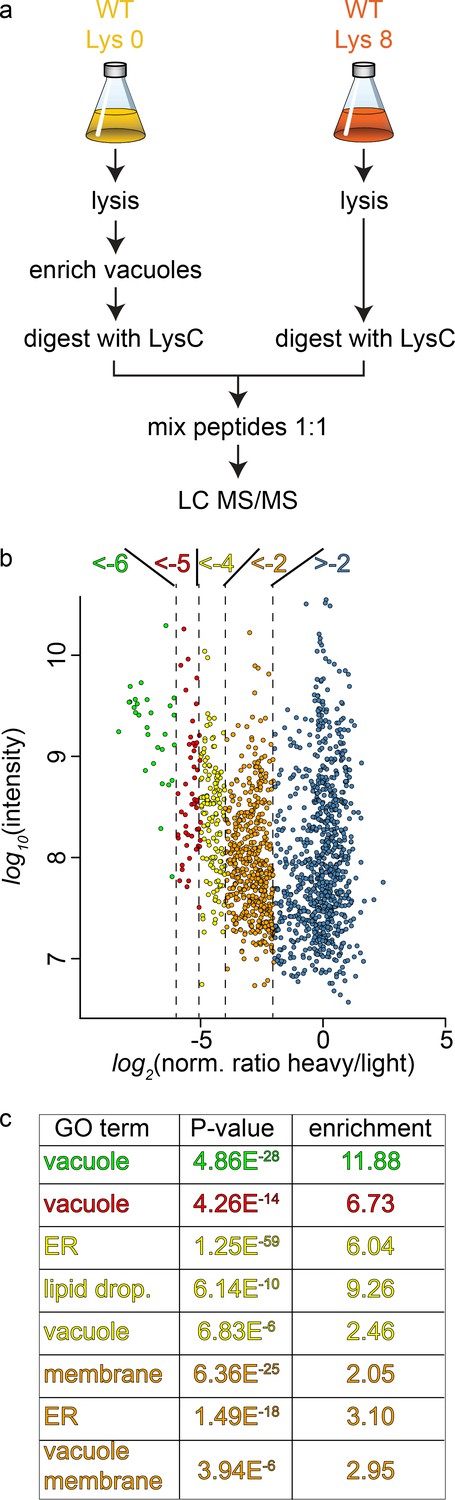
Proteomic analysis of enriched yeast vacuoles.
(a) Experimental setup to determine vacuolar enrichment. (b) Proteomic analysis of purified vacuoles mixed whole cell lysates. Proteins are color coded according to ratio bins (<-6, green; −6->-5, red; −5->-4, yellow; −4->-2, orange; −2- > 5, blue). Protein intensities are plotted against heavy/light SILAC ratios. (c) Enriched GO terms in the ratio bins from b. Go terms were calculated according to the Gene Ontology enRIchment anaLysis and visuaLizAtion tool, GOrilla.
-
Figure 3—source data 1
List of all proteins identified including SILAC ratios and intensities.
- https://doi.org/10.7554/eLife.42837.005
Figure 4 with 1 supplement
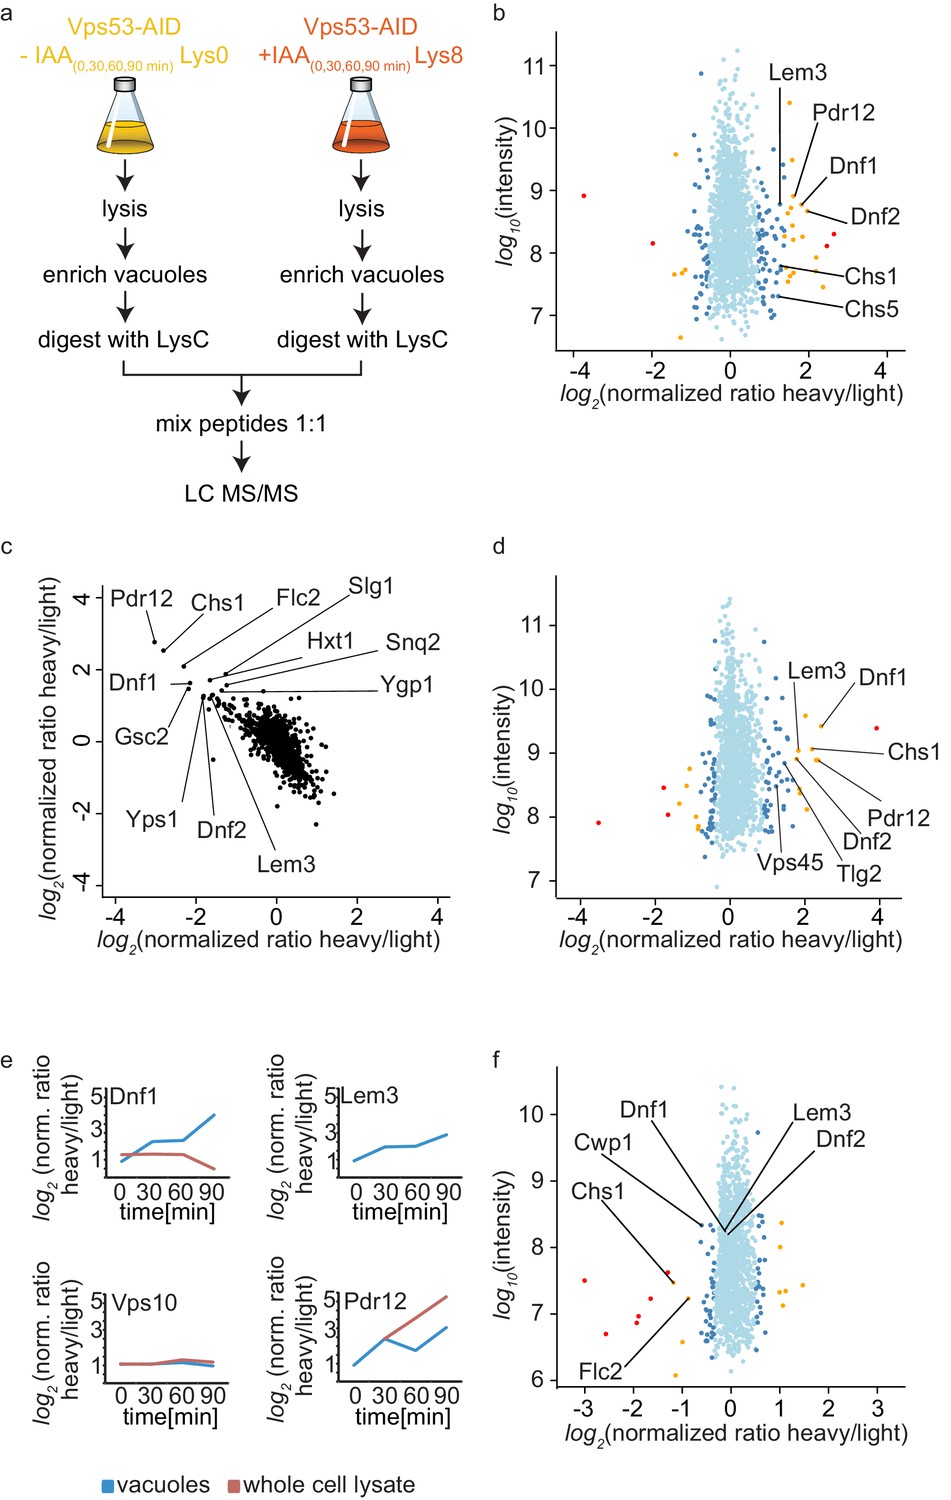
Mass spectrometry based proteomics to identify proteins mis-targeted to vacuoles in GARP depleted cells.
(a) Experimental setup to determine proteins mis-sorted to the vacuole in GARP complex depleted cells. (b) Amino-phospholipid flippases are targeted to the vacuole after 90 min of IAA induced GARP depletion. Proteomic analysis of vacuoles from IAA and mock treated OsTir Vps53-AID-6HA cells is shown. Protein intensities are plotted against heavy/light SILAC ratios. Significant outliers are colored in red (p<1−11), orange (p<1−4), or steel blue (p<0.05); other proteins are shown in light blue. (c) Control experiment for b). A label switching experiment of IAA induced depletion of GARP followed by proteomics analysis of the vacuoles is shown. Heavy to light ratios from an experiment where lysine 8 labelled cells were treated with IAA are plotted on the x axis vs the same experiment where the lysine 0 labelled cells were treated with IAA on the y axis. (d) Same experiment as in b) but in pep4Δ strains. (e) Heavy to light ratio profiles of four different proteins are shown over the time-course of IAA treatment. SILAC ratios of the vacuolar samples are shown in blue, SILAC ratios of the entire cell extract are shown in red. Note that for the flippase Dnf2 the vacuolar ratio increases while the ratio for the entire cell extract decreases. Vps10 does not show any difference in both. Pdr12 ratios increase in both samples. (f) The AP-2 pathway is the cargo adaptor for cell wall proteins but not for amino-phospholipid flippases. Proteomic analysis of vacuoles from IAA treated, light labelled OsTir Vps53-AID-6HA cells and heavy labelled OsTir Vps53-AID-6HA apl1Δ cells is shown. Protein intensities are plotted against heavy/light SILAC ratios. Significant outliers are colored in red (p<1−11), orange (p<1−4), or steel blue (p<0.05); other proteins are shown in light blue.
-
Figure 4—source data 1
List of all proteins identified including SILAC ratios and intensities from the time course of auxin induced Vps53 degradation.
- https://doi.org/10.7554/eLife.42837.008
-
Figure 4—source data 2
List of all proteins identified including SILAC ratios and intensities from the control experiments.
- https://doi.org/10.7554/eLife.42837.009
-
Figure 4—source data 3
List of all proteins identified including SILAC ratios and intensities from auxin induced Vps53 degradation in a pep4Δ background.
- https://doi.org/10.7554/eLife.42837.010
-
Figure 4—source data 4
List of all proteins identified including SILAC ratios and intensities from auxin induced Vps53 degradation in an apl1Δ background.
- https://doi.org/10.7554/eLife.42837.011
Figure 4—figure supplement 1
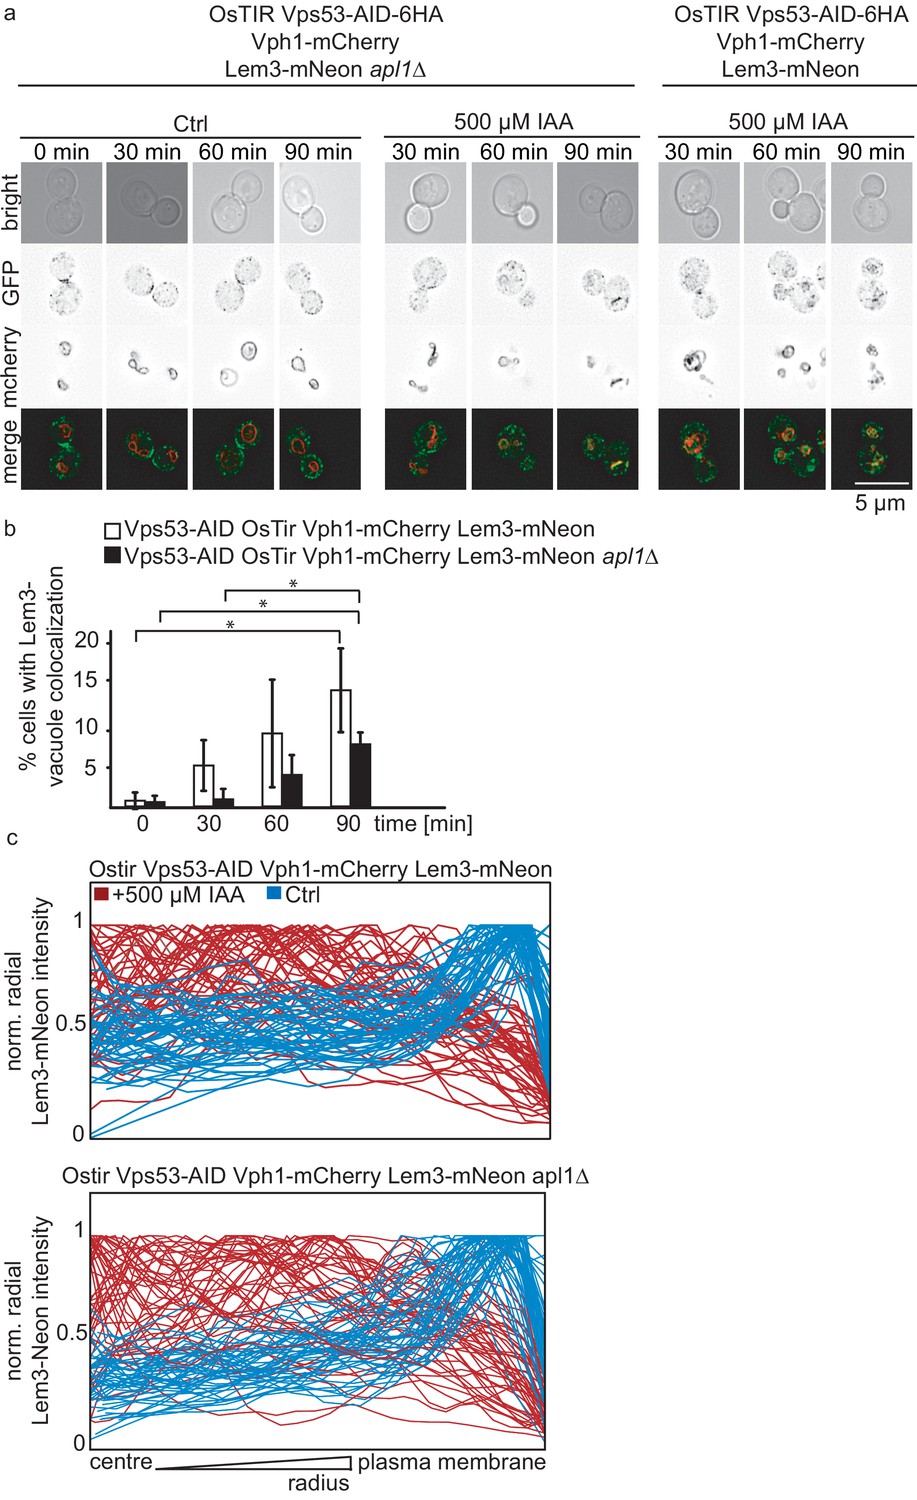
Analysis of Lem3-mNeon localization depending on the AP-2 complex.
(a) Co-localization of mNeon-tagged Lem3 with mCherry-tagged Vph1 in a strain harboring OsTir Vps53-AID-6HA apl1Δ with (middel panels) and without IAA (left panels) and OsTir Vps53-AID-6HA treated with IAA (right panels). Representative mid-sections are shown. Scale bar = 5 µM. (b) Quantification of a). Error bars show the standard deviation of 3 different experiments. (c) Analysis of the intracellular localization of Lem3-mNeon using the radial profile plot plugin from imageJ. Control cells (blue) in OsTir Vps53-AID-6HA (upper graph) and OsTir Vps53-AID-6HA apl1Δ (lower graph) show most of the signal towards the plasma membrane. IAA treated cells (red lines) in a WT (upper graph) and apl1Δ background (lower graph) show most of the signal towards the center of the cell with concomitant depletion of the plasma membrane signal.
Figure 5 with 1 supplement
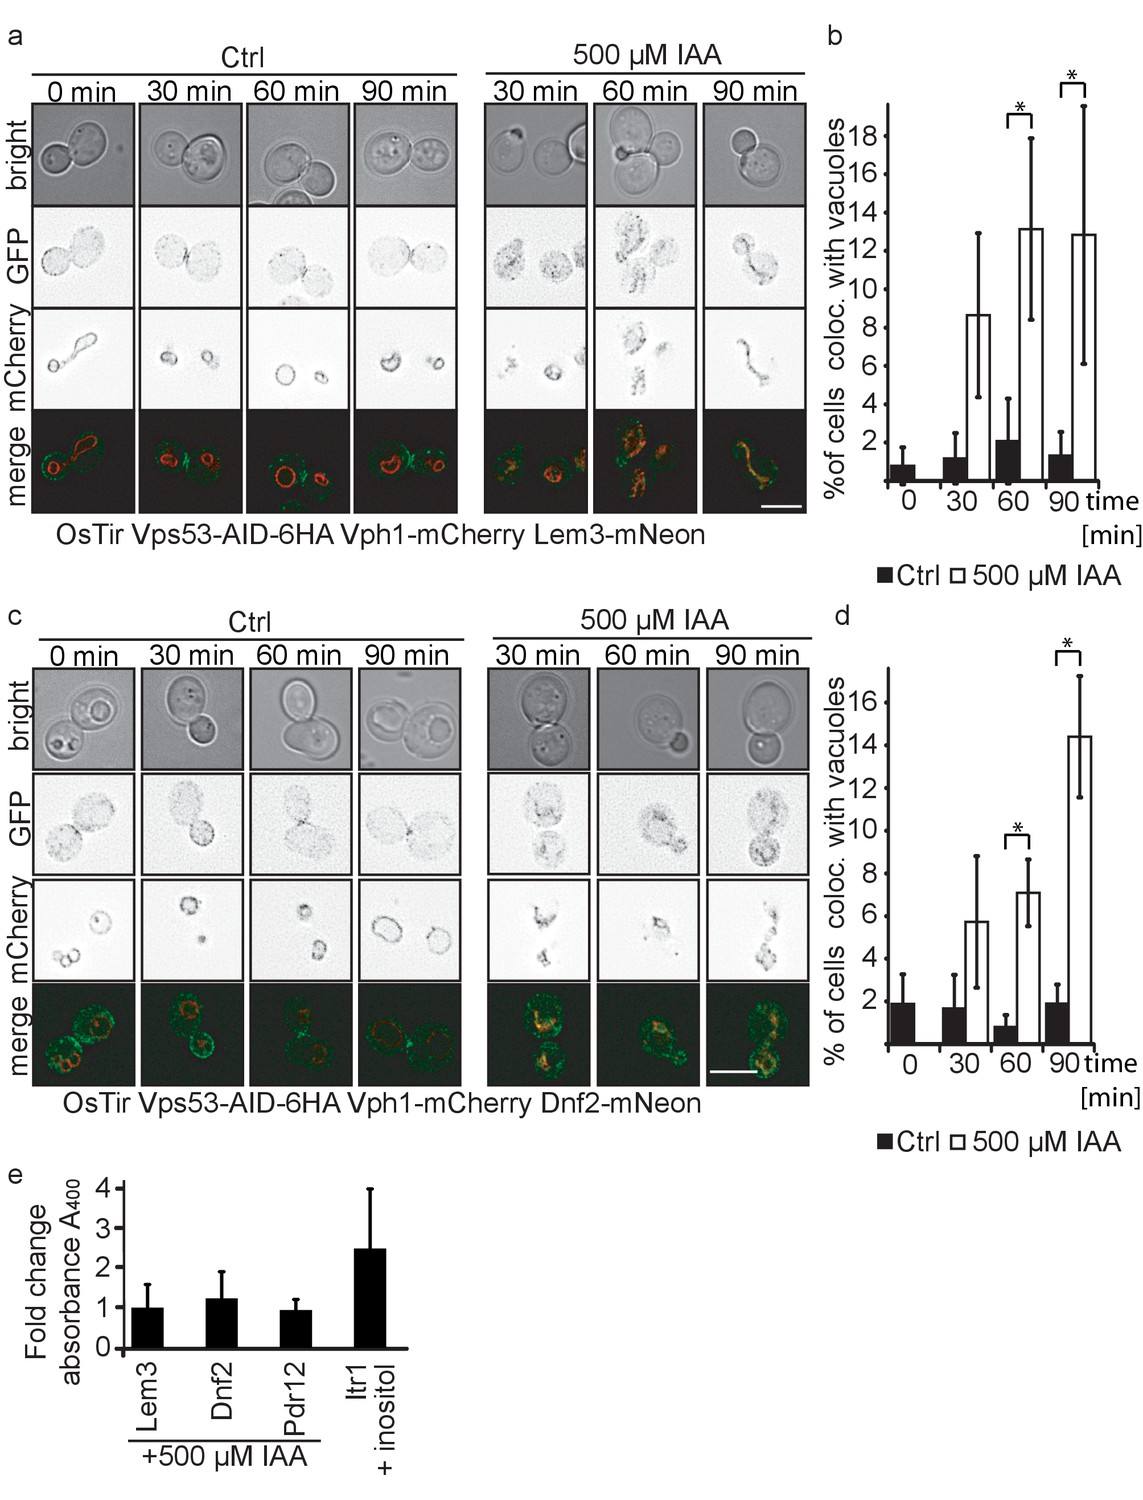
Plasma membrane localized flippases re-localize to vacuoles in GARP complex depleted cells.
(a) Co-localization of mNeon-tagged Lem3 (second row from top) with mCherry-tagged Vph1 (third row from top) are shown in mock treated and IAA treated cells. Representative mid-sections are shown. Scale bar = 5 µM (b) Quantification of 4 different experiments shows co-localization of vacuoles and Lem3 in approximately 15% of cells after 90 min (error bars show standard deviation). (c) Co-localization of mNeon-tagged Dnf2 (second row from top) with mCherry-tagged Vph1 (third row from top) are shown in mock treated and IAA treated cells. Representative mid-sections are shown. Scale bar = 5 µM (d) Quantification shows an increase in the number of cells where Dnf2 co-localizes with vacuoles after IAA induced degradation of Vps53 up to 15% after 90 min. Error bars show the standard deviation of 3 different experiments. (e) Fold change Pho8 activity of plasma membrane reporters for sorting into vacuoles. Fold change was calculated as the ratio of drug treated and control samples. (IAA for Dnf2, Lem3, Pdr12 and inositol for Itr1). Error bars represent standard deviations from three to five independent experiments.
Figure 5—figure supplement 1
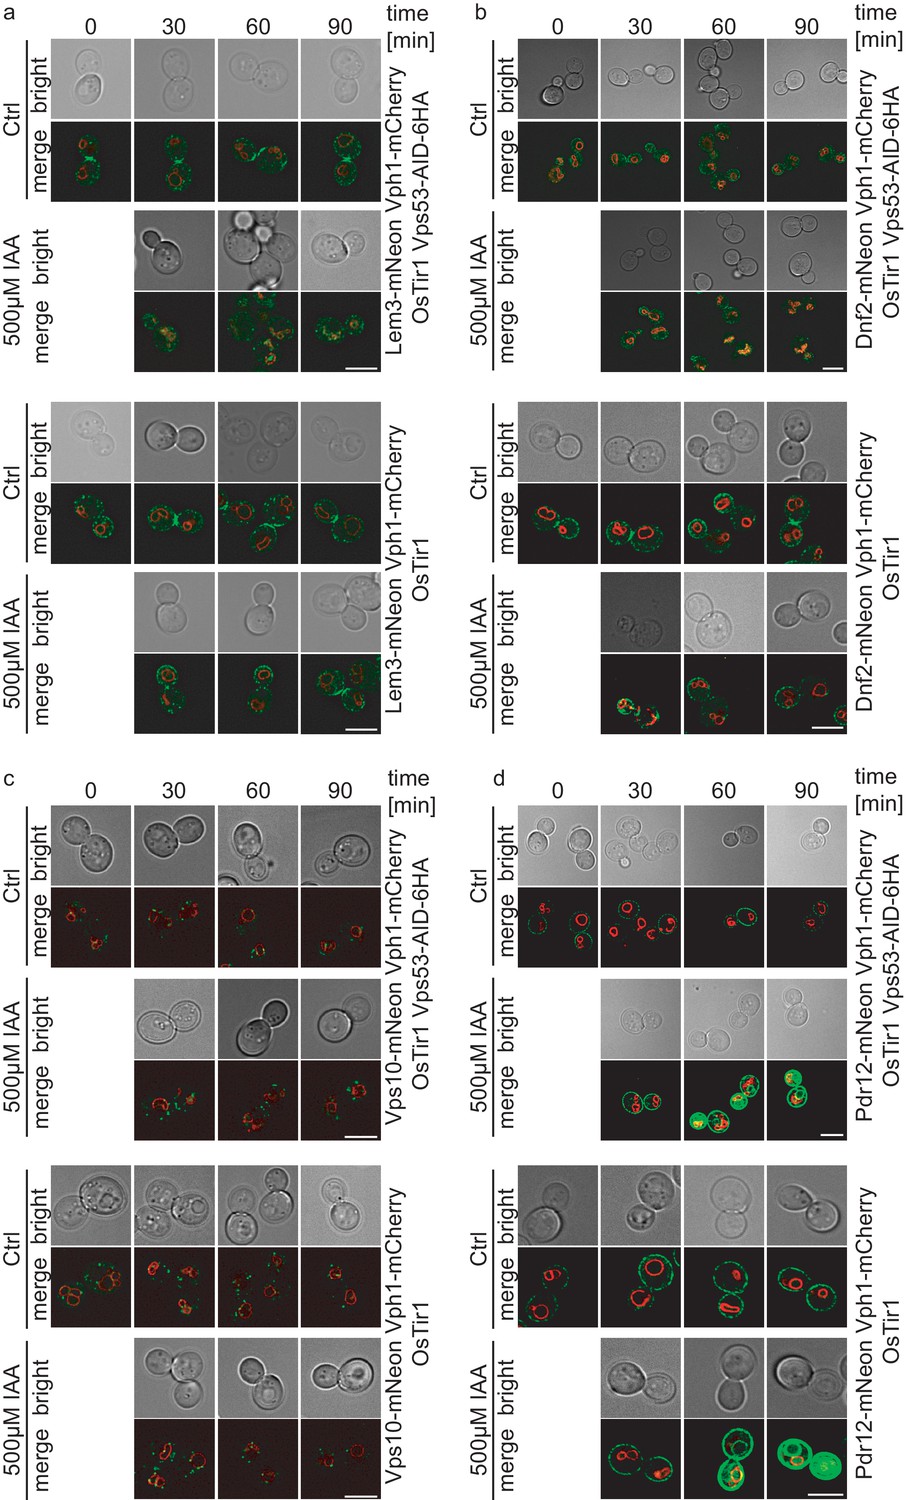
Colocalization studies of Lem3, Dnf2, Vps10 and Pdr12 with vacuoles after IAA induced degradation of Vps53.
(a) Co-localization of mNeon-tagged Lem3 with mCherry-tagged Vph1 in a strain harboring OsTir Vps53-AID-6HA are shown in mock treated (upper panels; upper part) and IAA treated cells (lower panels; upper part). Representative mid-sections are shown. Co-localization of mNeon-tagged Lem3 with mCherry-tagged Vph1 in a strain harboring only OsTir are shown in mock treated (upper panels; lower part) and IAA treated cells (lower panels; lower part). Representative mid-sections are shown. (b) Co-localization of mNeon-tagged Dnf2 with mCherry-tagged Vph1 in a strain harboring OsTir Vps53-AID-6HA are shown in mock treated (upper panels; upper part) and IAA treated cells (lower panels; upper part). Representative mid-sections are shown. Co-localization of mNeon-tagged Dnf2) with mCherry-tagged Vph1 in a strain harboring only OsTir are shown in mock treated (upper panels; lower part) and IAA treated cells (lower panels; lower part). Representative mid-sections are shown. (c) Co-localization of mNeon-tagged Vps10 with mCherry-tagged Vph1 in a strain harboring OsTir Vps53-AID-6HA are shown in mock treated (upper panels; upper part) and IAA treated cells (lower panels; upper part). Representative mid-sections are shown. Co-localization of mNeon-tagged Vps10 with mCherry-tagged Vph1in a strain harboring only OsTir are shown in mock treated (upper panels; lower part) and IAA treated cells (lower panels; lower part). Representative mid-sections are shown. (d) Co-localization of mNeon-tagged Pdr12 with mCherry-tagged Vph1 in a strain harboring OsTir Vps53-AID-6HA are shown in mock treated (upper panels; upper part) and IAA treated cells (lower panels; upper part). Representative mid-sections are shown. Co-localization of mNeon-tagged Pdr12 with mCherry-tagged Vph1 in a strain harboring only OsTir are shown in mock treated (upper panels; lower part) and IAA treated cells (lower panels; lower part). Representative mid-sections are shown. scale bars = 5 µM.
Figure 6
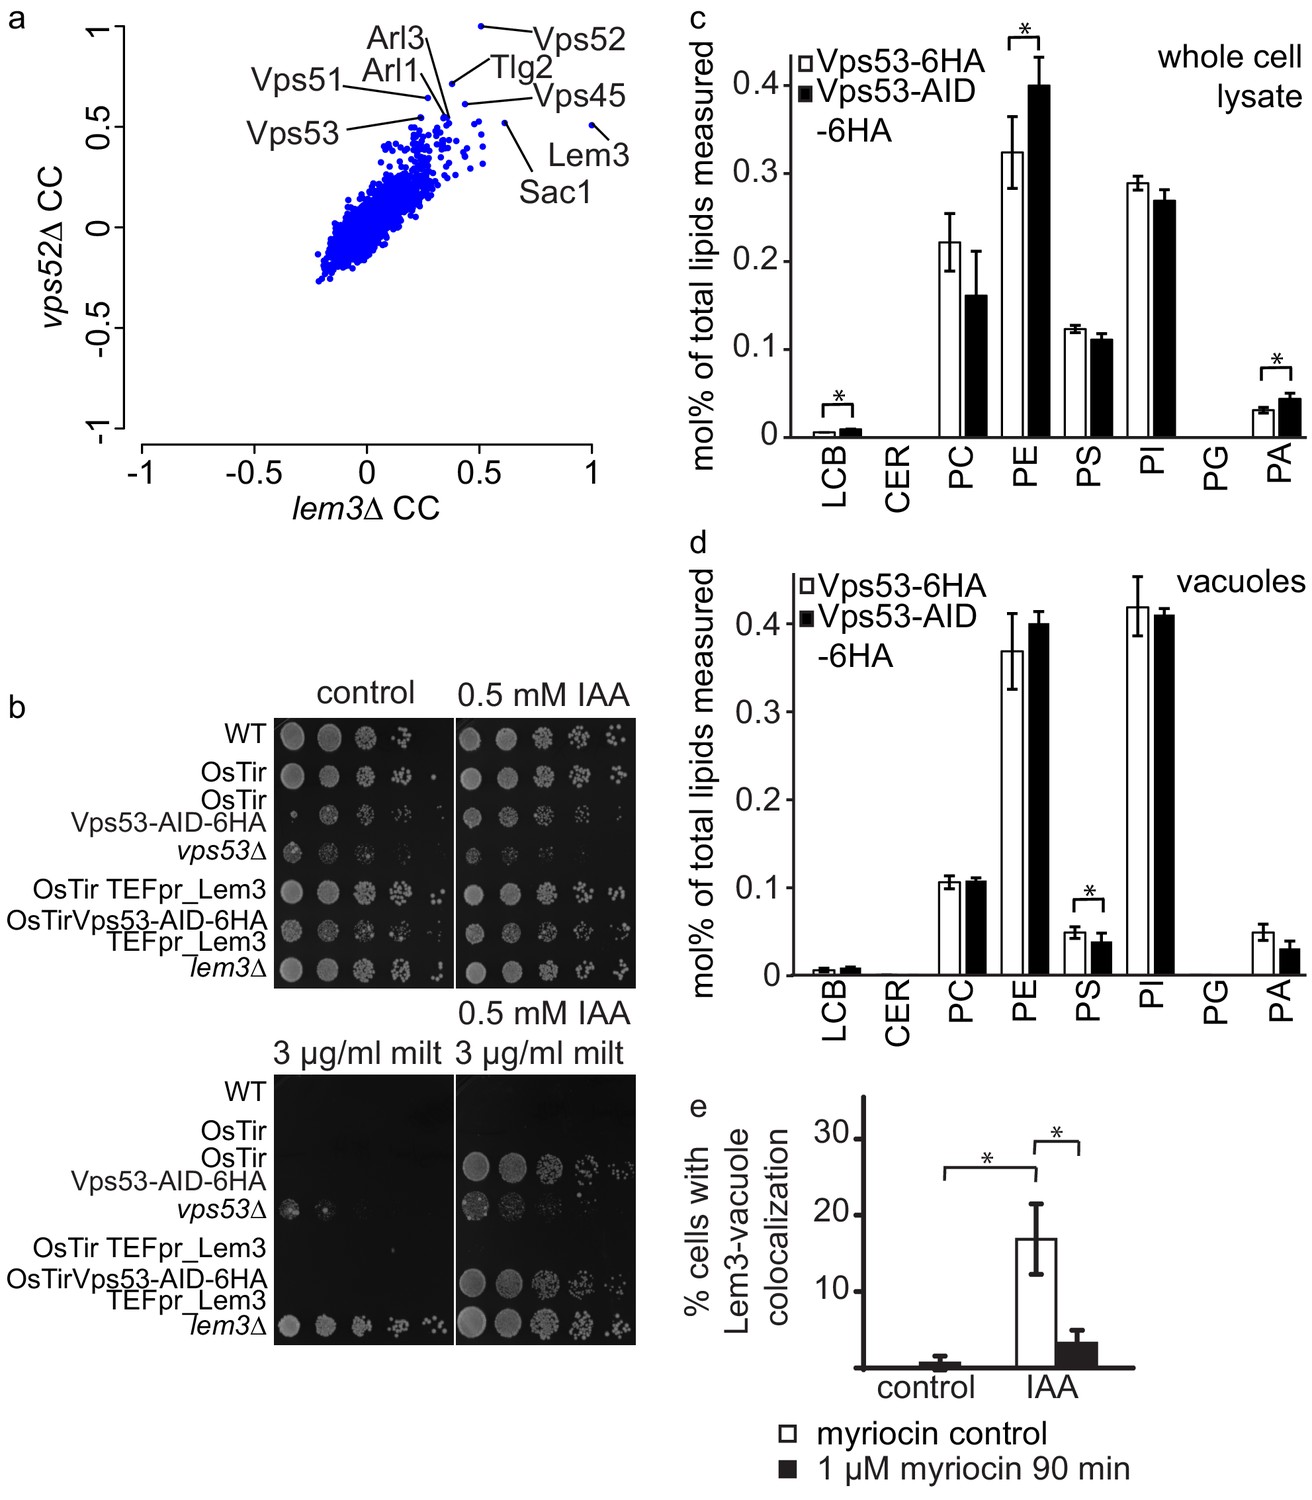
GARP depletion pheno-copies the deletion of LEM3 and affects the cellular lipidome.
(a) GARP knockouts and LEM3 knockouts show highly correlating profiles in chemical genomics datasets. Correlation coefficients (CCs) between the profile of LEM3 and each other profile in the chemogenetic screen (Hoepfner et al., 2014) are plotted on the x-axis. Plotted on the y-axis are the similar sets of values for the VPS52 profile with all other profiles. (b) Depletion of VPS53 or LEM3 results in resistance to the cytotoxic PC analog miltefosine. WT cells, OsTir cells, Vps53-AID OsTir cells, vps53Δ cells, OsTir TEF_LEM3 cells, Vps53-AID OsTir TEF_LEM3 and lem3Δ cells were spotted on control plates (top left panel), plates containing 500 µM IAA (top right panel), plates containing miltefosine (lower left panel) or a combination of IAA and miltefosine (lower right panel). (c) GARP depletion results in changes of the cellular phospholipid composition. The lipidomic analysis of phosphoglycerolipids and sphingolipid intermediates from IAA treated OsTir Vps53-AID-6HA (black bars) or OsTir Vps53−6 HA cells are shown. Long chain bases (LCB), ceramides (CER) phosphatidic acid (PA), phosphatidyl-serine (PS), phosphatidyl-inositol (PI), phosphatidyl-ethanolamine (PE) phosphatidylcholine (PC) and phosphatidylglycerol (PG). (d) GARP depletion has a minor effect on the vacuolar lipidome. Same as c) except that lipids were extracted from enriched vacuoles. Error bars represent standard deviations from three different experiments. (e) Co-localization of mNeon-tagged Lem3 with mCherry-tagged Vph1 in a strain harboring OsTir Vps53-AID-6HA are shown in mock treated (control) and IAA treated cells (IAA). Quantification of 3 different experiments shows co-localization of vacuoles and Lem3 in approximately 15–20% of cells after 90 min IAA treatment compared to control cells (white bars). Additional addition of myriocin prevents Lem3 localization to the vacuole in IAA treated compared to control cells (black bars) (error bars show standard deviations).
Additional files
-
Supplementary file 1
List of all yeast strains used in this study.
- https://doi.org/10.7554/eLife.42837.015
-
Supplementary file 2
List of all plasmids used in this study.
- https://doi.org/10.7554/eLife.42837.016
-
Transparent reporting form
- https://doi.org/10.7554/eLife.42837.017
Download links
A two-part list of links to download the article, or parts of the article, in various formats.
Downloads (link to download the article as PDF)
Open citations (links to open the citations from this article in various online reference manager services)
Cite this article (links to download the citations from this article in formats compatible with various reference manager tools)
A systematic approach to identify recycling endocytic cargo depending on the GARP complex
eLife 8:e42837.
https://doi.org/10.7554/eLife.42837


