Nationally-representative serostudy of dengue in Bangladesh allows generalizable disease burden estimates
- Institut Pasteur, UMR2000, CNRS, France
- Johns Hopkins Bloomberg School of Public Health, United States
- International Centre for Diarrhoeal Disease Research, Bangladesh (icddr,b), Bangladesh
- University of California, San Francisco, United States
- Institute of Epidemiology, Disease Control and Research (IEDCR), Bangladesh
- Centers for Disease Control and Prevention, United States
Figures
Figure 1 with 3 supplements
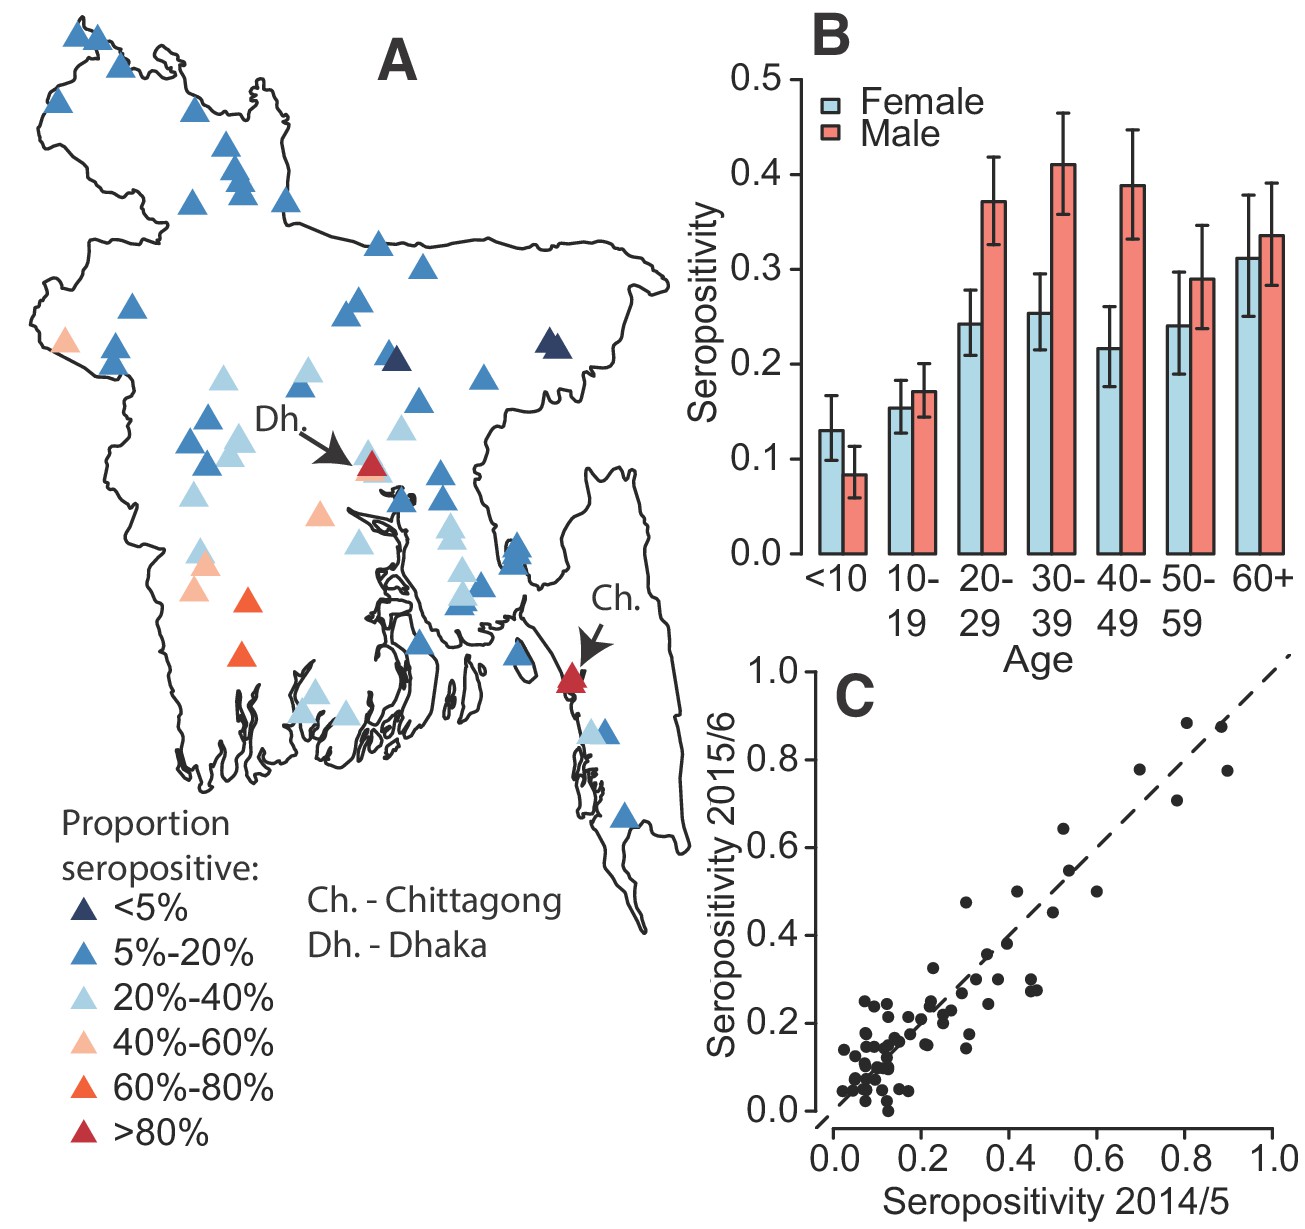
Dengue seropositivity in the sampled communities.
(A) Locations of sampled communities and the estimated seroprevalence by community. (B) Proportion seropositive by age and sex with 95% confidence intervals. (C) Seropositivity in Y1 compared to seropositivity in Y2 for each community.
Figure 1—figure supplement 1

Participants included in study.
https://doi.org/10.7554/eLife.42869.004
Figure 1—figure supplement 2
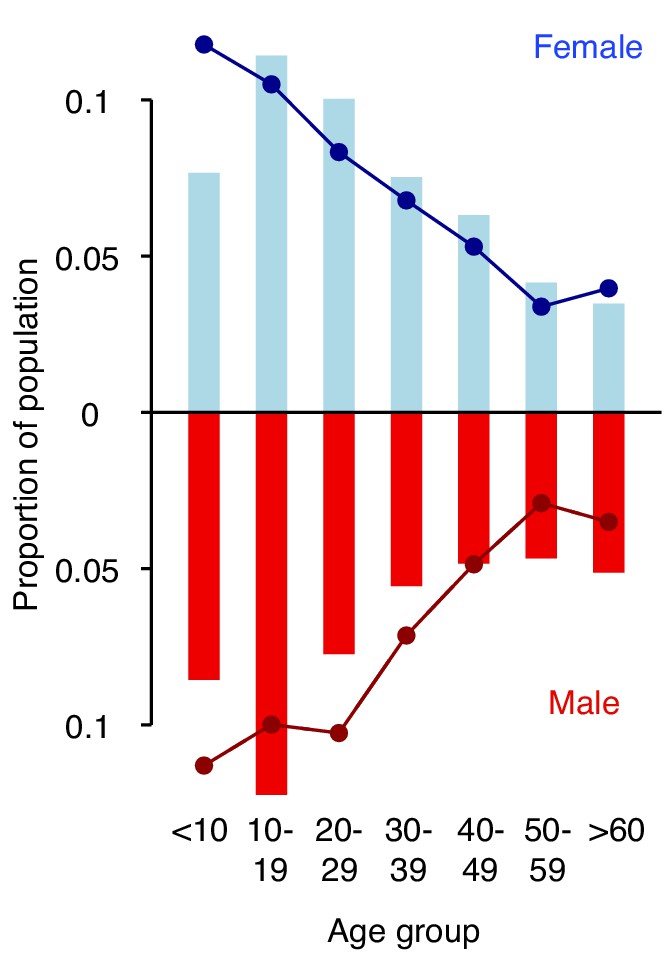
Distribution of age groups in years and sex (solid bars) in the study population compared to the 2011 census (lines).
https://doi.org/10.7554/eLife.42869.005
Figure 1—figure supplement 3
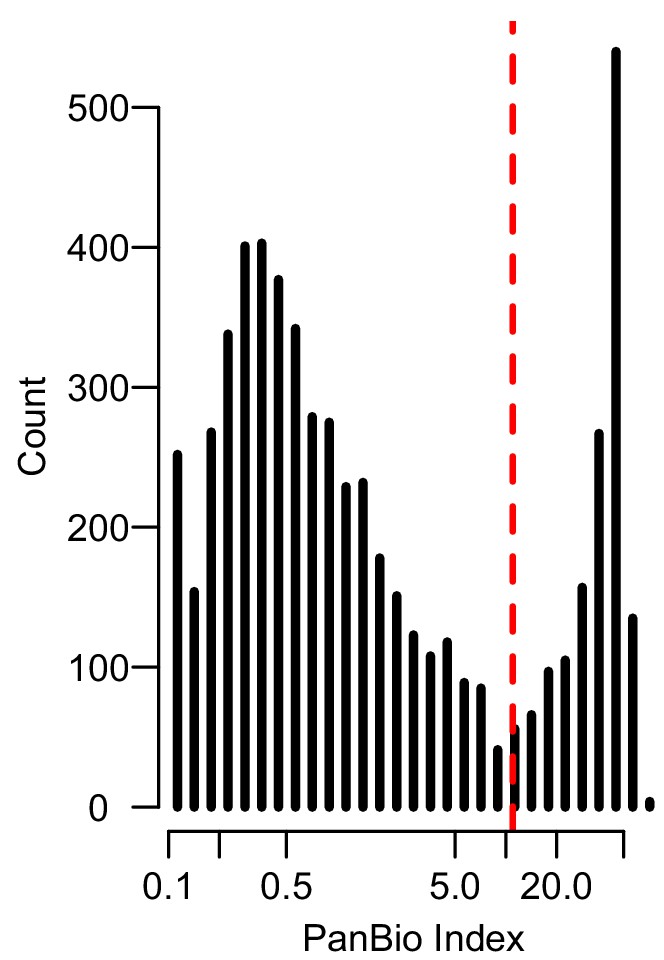
Histogram of PanBio Units derived from the optical densities of the PanBio assay with the manufacturer recommended cutpoint (PanBio Unit of 11) in dashed red.
Those to the left of the dashed line are considered seronegative and those to the right of the line are considered seropositive.
Figure 2 with 4 supplements
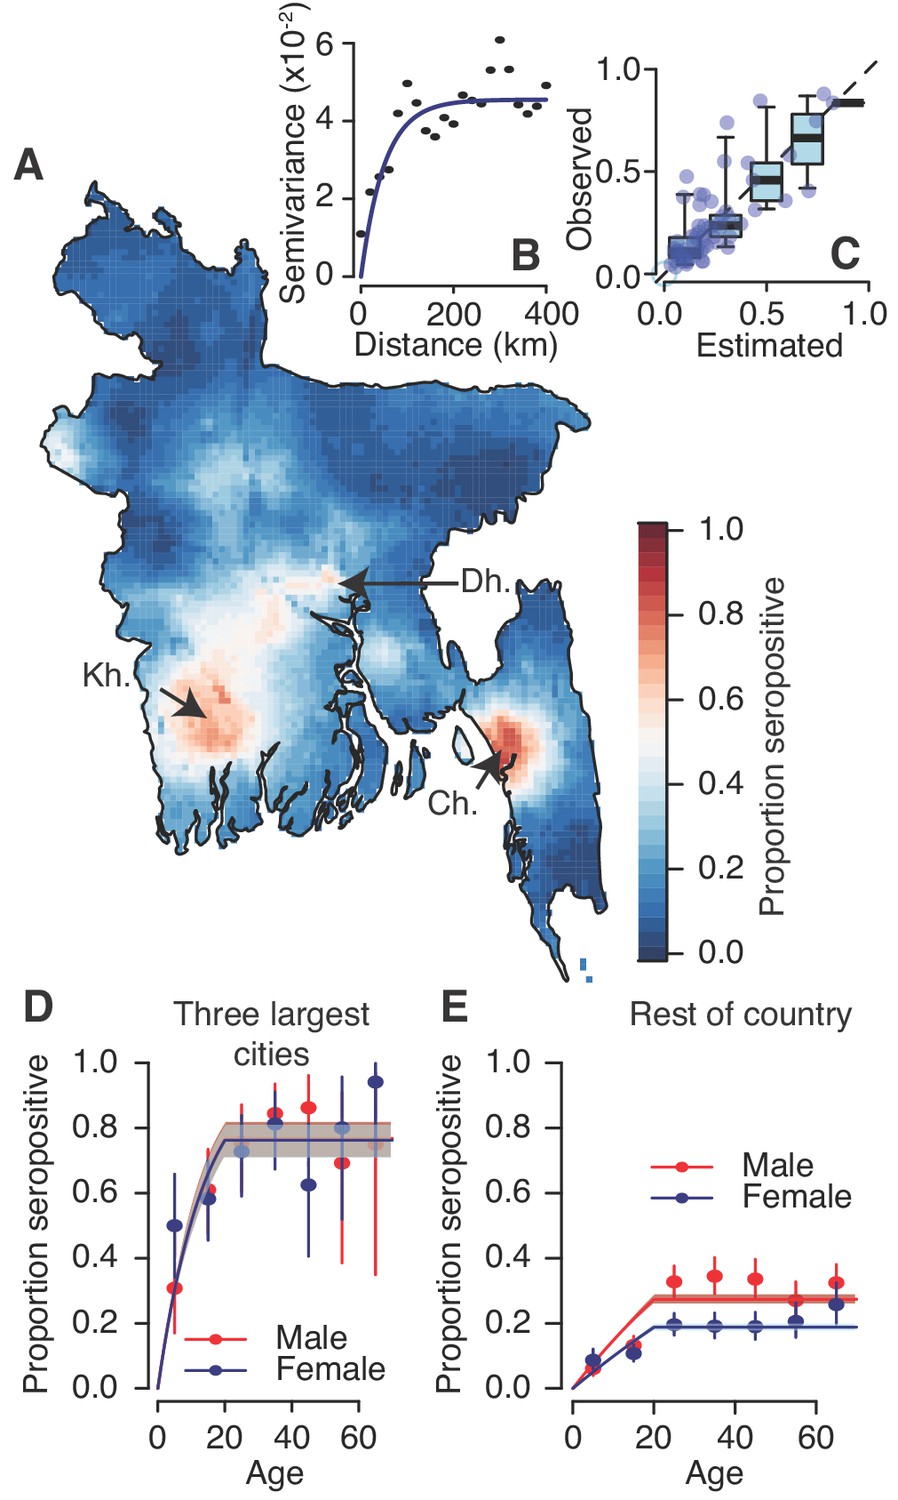
Modelled dengue seropositivity across Bangladesh and across age groups.
(A) Spatial predictions of seropositivity for the whole country. Kh. = Khulna, Dh. = Dhaka, Ch. = Chittagong (B) Semivariogram showing spatial dependence between the proportion seropositive between communities as a function of distance between them. (C) Observed versus predicted levels of seropositivity by community from leave one out cross validation. (D) Observed (points) and fitted seropositivity by age for the sampled communities within the three largest cities (Khulna, Chittagong and Dhaka) for both males and females. (E) Observed and fitted seropositivity for the remaining communities by sex.
Figure 2—figure supplement 1
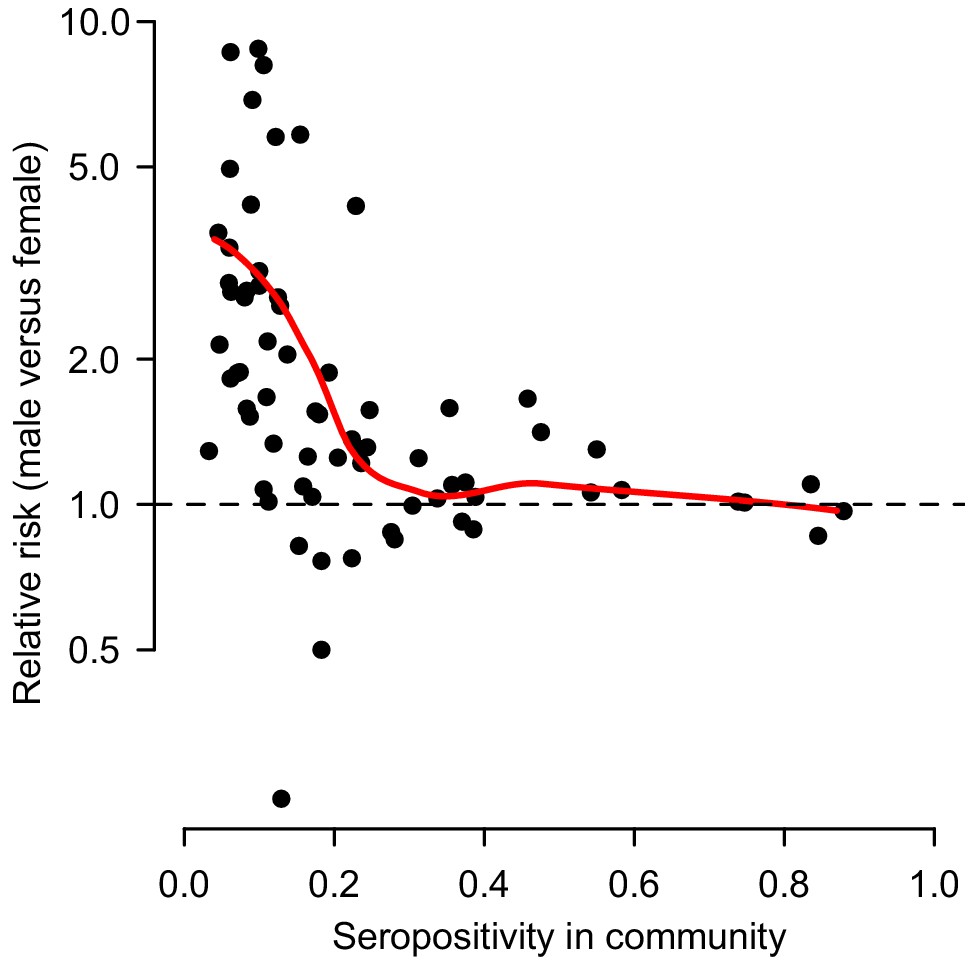
Relative risk of being seropositive for males versus females as a function of the overall proportion seropositive in the community.
The red line represents a LOESS curve fit through the 70 points.
Figure 2—figure supplement 2
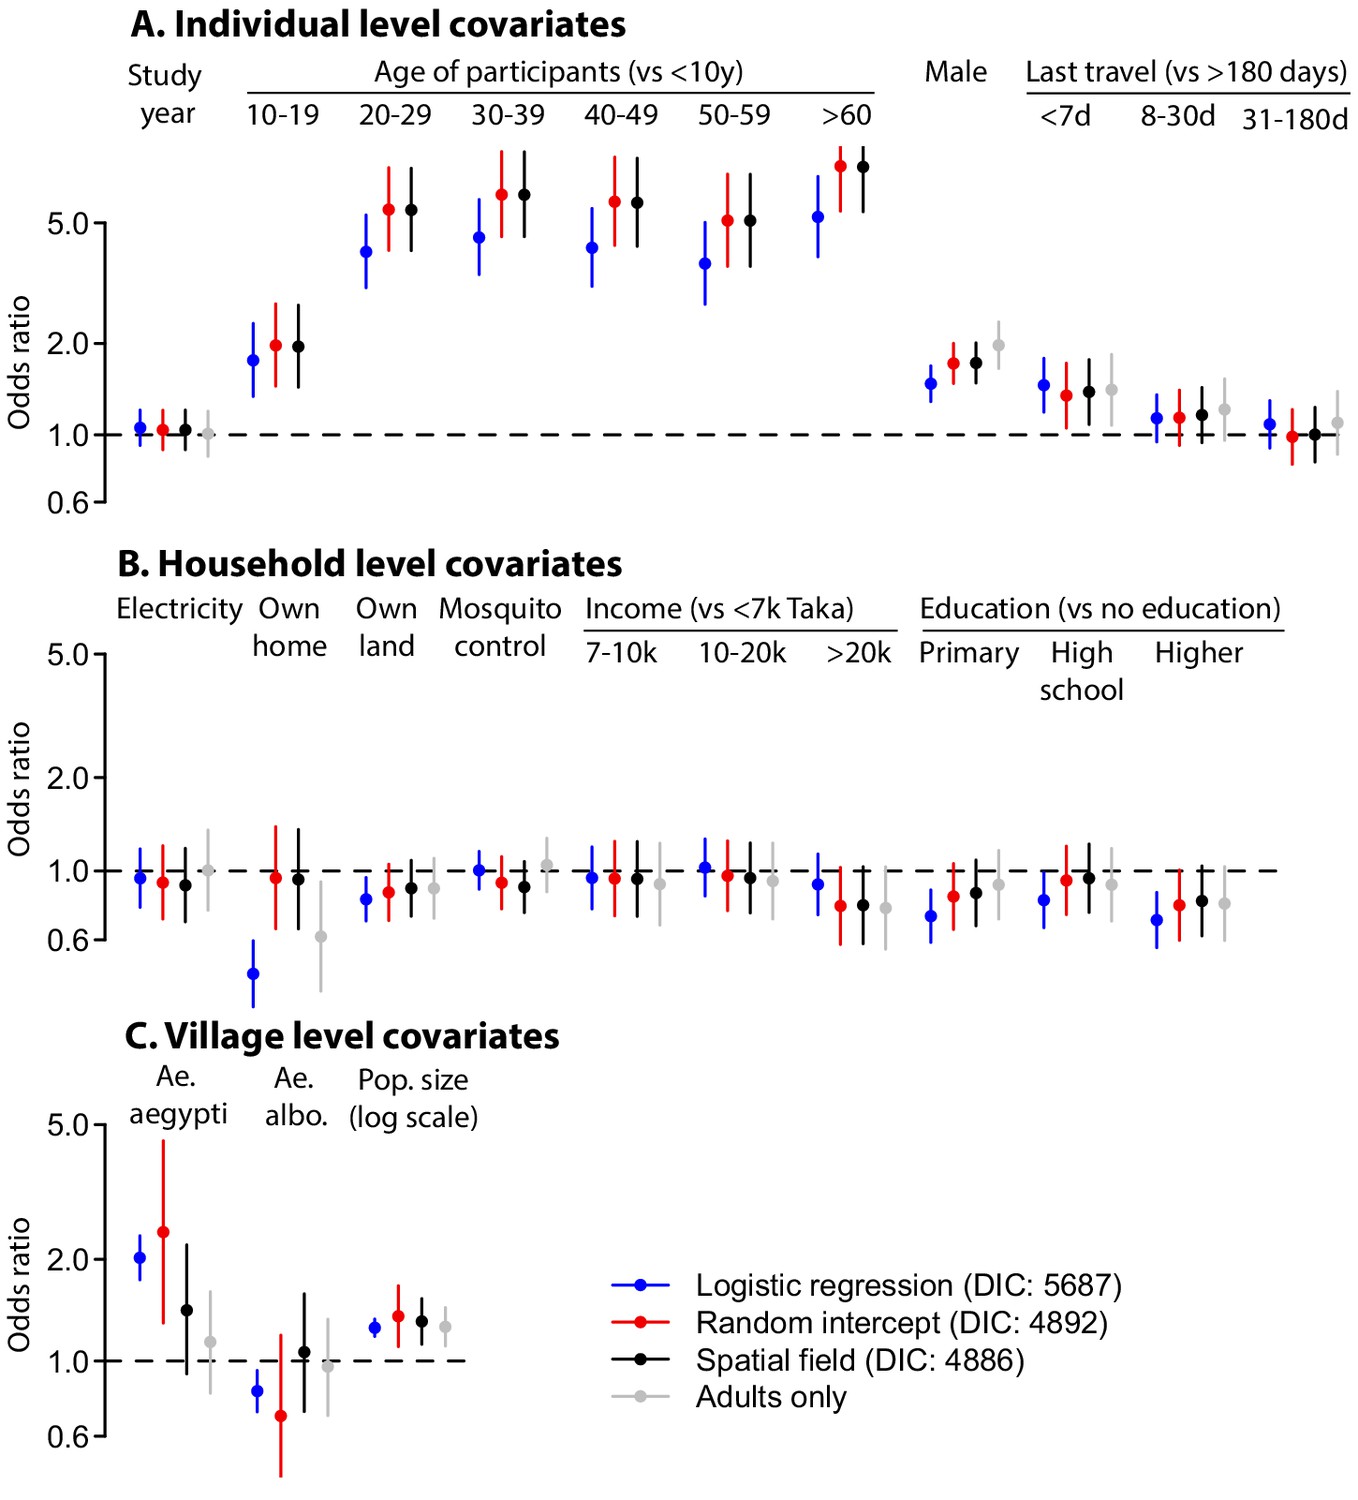
Differences in coefficient estimates in multivariable models run using logistic regression with no random intercept or spatial covariance (blue), with random intercepts at the household and community level (red) and with random intercepts at the household and community level and a Matern spatial covariance matrix (black, base model).
In addition the results of the spatial field model but restricted to individuals over 20y is shown (grey). The bars represent 95% confidence intervals each time.
Figure 2—figure supplement 3
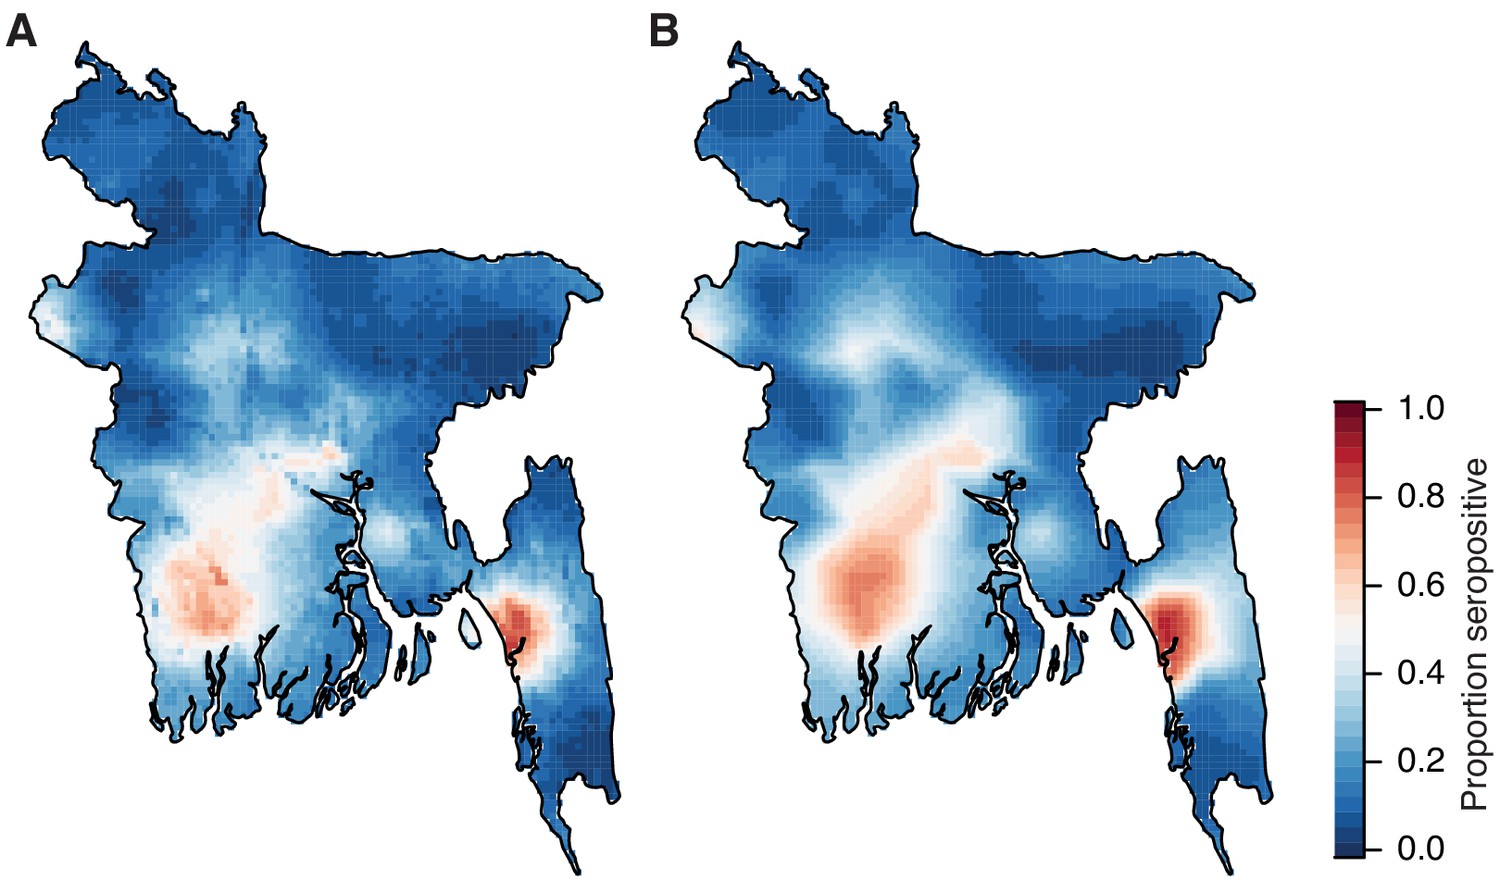
Comparison of risk maps using different prediction methods.
(A) Spatial prediction map using age, sex and population size and a Matern covariance structure. (B). Spatial prediction using a Matern spatial covariance only.
Figure 2—figure supplement 4
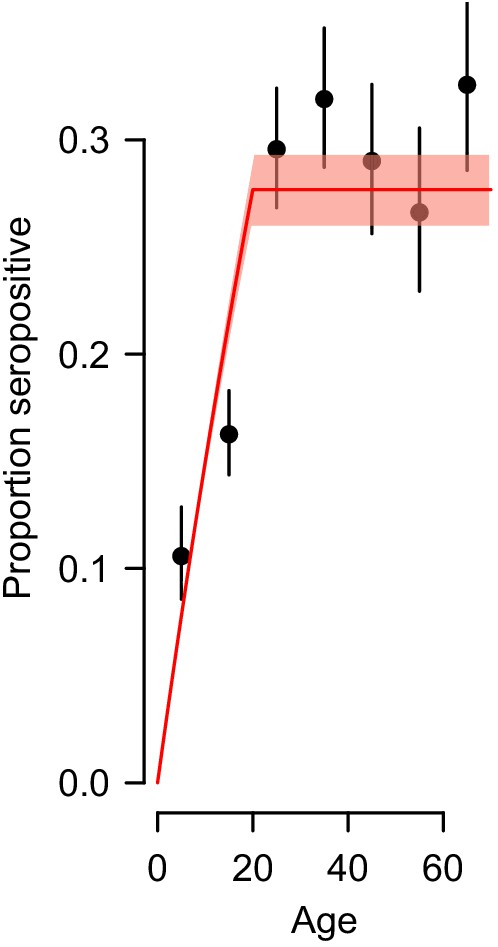
Observed proportion seropositive by age group with 95% confidence intervals (black) and the fit using the force of infection estimated by the catalytic model (red).
We used the probability of being seropositive as a function of age from the whole country to estimate the proportion of the susceptible population (individuals that have never been exposed to dengue) that get infected each year.
Figure 3
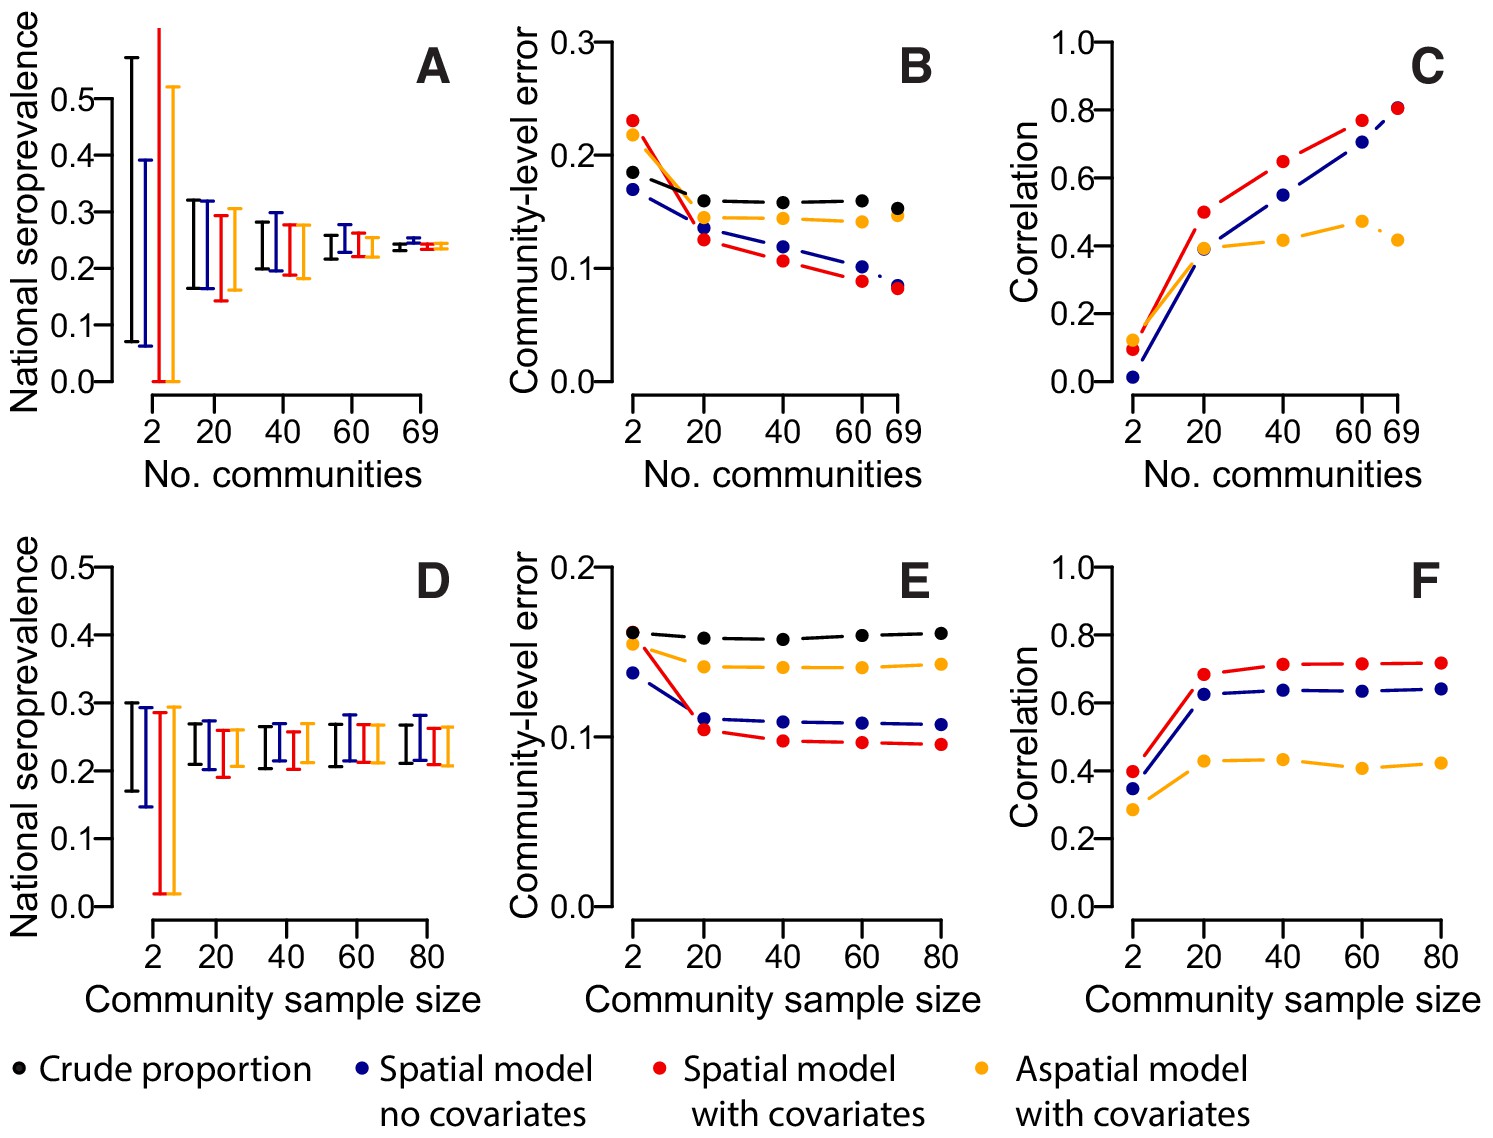
Accuracy of estimates for different number of sampled communities (top row) and different numbers of sampled individuals per community (bottom row) using different estimation methods.
(A) 95% range of estimates of overall seroprevalence from 100 repeated iterations when data from a random subset of communities is used. (B) Mean absolute error among heldout communities over repeated iterations. (C) Mean correlation between predicted and observed seroprevalence among heldout communities. (D) 95% range of estimates of overall seroprevalence from 100 repeated iterations when data from a random number of individuals from 50 communities is used. (E) Mean absolute error among 20 randomly selected heldout communities over repeated iterations. (F) Mean correlation between predicted and observed seroprevalence among 20 randomly selected heldout communities. The different estimation methods are overall proportion seropositive (black), spatial correlation model using Matern covariance structure and no covariates (blue), spatial correlation model using Matern covariance structure and age, sex and population size as covariates, logistic regression using age, sex and population size as covariates with no spatial component (orange).
Author response image 1

Tables
Table 1
Individual-, household- and community-level characteristics of participants, stratified by serostatus to dengue.
https://doi.org/10.7554/eLife.42869.007| Serum obtained (N = 5,866) | Seropositive (N = 1,403) | Seronegative (N = 4,463) | |
|---|---|---|---|
| Individual level | n | n (%) | n (%) |
| Year of study | |||
| 2014 | 2911 | 704 (24) | 2207 (76) |
| 2015 | 2955 | 699 (24) | 2256 (76) |
| Age group (years) in 2014: | |||
| <10 | 832 | 88 (11) | 744 (89) |
| 11–20 | 1062 | 314 (30) | 748 (70) |
| 21–30 | 1402 | 228 (16) | 1174 (84) |
| 31–40 | 818 | 261 (32) | 557 (68) |
| 41–50 | 679 | 197 (29) | 482 (71) |
| 51–60 | 541 | 144 (27) | 397 (73) |
| >60 | 525 | 171 (33) | 354 (67) |
| Sex: | |||
| Male | 2821 | 761 (27) | 2060 (73) |
| Female | 3044 | 642 (21) | 2402 (79) |
| Heard of dengue: | |||
| No | 772 | 115 (15) | 657 (85) |
| Yes | 2093 | 1288 (25) | 3805 (75) |
| Reported having had dengue: | |||
| No | 5827 | 1387 (24) | 4440 (76) |
| Yes | 38 | 16 (42) | 22 (58) |
| Last time left community: | |||
| <7 days | 773 | 269 (35) | 504 (65) |
| 7d-1 month | 1198 | 311 (26) | 887 (74) |
| 1–6 months | 1142 | 285 (25) | 857 (75) |
| >6 months | 2753 | 538 (20) | 2215 (80) |
| Household level | |||
| Electricity in home | |||
| No | 780 | 149 (19) | 631 (81) |
| Yes | 5075 | 1253 (25) | 3822 (75) |
| Access to water in home* | |||
| No | 301 | 125 (42) | 176 (58) |
| Yes | 2599 | 578 (22) | 2021 (78) |
| Own home | |||
| No | 444 | 239 (54) | 205 (46) |
| Yes | 5408 | 1161 (21) | 4247 (79) |
| Own land away from home | |||
| No | 1303 | 373 (29) | 930(71) |
| Yes | 4552 | 1029 (23) | 3523 (77) |
| Mosquito control used | |||
| No | 2185 | 512 (23) | 1673 (77) |
| Yes | 3670 | 890 (24) | 2780 (76) |
| Household head education: | |||
| No education | 1034 | 306 (30) | 728 (70) |
| Primary school | 1574 | 362 (23) | 1212 (77) |
| High school | 1407 | 320 (23) | 1087 (77) |
| Higher | 1840 | 414 (22) | 1426 (78) |
| Household income (Taka, 100 Taka = 1.2 USD): | |||
| <7000 | 921 | 212 (23) | 709 (77) |
| 7,000–9999 | 1176 | 229 (19) | 947 (81) |
| 10000–20,000 | 1980 | 509 (26) | 1471 (74) |
| >20,000 | 1766 | 452 (26) | 1314 (74) |
| Community level | |||
| Aedes aegypti mosquitos captured | |||
| No | 3931 | 668 (17) | 3263 (83) |
| Yes | 1935 | 735 (38) | 1200 (62) |
| Aedes albopictus mosquitos captured | |||
| No | 3416 | 941 (28) | 2475 (72) |
| Yes | 2450 | 462 (19) | 1988 (81) |
| Type of community | |||
| Urban | 1505 | 557 (37) | 948 (63) |
| Rural | 4361 | 846 (19) | 3515 (81) |
| Division: | |||
| Dhaka | 1484 | 407 (27) | 1077 (73) |
| Chittagong | 1533 | 382 (25) | 1151 (75) |
| Barisal | 329 | 68 (21) | 261 (79) |
| Khulna | 672 | 302 (45) | 370 (55) |
| Rajshahi | 668 | 152 (23) | 516 (77) |
| Rangpur | 920 | 80 (9) | 840 (91) |
| Sylhet | 260 | 12 (5) | 248 (95) |
Table 2
Regression results.
https://doi.org/10.7554/eLife.42869.008| Unadjusted | Multivariable | |
|---|---|---|
| Individual level | Odds ratio (95% confidence interval) | Adjusted odds ratio (95% confidence interval) |
| Year of study (vs Y1) | 1.0 (0.8–1.1) | 1.0 (0.9–1.2) |
| Age group (years) in 2014: | ||
| <10 | Ref | Ref |
| 11–20 | 1.9 (1.4–2.6) | 2.0 (1.4–2.7) |
| 21–30 | 5.2 (3.8–7.1) | 5.5 (4.1–7.6) |
| 31–40 | 5.9 (4.3–8.1) | 6.2 (4.5–8.6) |
| 41–50 | 5.5 (4.0–7.7) | 5.8 (4.2–8.2) |
| 51–60 | 5.1 (3.6–7.1) | 5.1 (3.6–7.2) |
| >60 | 7.5 (5.4–10.6) | 7.7 (5.4–10.8) |
| Male | 1.6 (1.4–1.9) | 1.7 (1.5–2.0) |
| Last time left community: | ||
| <7 days | 1.9 (1.5–2.4) | 1.4 (1.1–1.8) |
| 7d-1 month | 1.4 (1.2–1.7) | 1.2 (0.9–1.4) |
| 1–6 months | 1.1 (0.9–1.3) | 1.0 (0.8–1.2) |
| >6 months | Ref | Ref |
| Household level | ||
| Electricity in home | 1.0 (0.8–1.2) | 0.9 (0.7–1.2) |
| Water in home | 1.0 (0.7–1.4) | - (1) |
| Own home | 0.9 (0.7–1.3) | 0.9 (0.7–1.4) |
| Own land | 0.9 (0.8–1.1) | 0.9 (0.7–1.1) |
| Mosquito control used | 0.9 (0.8–1.1) | 0.9 (0.7–1.1) |
| Household head education: | ||
| No education | Ref | Ref |
| Primary school | 0.9 (0.7–1.1) | 0.9 (0.7–1.1) |
| High school | 0.9 (0.7–1.1) | 1.0 (0.7–1.2) |
| Higher | 0.8 (0.7–1.0) | 0.8 (0.6–1.0) |
| Household income (Taka): | ||
| <7000 | Ref | Ref |
| 7,000–9999 | 0.9 (0.7–1.2) | 0.9 (0.7–1.1) |
| 10000–20,000 | 1.0 (0.8–1.2) | 1.0 (0.7–1.2) |
| >20,000 | 0.8 (0.6–1.0) | 0.8 (0.6–1.0) |
| Community level | ||
| Population density (log scale) | 1.3 (1.2–1.5) | 1.3 (1.1–1.8) |
| Aedes aegypti mosquitos captured | 1.8 (1.2–2.8) | 1.4 (0.9–2.2) |
| Aedes albopictus mosquitos captured | 1.1 (0.7–1.6) | 1.0 (0.7–1.6) |
Additional files
-
Source data 1
Dengue data.
- https://doi.org/10.7554/eLife.42869.015
-
Transparent reporting form
- https://doi.org/10.7554/eLife.42869.016
Download links
A two-part list of links to download the article, or parts of the article, in various formats.
Downloads (link to download the article as PDF)
Open citations (links to open the citations from this article in various online reference manager services)
Cite this article (links to download the citations from this article in formats compatible with various reference manager tools)
Nationally-representative serostudy of dengue in Bangladesh allows generalizable disease burden estimates
eLife 8:e42869.
https://doi.org/10.7554/eLife.42869


