Regional complexity in enteric neuron wiring reflects diversity of motility patterns in the mouse large intestine
- University of Leuven, Belgium
- University of Melbourne, Australia
- KU Leuven, Belgium
- Maastricht University Medical Center, The Netherlands
- Hasselt University, Belgium
Figures
Figure 1 with 4 supplements
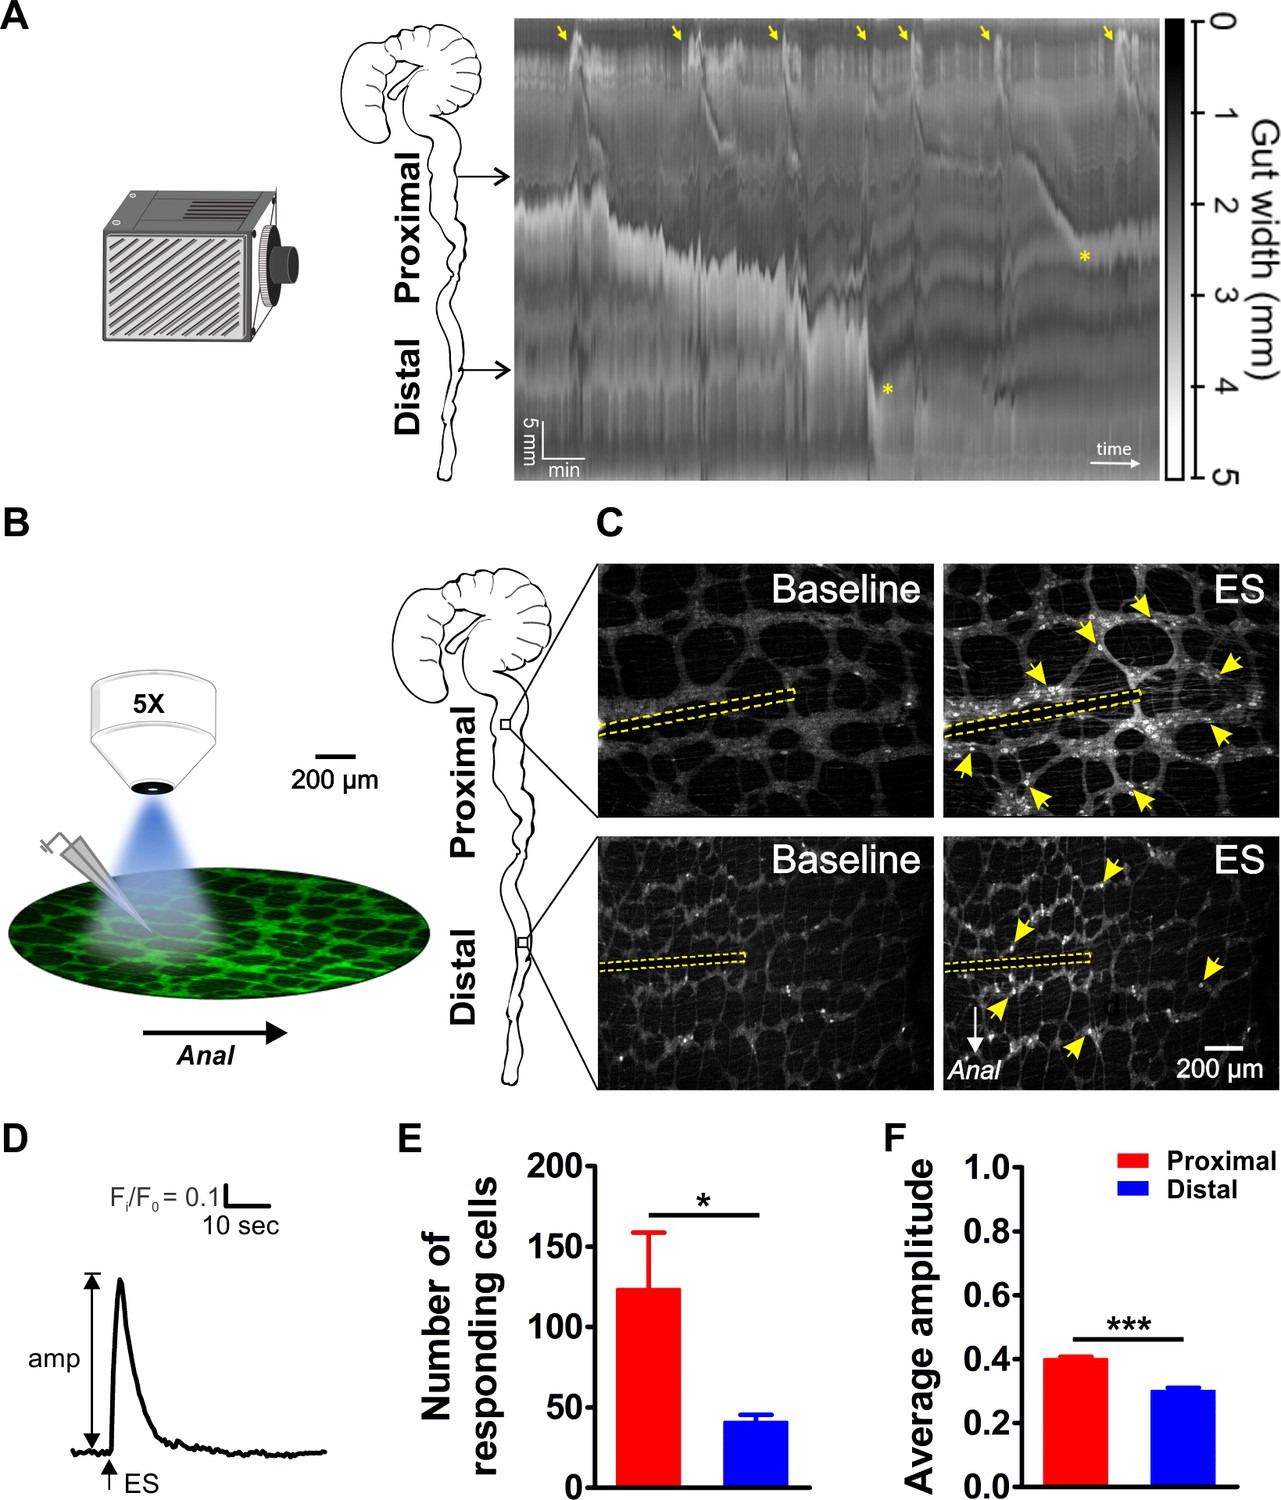
Video imaging of colonic motility in vitro and in situ calcium imaging of myenteric neuron activity in the proximal and distal colon.
(A) Video recordings of the isolated mouse colon (with caecum attached) were analyzed using spatiotemporal mapping of the intestinal diameter (representative example of 4 experiments). Maximum constriction (black), maximum dilation (white), and intermediate levels of constriction (grayscale) of the whole colon (vertical axis: 6 cm in total) are represented over time (horizontal axis, 15 min total duration). Colonic migrating motor complexes (CMMCs) are initiated in the proximal colon (yellow arrows). Propagating CMMCs proceed into the distal large intestine when associated with luminal content supplied by more proximal regions (yellow asterisks). (B) Schematic overview of the experimental setup (left) and regions of the mouse large intestine that were compared (right). Colonic myenteric plexus preparations obtained from Wnt1-Cre;R26R-GCaMP3 (Wnt1|GCaMP3) mice were visualized under an upright fluorescence microscope using a 5X objective lens. Neuronal Ca2+ transients were elicited by trains of electrical pulses (300 µsec, 20 Hz, 2 s) transmitted via a focal electrode positioned on interganglionic fiber tracts in the center of the field of view. (C) Representative single frames taken from GCaMP3 fluorescence recordings of neurons within myenteric ganglia of proximal (top row) and distal (bottom row) colon before (baseline) and during electrical stimulation (ES, the position of the focal electrode is depicted by the yellow dotted line) (see corresponding suppl. movies). A random subset of responsive neurons is marked with yellow arrows. (D) Representative trace of an ES-evoked Ca2+ transient of an individual myenteric neuron stimulated in the control situation. The amplitude of each Ca2+ transient was calculated as the difference between baseline (F/F0) and maximal Fi/F0 GCaMP3 fluorescence. (E) Comparison of the average number of neurons responding per field of view (2.2 mm2) (123.5 ± 35.3 vs 41.0 ± 4.4, *p=0.049). (F) Comparison of the average Ca2+ transient amplitude (0.40 ± 0.01 vs 0.30 ± 0.01, ***p<0.001) elicited by fiber stimulation in control. Eight myenteric plexus preparations (N = 5 animals) in the proximal and seven myenteric plexus preparations (N = 5 animals) in the distal colon were used for calculating the data in E and F.
-
Figure 1—source data 1
NO. of mice and responding cells.
- https://doi.org/10.7554/eLife.42914.007
-
Figure 1—source data 2
Responding cells and Ca imaging amplitude.
- https://doi.org/10.7554/eLife.42914.008
Figure 1—video 1
Stimulaiton one in proximal colon.
This movie shows the effect of the first focal stimulation (300 µsec, 30 V, 20 Hz, 2 s using a 50 µm diameter tungsten electrode) delivered to a fiberstrand of the mouse proximal colon. Multiple spatially scattered neurons show a [Ca2+]i response as seen by the increase in GCaMP3 fluorescence. Note that the responses are very similar to the responses in Figure 1—Video 2 where the second stimulation is shown. Original movie length is 60 s. Bar: 200 µm.
Figure 1—video 2
Stimulation two in proximal colon.
This movie shows the effect of the second focal stimulation (300 µsec, 30 V, 20 Hz, 2 s using a 50 µm diameter tungsten electrode) delivered to a fiberstrand of the mouse proximal colon. Multiple spatially scattered neurons show a [Ca2+]i response as seen by the increase in GCaMP3 fluorescence. Note that the responses are very similar to the responses in Supplementary 1 where the first stimulation is shown. Original movie length is 60 s. Bar: 200 µm.
Figure 1—video 3
Stimulation one in distal colon.
This movie shows the effect of the first focal stimulation (300 µsec, 30 V, 20 Hz, 2 s using a 50 µm diameter tungsten electrode) delivered to a fiberstrand of the mouse distal colon. Multiple spatially scattered neurons show a [Ca2+]i response as seen by the increase in GCaMP3 fluorescence. Note that the responses are very similar to the responses in Figure 1—Video 4 where the second stimulation is shown. Original movie length is 60 s. Bar: 200 µm.
Figure 1—video 4
Stimulation two in distal colon.
This movie shows the effect of the second focal stimulation (300 µsec, 30 V, 20 Hz, 2 s using a 50 µm diameter tungsten electrode) delivered to a fiberstrand of the mouse distal colon. Multiple spatially scattered neurons show a [Ca2+]i response as seen by the increase in GCaMP3 fluorescence. Note that the responses are very similar to the responses in Figure 1—Video 3 where the first stimulation is shown. Original movie length is 60 s. Bar: 200 µm.
Figure 2
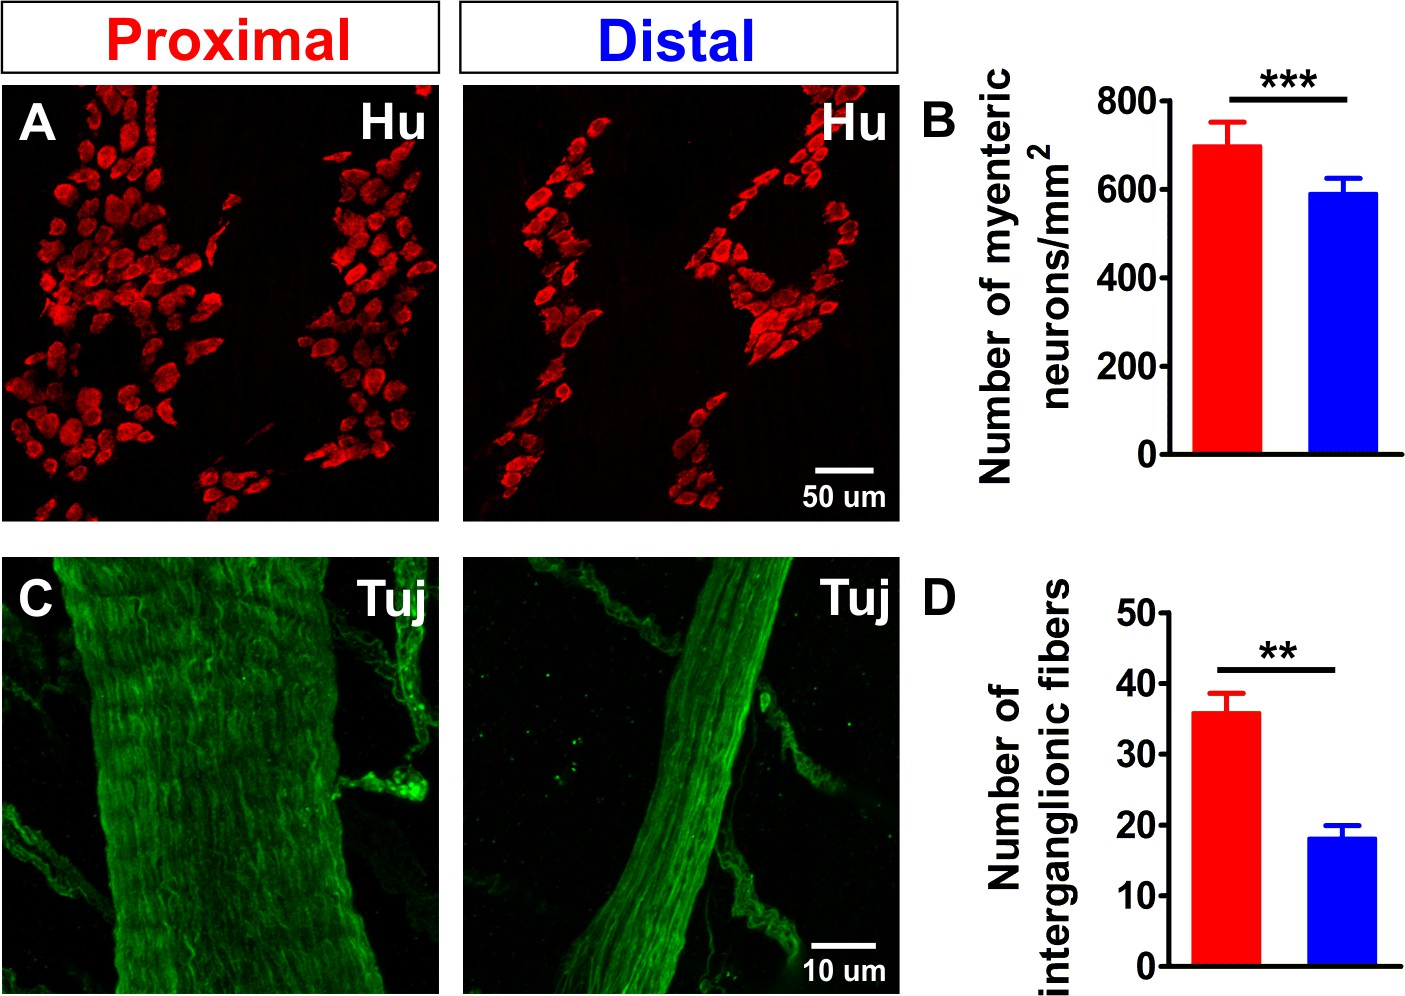
Density comparison of myenteric neurons and interganglionic processes in the proximal and distal colon.
(A) Confocal maximum projections of whole-mount preparations of the myenteric plexus from the proximal and distal colon immunostained for the pan-neuronal marker Hu (red). (B) Quantification of the number of myenteric neurons per square millimeter (698.3 ± 52.9 vs 591.3 ± 33.2 per mm2, ***p<0.001; N = 3) in the proximal (red) and distal (blue) colon. The ratio between the number of neurons (#N) in the distal and proximal colon (#NDis/#NProx = 0.85) is 85%. (C) Confocal maximum projections of whole-mount preparations of the myenteric plexus from the proximal and distal colon immunostained for neuronal class III β-tubulin (Tuj1, green). (D) Quantification of the number of processes per interganglionic fiber bundle (35.9 ± 2.7 vs 18.2 ± 1.8, **p=0.005; N = 3), the ratio between the number of fibers in the distal vs. proximal (#FDis/#FProx = 0.50) is 50%.
-
Figure 2—source data 1
NO. of mice.
- https://doi.org/10.7554/eLife.42914.010
-
Figure 2—source data 2
NO. of myenteric neurons.
- https://doi.org/10.7554/eLife.42914.011
-
Figure 2—source data 3
NO. of interganglionic fibers.
- https://doi.org/10.7554/eLife.42914.012
Figure 3
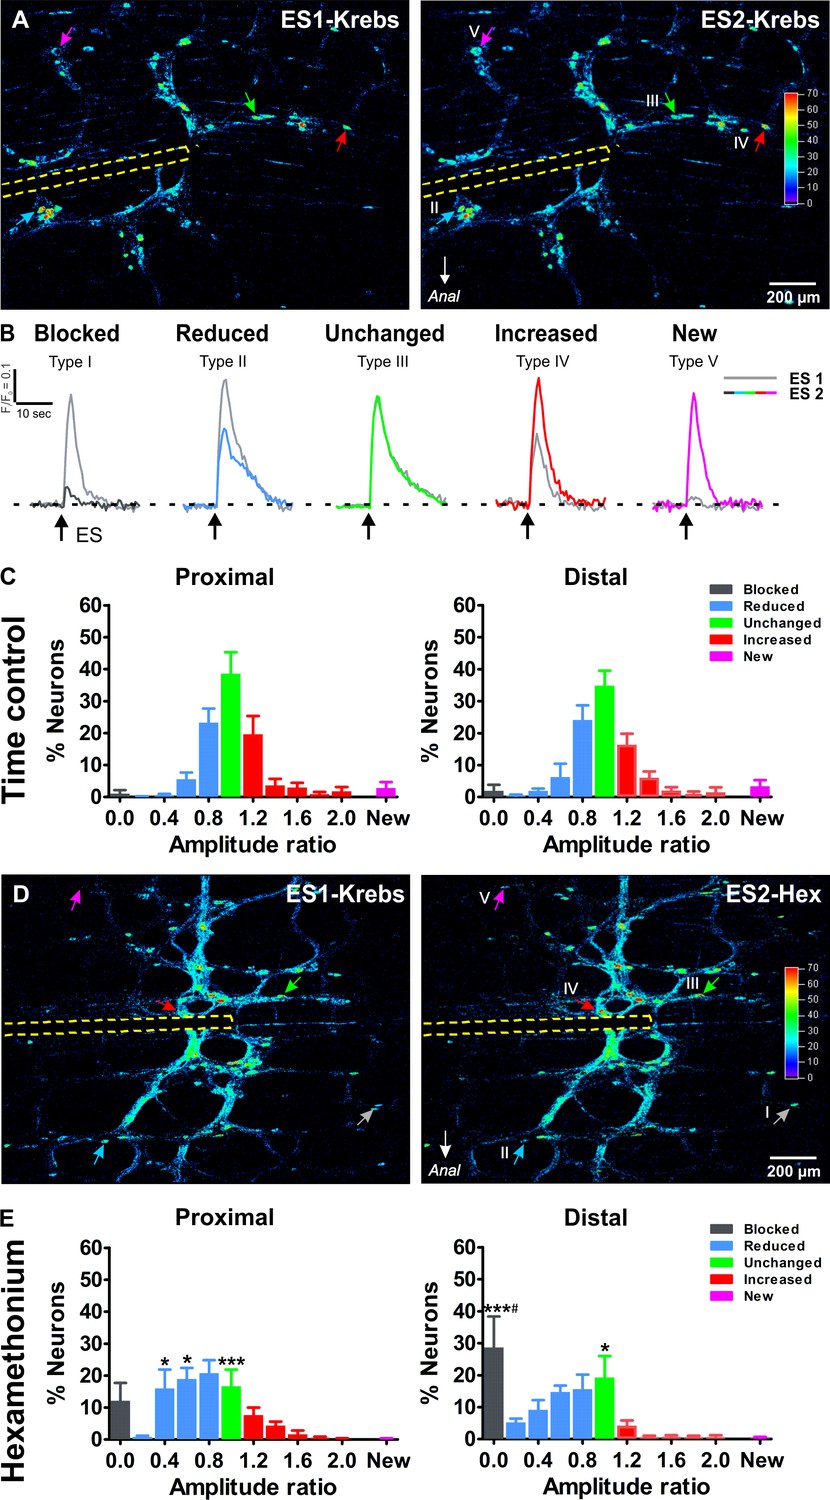
Ca2+response signatures of enteric neurons during two consecutive rounds of electrical stimulation in control conditions and in Hexamethonium.
(A) Activity over Time (AoT) images in which the Ca2+ transient amplitude for active cells only is color-coded (absolute values in arbitrary units, see color scale). Left and right respectively show an example of the responses (arrows point at individual examples) to a first electrical stimulation (ES1) and a second consecutive electrical stimulation (ES2) in control conditions (Krebs). The location of the focal electrode is indicated by the yellow dashed line. Colored-coded arrows mark responder subtypes as explained in B. (B) The amplitude (ΔF/F0) of the second (color trace) response was compared to the first (gray trace) and expressed as a ratio (ΔF/F0)ES2 / (ΔF/F0)ES1 for each individual neuron. Based on this response signature, responsive neurons were classified into five different classes: blocked (Type I), reduced (Type II), unchanged (Type III), increased (Type IV) and new (Type V) cells (see color-coded arrows in A, (A’). Note that in this field of view no Type I neuron was present, as these are very rare in control (saline) conditions. (C) Histograms showing the percentage of neurons (mean ±SEM) belonging to the different (color coded) classes as found in the myenteric plexus of the proximal (left) and distal (right) colon. Results are expressed as the amplitude ratio binned by 0.2. Note that the distributions approximate a standard normal distribution both in the proximal and distal colon do not differ substantially between the proximal and distal colon, indicating a robust response behavior. Data were obtained from Ctrl-Ctrl stimulation pairs in six myenteric plexus preparations (N = 4 animals) in the proximal and six myenteric plexus preparations (N = 4 animals) in the distal colon. (D) Activity over Time (AoT) images in which the maximal Ca2+ amplitude (color-coded) of responsive neurons is shown during a first electrical stimulation (ES1) in control Krebs (left) and a second consecutive stimulation (ES2) in the presence of hexamethonium (Hex, 200 μM, right). The location of the focal electrode is indicated by a yellow dashed line. Neurons belonging to each of the five different types of responders classes (blocked (Type I), reduced (Type II), unchanged (Type III), increased (Type IV) and new (Type V)) are indicated by color-coded arrows. (E), Histograms showing the percentage of neurons (mean ±SEM) belonging to the different (color coded) classes in the presence of Hex as found in the myenteric plexus of the proximal (left) and distal (right) colon. These frequency histograms show a shift to the left (more neurons in the blue and black bars) as compared to the control situation. About ~10% of proximal neurons and ~30% of distal neurons were completely blocked by Hex (Prox: 12.2% vs 1.1%, p>0.05; Dis: 28.7% vs 1.9%, ***p<0.001, two-way ANOVA with Bonferroni post hoc test). Comparing the Hex effect between both regions, it is clear that the proportion of blocked neurons in the distal is significantly higher than in the proximal colon (Dis: 28.7 ± 9.7% vs Prox: 12.2 ± 5.6%, #p<0.05, two-way ANOVA with Bonferroni post hoc test). Data were obtained from Ctrl-Hex stimulation pairs in six myenteric plexus preparations (N = 4 animals) in the proximal and seven myenteric plexus preparations (N = 5 animals) in the distal colon. The * symbols denote the comparison between control and Hex, while # reflects the comparison distal vs proximal.
-
Figure 3—source data 1
NO. of mice.
- https://doi.org/10.7554/eLife.42914.014
-
Figure 3—source data 2
Ca imaging amplitude ratio of proximal colon.
- https://doi.org/10.7554/eLife.42914.015
-
Figure 3—source data 3
Ca imaging amplitude ratio of distal colon.
- https://doi.org/10.7554/eLife.42914.016
Figure 4
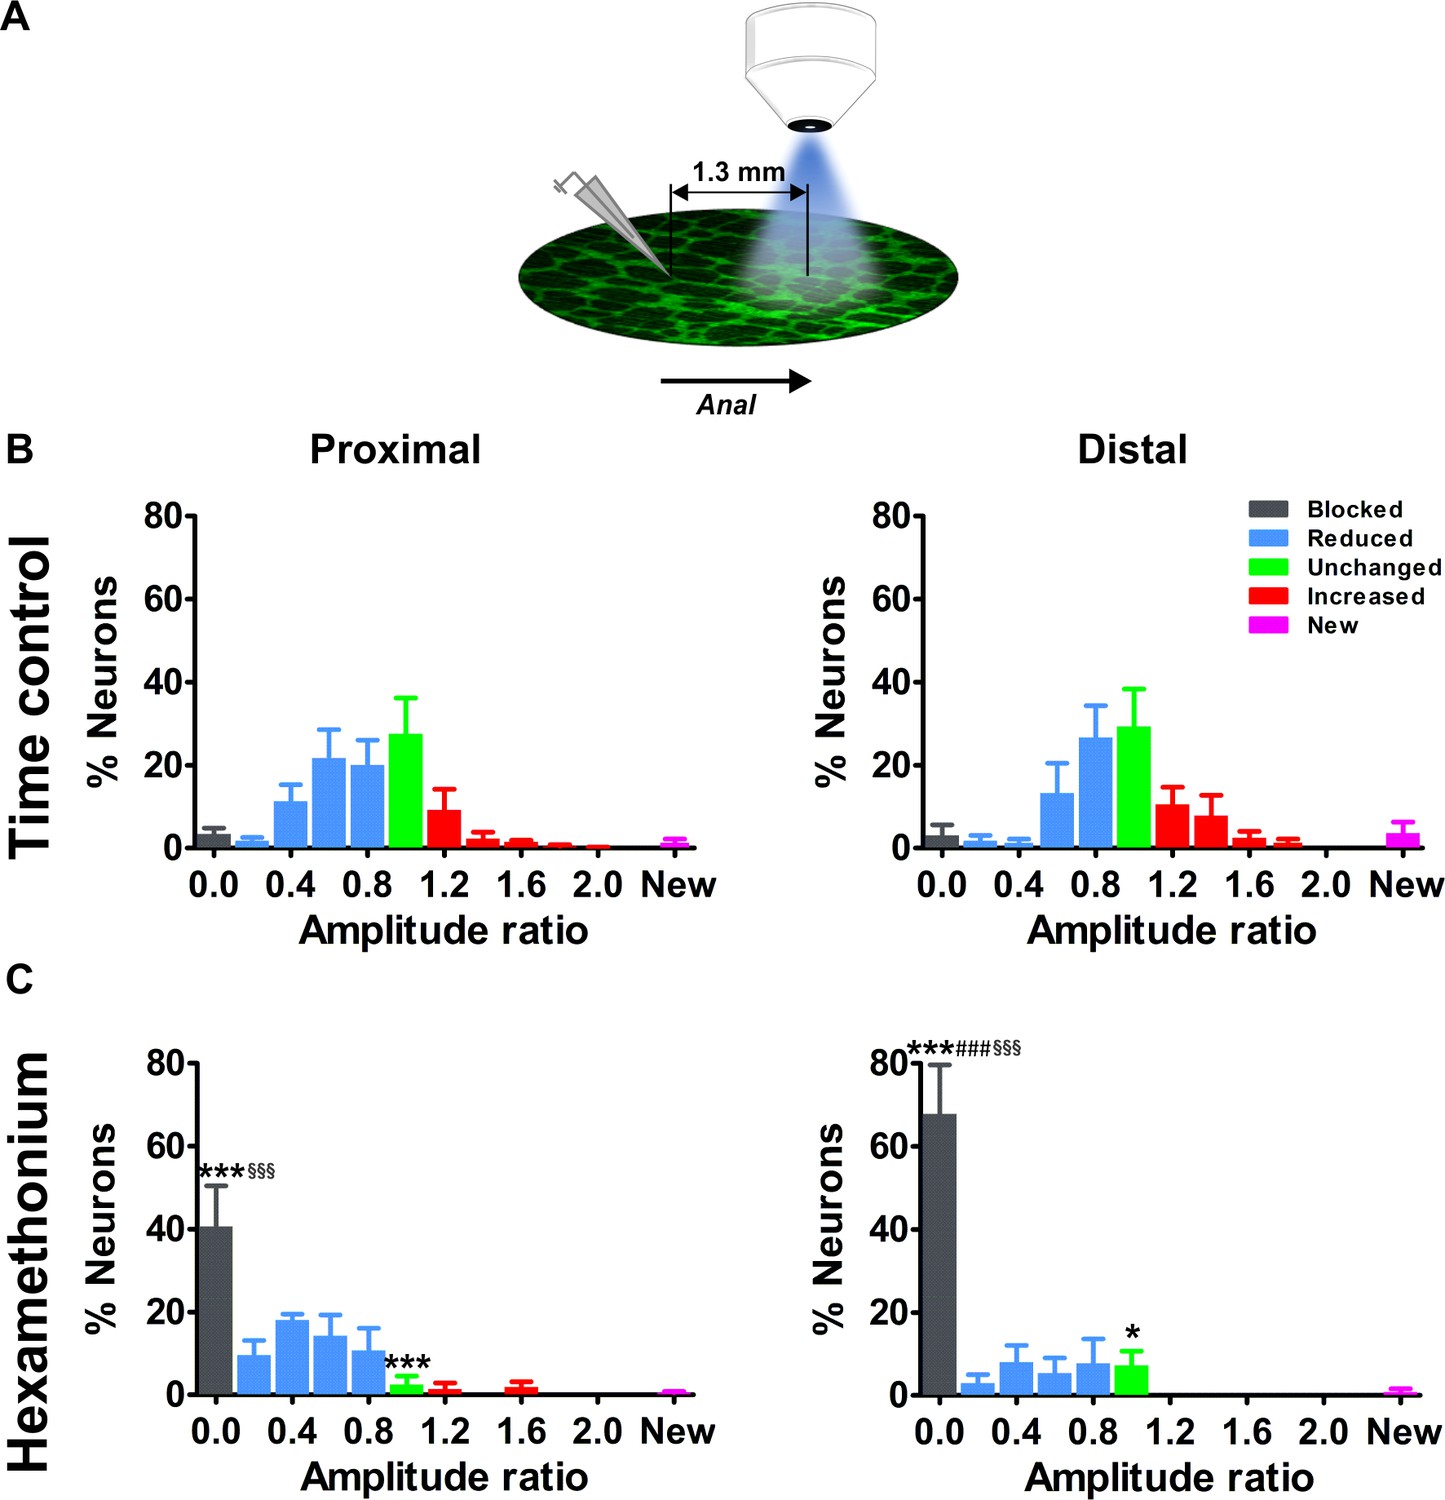
Effects of blocking cholinergic nicotinic neurotransmission on electrically evoked Ca2+ transients of myenteric neurons distal to the stimulation site.
(A) Schematic representation of the stimulation site and imaging field. For the current set of experiments, the electrode was placed one field of view (=1.3 mm) orally to the field of view. (B–C) Histograms showing the percentage of neurons (mean ±SEM) belonging to the different (color coded) classes as found in the myenteric plexus of the proximal (left) and distal (right) colon at a distance away from the stimulation electrode. (B) shows the control condition (two stimuli in control Krebs) and (C) the situation when the second stimulus was given in the presence of hexamethonium (Hex, 200 μM). Note that the histograms in (B) are still normally distributed but with a larger spread compared to the neurons closer to the electrode (Figure 3). Data were obtained from Ctrl-Ctrl stimulation pairs in five myenteric plexus preparations (N = 3 animals) in the proximal and seven myenteric plexus preparations (N = 3 animals) in the distal colon. The frequency histograms in (C) show a robust shift to the left (more neurons in the blue and black bars) as compared to the control situation. About ~40% of proximal neurons and ~70% of distal neurons were completely blocked by Hex (Prox: 40.7% vs 3.5%, ***p<0.001; Dis: 67.8% vs 3.1%, ***p<0.001, two-way ANOVA with Bonferroni post hoc test). Comparing the Hex effect between both regions, many more neurons were completely blocked in the distal compared with the proximal colon (Dis: 67.8 ± 11.7% vs Prox: 40.7 ± 9.7%, ###p<0.001, two-way ANOVA with Bonferroni post hoc test). In addition, comparing the Hex effect between both fields of view, the proportion of blocked neurons was significantly higher in the field further away than close to the electrode (see in Figure 3E) (Prox: 40.7 ± 9.7% vs 12.2 ± 5.6%, §§§p<0.001; Dis: 67.8 ± 11.7% vs 28.7 ± 9.7%, §§§p<0.001, two-way ANOVA with Bonferroni post hoc test). Data were obtained from Ctrl-Hex stimulation pairs in four myenteric plexus preparations (N = 2 animals) in the proximal and four myenteric plexus preparations (N = 3 animals) in the distal colon. The * symbols denote the comparison between control and Hex, the # symbols reflect the comparison between distal and proximal and the § symbols the comparison between the fields of view (close and further away from the electrode).
-
Figure 4—source data 1
NO. of mice.
- https://doi.org/10.7554/eLife.42914.018
-
Figure 4—source data 2
Ca imaging amplitude ratio of proximal colon.
- https://doi.org/10.7554/eLife.42914.019
-
Figure 4—source data 3
Ca imaging amplitude ratio of distal colon.
- https://doi.org/10.7554/eLife.42914.020
Figure 5 with 1 supplement
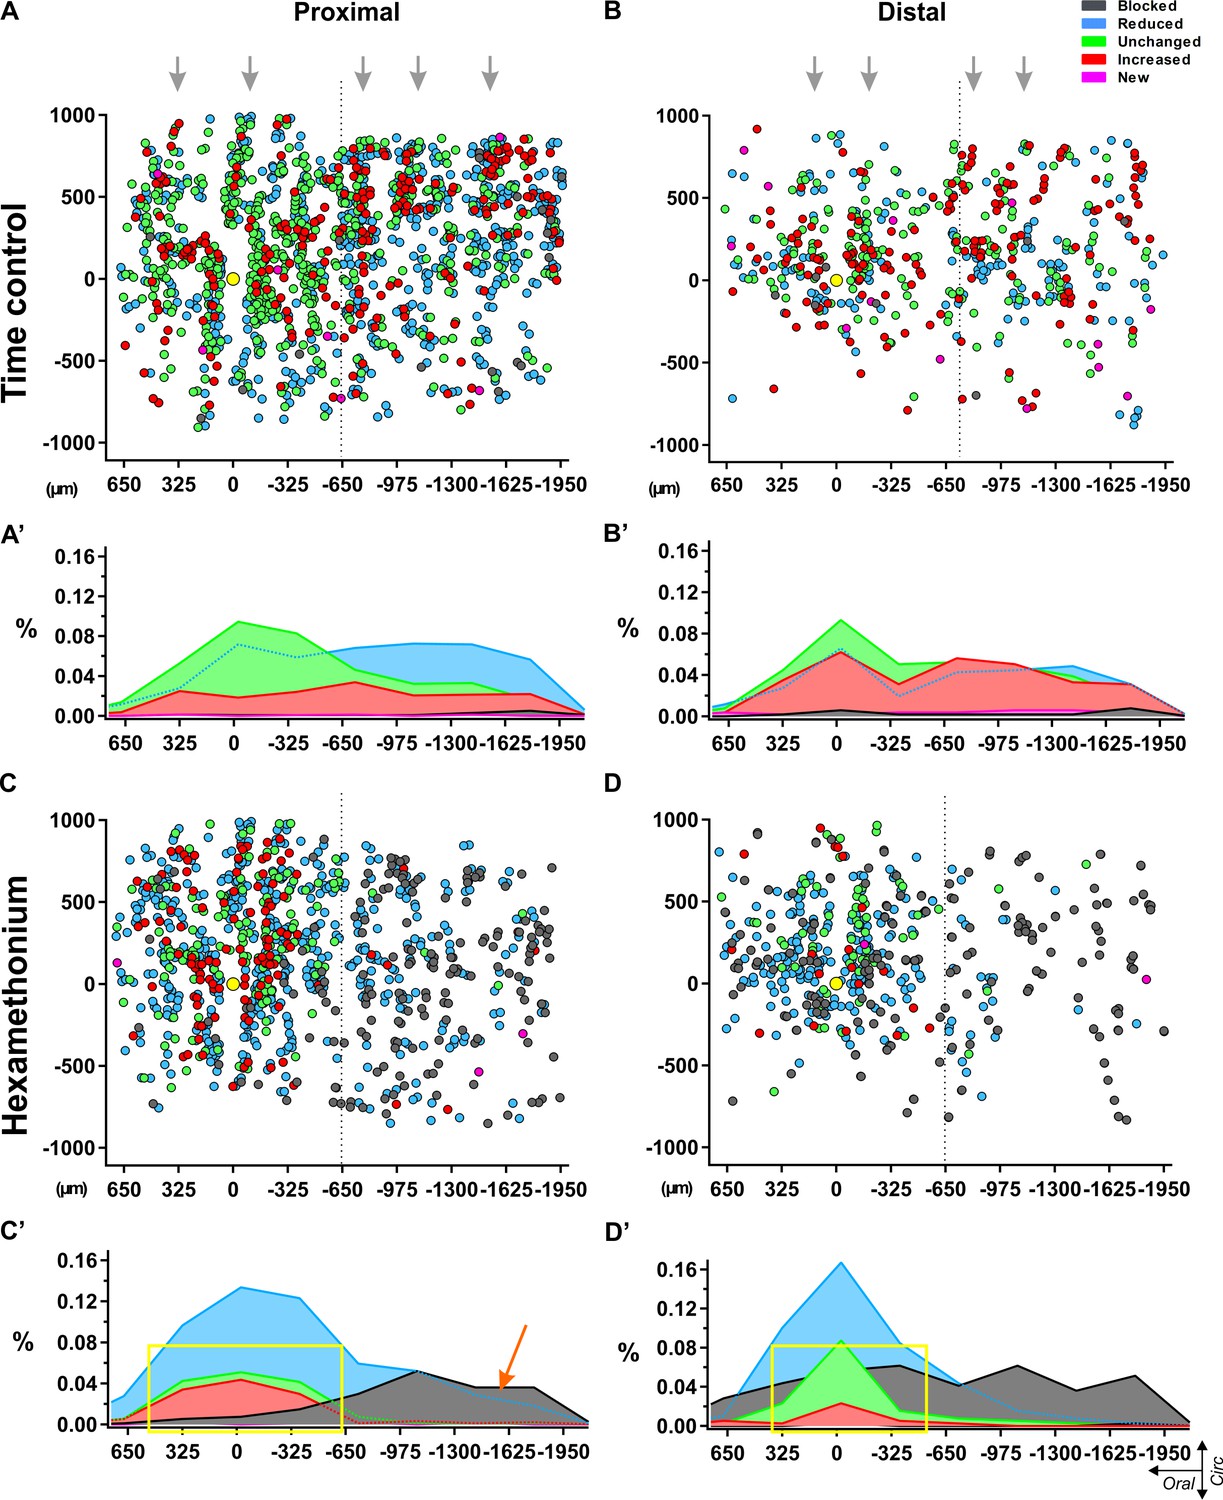
Spatial distribution of myenteric neurons responding to electrical stimulation of a single interganglionic fiber tract.
Dotplots of the location of each individual neuron pooled from all recordings in control Krebs (top) (A–B) and hexamethonium (200 μM, bottom) (C–D) conditions in proximal (left) and distal (right) colon. Individual neurons are shown as circles color coded according to their response signature (=ratio of responses to two consecutive stimuli). The location of the focal stimulation electrode is indicated with the yellow circle. (A) All responsive neurons in control conditions were scattered without any apparent pattern, except that the ganglionic network was reflected in the distribution, indicating morphologic consistency over different preparations (grey arrows). (B) Summarizing histograms show uniform distribution of the neurons, slightly reduced (Type II: light blue) or slightly enhanced (Type IV: red), while neurons that were unchanged (Type III: green) were more centered around the electrode. Only few blocked (Type I: dark grey) and new (Type V: pink) neurons were detected in control conditions. (C) Spatial distribution of the responding cells in hexamethonium (200 μM) in proximal and distal colon. (D) Summarizing histograms show a preferential aboral location of fully blocked (Type I: dark grey) neurons in the proximal colon (orange arrow) while in the distal colon, fully blocked neurons are more spread over the entire length. Neurons showing the same (Type III) or an increased response (Type IV) cluster around the electrode in the proximal and even more so in the distal colon as indicated by the yellow box.
-
Figure 5—source data 1
Spatial distribution of myenteric responding cells.
- https://doi.org/10.7554/eLife.42914.026
Figure 5—figure supplement 1
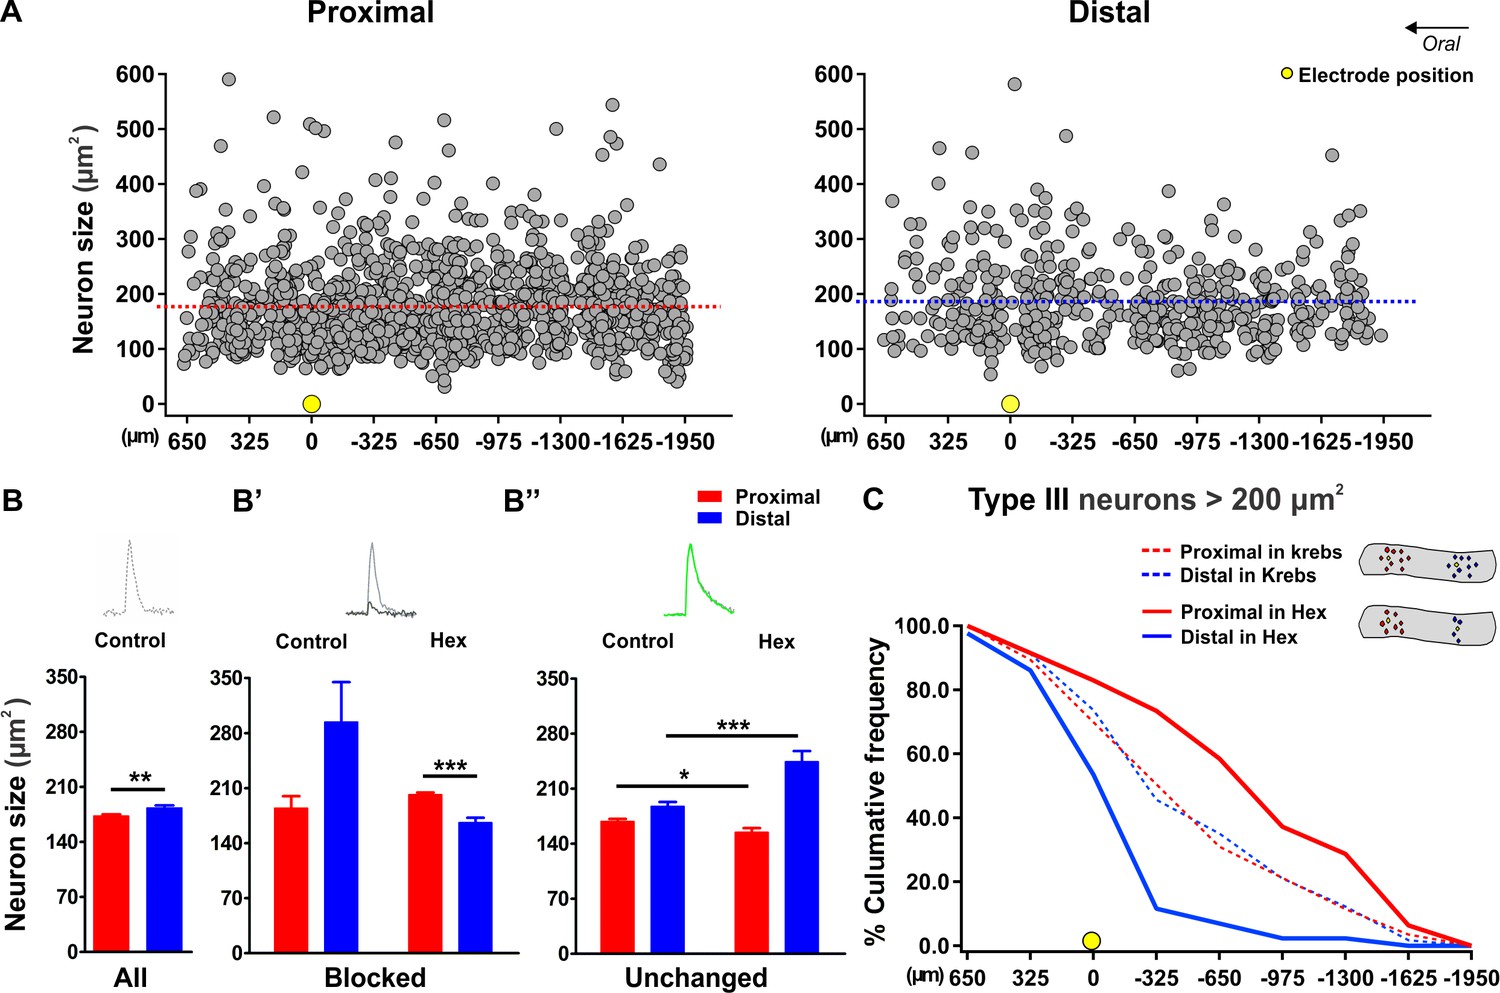
Size versus location of responding neurons.
(A) Scatterplots in which size (y-axis) of the responding neurons is plot against their oral to distal location (x-axis) along the length axis of the proximal (left) and distal (right) colon. Smaller and larger neurons are randomly distributed without any apparent preferential location. The average size of the responding neurons is shown by the red and blue dashed line for the proximal and distal colon, respectively. (B,) Histogram summarizing the size distribution of all responsive neurons in the proximal (red) and distal (blue) colon in control (Prox: 173.2 ± 2.0 (SD: 74.9) vs Dis: 183.4 ± 3.1 (SD: 71.5) μm2, **p=0.008). (B’) Bar graphs showing the size of the Type I (fully blocked) neurons both in control and in hexamethonium (Hex, 200 μM). Since only very few neurons were blocked in the control situation, statistical comparisons are irrelevant. However, the size of the blocked neurons in hexamethonium (Hex) was larger in the proximal than in the distal colon (Prox: 201.7 ± 2.6 vs Dis: 166.4 ± 5.9 μm2, ***p<0.001). (B’’) Bar graphs showing the size of the neurons that displayed a Ca2+ transient with the same amplitude (Type III) both in control and in Hex (200 μM). The size of those neurons is smaller in proximal than in the distal, an effect that is amplified by the presence of Hex. (C) Cumulative frequency histogram summarizing the location of the larger neurons (defined as >200 um2) with the same amplitude (Type III) in the proximal (red) and distal (blue) colon relative to the electrode position (as indicated by the yellow circle). The shallow sigmoid curves indicate that in control conditions (dashed lines), this specific subset of neurons (large and same amplitude) are uniformly distributed. In the presence of Hex, the large neurons that maintain their response, cluster around the electrode in the distal while in the proximal colon they are further away. The inset shows a schematic of how the larger neurons with the same amplitude distribute around the stimulation electrode in the proximal and distal large intestine.
-
Figure 5—figure supplement 1—source data 1
NO. of mice and size distribution.
- https://doi.org/10.7554/eLife.42914.023
-
Figure 5—figure supplement 1—source data 2
Neuronal size.
- https://doi.org/10.7554/eLife.42914.024
-
Figure 5—figure supplement 1—source data 3
Cumulative frequency histogram of Type III larger neurons.
- https://doi.org/10.7554/eLife.42914.025
Figure 6

Extensive cholinergic innervation of myenteric neurons in the distal colon.
(A-C) Cholinergic and nitrergic neurons in the myenteric plexus of the proximal (red) and distal (blue) colon. A, Single confocal plane of a whole-mount myenteric plexus preparation of the proximal and distal colon immunostained for Hu (magenta), choline acetyltransferase (ChAT, green) and nitric oxide synthase (nNOS, blue). Arrows and arrowheads mark some typical ChAT and nNOS neurons respectively. (B-C) Quantification of the ChAT (B) and nNOS (C) populations in the proximal (red) and distal (blue) colon, asterisks indicate statistical difference (Dis: 39.2 ± 1.3% vs Prox: 33.1 ± 1.3%, *p=0.029; N = 3). A small fraction of neurons expressed both ChAT and nNOS (3.66% and 4.00% in the proximal and distal colon, respectively), which is indicated in the dashed portions of the bars in (B) and (C). (D-E) Vesicular acetylcholine transporter (vAChT+) stainings indicate a larger contact area between cholinergic synaptic contacts and Hu+ myenteric neurons in the distal colon. (D) Single confocal plane of the myenteric plexus immunostained for Hu (blue) and vAChT (red) and its merge image. A typical neuron (white square) is shown at higher magnification. A 3D reconstruction showing the contact area (yellow) between Hu+ myenteric neuronal bodies and vAChT+ varicosities. (E) Quantification of the proportion of the surface contact area between the Hu+ myenteric neuronal bodies and vAChT+ cholinergic varicosities in the proximal (red) and distal (blue) colon, asterisks indicate statistical difference (Dis: 7.4 ± 0.8% vs Prox: 4.3 ± 0.4%, **p=0.002; N = 4).
-
Figure 6—source data 1
NO. of mice.
- https://doi.org/10.7554/eLife.42914.028
-
Figure 6—source data 2
Proportion of ChAT, nNOS and overlap.
- https://doi.org/10.7554/eLife.42914.029
-
Figure 6—source data 3
Proportion of vAChT contact area.
- https://doi.org/10.7554/eLife.42914.030
Figure 7
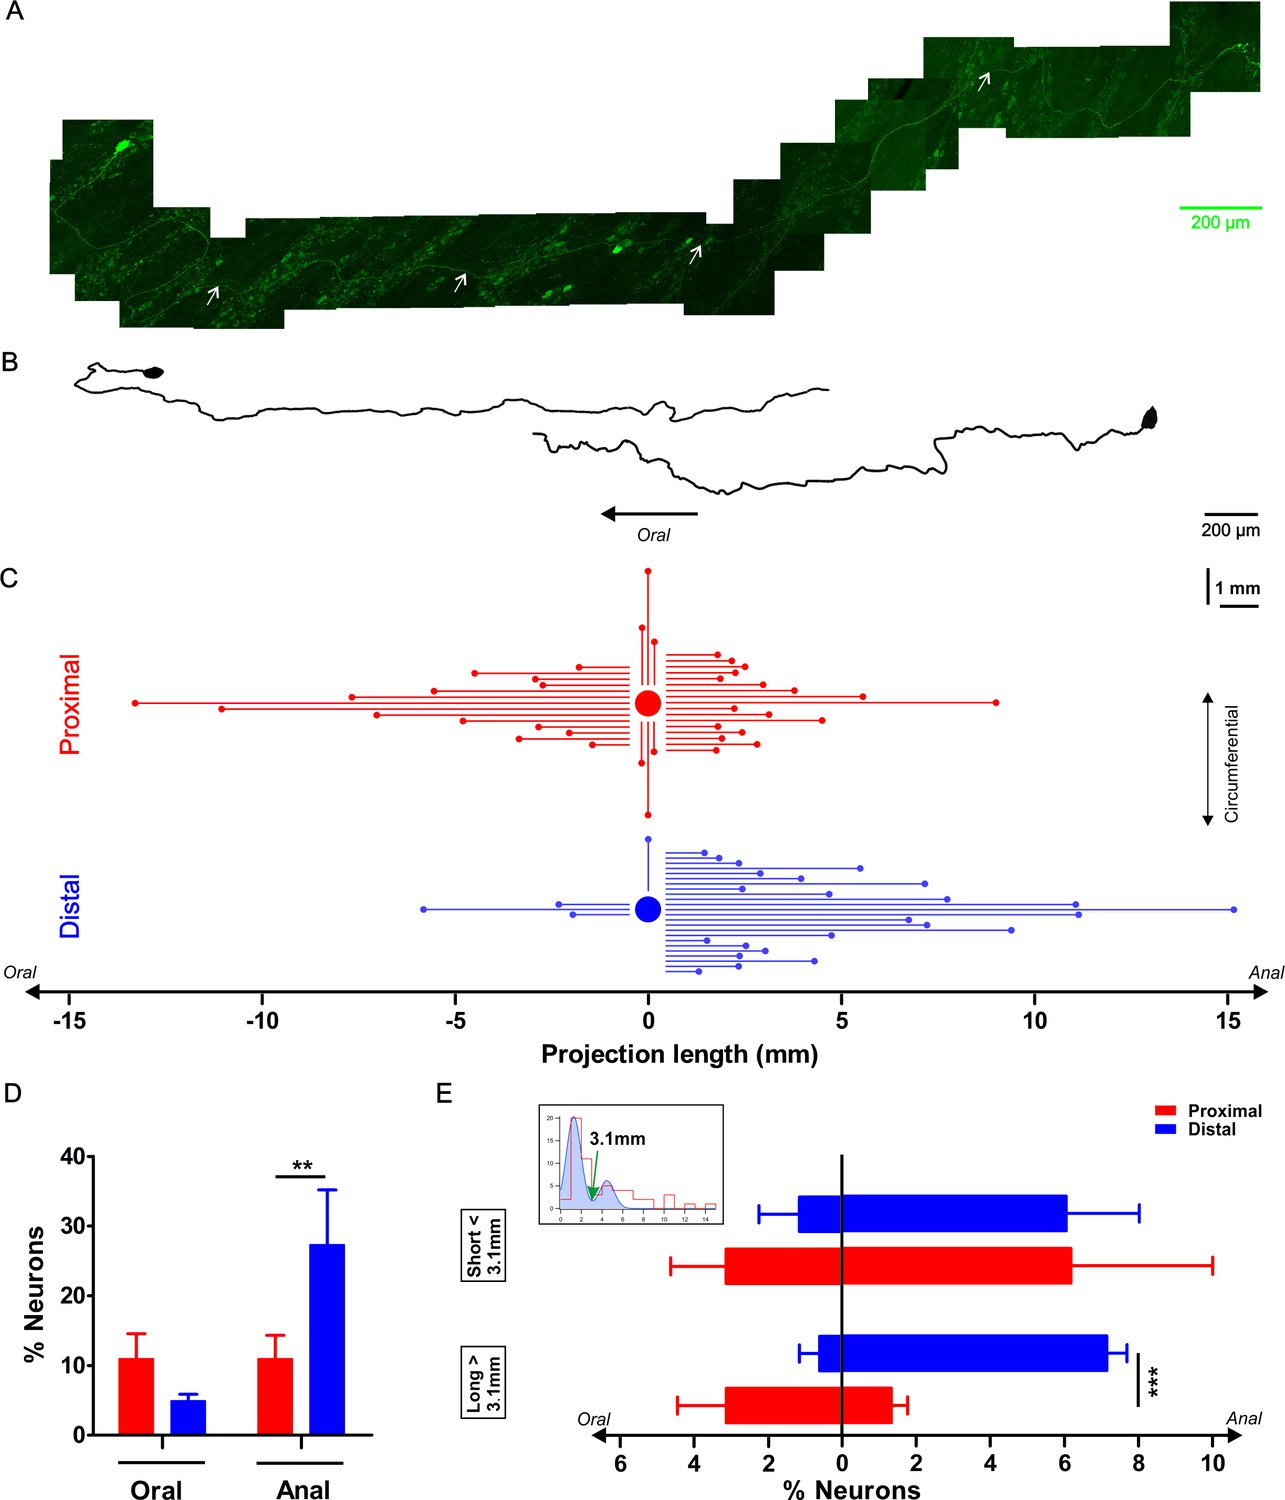
Characterization of the axonal projection length and orientation of myenteric neurons in the proximal and distal colon.
(A) Composite image of an eGFP+ enteric neuron and its axon located in the colonic myenteric plexus of a mouse that was sparsely transduced with rAAV9-CMV-eGFP two weeks prior to tissue collection. The axon’s (marked with white arrows) total length is 4.35 mm. (B) Two examples of reconstructed projection (one oral and one aboral) orientations of eGFP transduced myenteric neurons. (C) Graphic summarizing the axonal length and projection orientation of all tracked myenteric neurons. For about half of the eGFP expressing neurons (Prox: 37/57 and Dis: 28/61), it was possible to trace the axon to its final target. Of those, 14 projected orally (mean length of 4.6 ± 1.0 mm), 17 aborally (mean length: 2.6 ± 0.4 mm) and six circumferentially (length of 1.7 ± 0.4 mm in the proximal, while in the distal 3 projected orally (mean length: 2.9 ± 1.2 mm), 24 anally (mean length: 4.7 ± 0.7 mm) and only 1 projected circumferentially (1.4 mm). (D) Percentage of neurons projecting orally or aborally in the proximal and distal colon, asterisks indicate statistical difference (Dis: 27.3 ± 7.9% vs Prox: 11.0 ± 3.4%, p=0.004, χ2 test). (E) The inset shows the bimodal distribution of projection lengths (all pooled) and a bimodal Gaussian fit (blue) with a clear trough at 3.1 mm (green arrow). Using this value as a cutoff, the neurons were sorted in long and short projecting ones. Percentage of orally or aborally projecting neurons in the proximal and distal colon, asterisks indicate statistical difference (Dis: 7.1 ± 0.5% vs Prox: 1.3 ± 0.4%, ***p<0.001; Prox: N = 4; Dis: N = 3).
-
Figure 7—source data 1
NO. of mice.
- https://doi.org/10.7554/eLife.42914.032
-
Figure 7—source data 2
Projection length.
- https://doi.org/10.7554/eLife.42914.033
-
Figure 7—source data 3
Percentage of neurons.
- https://doi.org/10.7554/eLife.42914.034
-
Figure 7—source data 4
Bimodal distribution of projection length.
- https://doi.org/10.7554/eLife.42914.035
Figure 8 with 1 supplement
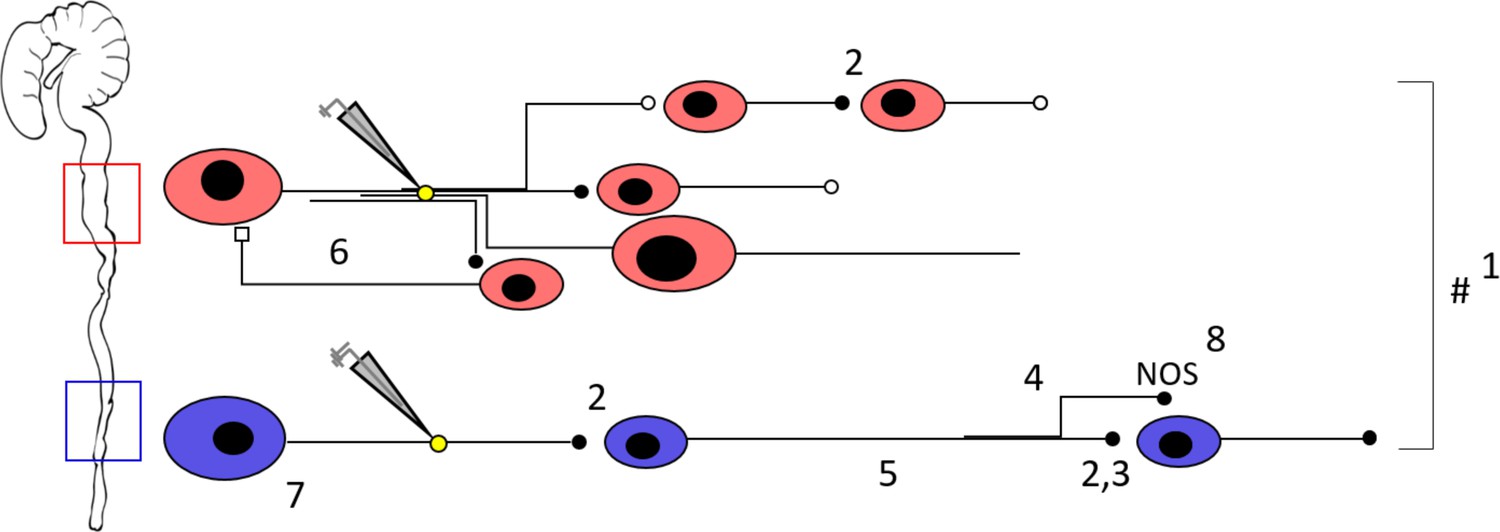
Schematic representation of the neuronal circuitry differences in the proximal versus the distal colon as determined by Ca2+ imaging, focal electrical stimulation (represented by electrode and yellow circle), spatial analysis, viral vector tracing and immunohistochemistry.
Using a 5x lens, we observed that fewer neurons (1) respond to focal electrical stimulation in the distal colon, which cannot be simply explained by the fewer number of neurons present and the fewer neuronal fibers that were stimulated. This suggests that the proximal circuitry is more complex and has more branching projections. Nicotinic transmission (represented by the black full circles, 2) plays a more important role in the distal colon (as evidenced by the effect of hexamethonium, Hex, 200 μM, and supported by VAChT immunohistochemistry) (3), a phenomenon that scales with distance from the stimulation electrode (4). AAV9 viral vector tracing indicated that there are more long distally projecting neurons in the distal colon than in the proximal colon (5). In addition, we identified an inhibitory circuit component that is dependent on cholinergic transmission (6) in the proximal colon. Neuronal size measurements reveal that Hex-independent neurons with large cell bodies are localized in the vicinity of the stimulation site in the distal colon (7). Immunohistochemical stainings showed a higher proportion of nitric oxide synthase (nNOS) neurons in the distal colon (8), these are likely to be inhibitory motor neurons and therefore endpoints of the circuitry. Taken together, the neuronal circuitry in the proximal colon is clearly more complex in its wiring compared to the distal colon. This difference in complexity may well reflect the richness of the palette of motor patterns that the specific gut regions can exert. See also Figure 8—video 1 for an animated buildup of the schematic.
Figure 8—video 1
Neuronal circuitry differences in the proximal and distal colon.
https://doi.org/10.7554/eLife.42914.037
Author response image 1

Schematic overview of the data obtained for each single site stimulation in distal and proximal colon.
Tables
Table 1
Antibodies used for immunohistochemistry.
https://doi.org/10.7554/eLife.42914.038| Antibodies | Host | Dilution | Source/Catalog number/RRID number |
|---|---|---|---|
| ChAT | Goat | 1:500 | Fisher scientific; AB144P; AB_2079751 |
| GFP | Rat | 1:1000 | Gentaur; 04404-84; AB_10013361 |
| HuCD | Human | 1:2000 | Gift fromKryzer Thomas J |
| nNOS | Sheep | 1:5000 | Gift from Miles Emson |
| Tuj1 | Rabbit | 1:2000 | Covance; PRB-435P-100; AB_291637 |
| vAChT | Guinea pig | 1:500 | Synaptic Systems; 139105; AB_10893979 |
| Anti-goat A488 | Donkey | 1:1000 | Molecular Probes; A-32814 |
| Anti-rat A488 | Donkey | 1:1000 | Molecular Probes; A-21208; AB_141709 |
| Anti-rabbit A488 | Donkey | 1:1000 | Molecular Probes; A-21206; AB_141708 |
| Anti-human A594 | Donkey | 1:1000 | Jackson Immuno Labs; 709-585-149; AB_2340572 |
| Anti-sheep A647 | Donkey | 1:500 | Molecular Probes; A-21448 |
| Anti-human AMCA | Goat | 1:250 | Jackson Immuno Labs; 109-155-003; AB_2337696 |
| Anti-guinea pig A594 | Goat | 1:500 | Molecular Probes; A-11076; AB_141930 |
-
Abbreviations: ChAT, choline acetyltransferase; GFP, green fluorescent peptide; nNOS, neuronal nitric oxide synthase; Tuj1: neuronal class III β-tubulin; VAChT, vesicular acetylcholine transporter.
Additional files
-
Source code 1
Ca Imaging Analysis.
- https://doi.org/10.7554/eLife.42914.039
-
Source code 2
Installation instructions and user guide.
- https://doi.org/10.7554/eLife.42914.040
-
Transparent reporting form
- https://doi.org/10.7554/eLife.42914.041
Download links
A two-part list of links to download the article, or parts of the article, in various formats.
Downloads (link to download the article as PDF)
Open citations (links to open the citations from this article in various online reference manager services)
Cite this article (links to download the citations from this article in formats compatible with various reference manager tools)
Regional complexity in enteric neuron wiring reflects diversity of motility patterns in the mouse large intestine
eLife 8:e42914.
https://doi.org/10.7554/eLife.42914


