Suppressor of fused controls perinatal expansion and quiescence of future dentate adult neural stem cells
- University of California, San Francisco, United States
- Kyushu University, Japan
Figures
Figure 1 with 1 supplement

Deletion of Sufu decreases Hh-responding cells during DG development.
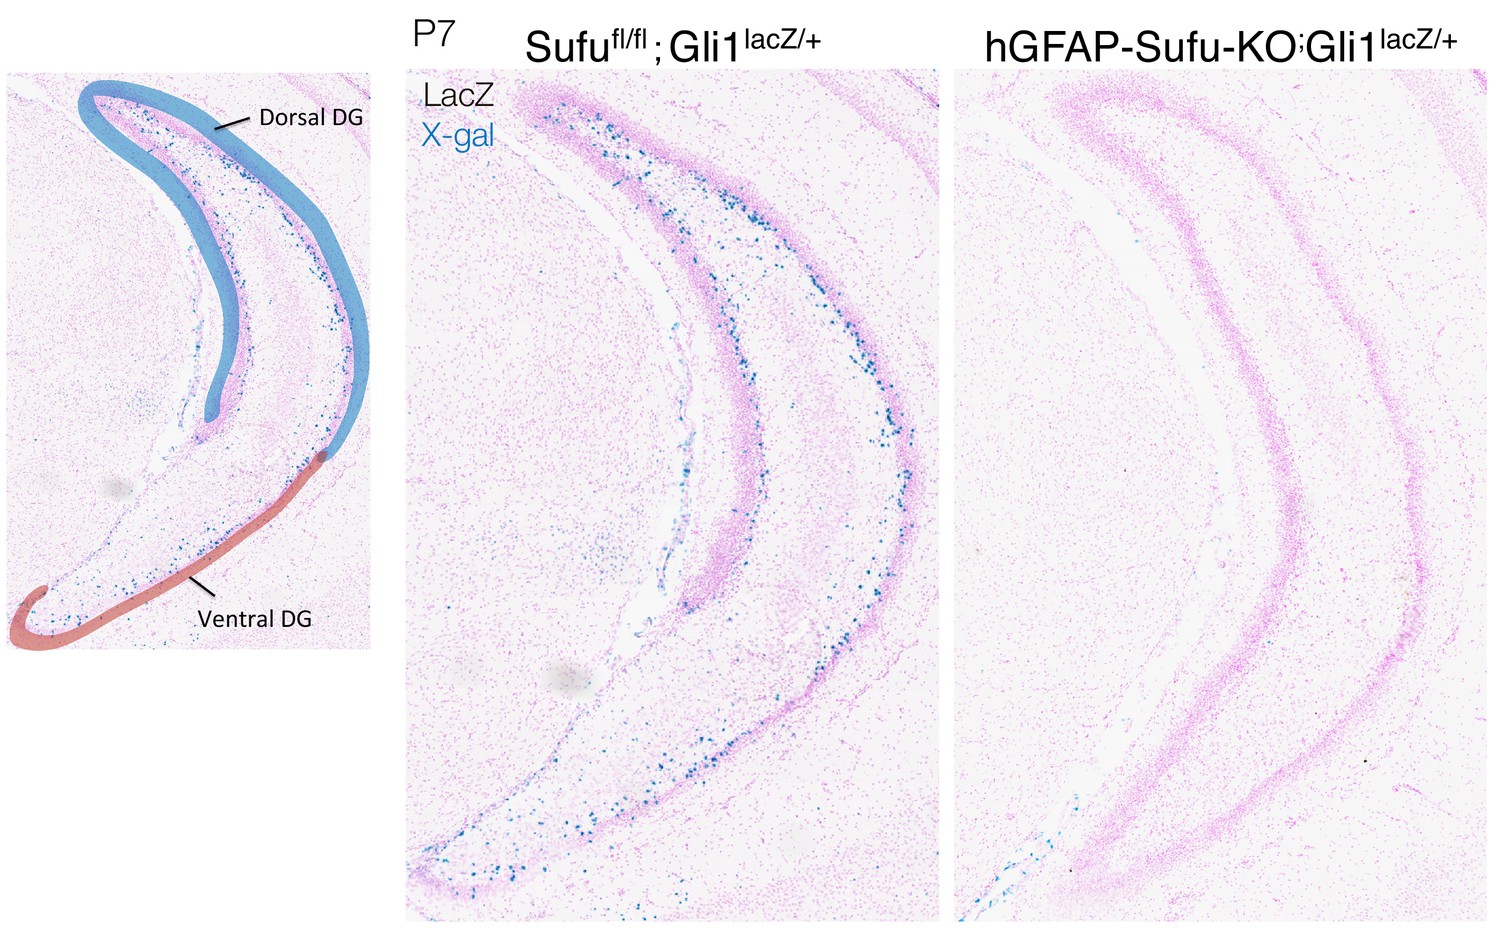
(A) Representative Gli1-LacZ staining images of sagittal brain sections in Sufufl/fl;Gli1lacZ/+and hGFAP-Sufu-KO;Gli1lacZ/+ mice at E15.5-P0. Magnified images of the black dashed-line boxes are shown to below of each image. (B) Representative Gli1-LacZ staining images of dorsal DG in sagittal sections of Sufufl/fl;Gli1lacZ/+ and hGFAP-Sufu-KO;Gli1lacZ/+ mice. (C) From anterior to posterior, four levels of coronal sections for Gli1-nLacZ staining at E17.5 are shown. Note that lacZ +cells are diminished in the DG of hGFAP-Sufu-KO;Gli1lacZ/+ mice from the beginning of DG development.
Figure 1—figure supplement 1
Deletion of Sufu decreases Hh-responding cells during DG development.
Representative Gli1-LacZ staining images of dorsal DG in sagittal sections of Sufufl/fl;Gli1lacZ/+ and hGFAP-Sufu-KO;Gli1lacZ/+ mice. Note that lacZ +cells are observed more in dorsal DG compared with ventral DG, and these cells are diminished in both DGs in hGFAP-Sufu-KO;Gli1lacZ/+ mice.
Figure 2 with 1 supplement
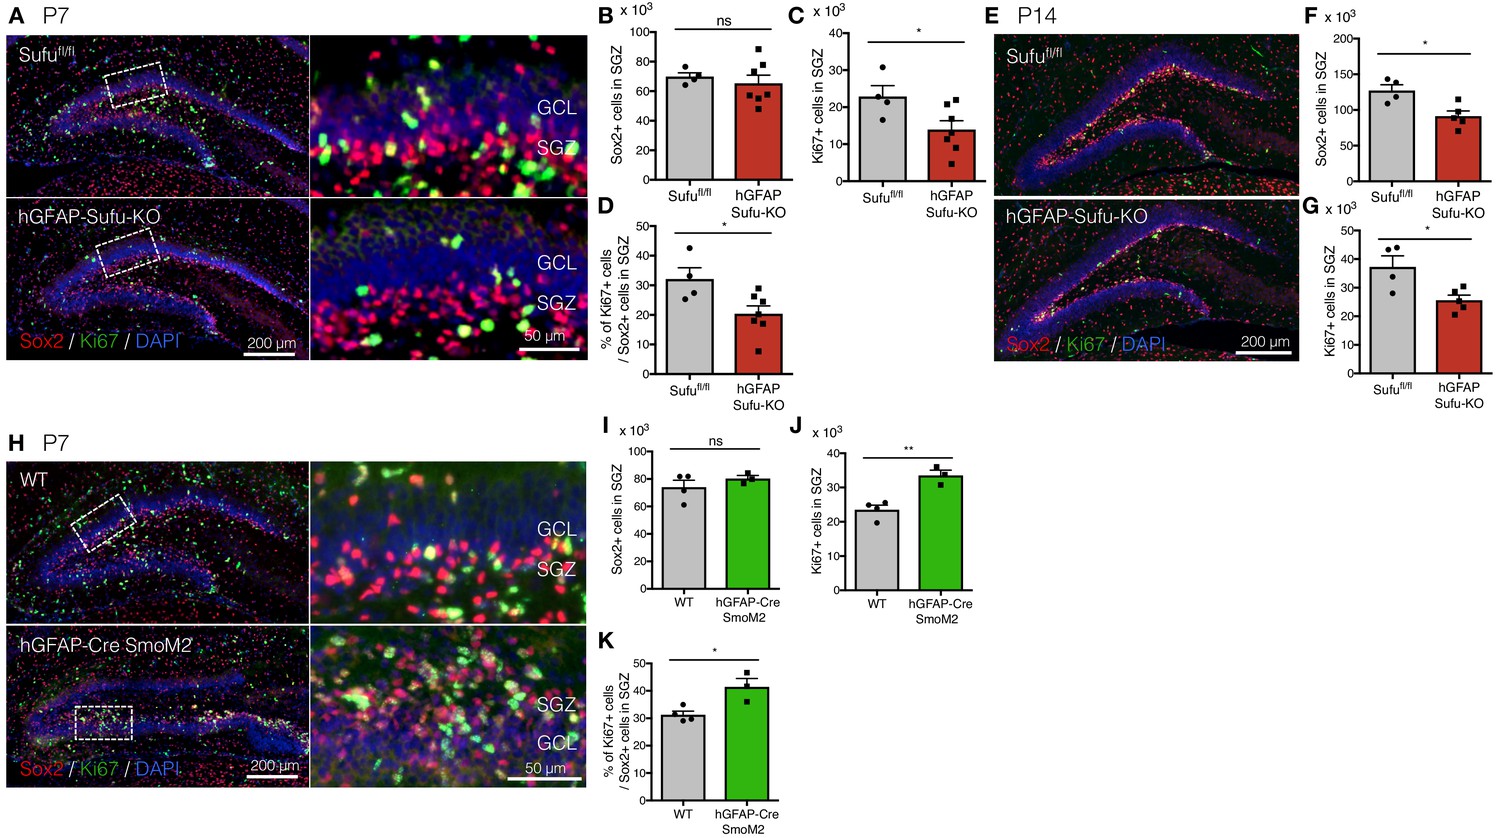
Deletion of Sufu decreases proliferation of DG-NSCs.
(A) Representative immunofluorescence images of Sox2 (red) and Ki67 (green) in the DG of Sufufl/fl and hGFAP-Sufu-KO mice at P7. DNA is stained with DAPI (blue). Magnified images of the white dashed-line boxes are shown to the right of each image. (B,C) Quantification of Sox2+ (B) and Ki67+ (C) cells in the SGZ [Sufufl/fl, n = 5; hGFAP-Sufu-KO n = 7]. (D) The bar graph indicates the ratio of Ki67 +cells to Sox2 +NSCs in the SGZ [Sufufl/fl, n = 5; hGFAP-Sufu-KO n = 7]. (E) Representative immunofluorescence images of Sox2 (red) and Ki67 (green) in the DG of Sufufl/fl and hGFAP-Sufu-KO mice at P14. (F, G) Quantification of Sox2+ (F) and Ki67+ (G) cells in the SGZ [Sufufl/fl, n = 4; hGFAP-Sufu-KO n = 5]. (H) Representative immunofluorescence images of Sox2 (red), Ki67 (green) and DAPI (blue) in the DG of WT and hGFAP-Cre;SmoM2 mice at P7. Magnified images of the white dashed-line boxes are shown to the right of each image. (I,J) Quantification of Sox2+ (I) and Ki67+ (J) cells in the SGZ [WT, n = 4; hGFAP-Cre;SmoM2, n = 3]. (K) The bar graph indicates the ratio of Ki67 +cells to Sox2 +NSCs in the SGZ [WT, n = 4; hGFAP-Cre;SmoM2, n = 3]. Values represent mean ±SEM; ns: p>0.05, *p<0.05, **p<0.01. Student’s t-test.
-
Figure 2—source data 1
Extended numerical data and statistical analysis for Figure 2—figure supplement 1.
- https://doi.org/10.7554/eLife.42918.006
Figure 2—figure supplement 1
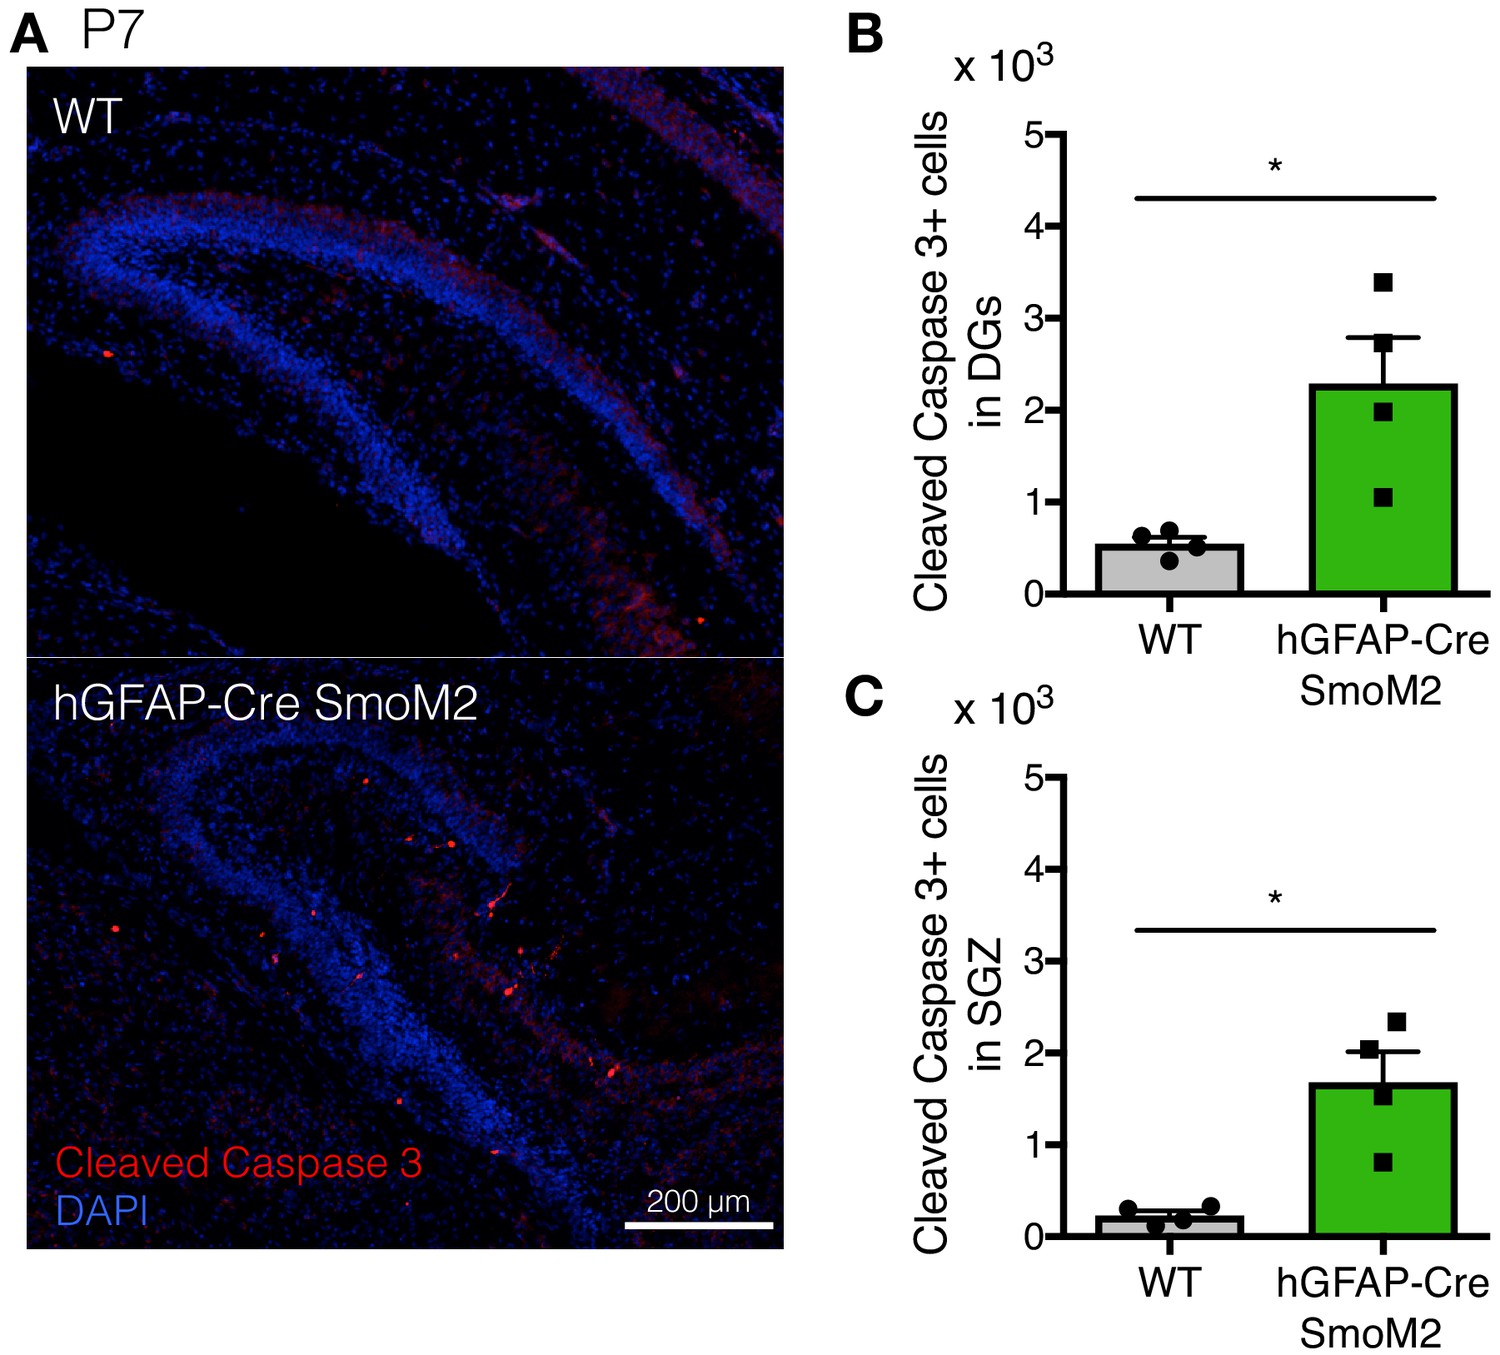
Excessive Shh signaling activity leads to abnormal morphology of DGs and increased cell death.
(A) Representative immunofluorescence images of Cleaved Caspase 3 (red) and DAPI (blue) in the DG of WT and hGFAP-Cre;SmoM2 mice at P7. (B, C) Quantification of Cleaved Caspase 3 + cells in the DGs (B) and SGZ (C) [n = 4 biological replicates per group]. Values represent mean ±SEM; ns: p>0.05, *p<0.05, **p<0.01. Welch’s t-test.
-
Figure 2—figure supplement 1—source data 1
Extended numerical data and statistical analysis for Figure 2.
- https://doi.org/10.7554/eLife.42918.007
Figure 3 with 2 supplements
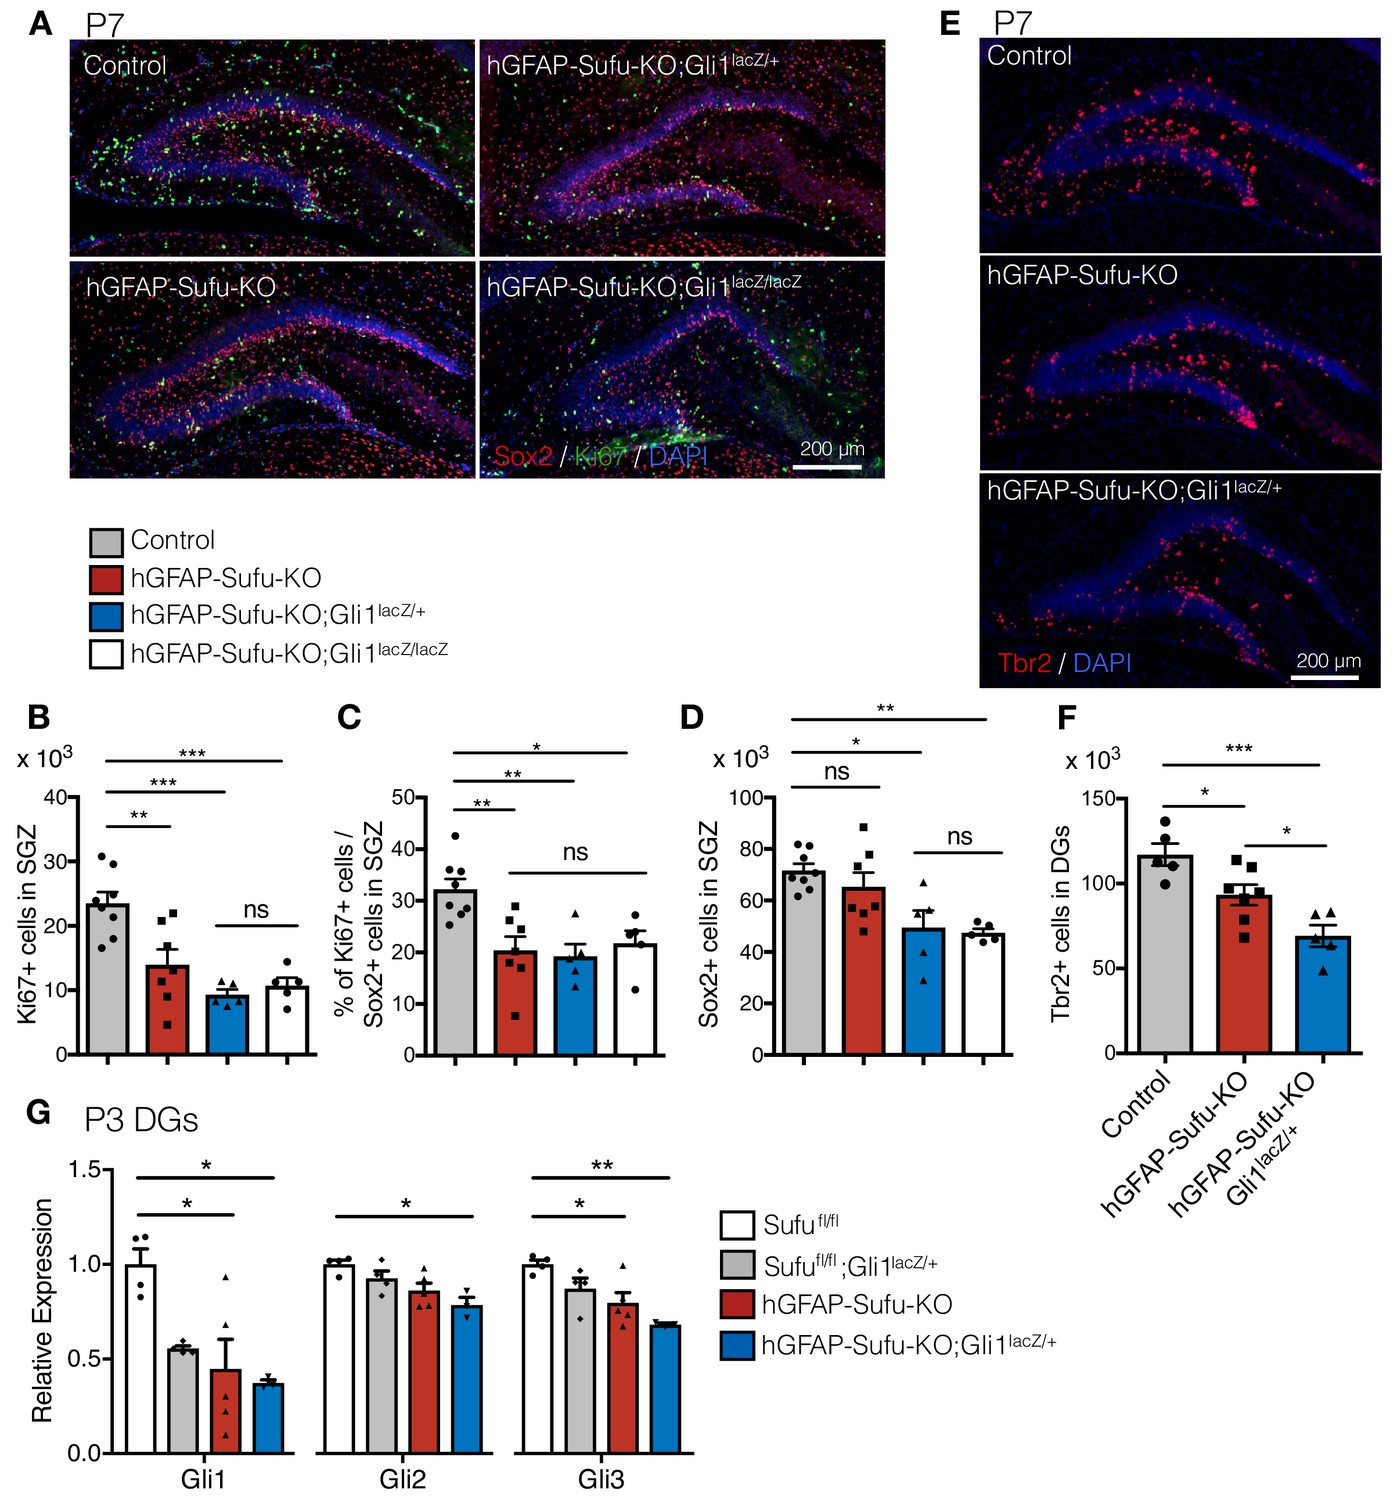
Gli1 deletion increases the developmental defects in hGFAP-Cre Sufufl/fl mice.
(A) Representative immunofluorescence images of Sox2 (red), Ki67 (green) and DAPI (blue) in the DG of Control, hGFAP-Sufu-KO, hGFAP-Sufu-KO;Gli1lacZ/+, and hGFAP-Sufu-KO;Gli1lacZ/lacZ mice at P7. (B, C) Quantification of Ki67 +cells (B) and ratio of Ki67 +proliferating cell population in Sox2 +cells (C) in SGZ [Control, n = 8; hGFAP-Sufu-KO, n = 7; hGFAP-Sufu-KO;Gli1lacZ/+, n = 5; hGFAP-Sufu-KO;Gli1lacZ/lacZ, n = 5]. (D) Sox2 +cells counts in SGZ from each group [Control, n = 8; hGFAP-Sufu-KO, n = 7; hGFAP-Sufu-KO;Gli1lacZ/+, n = 5; hGFAP-Sufu-KO;Gli1lacZ/lacZ, n = 5]. (E) Representative immunofluorescence images of Tbr2 (red) and DAPI (blue) in the DG of Control, hGFAP-Sufu-KO and hGFAP-Sufu-KO;Gli1lacZ/+ mice at P7. (F) The number of Tbr2 +cells in DGs [Control, n = 7; hGFAP-Sufu-KO, n = 7; hGFAP-Sufu-KO;Gli1lacZ/+, n = 5]. (G) qRT-PCR analyses of Gli1, Gli2 and Gli3 expression in the P3 DGs of Sufufl/fl, Sufufl/fl;Gli1lacZ/+, hGFAP-Sufu-KO and hGFAP-Sufu-KO;Gli1lacZ/+ mice [Sufufl/fl, n = 4; Sufufl/fl;Gli1lacZ/+, n = 4, hGFAP-Sufu-KO, n = 5; hGFAP-Sufu-KO;Gli1lacZ/+, n = 3]. Values represent mean ±SEM; ns: p>0.05, *p<0.05, **p<0.01, ***p<0.001. ANOVA with Tukey post-hoc tests.
-
Figure 3—source data 1
Extended numerical data and statistical analysis for Figure 3.
- https://doi.org/10.7554/eLife.42918.011
Figure 3—figure supplement 1
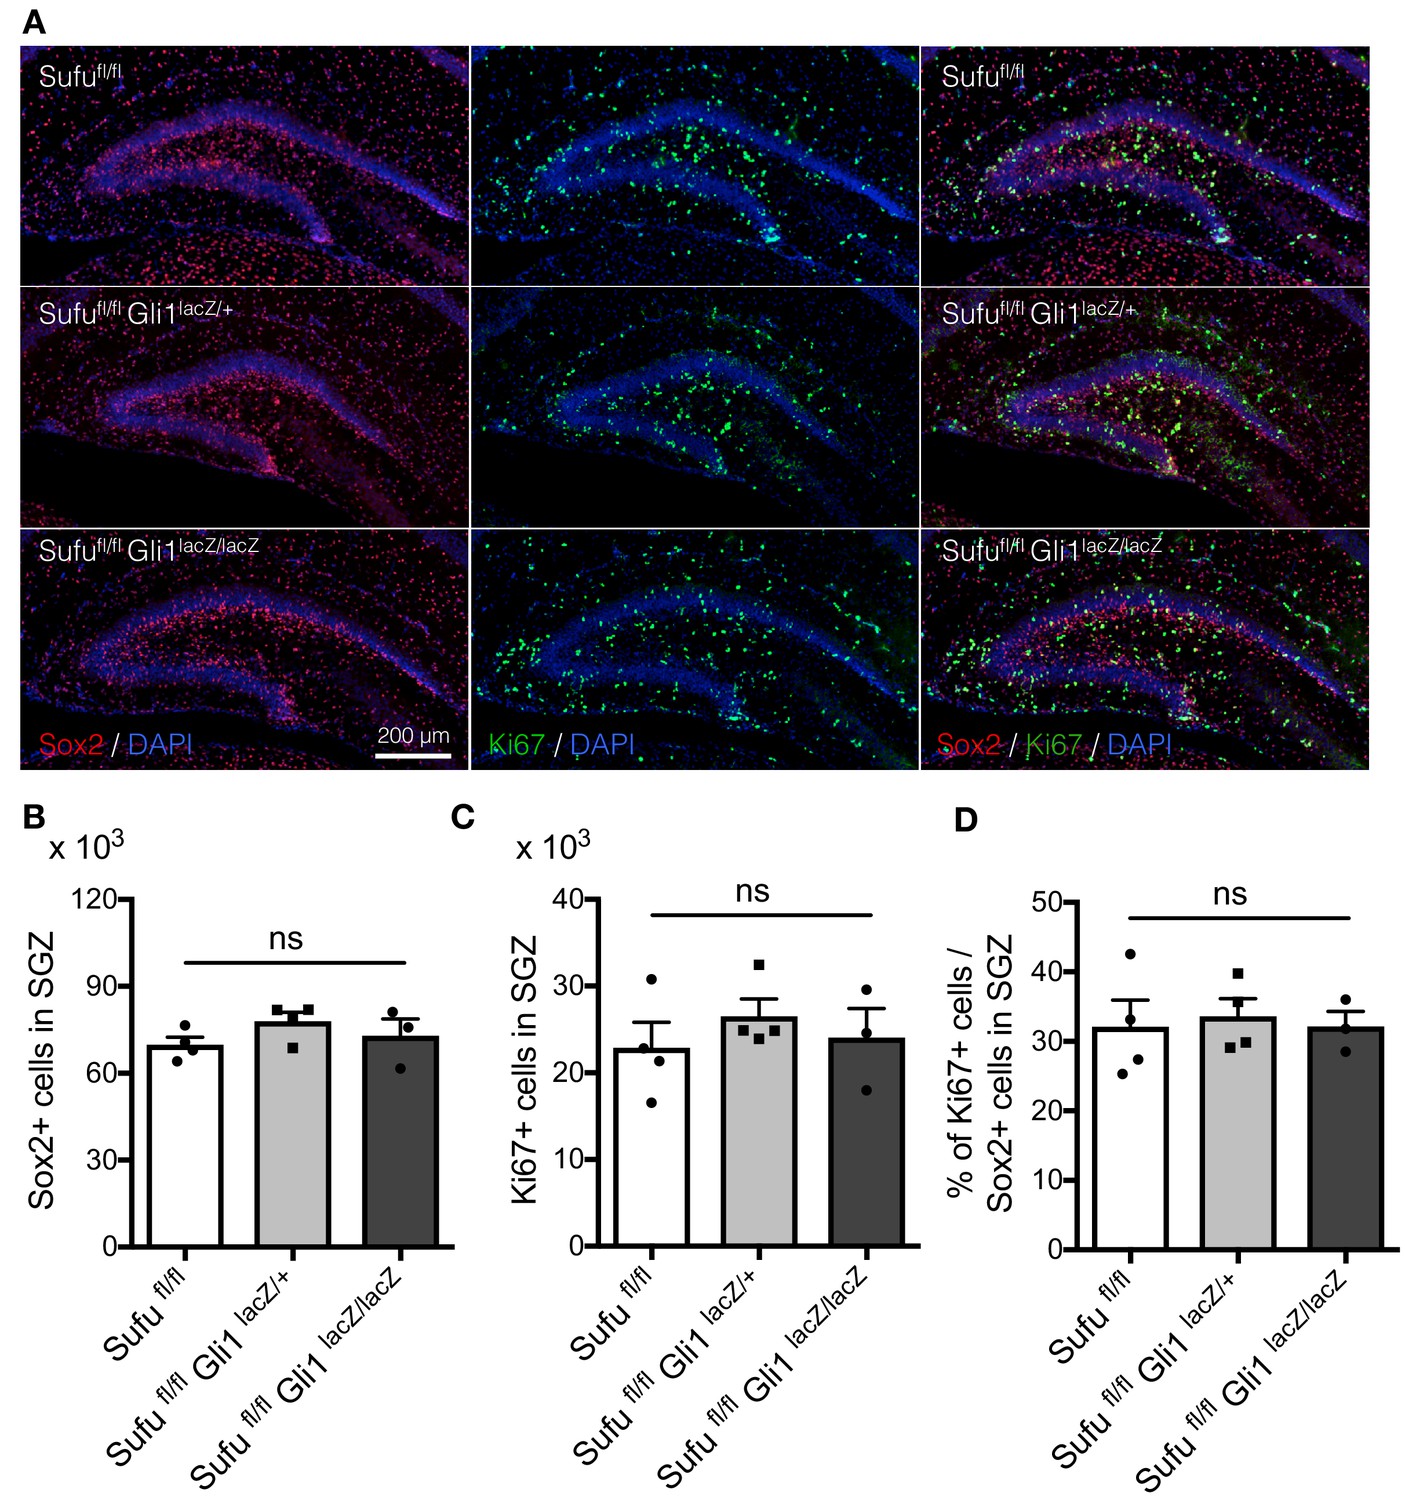
Deletion of Gli1 does not affect cell proliferation.
(A) Representative immunofluorescence images of Sox2 (red) and Ki67 (green) in the DG of Sufufl/fl, Sufufl/fl;Gli1lacZ/+, Sufufl/fl;Gli1lacZ/lacZ mice at P7. DNA is stained with DAPI (blue). (B,C) Quantification of Sox2+ (B) and Ki67+ (C) cells in the SGZ [Sufufl/fl, n = 4; Sufufl/fl;Gli1lacZ/+, n = 4; Sufufl/fl;Gli1lacZ/lacZ, n = 3]. (D) The bar graph indicates the ratio of Ki67 +cells to Sox2 +NSCs in DGs [Sufufl/fl, n = 4; Sufufl/fl;Gli1lacZ/+, n = 4; Sufufl/fl;Gli1lacZ/lacZ, n = 3]. Values represent mean ±SEM; ns: p>0.05. ANOVA with Tukey post-hoc tests.
-
Figure 3—figure supplement 1—source data 1
Extended numerical data and statistical analysis for Figure 3—figure supplement 1.
- https://doi.org/10.7554/eLife.42918.012
Figure 3—figure supplement 2
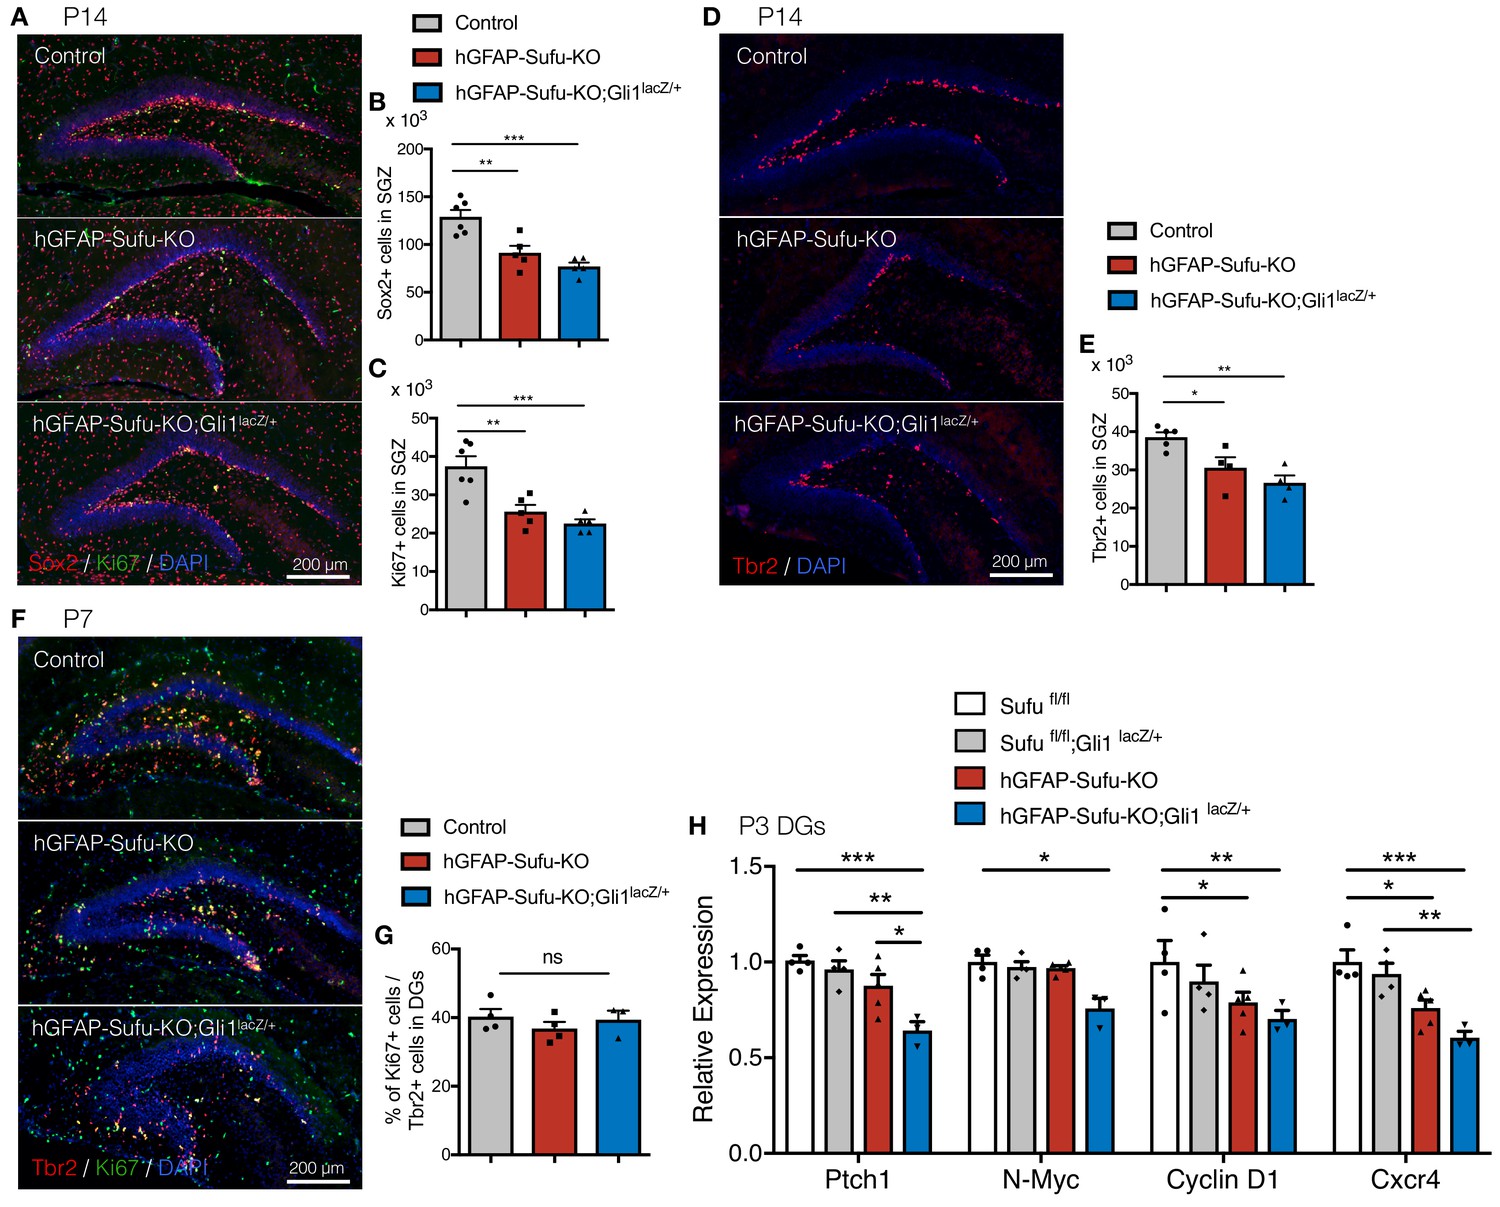
Deletion of Sufu decreases proliferation of NSCs, but not neuronal precursors.
(A) Representative immunofluorescence images of Sox2 (red) and Ki67 (green) in the DG of Control, hGFAP-Sufu-KO and hGFAP-Sufu-KO;Gli1lacZ/+ mice at P14. DNA is stained with DAPI (blue). (B,C) Quantification of Sox2+ (B) and Ki67+ (C) cells in the SGZ [Control, n = 6; hGFAP-Sufu-KO, n = 5; hGFAP-Sufu-KO;Gli1lacZ/+, n = 5]. (D) Representative immunofluorescence images of Tbr2 (red) in the DG of Control, hGFAP-Sufu-KO and hGFAP-Sufu-KO;Gli1lacZ/+ mice at P14. (E) Tbr2 +cells counts in SGZ from each group [Control, n = 5; hGFAP-Sufu-KO, n = 4; hGFAP-Sufu-KO;Gli1lacZ/+, n = 4]. (F) Representative immunofluorescence images of Tbr2 (red) and Ki67 (green) in the DG of Control, hGFAP-Sufu-KO and hGFAP-Sufu-KO;Gli1lacZ/+ mice at P7. (G) The bar graph indicates the ratio of Ki67 +cells to Tbr2 +NSCs in DGs [Control, n = 4; hGFAP-Sufu-KO, n = 4; hGFAP-Sufu-KO;Gli1lacZ/+, n = 3]. (H) qRT-PCR analyses of Ptch1, N-Myc, Cyclin D1, and Cxcr4 expression in the DGs of Sufufl/fl, Sufufl/fl;Gli1lacZ/+, hGFAP-Sufu-KO and hGFAP-Sufu-KO;Gli1lacZ/+ mice at P3 [Sufufl/fl, n = 4; Sufufl/fl;Gli1lacZ/+, n = 4, hGFAP-Sufu-KO, n = 5; hGFAP-Sufu-KO;Gli1lacZ/+, n = 3]. Values represent mean ±SEM; ns: p>0.05, *p<0.05, **p<0.01, ***p<0.001. ANOVA with Tukey post-hoc tests.
-
Figure 3—figure supplement 2—source data 1
Extended numerical data and statistical analysis for Figure 3—figure supplement 2.
- https://doi.org/10.7554/eLife.42918.013
Figure 4 with 1 supplement
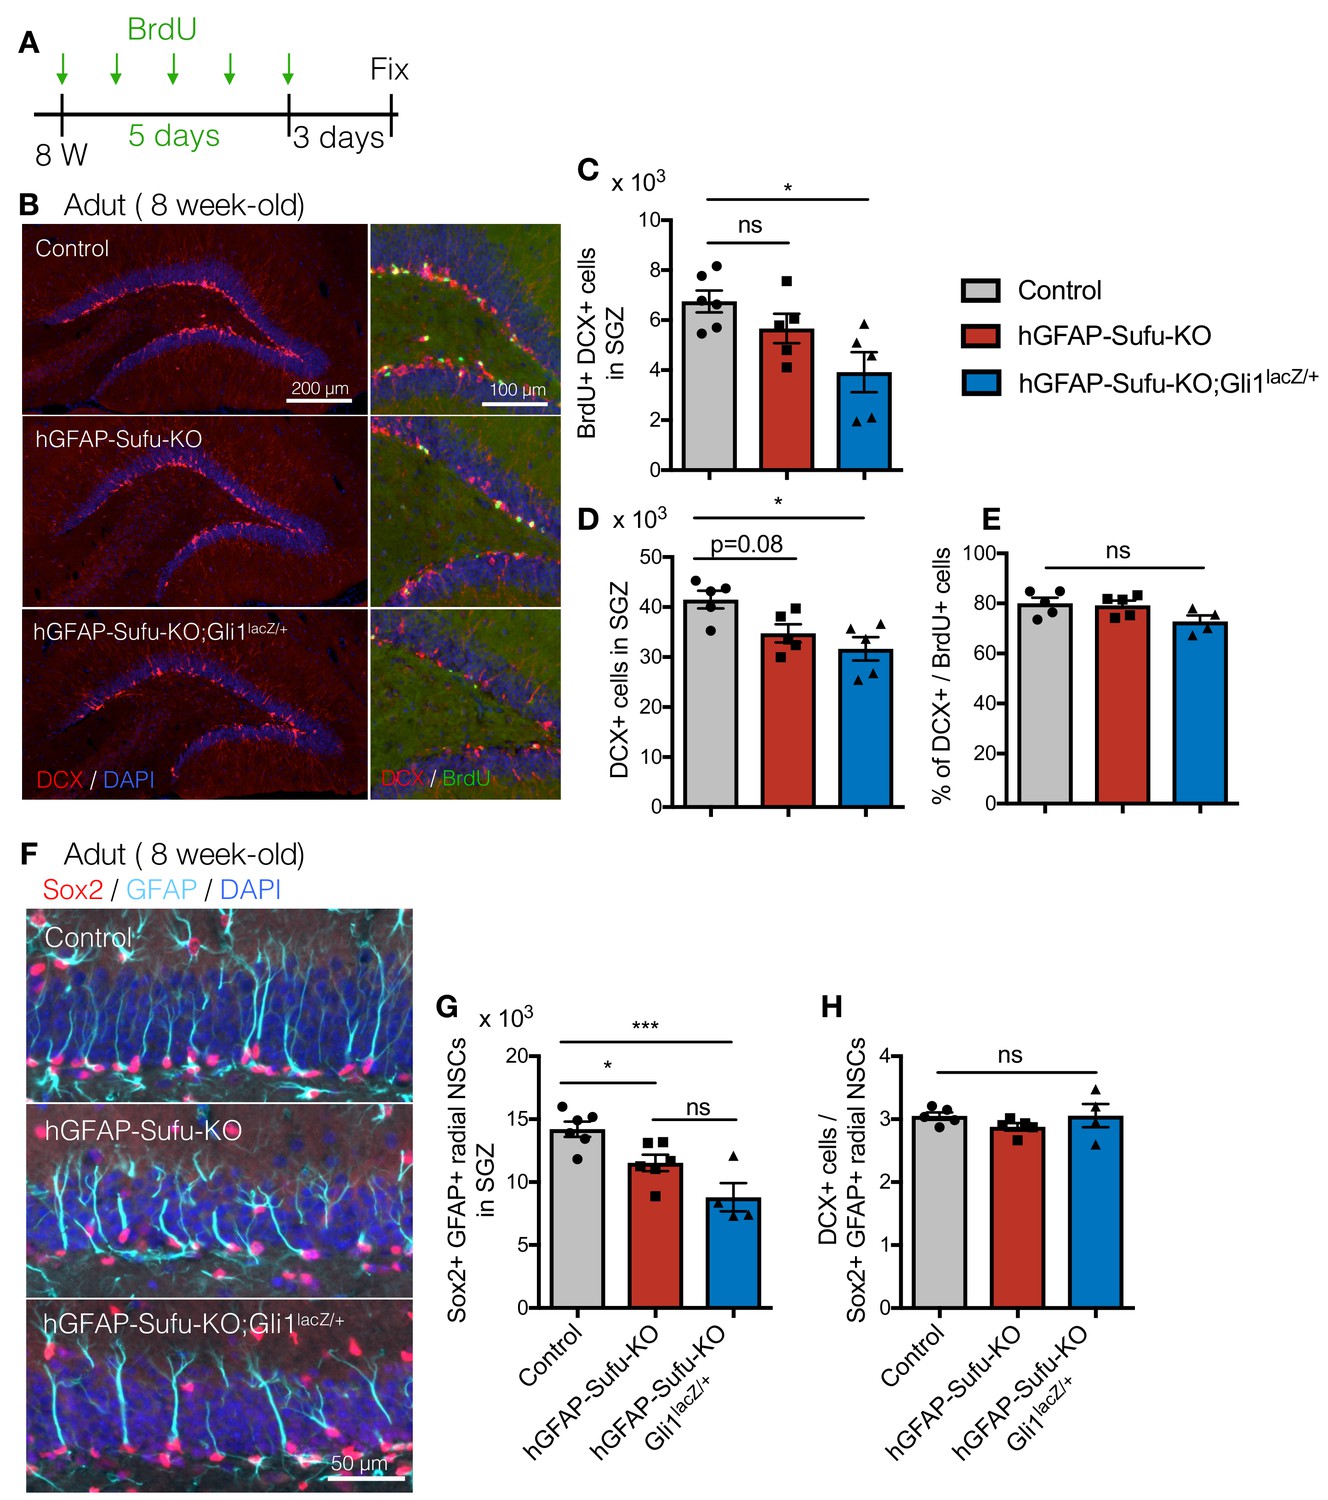
Deletion of Sufu during DG development decreases qNSCs pool in adult DGs.
(A) Experimental scheme of BrdU injection. 8 week-old mice were injected with BrdU for 5 days and analyzed 3 days after last BrdU injection. (B) Representative immunofluorescence images for DCX (red) and DAPI (blue) in the DGs of control, hGFAP-Sufu-KO and hGFAP-Sufu-KO;Gli1lacZ/+ mice. Magnified images of DCX (red), BrdU (green) and DAPI (blue) are shown to the right of each image. (C, D) Quantification of BrdU+/DCX + cells (C) and DCX + cells (D) in SGZ [Control, n = 6; hGFAP-Sufu-KO, n = 5; hGFAP-Sufu-KO;Gli1lacZ/+, n = 5]. (E) The bar graph indicates the ratio of DCX + cells to BrdU +cells in SGZ [n = 5 biological replicates per group]. (F) Representative immunofluorescence images for Sox2 (red), GFAP (cyan) and DAPI (blue) in the SGZ of control, hGFAP-Sufu-KO and hGFAP-Sufu-KO;Gli1lacZ/+ mice. (G) Quantification of Sox2+/GFAP +radial NSCs [Control, n = 6; hGFAP-Sufu-KO, n = 6; hGFAP-Sufu-KO;Gli1lacZ/+, n = 4]. (H) The bar graph indicates the ratio of DCX + cells to Sox2+/GFAP +radial NSCs in SGZ [Control, n = 5; hGFAP-Sufu-KO, n = 5; hGFAP-Sufu-KO;Gli1lacZ/+, n = 4]. Values represent mean ±SEM; ns: p>0.05, *p<0.05, ***p<0.001. ANOVA with Tukey post-hoc tests.
-
Figure 4—source data 1
Extended numerical data and statistical analysis for Figure 4.
- https://doi.org/10.7554/eLife.42918.016
Figure 4—figure supplement 1
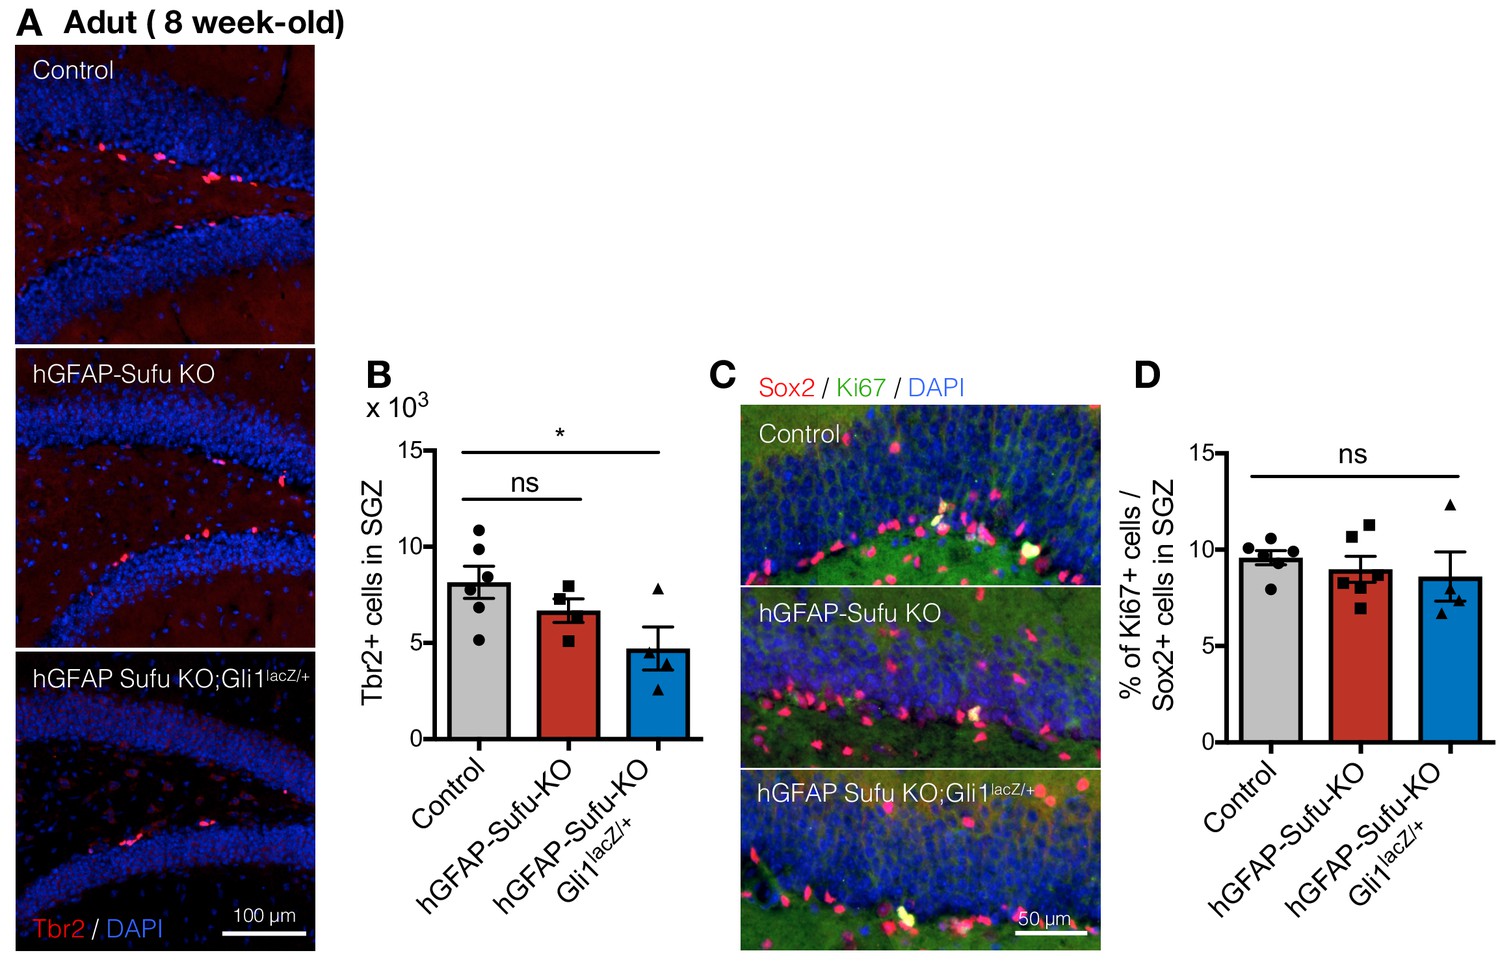
Deletion of Sufu during DG development decreases qNSCs pool in adult DGs.
(A) Representative immunofluorescence images for Tbr2 (red) and DAPI (blue) in the DGs of control, hGFAP-Sufu-KO and hGFAP-Sufu-KO;Gli1lacZ/+ mice. (B) Quantification of Tbr2 +cells in SGZ [Control, n = 6; hGFAP-Sufu-KO, n = 4; hGFAP-Sufu-KO;Gli1lacZ/+, n = 4]. (C) Representative immunofluorescence images for Sox2 (red), Ki67 (green) and DAPI (blue) in the DGs of control, hGFAP-Sufu-KO and hGFAP-Sufu-KO;Gli1lacZ/+ mice. (D) The bar graph indicates the ratio of Ki67 +cells to Sox2 +cells in SGZ [Control, n = 6; hGFAP-Sufu-KO, n = 6; hGFAP-Sufu-KO;Gli1lacZ/+, n = 4]. Values represent mean ±SEM; ns: p>0.05, *p<0.05. ANOVA with Tukey post-hoc tests.
-
Figure 4—figure supplement 1—source data 1
Extended numerical data and statistical analysis for Figure 4—figure supplement 1.
- https://doi.org/10.7554/eLife.42918.017
Figure 5 with 1 supplement
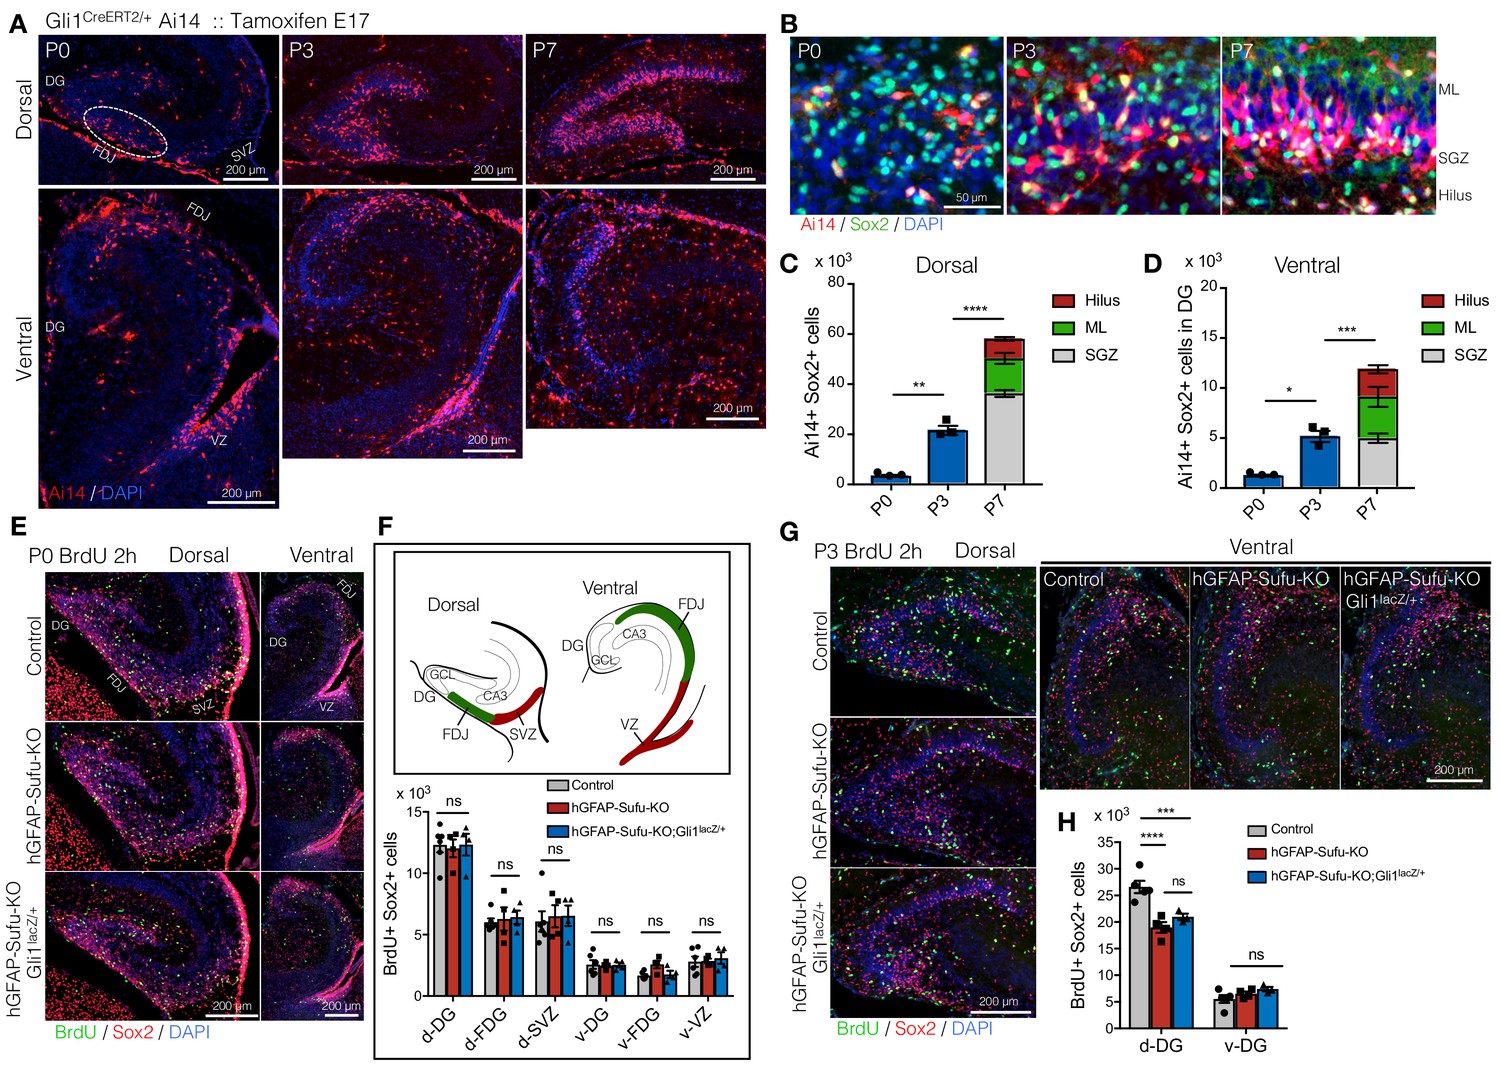
Long-lived NSCs expand in first postnatal week, and loss of Sufu impairs its expansion.
(A) Fate tracing of Hh-responding cells at E17.5 in postnatal DG development. Gli1CreERT2/+ Ai14 mice were treated with tamoxifen at E17.5 and Ai14 +Hh responding cells are analyzed in postnatal first week (P0-7). Representative immunofluorescence images for Ai14 (red) and DAPI (blue) in dorsal and ventral hippocampus in sagittal sections. Note that Hh-responding cells labeled by Ai14 at E17.5 sparsely appear in DGs at P0 and subsequently accumulate in SGZ. (B) Representative immunofluorescence images for Ai14 (red), Sox2 (green) and DAPI (blue) in SGZ. (C,D) Quantification of Ai14+/Sox2 +cells in dorsal (C) and ventral (D) DGs [n = 3 biological replicates per group]. The number of long-lived NSCs, indicated as Ai14+/Sox2 +cells, are increased in postnatal first week. (E) BrdU was injected at P0, and pups were sacrificed 2 hr later. Representative immunofluorescence images for BrdU (green), Sox2 (red) and DAPI (blue) in dorsal and ventral DGs of control, hGFAP-Sufu-KO and hGFAP-Sufu-KO;Gli1lacZ/+ mice. (F) Schematic illustration of the dorsal and ventral DG at P0. d: dorsal, v: ventral, FDJ: fimbriodentate junction; SVZ: subventricular zone. The bar graph indicates the number of Sox2+/BrdU +cells in each region [Control, n = 6; hGFAP-Sufu-KO, n = 4; hGFAP-Sufu-KO;Gli1lacZ/+, n = 4]. (G) BrdU was injected at P3, and pups were sacrificed 2 hr later. Representative immunofluorescence images for BrdU (green), Sox2 (red) and DAPI (blue) in dorsal and ventral DGs of control, hGFAP-Sufu-KO and hGFAP-Sufu-KO;Gli1lacZ/+ mice. (H) Quantification of Sox2+/BrdU +cells in dorsal and ventral DGs [Control, n = 5; hGFAP-Sufu-KO, n = 4; hGFAP-Sufu-KO;Gli1lacZ/+, n = 3]. Values represent mean ±SEM; ns: p>0.05, *p<0.05, **p<0.01, ***p<0.001, ****p<0.0001. ANOVA with Tukey post-hoc tests.
-
Figure 5—source data 1
Extended numerical data and statistical analysis for Figure 5.
- https://doi.org/10.7554/eLife.42918.020
Figure 5—figure supplement 1
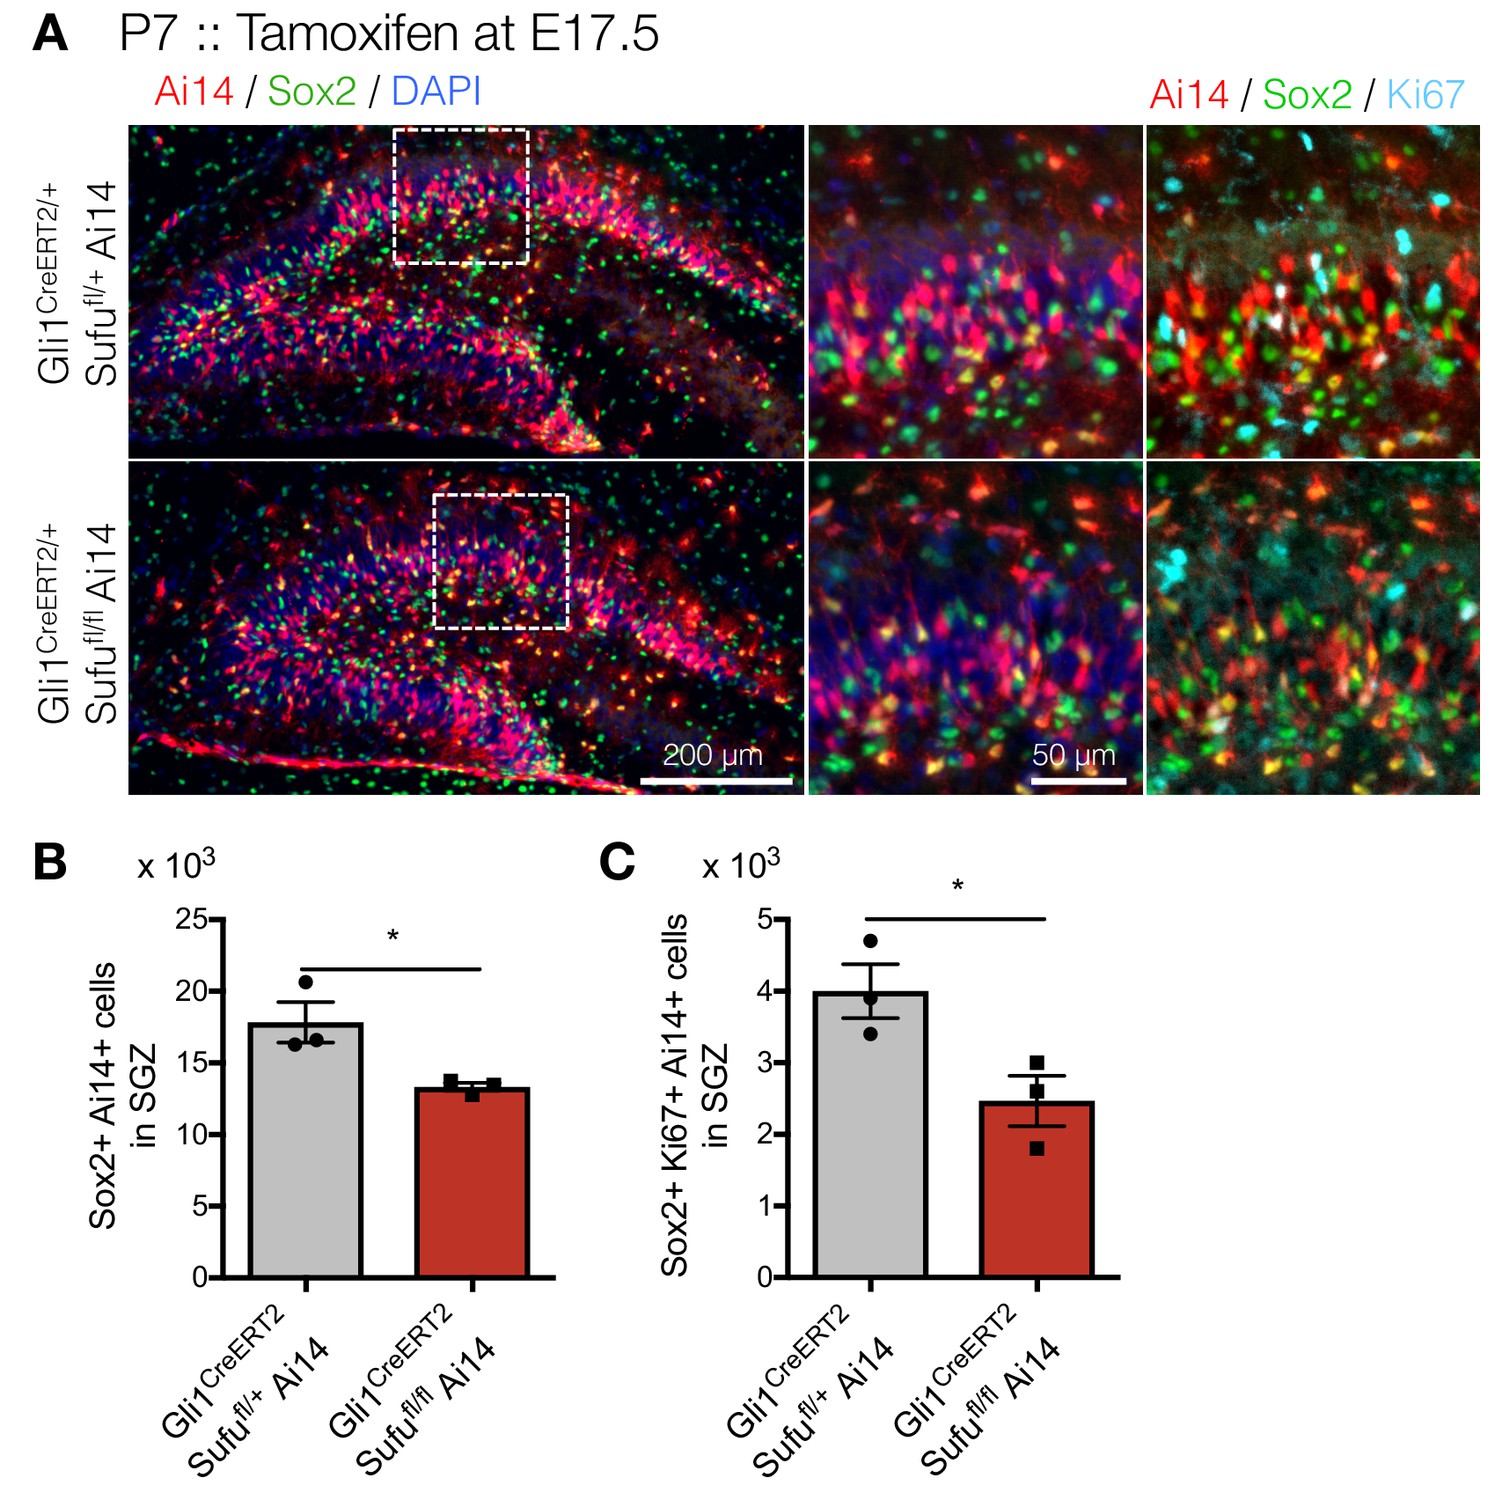
Prenatal deletion of Sufu in NSCs of ventral hippocampus leads to reduction of NSCs in the postnatal DGs.
(A) Representative immunofluorescence images for Ai14 (red), Sox2 (green) and DAPI (blue) in the DGs of Gli1CreERT2/+;Sufufl/+;Ai14 and Gli1CreERT2/+;Sufufl/fl;Ai14 mice. (B,C) Quantification of Ai14+/Sox2 +cells (B) and Ai14+/Sox2+/Ki67 +cells (C) in DGs [n = 3 biological replicates per group]. Values represent mean ±SEM; *p<0.05. Student’s t-test.
-
Figure 5—figure supplement 1—source data 1
Extended numerical data and statistical analysis for Figure 5—figure supplement 1.
- https://doi.org/10.7554/eLife.42918.021
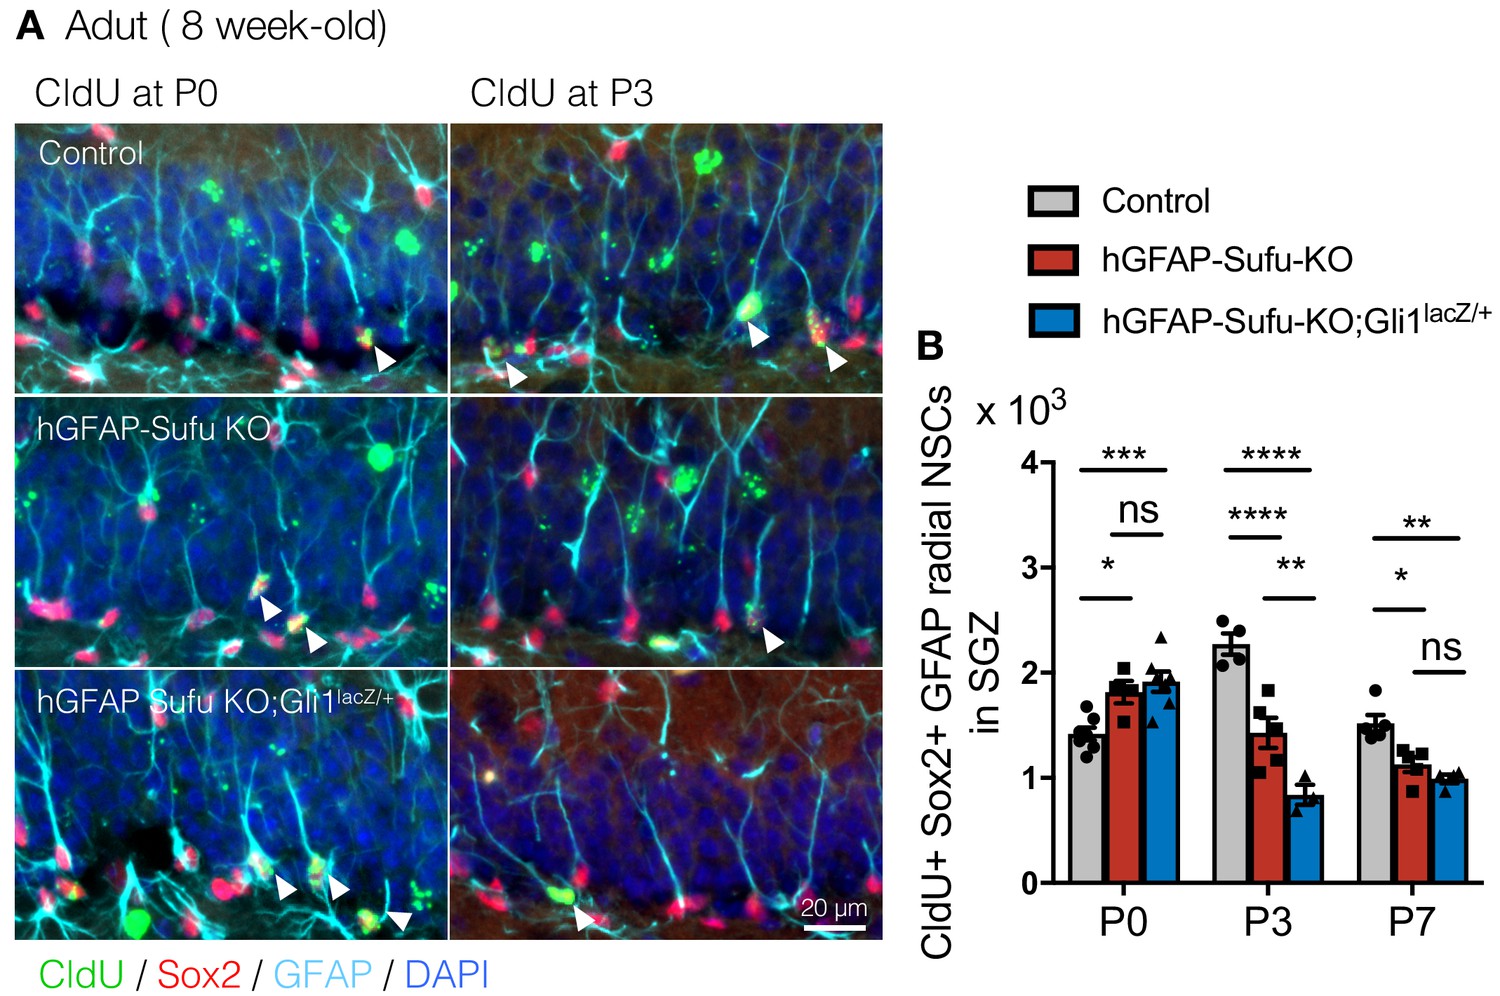
Figure 6 with 2 supplements

Deletion of Sufu prematurely induces the quiescent state transition.
(A) Schematic illustration for labeling NSCs that established quiescent state during DG development using two thymidine analogs. CldU is diluted when cell divides. Thus CldU amount goes down if the cell continuously proliferates during DG development. However, if the cell becomes quiescent state, CldU amount is maintained until adult then the cell can be double-labeled with CldU and IdU if the CldU-labeled quiescent cell starts proliferation and incorporate IdU at adult. (B) Experimental scheme of CldU and IdU injection. CldU was injected at P0, P3, P7 or P14, and then IdU was injected for 5 days at 8 weeks old. The mice were sacrificed at 3 days after last IdU injection. (C) Representative immunofluorescence images for CldU (green), IdU (red) and DAPI (blue) in the SGZ of animals injected CldU at different stages. White arrowheads indicate the CldU/IdU double-labeled cells. (D) Quantification of CldU+/IdU +cells in the SGZ [n = 3 biological replicates per group]. (E) Representative immunofluorescence images for CldU (green), IdU (red), DCX (cyan) and DAPI (blue) in the SGZ of animal injected CldU at P3. White arrowheads indicate the CldU+/IdU+/DCX + cells. (F) Quantification of CldU+/IdU+/DCX + cells in the SGZ [n = 3 biological replicates per group]. (G) Representative immunofluorescence images for CldU (green), IdU (red), DCX (cyan) and DAPI (blue) in the SGZ of control, hGFAP-Sufu-KO and hGFAP-Sufu-KO;Gli1lacZ/+ mice injected CldU at P0. White arrowheads indicate the CldU+/IdU+/DCX + cells. (H,I) Quantification of CldU+/IdU +cells (H) and CldU+/IdU+/DCX + cells (I) in the SGZ [P0 CldU: Control, n = 7; hGFAP-Sufu-KO, n = 4; hGFAP-Sufu-KO;Gli1lacZ/+, n = 6; P3 CldU: Control, n = 4; hGFAP-Sufu-KO, n = 5; hGFAP-Sufu-KO;Gli1lacZ/+, n = 3; P7 CldU: Control, n = 5; hGFAP-Sufu-KO, n = 5; hGFAP-Sufu-KO;Gli1lacZ/+, n = 4]. Values represent mean ±SEM; ns: p>0.05, *p<0.05, **p<0.01, ****p<0.0001. ANOVA with Tukey post-hoc tests.
-
Figure 6—source data 1
Extended numerical data and statistical analysis for Figure 6.
- https://doi.org/10.7554/eLife.42918.025
Figure 6—figure supplement 1
Deletion of Sufu prematurely induces the quiescent state transition.
(A) Representative immunofluorescence images for CldU (green), Sox2 (red), GFAP (cyan) and DAPI (blue) in the SGZ of animals injected CldU at different stages. White arrowheads indicate the CldU+/Sox2+/GFAP +radial NSCs. (F) Quantification of CldU+/Sox2+/GFAP +radial NSCs in the SGZ [P0 CldU: Control, n = 7; hGFAP-Sufu-KO, n = 4; hGFAP-Sufu-KO;Gli1lacZ/+, n = 7; P3 CldU: Control, n = 4; hGFAP-Sufu-KO, n = 5; hGFAP-Sufu-KO;Gli1lacZ/+, n = 3; P7 CldU: Control, n = 5; hGFAP-Sufu-KO, n = 5; hGFAP-Sufu-KO;Gli1lacZ/+, n = 4]. Values represent mean ±SEM; ns: p>0.05, *p<0.05, **p<0.01, ****p<0.0001. ANOVA with Tukey post-hoc tests.
-
Figure 6—figure supplement 1—source data 1
Extended numerical data and statistical analysis for Figure 6—figure supplement 1.
- https://doi.org/10.7554/eLife.42918.026
Figure 6—figure supplement 2

Deletion of Sufu prematurely decreases the proliferation of NSCs during DG development.
(A) Representative immunofluorescence images of Sox2 (red) and Ki67 (green) in the dorsal and ventral DG of control, hGFAP-Sufu-KO and hGFAP-Sufu-KO;Gli1lacZ/+ mice at P0. DNA is stained with DAPI (blue). d: dorsal, v: ventral, FDJ: fimbriodentate junction; SVZ: subventricular zone. (B) The bar graph indicates the ratio of Ki67 +cells to Sox2 +NSCs in DGs [Control, n = 5; hGFAP-Sufu-KO, n = 4; hGFAP-Sufu-KO;Gli1lacZ/+, n = 3]. (C) Representative immunofluorescence images of Sox2 (red) and Ki67 (green) in SGZ of control, hGFAP-Sufu-KO and hGFAP-Sufu-KO;Gli1lacZ/+ mice at P3 and P7. (D) The bar graph indicates the ratio of Ki67 +cells to Sox2 +NSCs in DGs [P3: Control, n = 4; hGFAP-Sufu-KO, n = 4; hGFAP-Sufu-KO;Gli1lacZ/+, n = 3; P7: Control, n = 8; hGFAP-Sufu-KO, n = 7; hGFAP-Sufu-KO;Gli1lacZ/+, n = 5]. Values represent mean ±SEM; ns: p>0.05, *p<0.05, ***p<0.001. ANOVA with Tukey post-hoc tests.
-
Figure 6—figure supplement 2—source data 1
Extended numerical data and statistical analysis for Figure 6—figure supplement 2.
- https://doi.org/10.7554/eLife.42918.027
Figure 7

Sufu is important for the perinatal expansion and quiescent state transition of dentate NSCs.
Schematic summary illustrating the role of Sufu and Shh signaling activity in initial production, expansion and quiescent state transition of NSCs during DG development. Long-lived NSCs are produced from Hh-responding cells in ventral hippocampus by Shh stimuli at E17.5 and migrate to dorsal and ventral DGs. This subset of NSCs expands in first postnatal week and subsequently become quiescent state. Sufu controls shh signaling activity in NSCs during DG development. Sufu deletion decreases the Shh signaling activity and leads to impaired expansion of long-lived NSC, resulting in premature quiescent state transition and small NSC pool in adult. On the other hand, complete ablation of Shh signaling activity by deleting Smo impairs initial production of long-lived NSCs at the beginning of DG development and compromises the establishment of neurogenic niche.
Author response image 1

Tables
Key resources table
| Reagent type (species) or resource | Designation | Source or reference | Identifiers | Additional information |
|---|---|---|---|---|
| Genetic reagent (M. musculus) | Sufuflox/flox | PMID: 20074523 | RRID: MGI:4840420 | Dr. Chi-Chung Hui (University of Toronto) |
| Genetic reagent (M. musculus) | hGFAP-Cre | PMID: 11668683 | RRID: MGI:2179048 | Jackson Laboratory (Stock:004600) |
| Genetic reagent (M. musculus) | Gli1CreERT2/+ | PMID: 15315762 | RRID: MGI:3053957 | Jackson Laboratory (Stock:007913) |
| Genetic reagent (M. musculus) | Gli1LacZ/+ | PMID: 12361967 | RRID: MGI:J:79392 | Jackson Laboratory (Stock:008211) |
| Genetic reagent (M. musculus) | Rosa-Ai14 | PMID: 20023653 | RRID: MGI:J:155793 | Jackson Laboratory (Stock:007908) |
| Genetic reagent (M. musculus) | SmoM2-YFP | PMID: 15107405 | RRID: MGI:3576373 | Jackson Laboratory (Stock:005130) |
| Antibody | Mouse monoclonal anti-Ki67 | BD Biosciences | RRID: AB_396287 | IHC (1:500) |
| Antibody | rabbit monoclonal anti-Sox2 | Abcam | RRID: AB_10585428 | IHC (1:250) |
| Antibody | Rabbit polyclonal anti-Tbr2 | Abcom | RRID: AB_778267 | IHC(1:250) |
| Antibody | rabbit polyclonal anti-DCX | Abcam | RRID: AB_732011 | IHC (1:1000) |
| Antibody | rat monoclonal anti-GFAP | Zymed | RRID: AB_2532994 | IHC (1:500) |
| Antibody | chickin polyclonal anti-GFAP | Millipore | RRID: AB_177521 | IHC (1:1000) |
| Antibody | rat monoclonal anti-RFP | Chromotek | RRID: AB_2336064 | IHC (1:1000) |
| Antibody | rat monoclonal anti-BrdU | Abcam | RRID: AB_305426 | IHC (1:500) CldU detection |
| Antibody | mouse monoclonalanti-BrdU | BD Biosciences | RRID: AB_400326 | IHC (1:100) IdU detection |
| Antibody | rabbit monoclonalaniti-Cleaved Caspase 3 | Cell Signaling | RRID: AB_2070042 | IHC (1:250) |
| Software | ImageJ | NIH | RRID: SCR_003070 | Cell counting |
| Software | Prism 7 | Graphpad | RRID: SCR_002798 | Statistuc analysis |
Additional files
-
Supplementary file 1
The primers for qPCR analysis.
- https://doi.org/10.7554/eLife.42918.029
-
Transparent reporting form
- https://doi.org/10.7554/eLife.42918.030
Download links
A two-part list of links to download the article, or parts of the article, in various formats.
Downloads (link to download the article as PDF)
Open citations (links to open the citations from this article in various online reference manager services)
Cite this article (links to download the citations from this article in formats compatible with various reference manager tools)
Suppressor of fused controls perinatal expansion and quiescence of future dentate adult neural stem cells
eLife 8:e42918.
https://doi.org/10.7554/eLife.42918


