Parallel pathways for sound processing and functional connectivity among layer 5 and 6 auditory corticofugal neurons
- Massachusetts Eye and Ear Infirmary, United States
- Harvard Medical School, United States
Figures
Figure 1
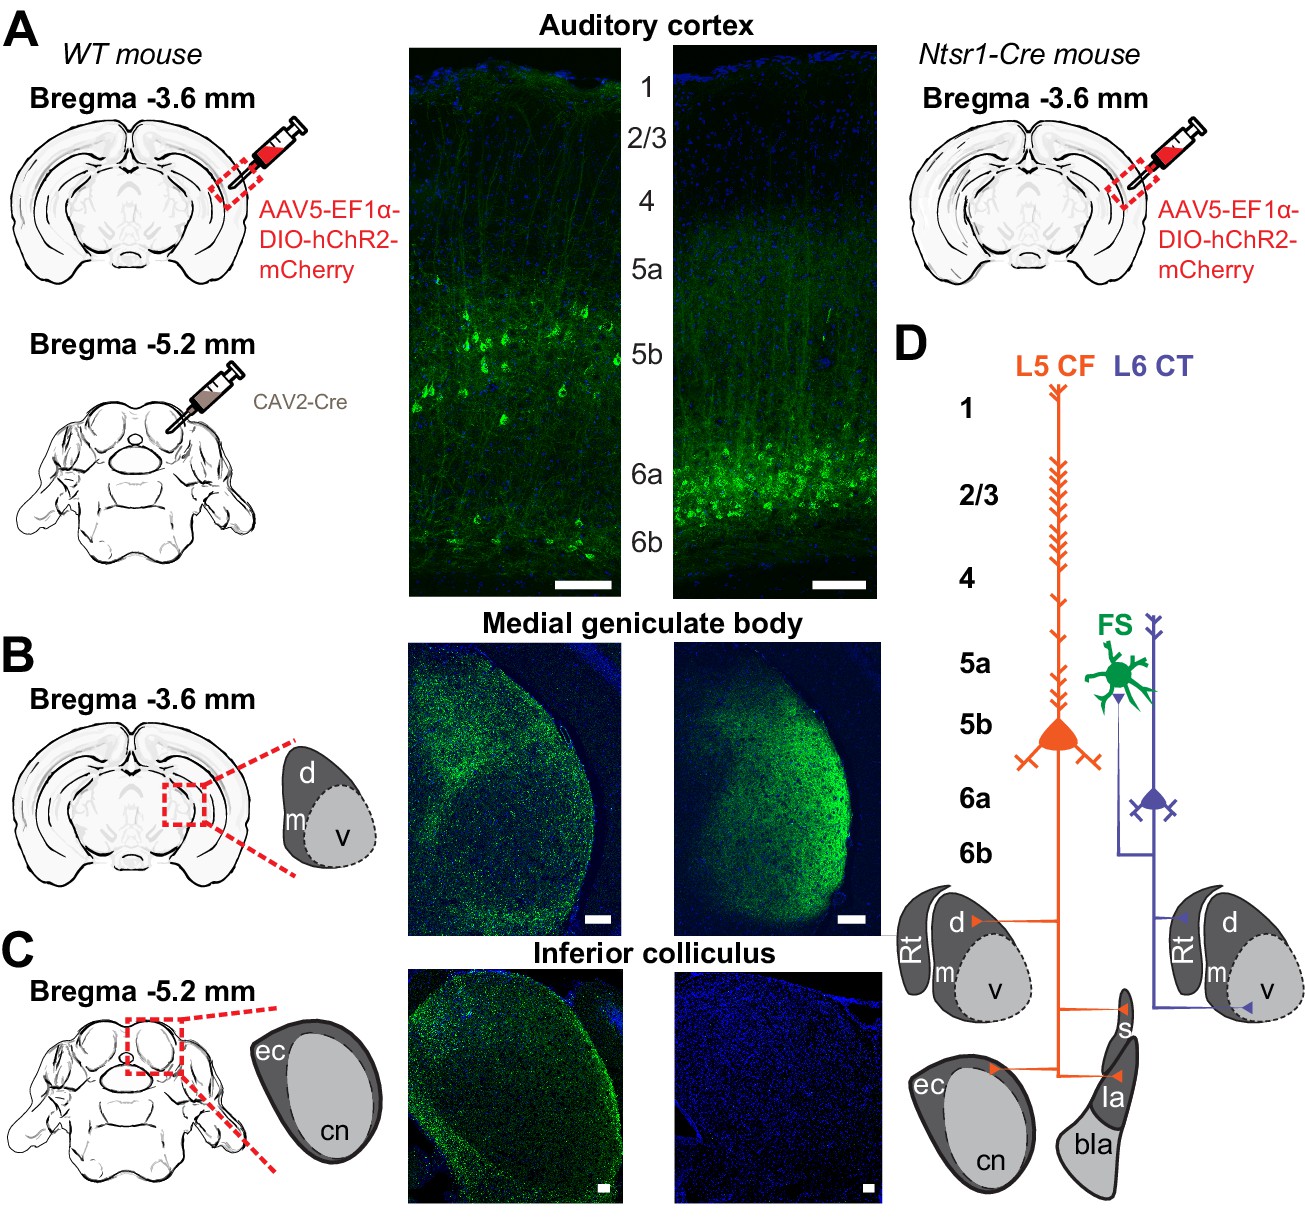
Dual corticofugal pathways from L5 and L6.
(A) Illustration of transgenic and viral strategy used to selectively label L5 neurons that project to the inferior colliculus and MGB (left) or L6 neurons that project to the MGB (right). Cell body locations and intracortical processes for CAV2-Cre- and Ntsr1-Cre-expressing ACtx neurons. (B) 20x confocal sections of the ipsilateral MGB in both L5 CF (left) and L6 CT (right) mice. The L5 projection shows strong axon labelling in the MGBd, while the L6 projection shows strong axon labelling in the MGBv. (C) 20x confocal sections of the ipsilateral IC in both L5 CF (left) and L6 CT (right). The L5 projection shows strong axon labelling in the external cortex of the IC, while the L6 projection shows none. (D) Schematic of dual corticothalamic projection pathways from the ACtx. Abbreviations: d = MGBd, m = MGBm, v = MGBv, Rt = Thalamic Reticular Nucleus, ec = External Cortex, cn = Central Nucleus, s = Striatum, la = Lateral Amygdala, bla = Basolateral Amygdala. Scale bars = 100 μm.
Figure 2 with 2 supplements
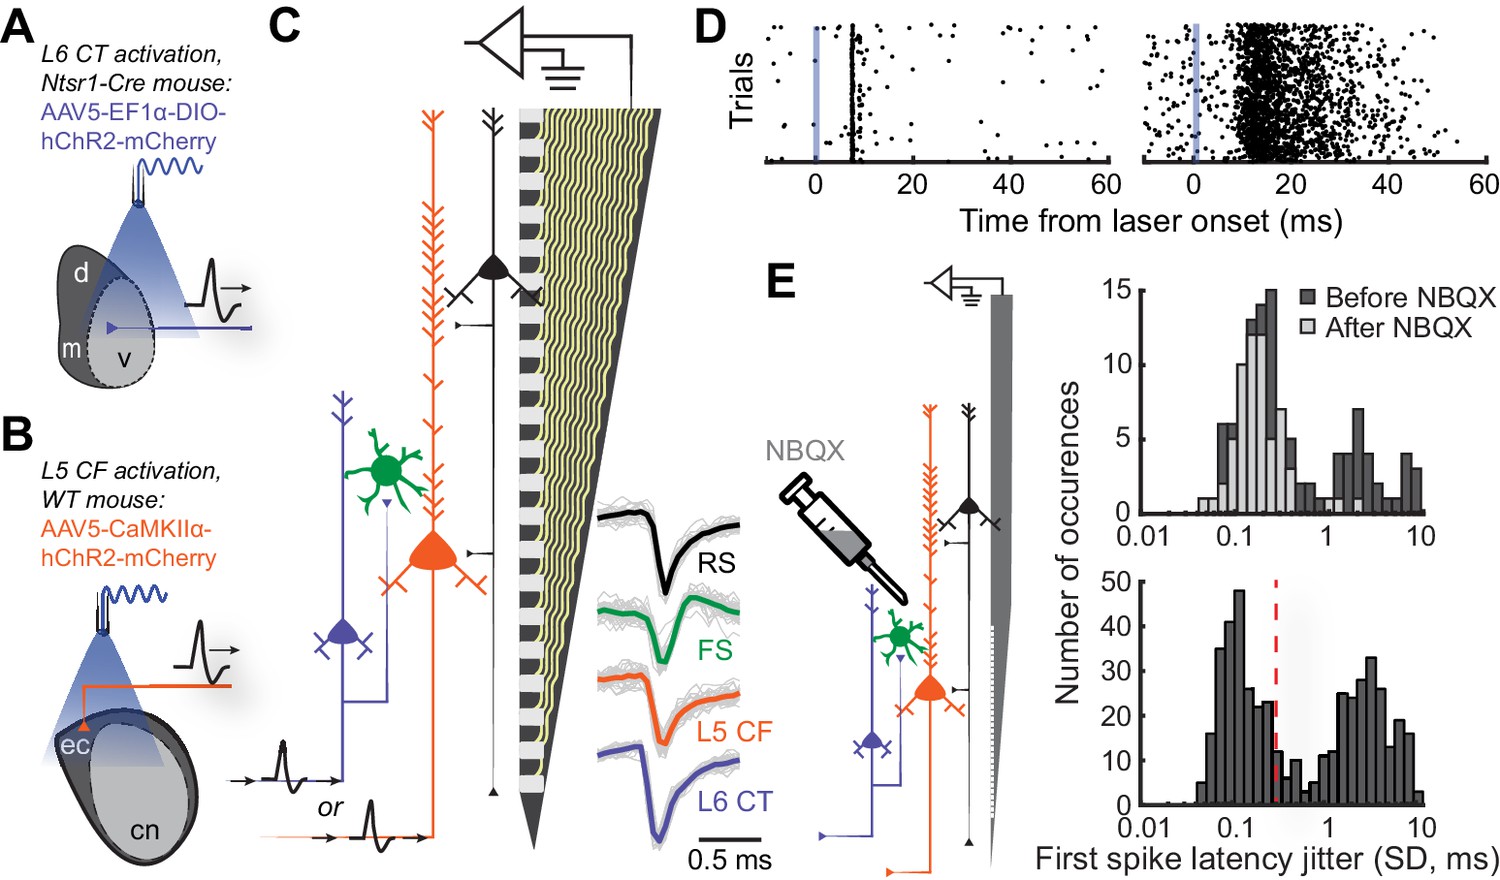
Antidromic phototagging of ACtx corticofugal projection neurons.
(A) Illustration of the strategy to activate neurons in ACtx L6 that project to the MGB (L6 CT). (B) Illustration of optogenetic approach to isolate L5 ACtx neurons with axons that innervate the IC and MGB (L5 CF). (C) Schematic of the 32-channel silicon edge probe with 20 μm inter-contact spacing used for extracellular recording, alongside four major neuron classes. Example mean spike waveforms (thick lines) are shown with individual waveforms (thin lines). (D) Example unit spike rasters of low- and high-jitter antidromic activity (left and right, respectively). (E) Illustration of the strategy used to block local synaptic transmission with NBQX (left). First-spike latency jitter histograms from anesthetized pharmacology experiments (top), and awake experiments showing the 0.3 SD cutoff for identifying directly activated cells (bottom).
-
Figure 2—source data 1
Source data for Figure 2.
- https://doi.org/10.7554/eLife.42974.006
Figure 2—figure supplement 1

Classifying ACtx neuron identity.
(A) Four noise-evoked current source density plots (CSD) from recordings at different cortical depths. The CSD’s have been positioned to resemble the global CSD patterning of sinks and sources over the entire cortical column. Black horizontal line depicts timing of a 50 ms noise burst. White arrow depicts the location of the earliest sink, used to approximate the transition between ACtx L4 and 5. (B) Three exemplar CSDs recorded from different mice. The 32-channel probe spans 610 μm and primarily covers ACtx L5 and 6. (C) Histogram of spike waveform peak-to-trough delay values. Dashed vertical lines depict cutoffs used to classify units as RS (peak-to-trough delay <0.5 ms) or FS (peak-to-trough delay >0.6 ms). (D) Each recorded neuron was assigned an approximate layer based on the pattern of sinks and sources in the CSD. (E) Three exemplar log interspike-interval distributions illustrating three different skewness values. (F) Histogram of log interspike-interval histogram skewness values. Histograms that include the presence of burst events tend to lie on the left side of the distribution.
Figure 2—figure supplement 2
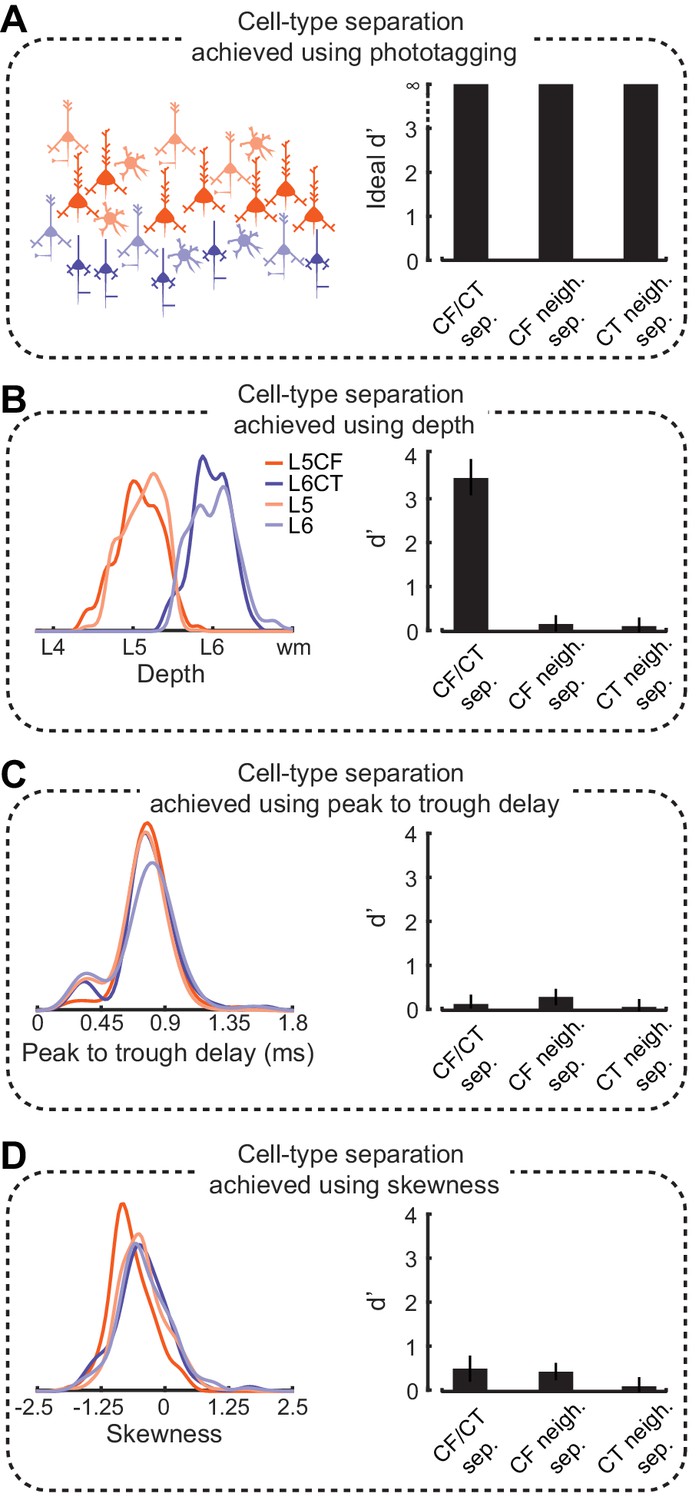
Cell-type separation achieved using measured parameters
(A) A schematic showing the idealized separation between phototagged CF or CT neurons and their local neighborhoods (left). Bars represent an ideal d’ of ∞, since knowledge of the indivisible cell-class will unambiguously separate it from all other cells (right). (B) Distributions of depth for all neural populations (left). (C) Distributions of peak-to-trough delay for all neural populations (left). (D) Distributions of skewness for all neural populations (left). All bars represent d’ values between both cell-types, and each cell-type and their local neighborhood. Error bars are bootstrapped 95% confidence intervals.
Figure 3 with 1 supplement
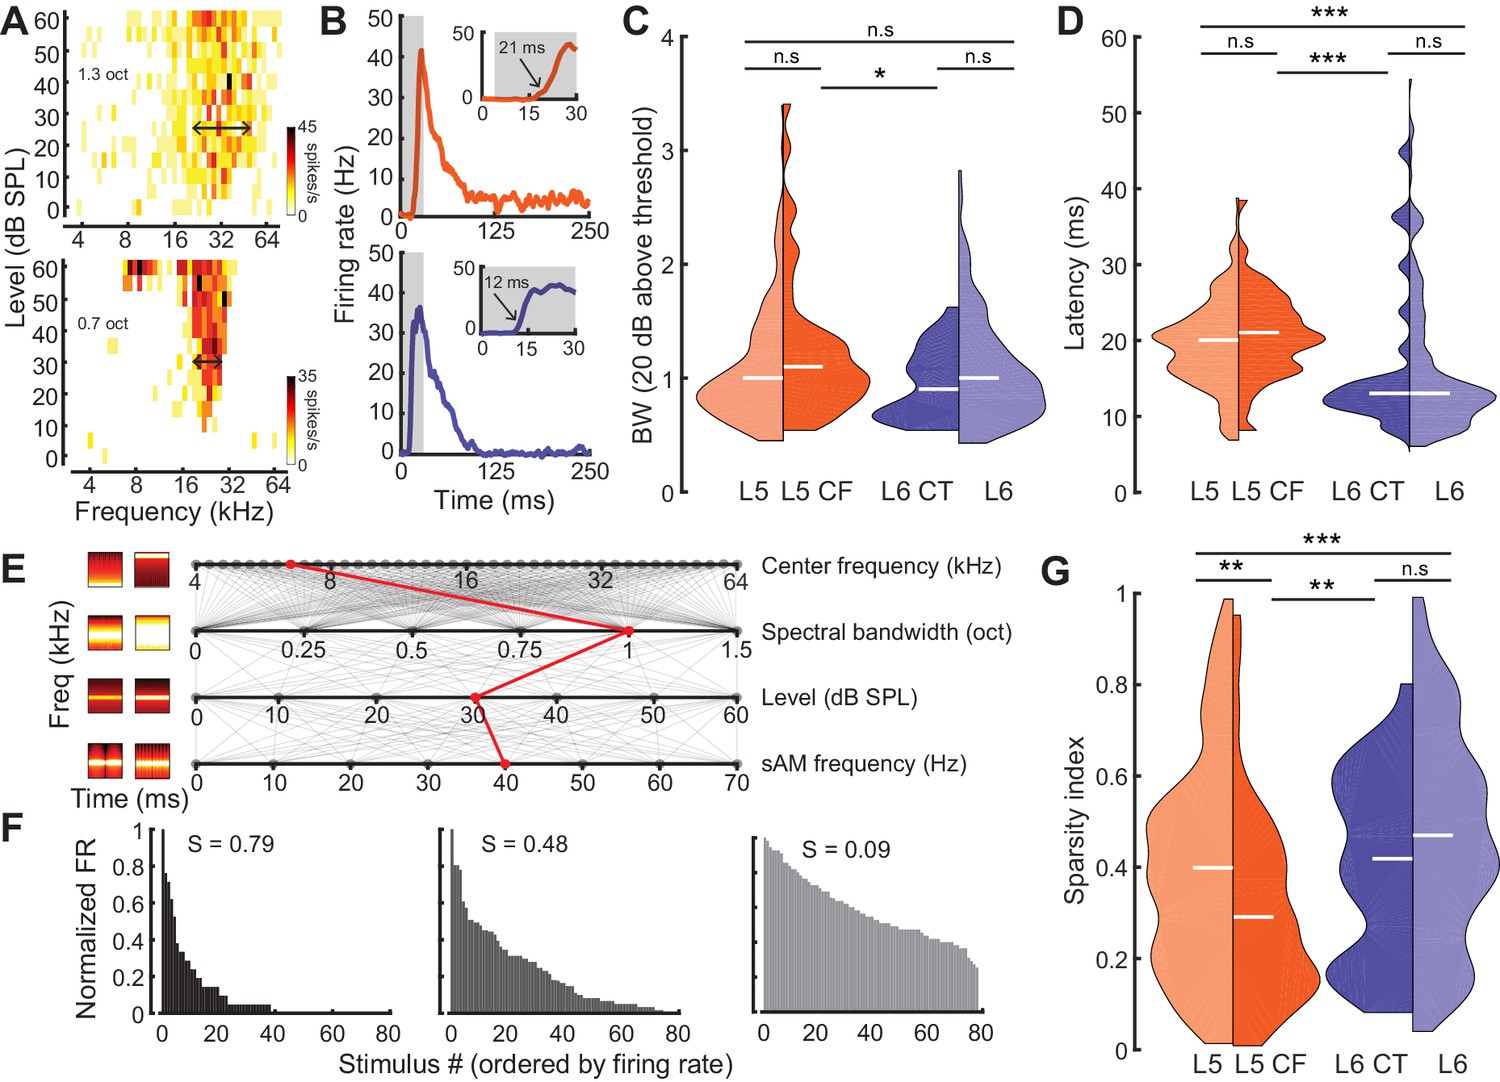
Sensory characterization of CF/CT projections.
(A) Example FRAs from a broadly-tuned L5 CF neuron (top) and a narrowly tuned L6 CT neuron (bottom). (B) Example PSTHs from a long-latency L5 CF neuron (top) and a short-latency L6 CT neuron (bottom). (C) Split-violin plots showing the FRA bandwidth distributions. White horizontal line represents the median. (D) Tone-evoked latency distributions. (E) Spectrotemporally modulated noise burst tokens varied across four acoustic dimensions: Center frequency, spectral bandwidth, level, and sinusoidal amplitude modulation (sAM) frequency, represented here from top to bottom. Frequency x time stimulus spectrograms depict a lower (left) and higher (right) value for each corresponding acoustic parameter. Red line indicates an example of stimulus values used for a single trial. (F) Example histograms for firing rate across the same 80 randomly selected spectrotemporal noise burst tokens. High sparsity values (S) indicate a narrow distribution with enhanced stimulus selectivity (left) while low sparsity values indicate a broad distribution with reduced stimulus selectivity (right). (G) Split-violin plots showing the sparsity distributions. Asterisks denote statistically significant differences at the following levels: *p<0.05, **p<0.01, ***p<0.005, as determined by the Wilcoxon Rank Sum test.
-
Figure 3—source data 3
Source data for Figure 3.
- https://doi.org/10.7554/eLife.42974.009
Figure 3—figure supplement 1
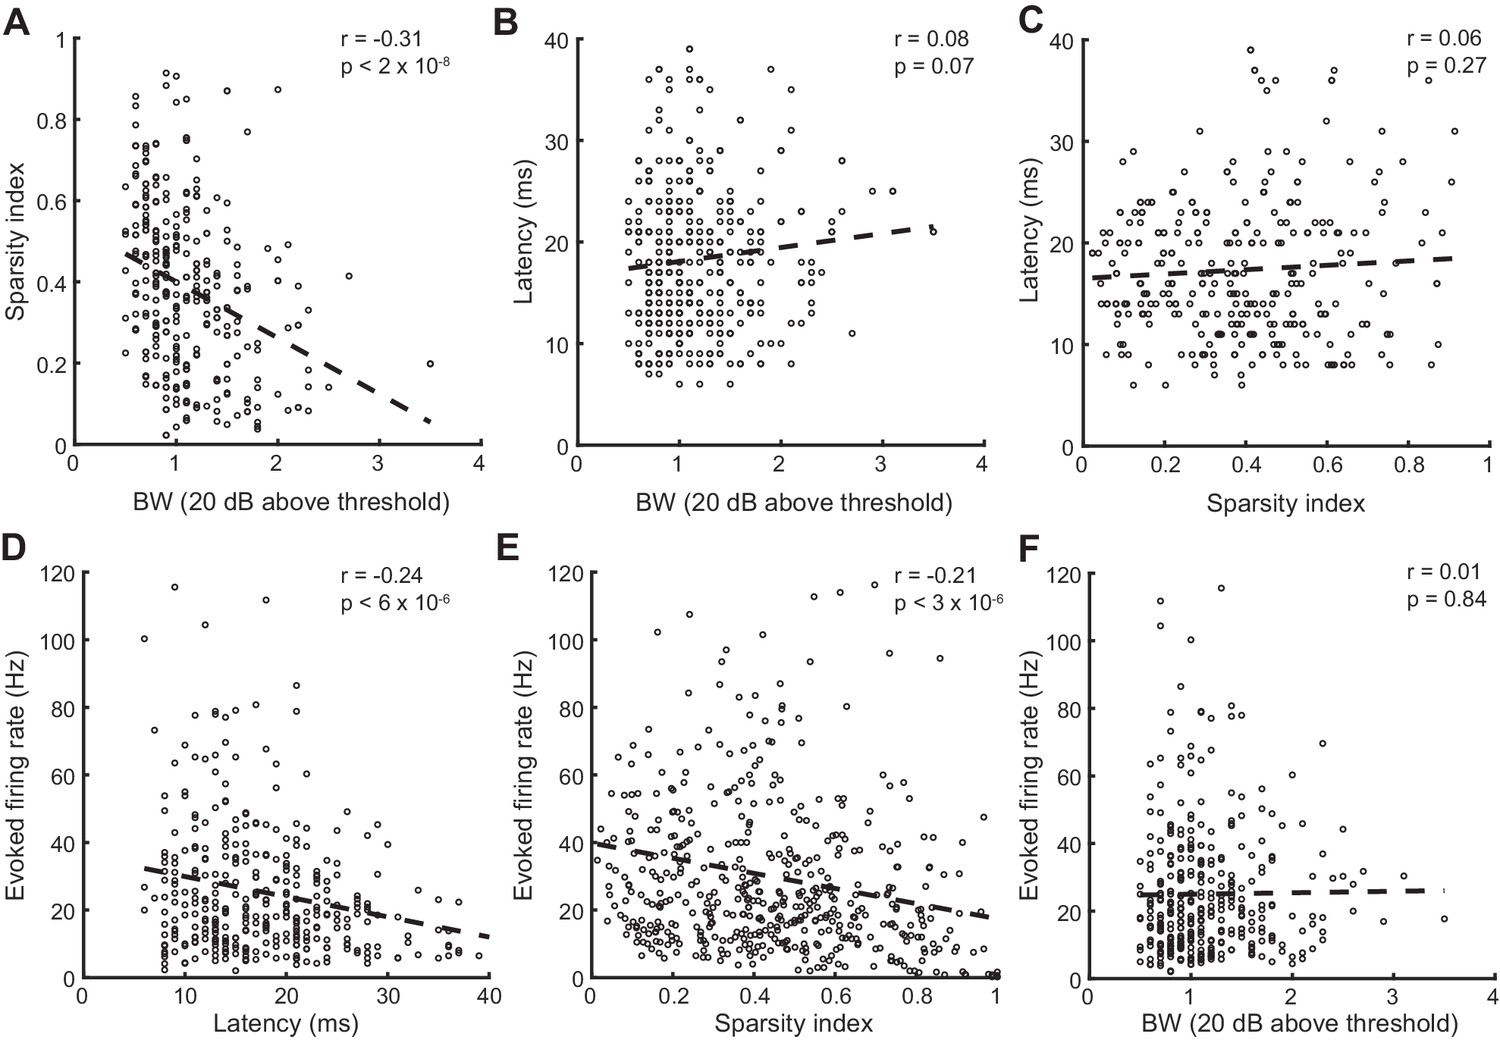
Correlations between sensory tuning parameters and evoked firing rates.
(A) Significant correlation between sparsity and bandwidth parameters. Dotted line represents a linear fit to the data. (B) No significant correlation between latency and bandwidth. (C) No significant correlation between latency and sparsity. (D) Significant correlation between latency and evoked firing rate. (E) Significant correlation between sparsity and evoked firing rate. (F) No correlation between bandwidth and evoked firing rate.
Figure 4
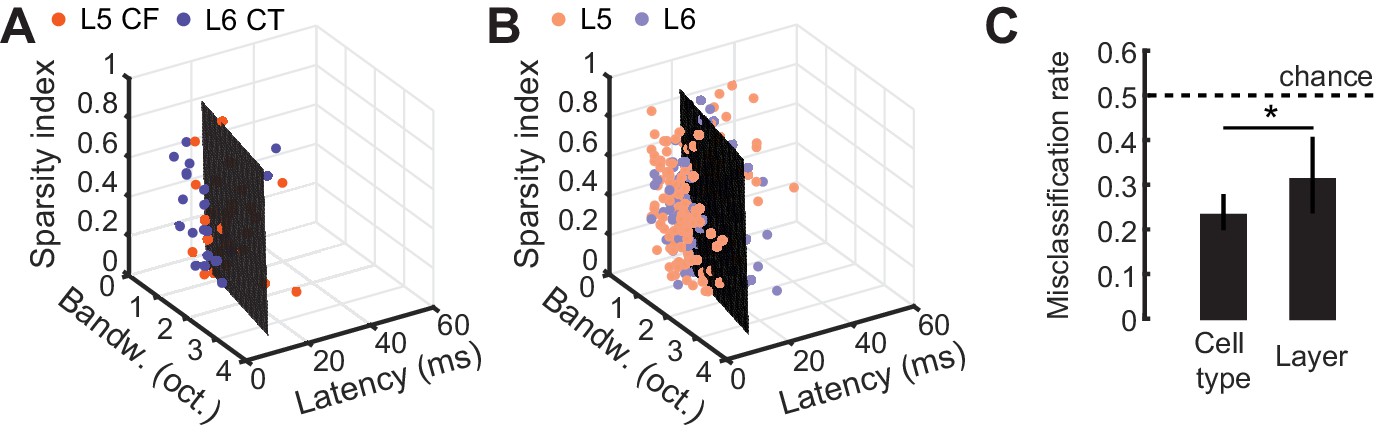
Predicting cell-type and layer from neural tuning parameters.
(A) Scatter plot of tuning parameters for both CF/CT cell-types, with the optimal SVM hyperplane. (B) Scatter plot of tuning parameters for L5/L6 cell-types, with the optimal SVM hyperplane. (C) Mean (±95% bootstrapped CI) misclassification rates for cross-validated SVM fits to either cell-type or layer. Dotted line is chance, at 0.5. Asterisk denotes a statistically significant difference at p<0.05.
-
Figure 4—source data 1
Source data for Figure 4.
- https://doi.org/10.7554/eLife.42974.011
Figure 5 with 1 supplement
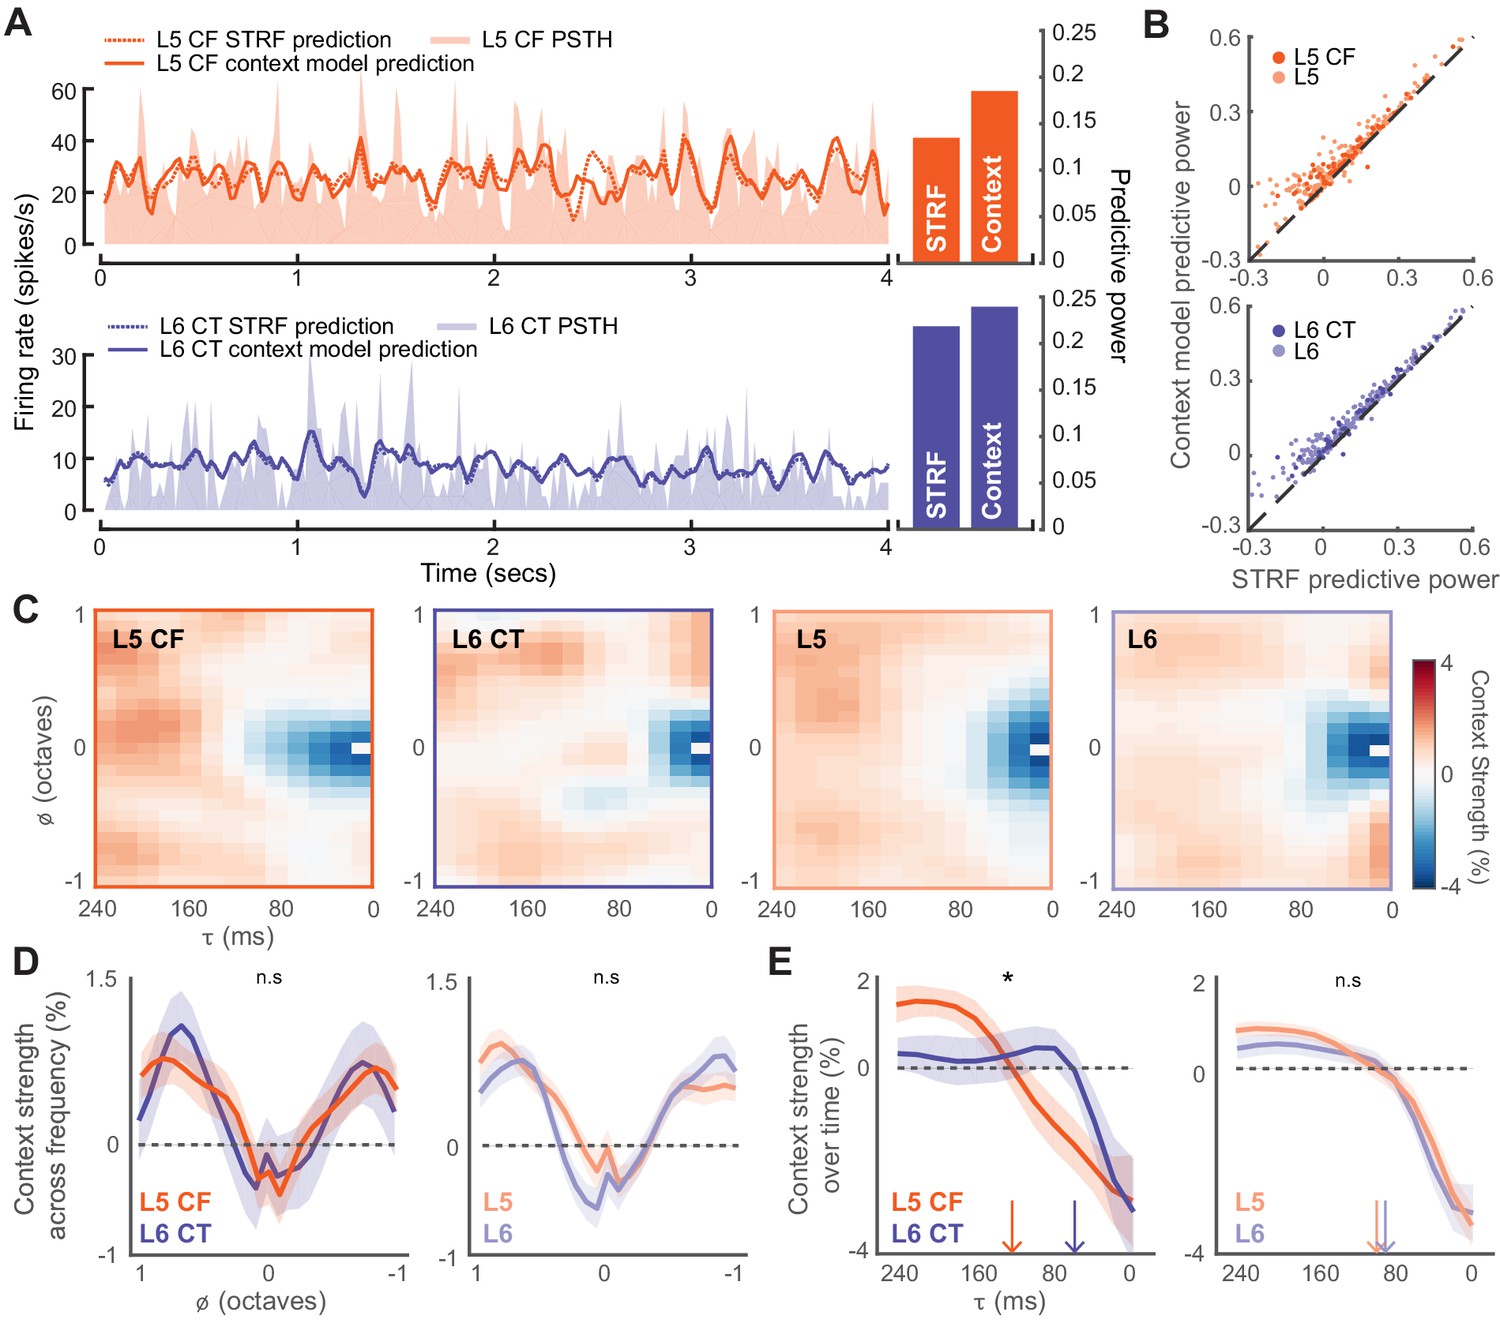
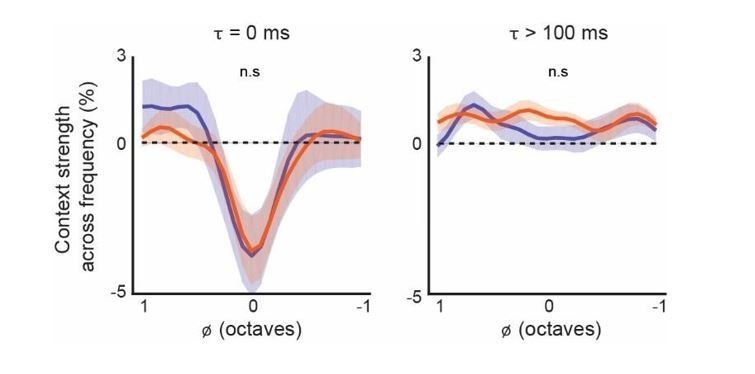
Modeling the stimulus-response function of L5 and L6 neurons.
(A) Snippets of DRC-evoked neural activity with corresponding model predictions for an example L5 CF (top) and L6 CT neuron (bottom). Predictive powers for the model fits are shown on the right. (B) Scatter plots showing the relation between STRF and context model predictive powers for all recorded units. (C) Mean contextual gain fields (CGF) for CF/CT and L5/L6 neurons. (D) Mean (±1 SEM) of an average across for CF/CTs (left) and layers (right). (E) Mean (±1 SEM) of an average across a range of (between ± 0.25 octaves) for CF/CTs (left) and layers (right). Vertical arrows depict the extent of the suppressive timescale (the point at which the function crosses zero). Asterisk denotes a statistically significant difference at p<0.05, as determined by a mixed-effect ANOVA.
-
Figure 5—source data 1
Source data for Figure 5.
- https://doi.org/10.7554/eLife.42974.014
Figure 5—figure supplement 1
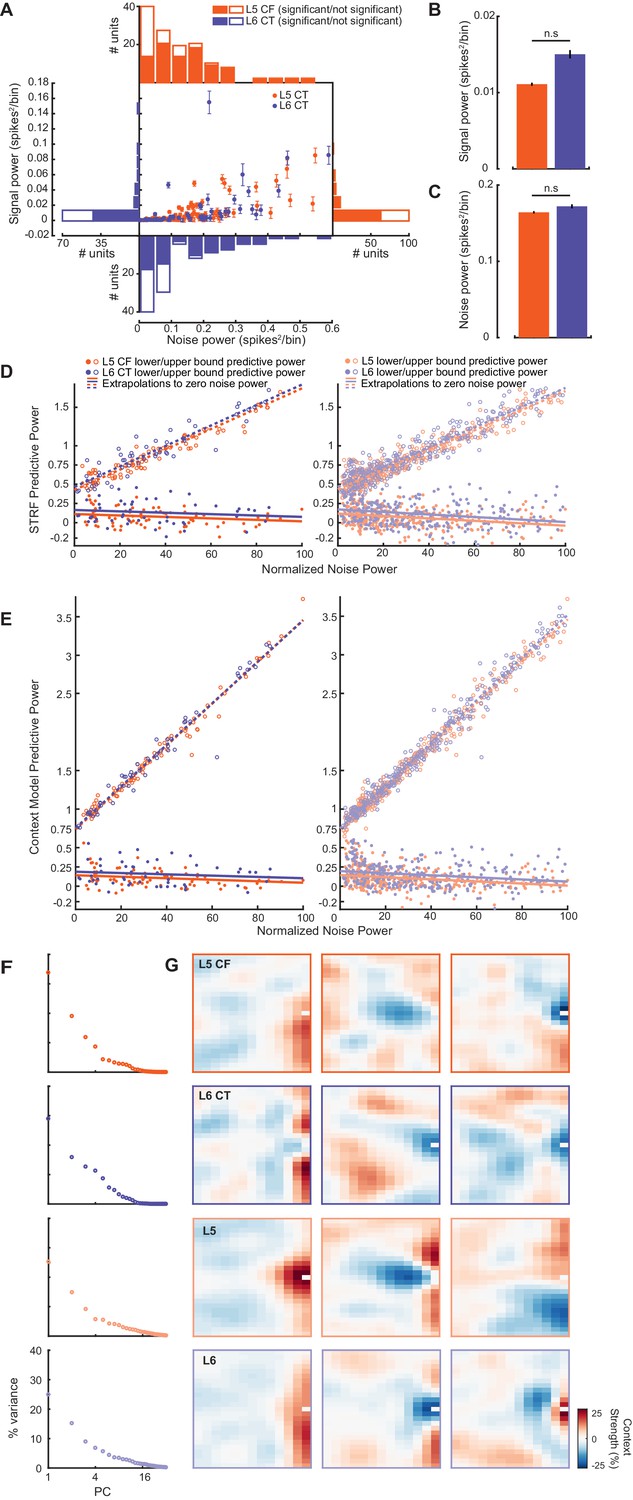
Further quantification of stimulus-evoked variability, model evaluation, and CGF structure.
(A) Scatter plot of signal and noise powers for CF/CT neurons. Histograms show the marginal distributions along the corresponding axes. Filled/non-filled bars represent neurons that had signal powers significantly greater than 0. (B) Mean (±1 SEM) signal powers. (C) Mean (±1 SEM) noise powers. (D): Upper/lower bound STRF (left) and CGF (right) predictive powers plotted as a function of normalized noise power for CF/CT cell-types. Dotted/filled lines represent upper/lower bound extrapolations to the zero-noise condition. (E) Upper/lower bound STRF (left) and CGF (right) predictive powers plotted as a function of normalized noise power for L5/L6 cell-types. Dotted/filled lines represent upper/lower bound extrapolations to the zero-noise condition. (F) The absolute variance captured by each of the first 32 principal components, from a PCA analysis on the CGF populations. In each case, the first two or three principal components account for a large proportion of the variance. (G) The three leading principal components (ordered left to right) for each CGF population. In all cases, the first two principal components indicate the primary sources of variability to be modulation of both delayed suppression, and facilitation of tones at short delays and nearby frequencies.
Figure 6
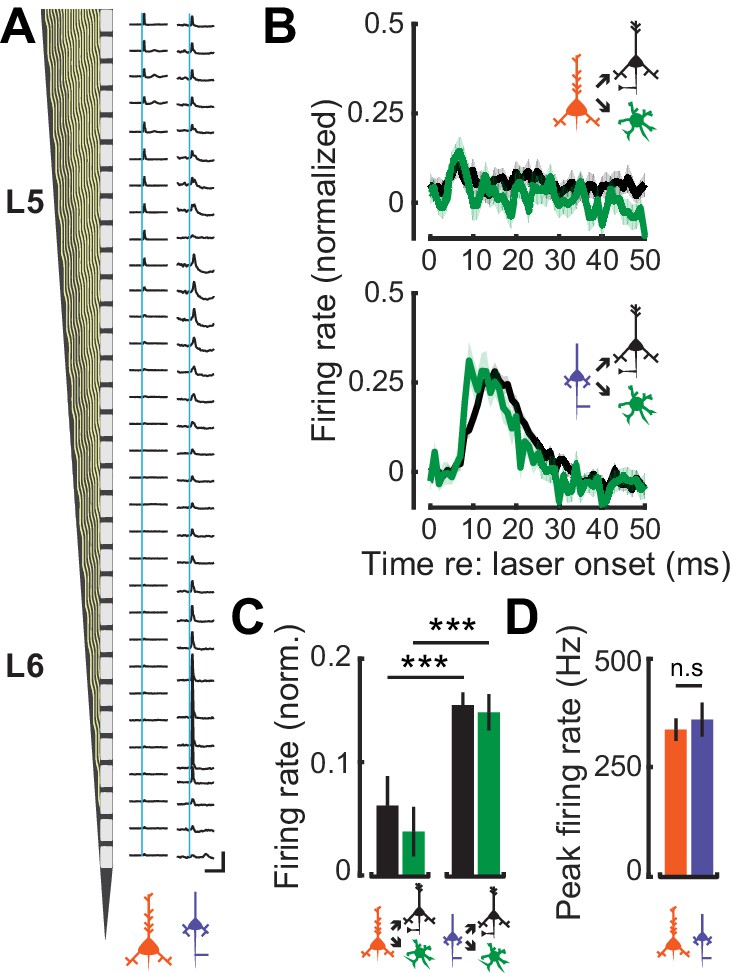
Feedforward connectivity within deep-layer cortical networks.
(A) Schematic of the 32-channel recording probe alongside PSTHs corresponding to each recording site. A 1 ms laser pulse (vertical blue lines) to the axon terminals for L5 CF (left) and L6 CT (right) recruits different patterns of spiking activity in representative deep layer recordings. Vertical scale bar = 200 sp/s; horizontal scale bar = 125 ms. (B) Mean (±1 SEM) population normalized PSTHs for both RS and FS groups in response to either L5 CF activation (top) or L6 CT activation (bottom). (C) Mean (±1 SEM) normalized firing rates in local RS and FS units, from the 5–25 ms epoch of the PSTHs shown in B. (D) Mean (±1 SEM) peak firing rates in L5 CF and L6 CT units. Asterisks denote statistically significant differences at p<0.005, as determined by the Wilcoxon Rank Sum test.
-
Figure 6—source data 1
Source data for Figure 6.
- https://doi.org/10.7554/eLife.42974.016
Figure 7
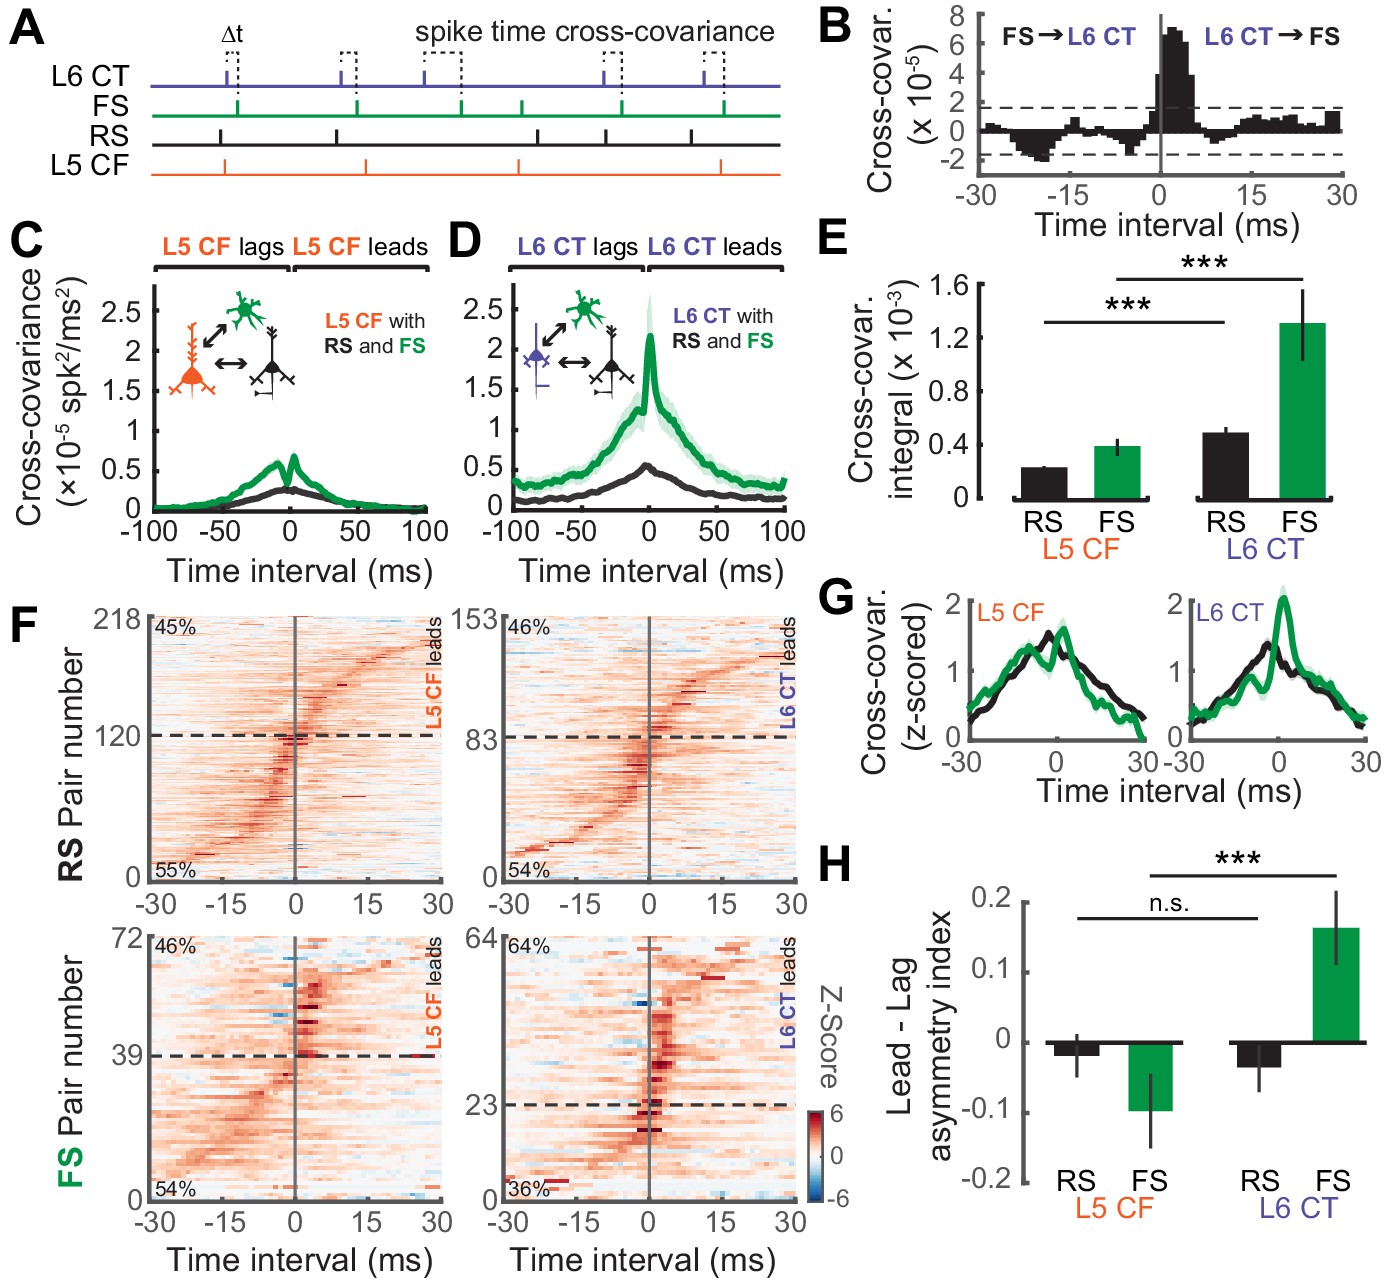
Temporal interactions within deep-layer cortical networks.
(A) Schematic illustrating the four recorded cell-types and the cross-covariance approach. (B) An example cross-covariance function highlighting the temporal interaction between a L6 CT↔FS pair. (C–D) Mean (±1 SEM) cross-covariance functions of L5 CF (C) and L6 CT (D) neurons with RS and FS neuron types. (E) Mean (±1 SEM) numerical integral of the cross-covariance functions in D-E. (F) Significant cross-covariance functions were z-scored and sorted by peak timing. The proportion of pairs where the CF/CT neuron either leads or lags are denoted in the top-left or bottom-left corners, respectively. Dashed horizontal line indicates the separation between leading and lagging pairs. Pairs with a peak at 0 ms were excluded for visualization purposes. Color scale bar denotes the z-scored cross-covariance. (G) Marginal distributions of the z-scored cross-covariance functions shown in F. (H) Mean (±1 SEM) asymmetry indexes between the positive and negative regions of the cross-covariance functions shown in F, where a value of 0 indicates equivalent regions of leading and lagging cross-covariance, negative values indicate a bias towards CF/CT lagging spike times, and positive values indicate a bias towards CF/CT leading spike times. Asterisks denote statistically significant differences at p<0.005, as determined by the Wilcoxon Rank Sum test.
-
Figure 7—source data 1
Source data for Figure 7.
- https://doi.org/10.7554/eLife.42974.018
Author response image 1
Additional files
-
Supplementary file 1
Supplemental tables detailing sample sizes, parameter values, and firing rates.
Supplemental Table S1. Summary table detailing sample sizes and parameter values for all sensory characterization comparisons (Figures 3–5). Supplemental Table S2. Summary table detailing sample sizes for all connectivity comparisons (Figures 6–7). Supplemental Table S3. Summary table detailing firing rates evoked by all presented stimuli.
- https://doi.org/10.7554/eLife.42974.019
-
Transparent reporting form
- https://doi.org/10.7554/eLife.42974.020
Download links
A two-part list of links to download the article, or parts of the article, in various formats.
Downloads (link to download the article as PDF)
Open citations (links to open the citations from this article in various online reference manager services)
Cite this article (links to download the citations from this article in formats compatible with various reference manager tools)
Parallel pathways for sound processing and functional connectivity among layer 5 and 6 auditory corticofugal neurons
eLife 8:e42974.
https://doi.org/10.7554/eLife.42974


