Haplotypes spanning centromeric regions reveal persistence of large blocks of archaic DNA
- University of California, Berkeley, United States
- Lawrence Berkeley National Laboratory, United States
- University of California, Santa Cruz, United States
- University of California, Davis, United States
Figures
Figure 1 with 2 supplements
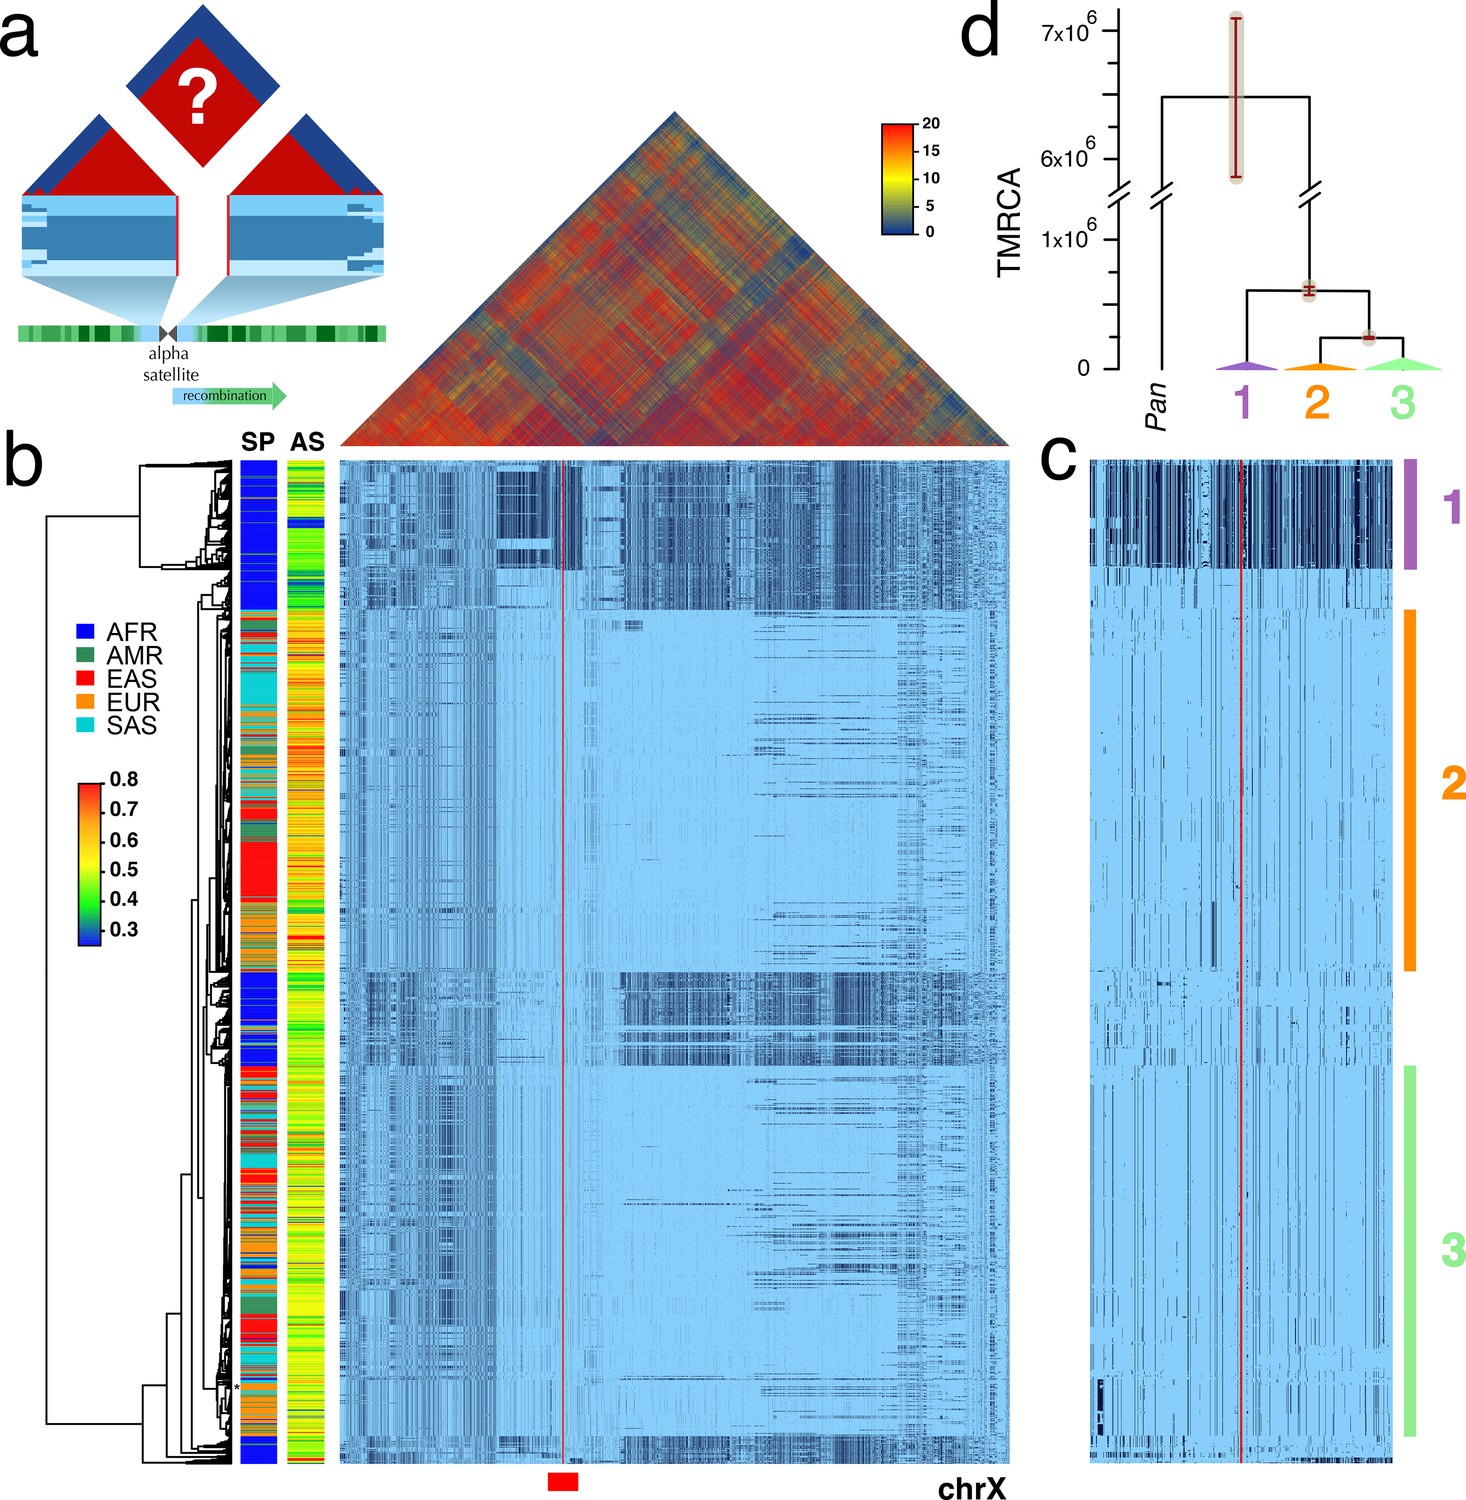
Strong LD across centromeric gaps forms large-scale centromere-spanning haplotypes, or cenhaps.
A full resolution version of this figure is available as Figure 1—source data 2. (a) The predicted patterns of the magnitude of linkage disequilibrium (LD) (triangle at top) for a Centromere Proximal Region (CPR) in a metacentric human chromosome (bottom) in a large outbreeding population. Central blue bands represent clustered haplotypes expected if crossing-over declines to zero in and around the highly repeated α-satellite DNA (central assembly gap) and the SNP-rich flanking regions (light blue). (b) Triangle (top) shows the LD between pairs of 17702 SNPs (Left: chrX:55623011–58563685, Right: chrX:61725513–68381787; hg19) flanking the centromere and α-satellite assembly gap (red vertical line) from 1231 human male X chromosomes from the 1000 Genomes Project. The color maps (see adjacent legend) to the -log10(p) where the p value derives from the 2×2 χ2 for independence of alleles at each pair of SNPs. Below, a broad haplotypic representation of these same data. SNPs were filtered for minor allele count (MAC) ≥ 60, but not by 4gt_dco. Minor alleles shown in black. Poorly genotyped SNPs near edges of the gap (red line) were masked. Superpopulation (SP; AFRica, AMeRicas, East ASia, EURope, South ASia) and scaled estimate of chrX-specific α-satellite array size (AS) indicated at left side. Approximate position of HuRef chrX indicated by black asterisk at right of the tree. Dendrogram represents UPGMA clustering based on the hamming distance between haplotypes comprised of 800 filtered SNPs immediately flanking the centromere (Left: chrX:58374895–58563685, Right: chrX:61725513–61921419; hg19), indicated by red bar at bottom and shown in detail in c. The three most common X cenhaps are highlighted with colored vertical bars. (d) A UPGMA tree based on the synonymous divergence in 21 genes (see Figure 1—source data 1) in the three major chrX cenhaps (indicated in c), assuming the TMRCA of humans and chimps is 6.5MY. The bars at each node represent ±two standard deviations of distributions of estimated TMRCAs across the genes. Widths of the triangles are proportional to the log10 of number of members of each cenhap, and the height is proportional to the average divergence within each cenhap.
-
Figure 1—source data 1
The 21 chrX coding genes in the CPR (8 left and 13 right of the centromere gap) used in the UPGMA clustering and estimation of TMRCAs.
Gene models and alignments from Ensembl release 92 (April 2018). Numbers of sites divergent (human-chimp): div_sites. Numbers of sites polymorphic: polym_sites. Average nonsynomymous divergence: nonsyn_div. Average synonymous divergence: syn_div. Average nonsynonymous diversity: nonsyn_π. Average synonymous diversity: syn_π.
- https://doi.org/10.7554/eLife.42989.007
-
Figure 1—source data 2
Full resolution version of Figure 1.
- https://doi.org/10.7554/eLife.42989.008
Figure 1—figure supplement 1
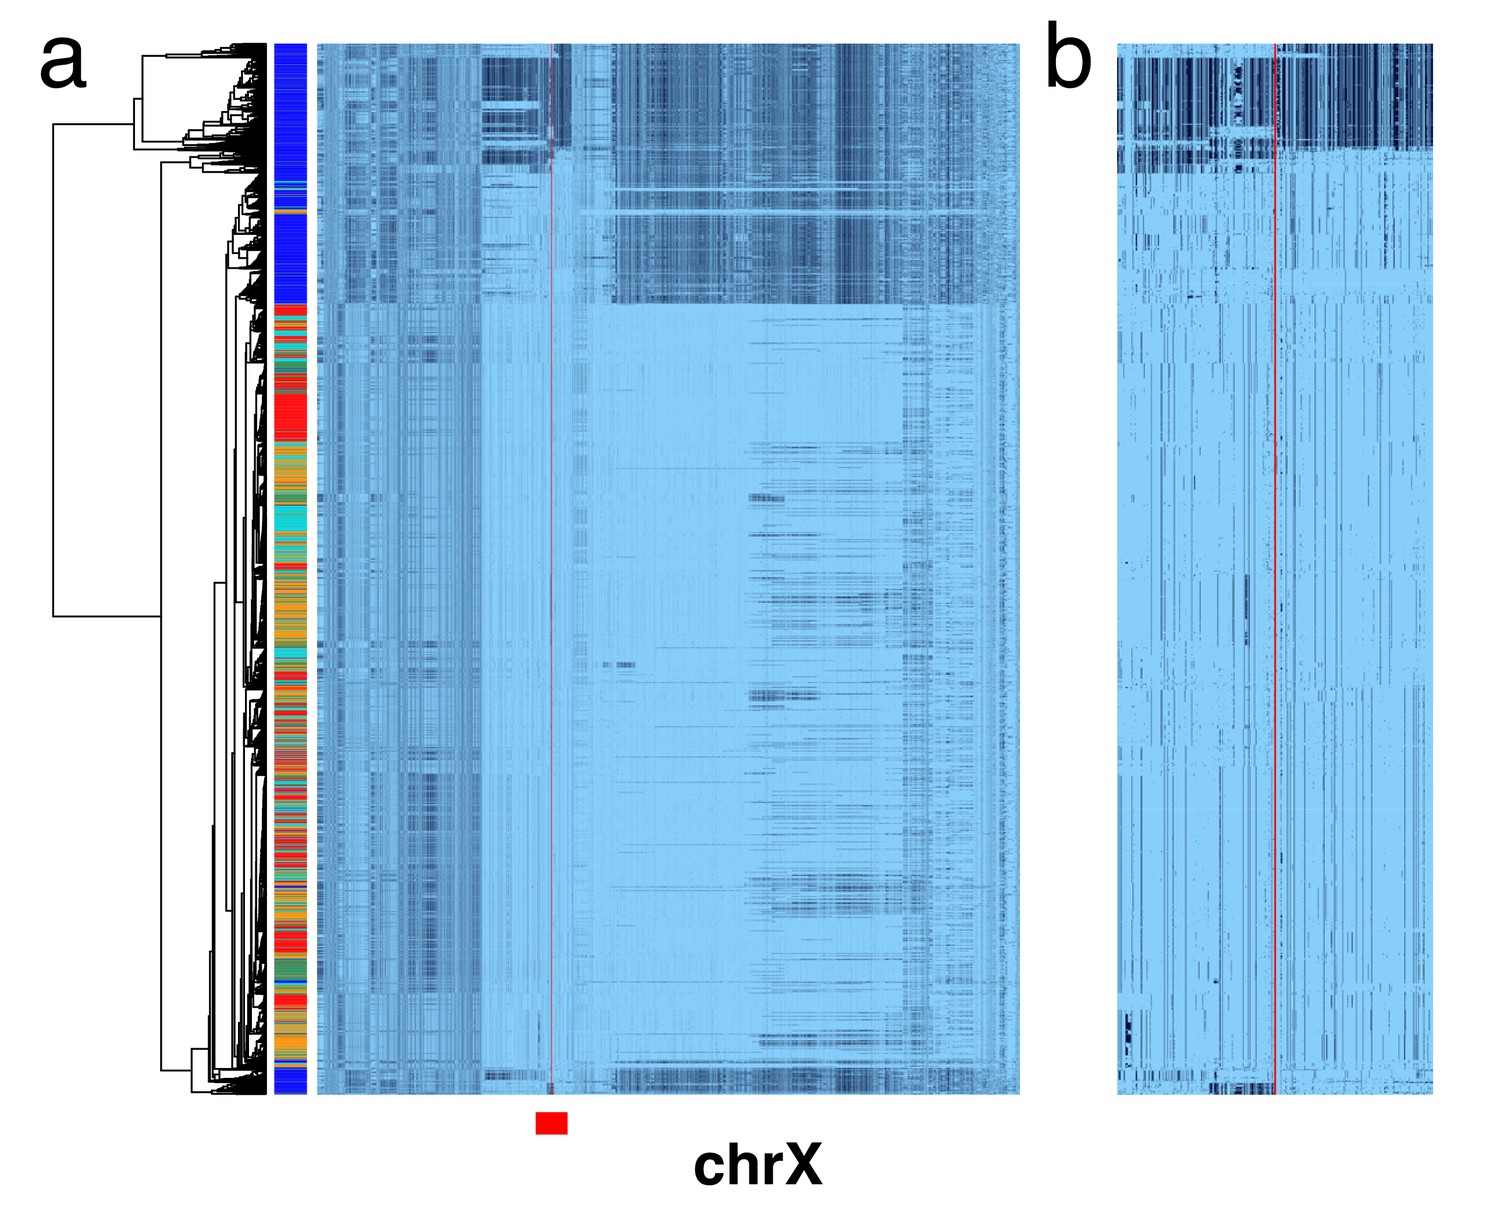
X chromosome cenhaps from phased female data align with those from haploid males.
A full resolution version of this figure is available as Figure 1—figure supplement 1—source data 1. (a) Haplotypic representation of 17702 SNPs flanking the gap in the assembly where the centromere typically forms (Left: chrX:55623011–58563685, Right: chrX:61725513–68381787; hg19) in 2542 phased human female X chromosomes (1271 individuals) from the 1000 Genomes Project. SNPs were filtered for minor allele count (MAC) ≥ 60. Minor alleles shown in black. The assembly gap is indicated by the red line. Poorly genotyped SNPs near edges of the gap were masked (see Materials and methods). Superpopulation (SP; AFRica, AMeRicas, East ASia, EURope, South ASia) is indicated on the left side. Tree represents UPGMA clustering based on the hamming distance for haplotypes comprised of 800 SNPs immediately flanking the centromere, indicated by red bar at bottom and shown in detail in b.
-
Figure 1—figure supplement 1—source data 1
Full resolution version of Figure 1—figure supplement 1.
- https://doi.org/10.7554/eLife.42989.004
Figure 1—figure supplement 2
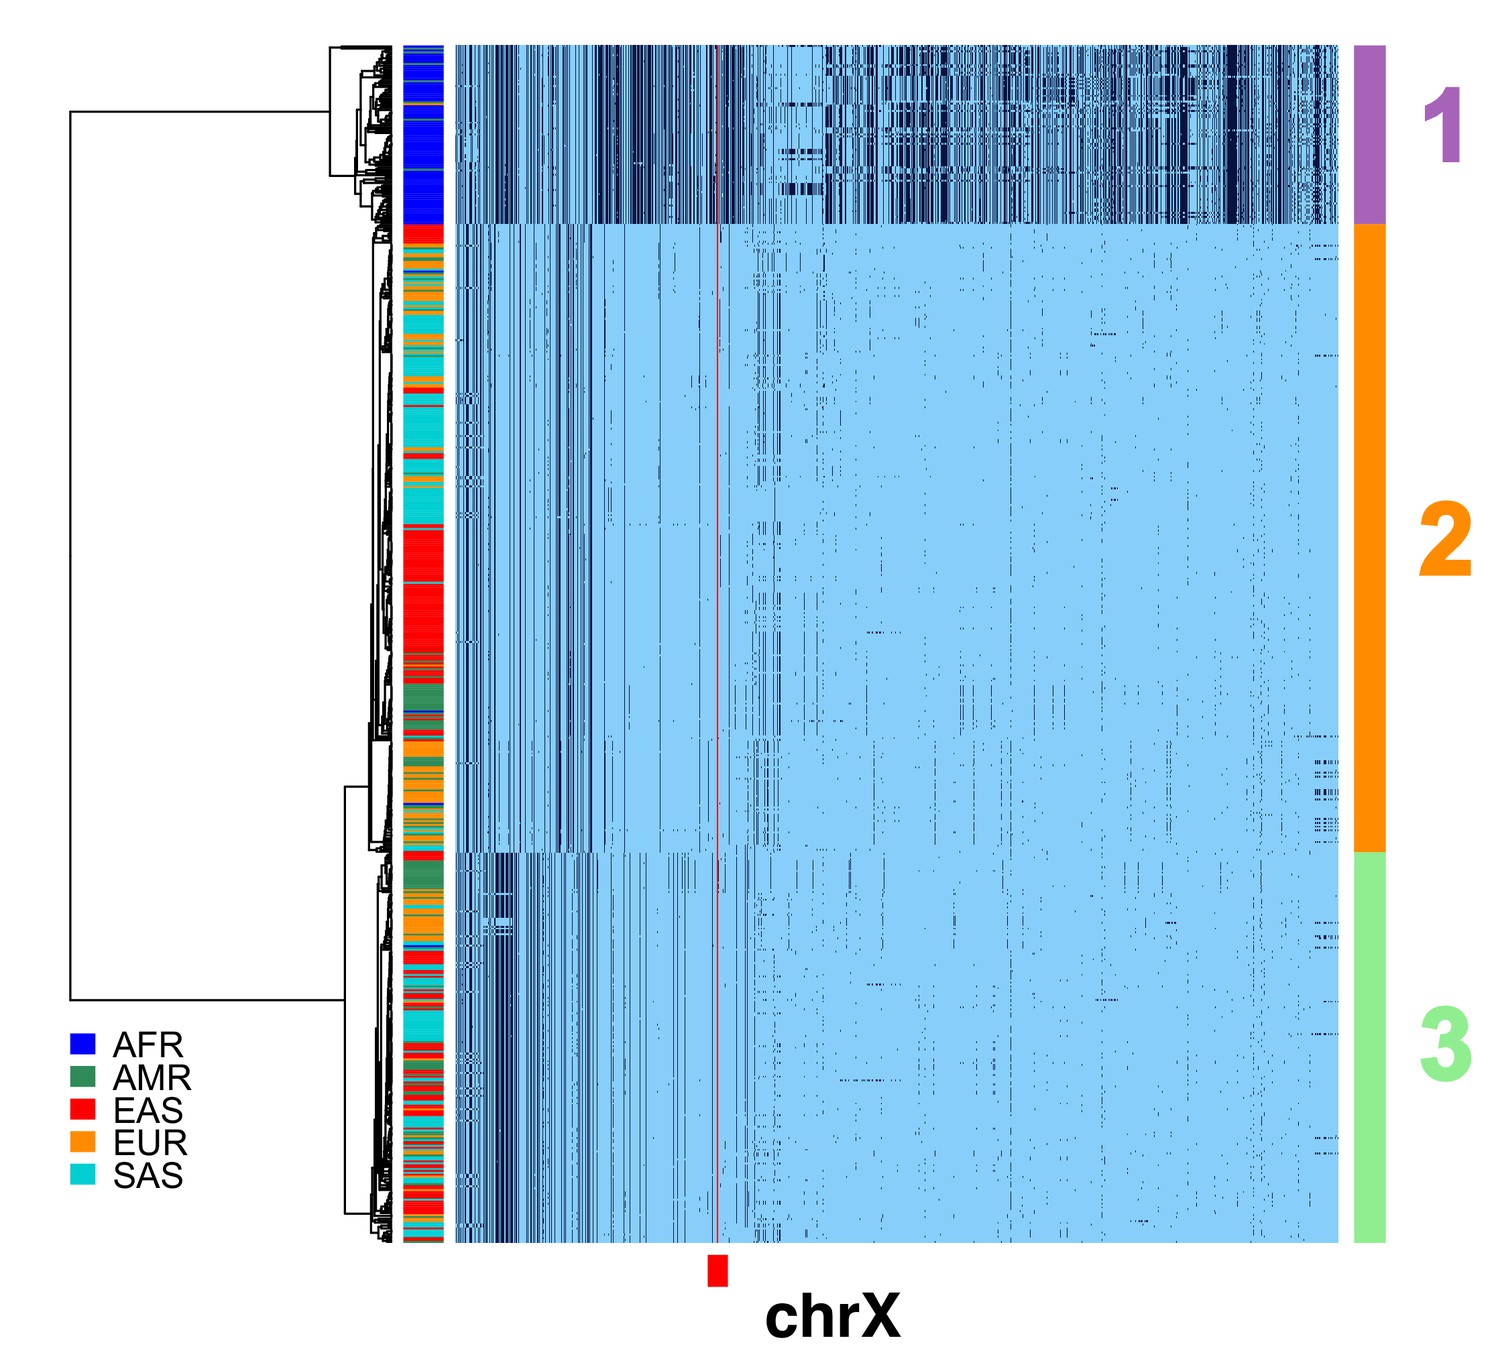
Filtering of chrX CPR recombinants for CDS divergence, expected heterozygosity and TMRCAs.
A full resolution version of this figure is available as Figure 1—figure supplement 2—source data 1. To more reliably infer the average divergence in the CDSs in the region, the male X chromosome haplotypes in Figure 1b with apparent ancestral exchange in the CPR were filtered to yield a subset of 620. Haplotypic representation of 12458 SNPs flanking the gap in the assembly (Left: chrX:55623011–58563685, Right: chrX:61725513–68381787; hg19) in these 620 male X chromosomes. Minor alleles shown in black, assembly gap is indicated by red line. The three most common X cenhaps highlighted with colored vertical bars at right. The tree is based on the UPGMA clustering of hamming distance of 800 SNPs immediately flanking the centromere, as indicated by the red bar at bottom.
-
Figure 1—figure supplement 2—source data 1
Full resolution version of Figure 1—figure supplement 2.
- https://doi.org/10.7554/eLife.42989.006
Figure 2
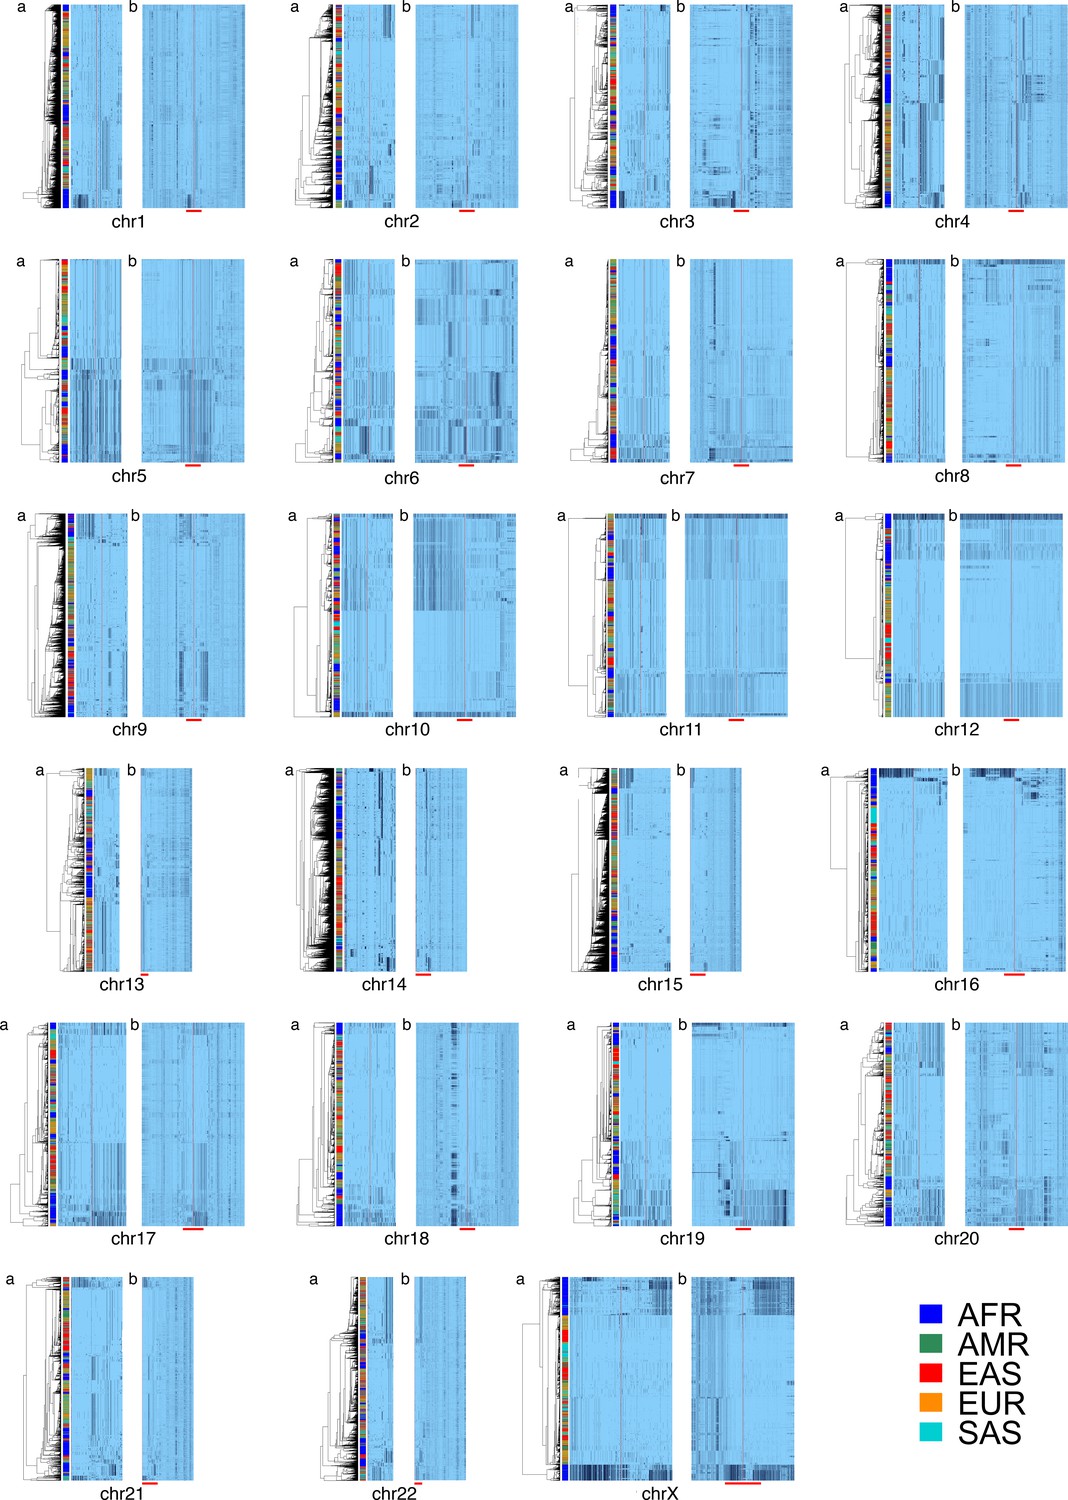
Cenhap diversity is found on many chromosomes.
A full resolution version of this figure is available as Figure 2—source data 2. SNPs were filtered for MAC ≥ 80 and passing the 4gt_dco with a tolerance of 0 (see Materials and methods). Minor alleles shown in black, assembly gap is indicated by red line. Panel (a) for each chromosome shows the diversity in a subset of SNPs immediately surrounding the gap. SNPs from panel a were used for UPGMA clustering based on the hamming distance (see Materials and methods and Figure 2—source data 1). Panel (b) for each chromosome is the haplotypic representation of SNPs in the CPR of each chromosome based on imputed genotypes from the 1000 Genomes Project (see Figure 2—source data 1 for coordinates), using the clustering as for panel (a). The red bar at the bottom of panel (b) shows the position of the clustering region depicted in (a). Superpopulation is indicated in bar at far left.
-
Figure 2—source data 1
Centromere-Proximal Regions examined.
The hg19 coordinates (p_begin to p_end and q_begin to q_end) of the CPRs in which SNPs in the 1000 Genomes (Phase 3) were investigated, panel b in Figure 2. Imputed haplotypes were UMPGA clustered based on filtered SNPs in a symmetrical central region immediately flanking the centromeric gap in the assembly (p_c to p_end and q_begin to p_c).
- https://doi.org/10.7554/eLife.42989.010
-
Figure 2—source data 2
Full resolution version of Figure 2.
- https://doi.org/10.7554/eLife.42989.011
Figure 3 with 3 supplements
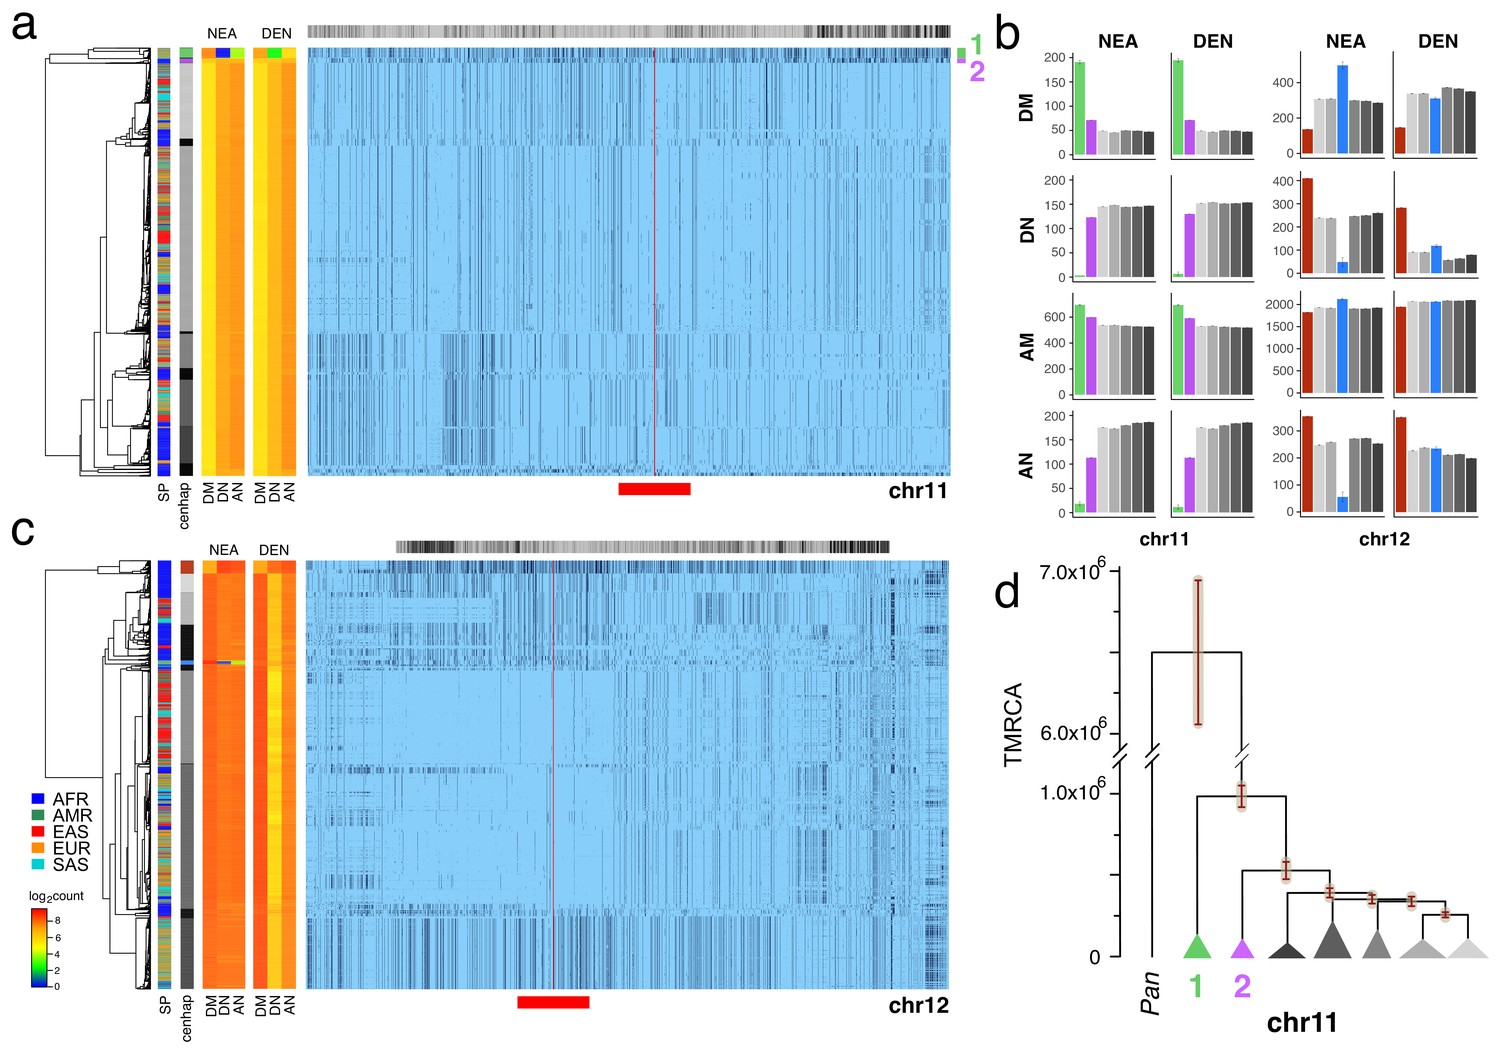
Archaic cenhaps are found in AMH populations.
A full resolution version of this figure is available as Figure 3—source data 3. (a) Haplotypic representation of 8816 SNPs from 5008 imputed chr11 genotypes from the 1000 Genomes Project (Left: chr11:50509493–51594084, Right: chr11:54697078–55326684; hg19). SNPs were filtered for MAC ≥ 35 and passing the 4gt_dco with a tolerance of three (see Materials and methods). Minor alleles shown in black and assembly gap indicated by red line. Haplotypes were clustered with UPGMA based on the hamming distance between haplotypes comprised of 1000 SNPs surrounding the gap (Left: chr11:51532172–51594084, Right: chr11:54697078–54845667; hg19, indicated by red bar at bottom). Superpopulation and cenhap partitioning are indicated by bars at far left. Log2 counts of DM (derived in archaic, shared by haplotype), DN (derived in archaic, not shared by haplotype) and AN (ancestral in archaic, not shared by haplotype) for each cenhap relative to Altai Neanderthal (NEA) and Denisovan (DEN) at left. Gray horizontal bar (top) indicates region included in analysis of archaic content; black bars indicate SNPs with data for archaic and ancestral states. (b) Bar plots indicating the mean and 95% confidence intervals of DM, DN, AM (ancestral in archaic, shared by cenhap) and AN counts for cenhap groups (as partitioned in a. and c.) relative to Altai Neanderthal and Denisovan genomes, using chimpanzee as an outgroup (Speidel et al., 2019). (c) Haplotypic representation, as above, of 21950 SNPs from 5008 imputed chr12 genotypes from the 1000 Genomes Project (Left: chr12:33939700–34856380, Right: chr12:37856765–39471374; hg19). SNPs were filtered for MAC ≥ 35. Haplotypes were clustered with UPGMA based on 1000 SNPs surrounding the gap (Left: chr12:34821738–34856670, Right: chr12:37856765–37923684; hg19). Bars at side, top and bottom same as in a. (d) A UPGMA tree based on the synonymous divergence for 30 genes in the seven major chr11 cenhaps (see Figure 3—source data 2), assuming the TMRCA of humans and chimpanzee is 6.5MY (see Materials and methods and legend for Figure 1d). The error bars at each node represent ±two standard deviations of distributions of estimated TMRCAs across the genes.
-
Figure 3—source data 1
The 37 chr11 coding genes in the CPR (2 left and 35 right of the centromere gap) used in the UPGMA clustering and estimation of TMRCAs.
Gene models and alignments from Ensembl release 92 (April 2018). Numbers of nonsynonymous differences in the two basal cenhaps (1, 2 and both, 1_&_2; see Figure 3) from the other cenhaps of the 5008 imputed chr11 CPR haplotypes (see Materials and methods). Numbers of sites divergent (human-chimp): div_sites. Numbers of sites polymorphic: polym_sites. Average nonsynomymous divergence: nonsyn_div. Average synonymous divergence: syn_div. Average nonsynonymous diversity: nonsyn_π. Average synonymous diversity: syn_π.
- https://doi.org/10.7554/eLife.42989.019
-
Figure 3—source data 2
The eight chr8 coding genes in the CPR (8 left and 0 right of the centromere gap) used in the UPGMA clustering and estimation of TMRCAs.
Gene models and alignments from Ensembl release 92 (April 2018). Numbers of sites divergent (human-chimp): div_sites. Numbers of sites polymorphic: polym_sites. Average nonsynomymous divergence: nonsyn_div. Average synonymous divergence: syn_div. Average nonsynonymous diversity: nonsyn_π. Average synonymous diversity: syn_π.
- https://doi.org/10.7554/eLife.42989.020
-
Figure 3—source data 3
Full resolution version of Figure 3.
- https://doi.org/10.7554/eLife.42989.021
Figure 3—figure supplement 1
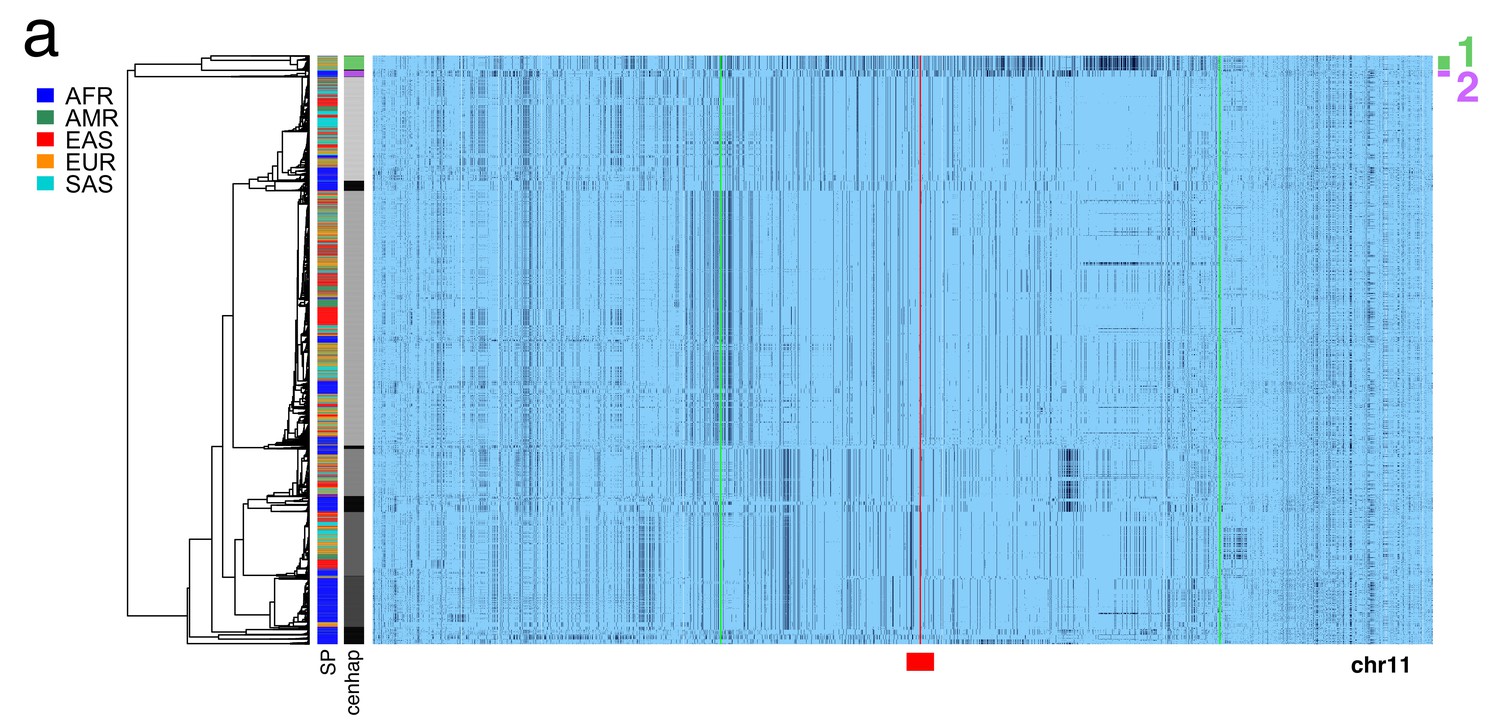
Region of chromosome 11 used for cenhap coding region divergence.
A full resolution version of this figure is available as Figure 3—figure supplement 1—source data 1. (a) Haplotypic representation of 38644 SNPs from 5008 imputed chr11 genotypes from the 1000 Genomes project (Left: chr11:46509551–51594084, Right: chr11:54695707–59326455; hg19). Green lines indicate the region used for analysis of divergence in coding regions (Left: 49952369, Right: 56643039; hg19). SNPs were filtered for MAC ≥ 35 and passing the 4gt_dco with a tolerance of three (see Materials and methods). Minor alleles are shown in black, and assembly gap is indicated by red line. Haplotypes were clustered with UPGMA based on the hamming distances between haplotypes comprised of 1000 SNPs surrounding the gap, indicated by the red bar at bottom. Superpopulation and cenhap partitioning is shown at left.
-
Figure 3—figure supplement 1—source data 1
Full resolution version of Figure 3—figure supplement 1.
- https://doi.org/10.7554/eLife.42989.014
Figure 3—figure supplement 2

Evidence of an archaic cenhap within Africa on chromosome 8.
A full resolution version of this figure is available as Figure 3—figure supplement 2—source data 1.(a) Haplotypic representation of 14000 SNPs from 5008 imputed chr8 genotypes from the 1000 Genomes Project (Left: chr8:42178101–43838849, Right: chr8:46839548–49217022; hg19). SNPs were filtered for MAC ≥ 35 and passing the 4gt_dco with a tolerance of three (see Materials and methods). Minor alleles shown in black. Centromeric gap is indicated by red line. Haplotypes were clustered with UPGMA based on the hamming distances between haplotypes comprised of 1000 SNPs surrounding the gap (indicated by red bar at bottom). Superpopulation is indicated at left. (b) Filtered cenhaps show very little evidence of recombination and support archaic ancestry of a basal cenhap found in Africa. Cenhaps with putative exchange in their ancestry were filtered from the data in a by clustering SNPs on the low recombination regions on the left and right side of the gap separately (Left: chr8:42668082–43838849, Right: chr8:46839548–48639846, indicated by green and red lines; hg19). Left-side and right-side clades with little evidence of recombination were intersected to yield 1661 cenhaps used in downstream analysis of archaic contribution and TMRCA. Analysis of possible archaic descent was limited to an internal window of 10602 SNPs, indicated by green lines (chr8:43202774–47755914; hg19). At the left are log2 counts of DM (derived in archaic, shared by cenhap), DN (derived in archaic, not shared by cenhap) and AN (ancestral in archaic, not shared by cenhaps) based on the Altai Neanderthal (NEA) and Denisovan (DEN) sequence using chimpanzee as an outgroup (Prüfer et al., 2017). Gray bar at top indicates region included in analysis of archaic content and black bars indicate SNPs with data for archaic and outgroup state. Red bar at bottom indicates 1000 SNP region used for clustering. (c) A UPGMA tree based on the synonymous divergence in eight genes (see Figure 3—source data 2) in the three major chr8 cenhaps, assuming the TMRCA of humans and chimps is 6.5MYA. The error bars at each node represent ±two standard deviations of distributions of estimated TMRCAs across the genes. (d) Bar plots indicating the mean and 95% confidence intervals of DM, DN, AM (ancestral in archaic, shared by cenhap) and AN counts for cenhap groups (as partitioned b) relative to the archaic genomes (Prüfer et al., 2017).
-
Figure 3—figure supplement 2—source data 1
Full resolution version of Figure 3—figure supplement 2.
- https://doi.org/10.7554/eLife.42989.016
Figure 3—figure supplement 3
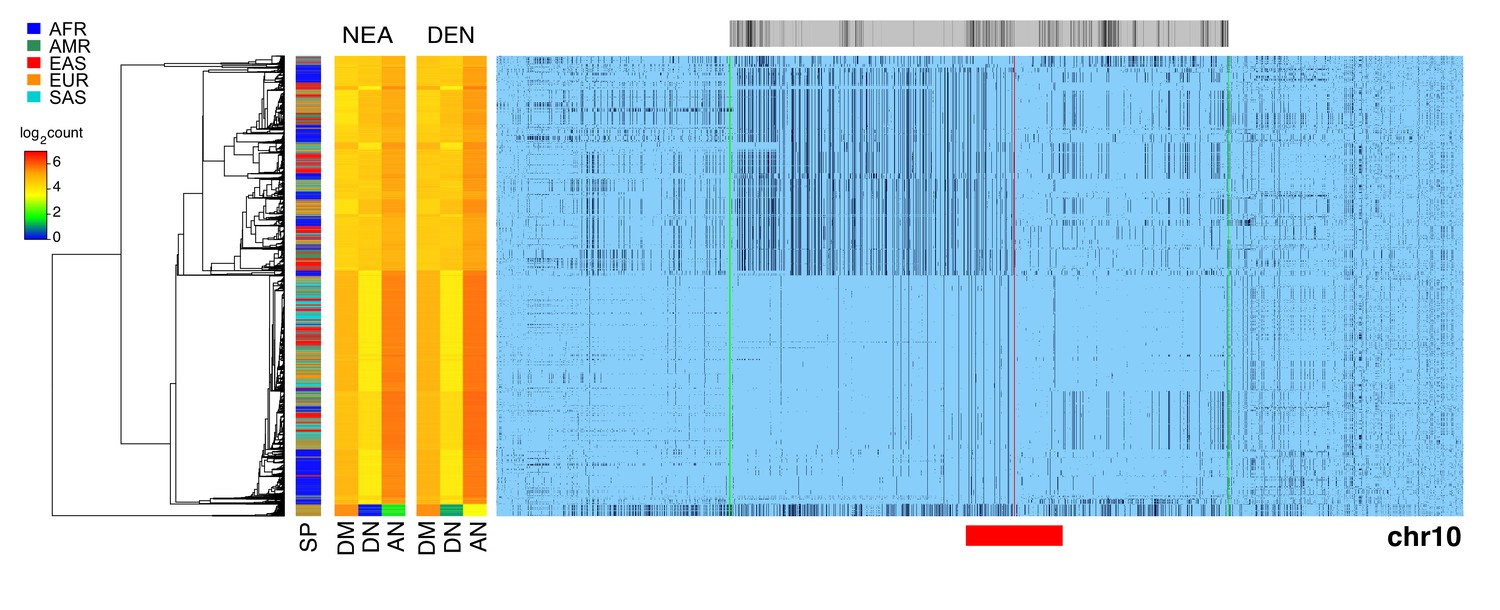
Evidence of archaic cenhap introgression on chromosome 10.
A full resolution version of this figure is available as Figure 3—figure supplement 3—source data 1. Haplotypic representation of 14000 SNPs from 5008 imputed chr10 genotypes from the 1000 Genomes Project (Left: chr10:37341777–39154888, Right: chr10:42354982–43762908; hg19). SNPs were filtered for MAC ≥ 35 and passing the 4gt_dco with a tolerance of three (see Materials and methods). Minor alleles are shown in black, and centromeric gap is indicated by red line. Haplotypes were clustered with UPGMA based on the hamming distance between haplotypes comprised of 1400 SNPs surrounding the gap (indicated by red bar at bottom). Superpopulation is indicated at left. Analysis of possible archaic descent was limited to an internal window of 7221 SNPs showing little evidence of exchange in the most centromere-distal regions, indicated by green lines. At the left are log2 counts of DM (derived in archaic, shared by cenhap), DN (derived in archaic, not shared by cenhap) and AN (ancestral in archaic, not shared by cenhaps) based on the Altai Neanderthal (NEA) and Denisovan (DEN) sequence using chimpanzee as an outgroup (Prüfer et al., 2017). Gray bar at top indicates region included in analysis of archaic content and black bars indicate SNPs with data for archaic and outgroup state.
-
Figure 3—figure supplement 3—source data 1
Full resolution version of Figure 3—figure supplement 3
- https://doi.org/10.7554/eLife.42989.018
Figure 4 with 1 supplement
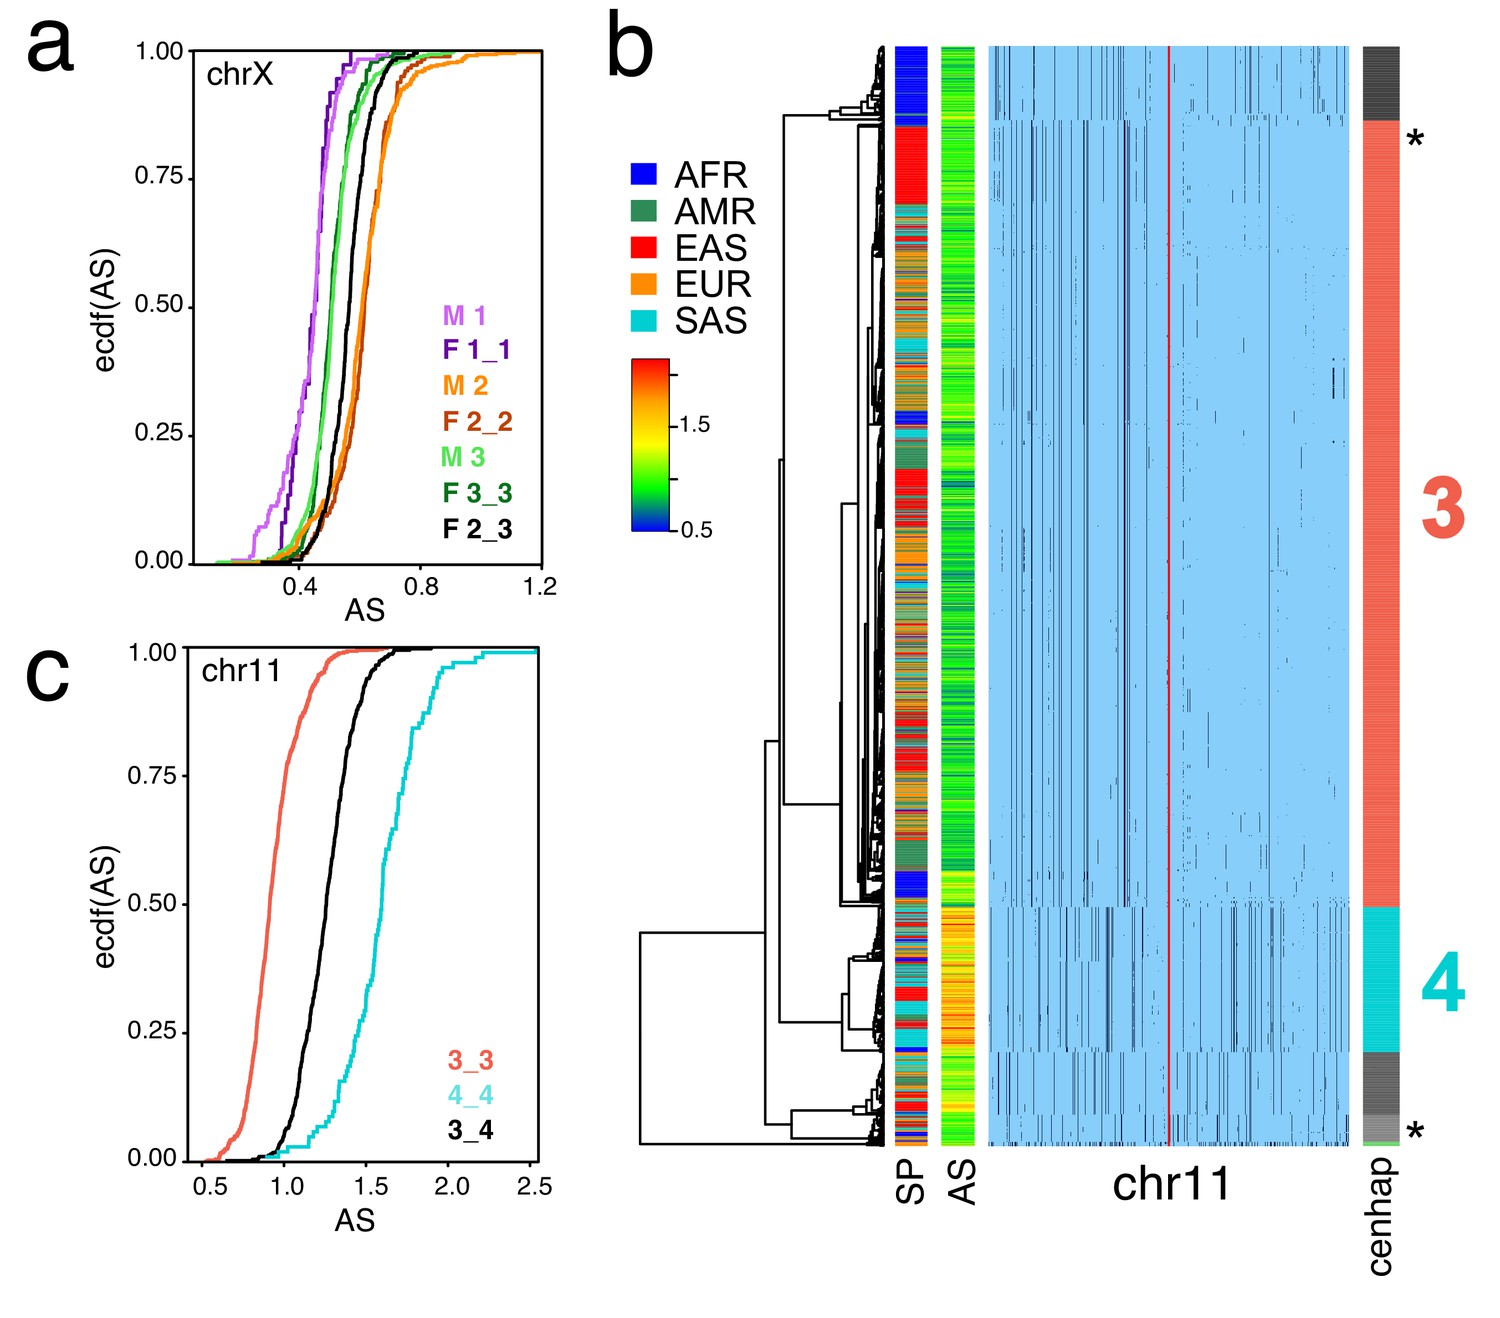
Cenhaps differ in α-satellite array size.
A full resolution version of this figure is available as Figure 4—source data 1. (a) Empirical cumulative densities (ecdf) of chrX α-satellite array size for cenhap homozygotes and heterozygotes (see Figure 1b for cenhap designations). 1_2 and 1_3 heterozygotes were excluded due to insufficient data. Female (F) values were normalized (x 0.5) to facilitate plotting with hemizygote male (M) data. (b) Haplotypic representation of 1000 SNPs from 1546 imputed chr11 genotypes from 773 cenhap-homozygous individuals. SNPs were filtered for MAC ≥ 35 and passing the 4gt_dco with a tolerance of 3. Minor alleles shown in black. Assembly gap indicated by red line. Superpopulation (SP) and scaled chr11-specific α-satellite array size (AS) at left. Cenhap partitions at right; most common cenhap ‘3’ and cenhap with larger mean array size ‘4’ are highlighted. Most probable HuRef cenhap genotypes are indicated by black asterisks at right. (c) Empirical cumulative density of array size for chr11 cenhap (from b) homozygotes (3_3 and 4_4) and heterozygotes (3_4).
-
Figure 4—source data 1
Full resolution version of Figure 4.
- https://doi.org/10.7554/eLife.42989.025
Figure 4—figure supplement 1
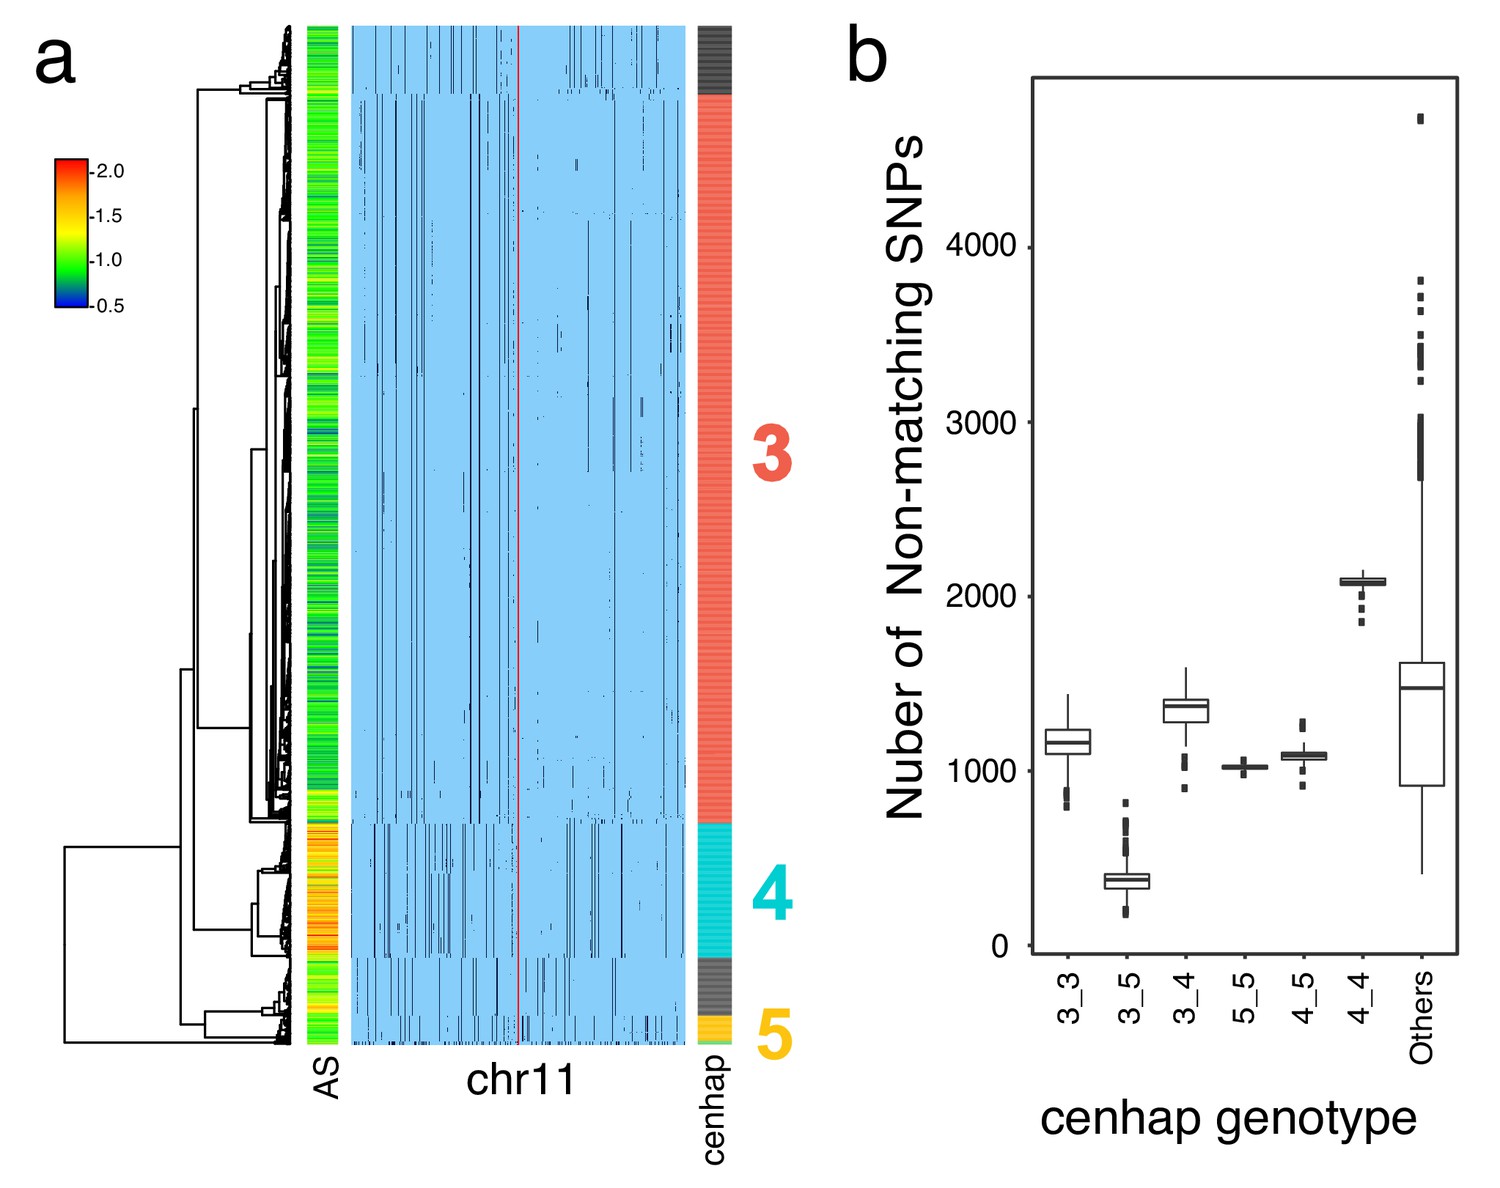
HuRef’s chr11 cenhap genotype.
A full resolution version of this figure is available as Figure 4—figure supplement 1—source data 1.(a) Haplotypic representation of 1000 SNPs flanking the gap from 1546 imputed haploid chr11 genotypes from 773 cenhap-homozygous individuals. SNPs were filtered for MAC ≥ 35 and passing the 4gt_dco with a tolerance of 3. Minor alleles are shown in black. Assembly is gap indicated by the red line. Scaled chr11-specific α-satellite array size (AS) at left. Cenhap partitions at right; most common cenhap ‘3’, the cenhap with largest mean array size (‘4’) and an additional likely HuRef cenhap ‘5’ are highlighted. (b) Box plots of the distributions of numbers of non-matching SNPs between HuRef and the indicated cenhap genotypes. The same 8816 SNPs as in Figure 3 were genotyped in both the 1000 Genomes and HuRef. HuRef cenhap genotype is most likely 3_5 and does not involve the cenhap with the largest mean array size.
-
Figure 4—figure supplement 1—source data 1
Full resolution version of Figure 4—figure supplement 1.
- https://doi.org/10.7554/eLife.42989.024
Author response image 1
Additional files
-
Transparent reporting form
- https://doi.org/10.7554/eLife.42989.026
Download links
A two-part list of links to download the article, or parts of the article, in various formats.
Downloads (link to download the article as PDF)
Open citations (links to open the citations from this article in various online reference manager services)
Cite this article (links to download the citations from this article in formats compatible with various reference manager tools)
Haplotypes spanning centromeric regions reveal persistence of large blocks of archaic DNA
eLife 8:e42989.
https://doi.org/10.7554/eLife.42989


