Random-sequence genetic oligomer pools display an innate potential for ligation and recombination
- MRC Laboratory of Molecular Biology, United Kingdom
- Katholieke Universiteit Leuven, Belgium
Figures
Figure 1 with 2 supplements
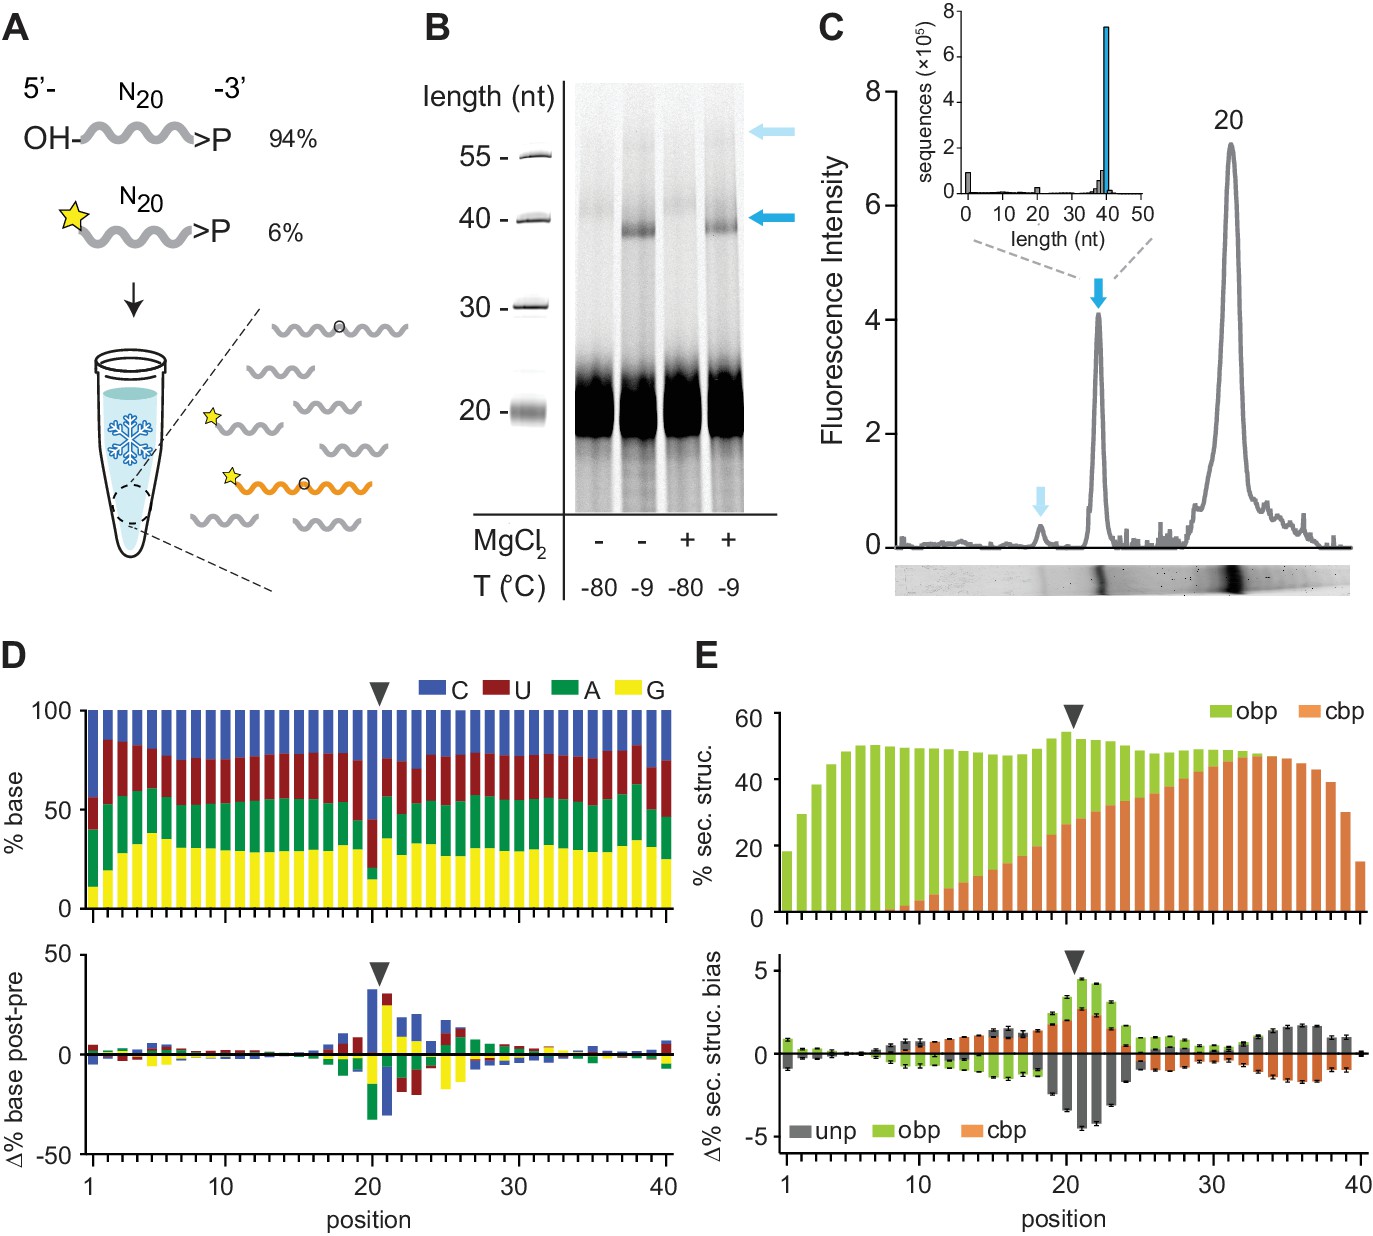
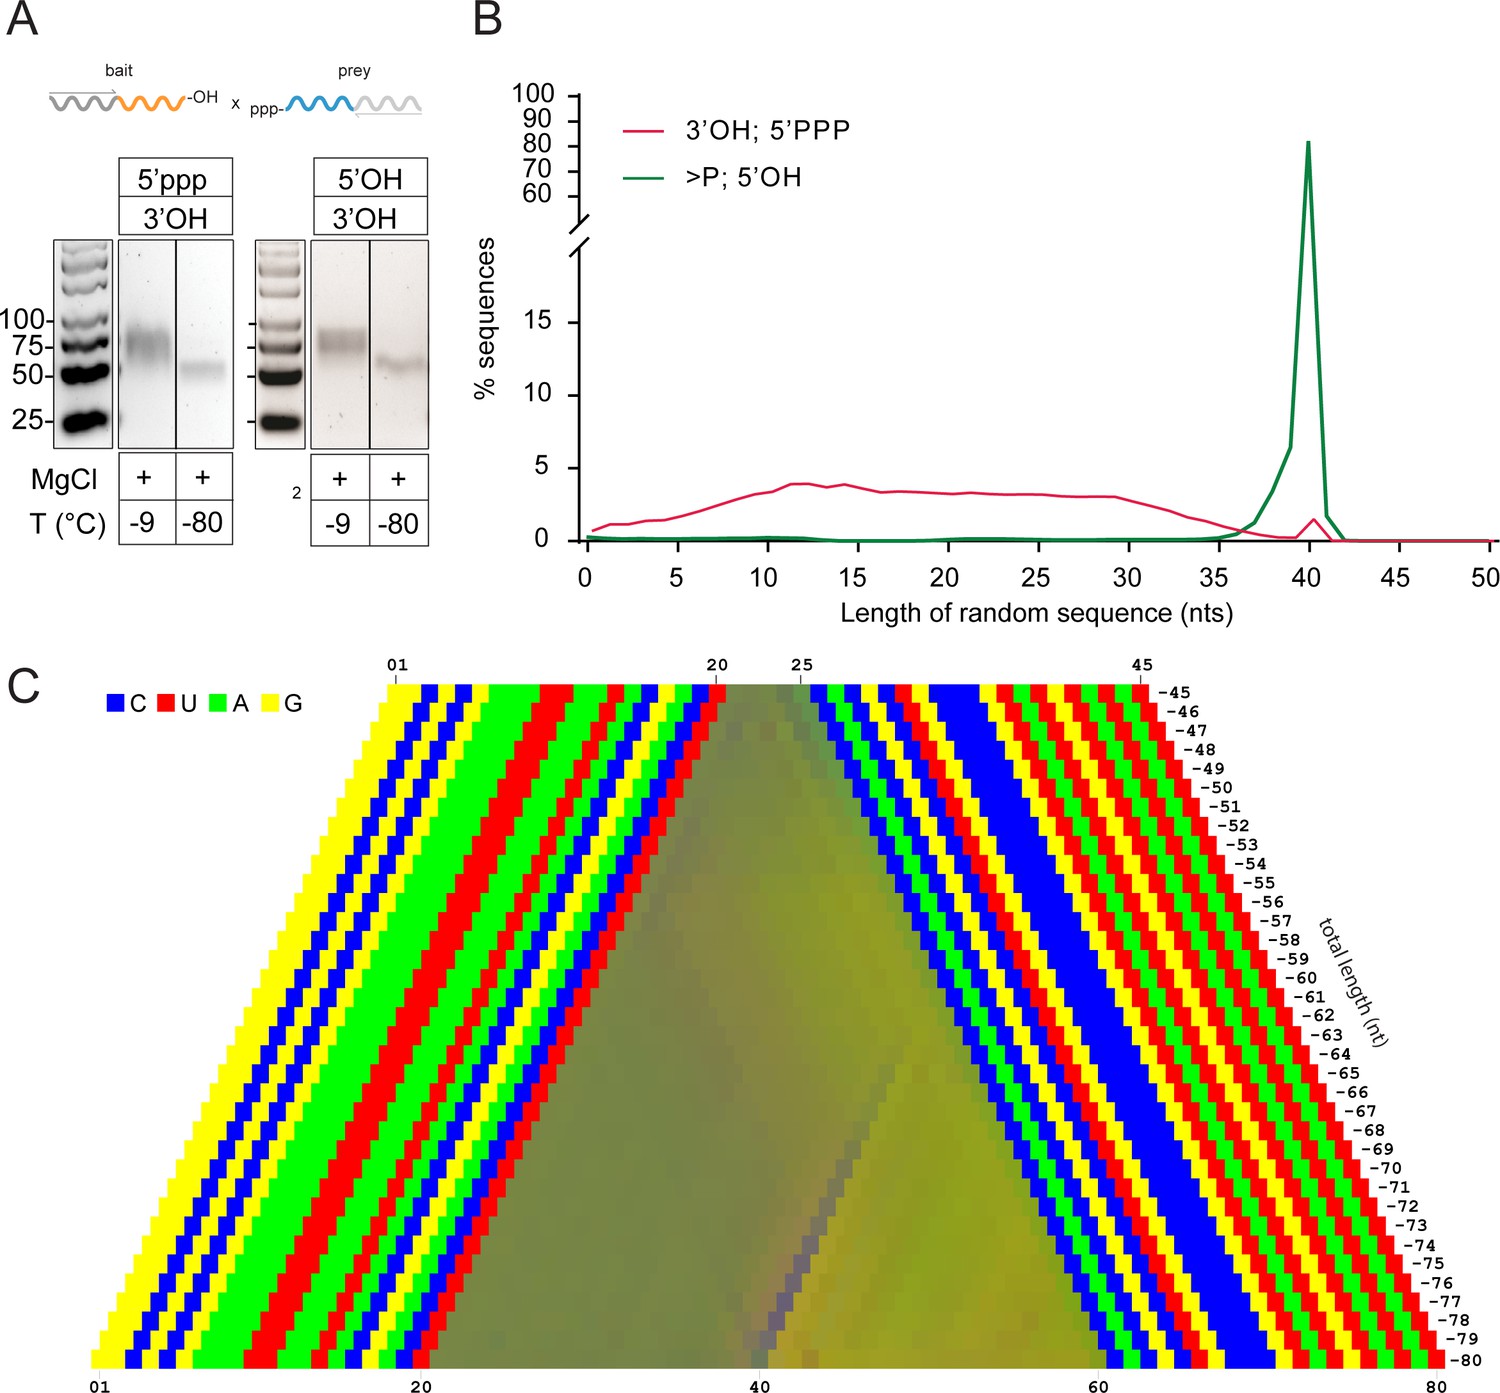
Reactivity of 2’, 3’ cyclic phosphate (>p) activated N20 RNA pools.
(A) N20>p pools are incubated in eutectic ice phases, spiked with 6% 5’FAM (Carboxyfluorescein)-labelled N20>p to facilitate detection of ligation products (orange) by Urea-PAGE. (B) Scan of a denaturing gel for FAM-labelled products after 57 days of incubation either in eutectic ice (−9 °C) or at −80 °C, and +/- MgCl2. Note that ligation of FAM-N20>p is inhibited due to the blocked 5’-OH. (C) Densitogram of a SYBR-gold stained Urea-PAGE gel trace (-MgCl2, −9 °C) (bottom panel) showing total ligation (both FAM-labelled and unlabelled ligation products (indicated by arrows)). The size distribution and size of the main ligation product (40mer) from deep sequencing indicates direct ligation of two eicosamers (inset). (D) Upper panel: Average nucleotide distribution profile of the 40mer ligation products. Lower panel: Changes in nucleotide composition compared to the unligated input N20>p pool. Black arrows indicate the ligation site. (E) Upper panel: Average base-pairing frequencies of sequenced 40mers (as predicted by RNAfold (Lorenz et al., 2011): ‘Opening’ base pairs (obp, green; defined as hybridization to a downstream nucleotide) and ‘closing’ base pairs (cpb, hybridization to an upstream nucleotide, orange). Lower panel: Average difference of predicted base pairing between experimental pool and synthetic sequence pools (N = 3; 300,000 sequences each) generated in silico using experimental nucleotide frequencies shown in panel D. Grey indicates predicted unpaired bases (unp), black standard deviations.
-
Figure 1—source data 1
Source data for panels C, D, and E.
- https://doi.org/10.7554/eLife.43022.006
Figure 1—figure supplement 1
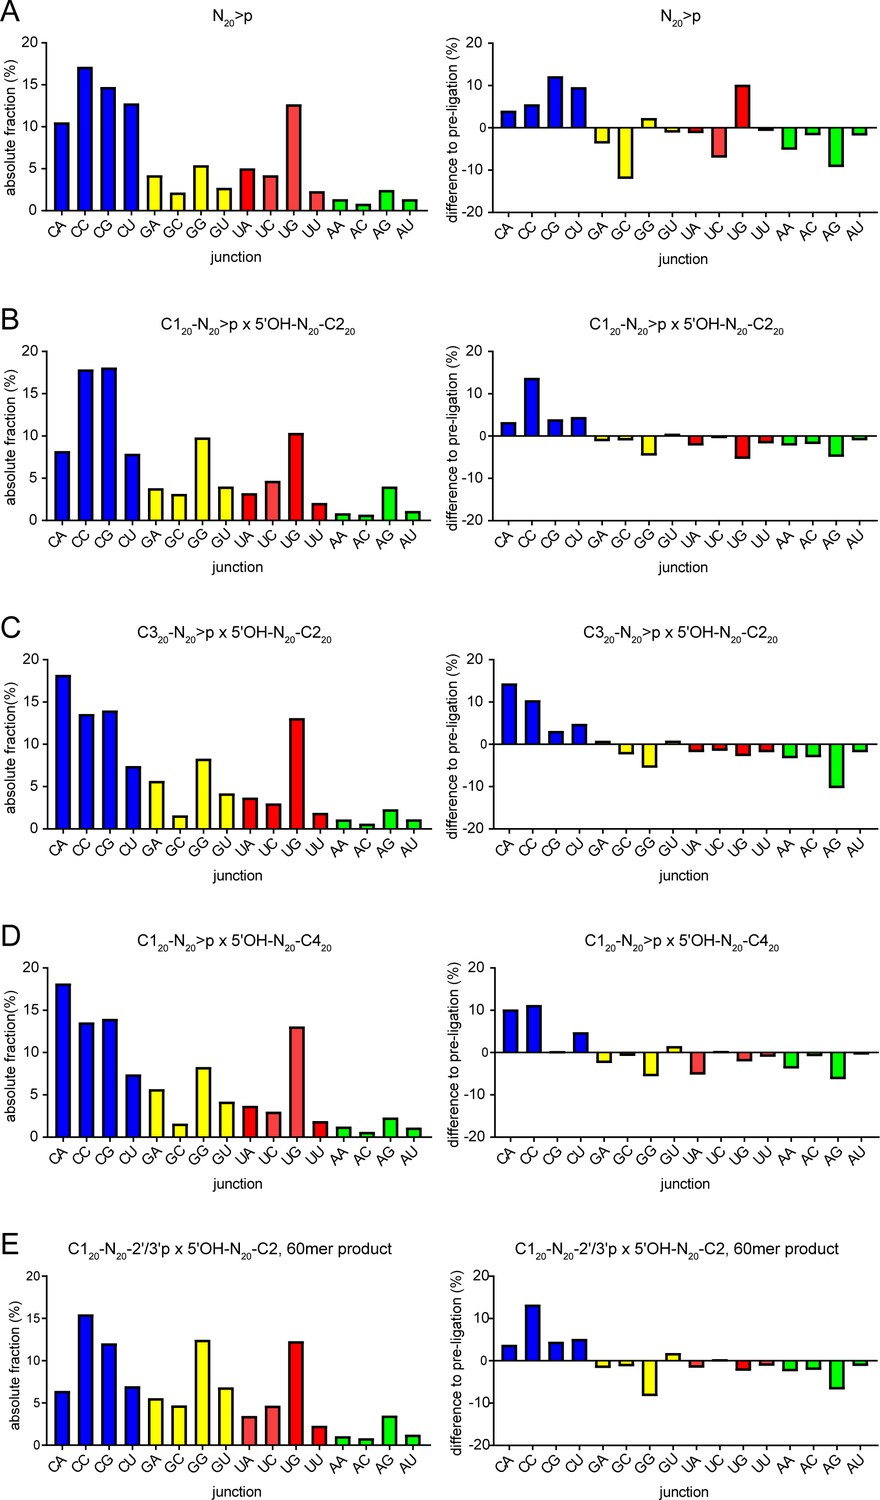
N-1pN+1 dinucleotide frequencies.
(A) Dinucleotide frequencies found in N40 products from N20>p ligation reactions (left panel). Differences between the expected dinucleotide frequencies calculated from N20>pp starting material (using the frequencies from position 1 and 20 of the N20>pp pool) are shown in the right panel. Equivalent graphs are shown for the semi-random sequence RNA pool ligation products of (B) C120-N20>p × 5’OH-N20-C220, (C) C320-N20>p × 5’OH-N20-C220, (D) C120-N20>p × 5’OH-N20-C420, and (E) the 60mer recombination product from C120-N20-2’/3’p × 5’OH-N20-C220 reactions shown in Figure 4D.
-
Figure 1—figure supplement 1—source data 1
NpN frequencies of different ligation products and relative change to pre-ligation material.
- https://doi.org/10.7554/eLife.43022.004
Figure 1—figure supplement 2
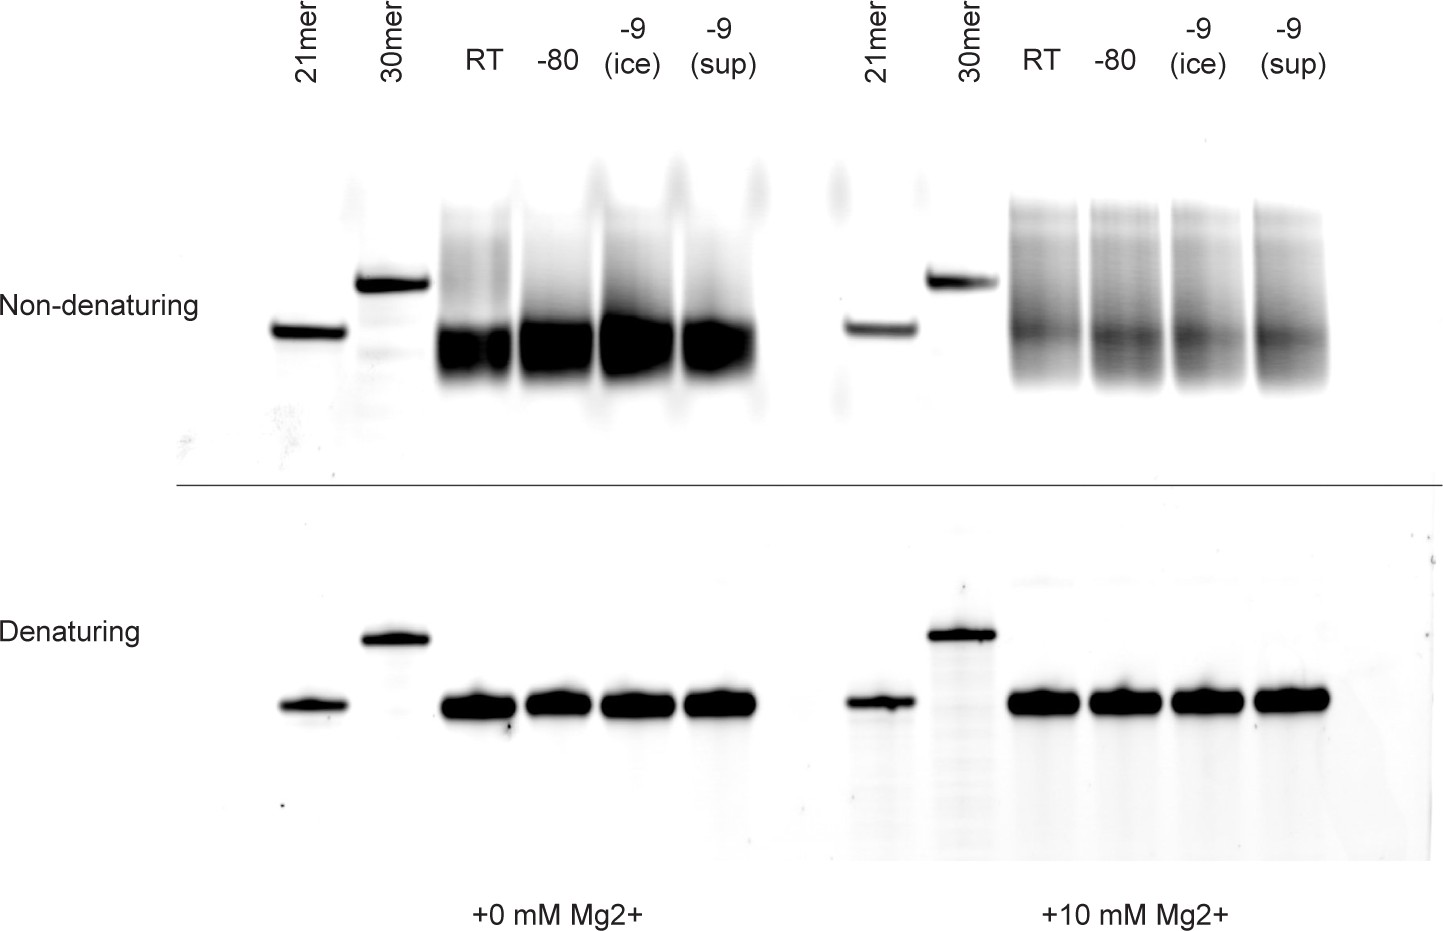
Evidence for intramolecular association and non-covalent complex formation in pools of random RNA oligonucleotides as judged by gel electrophoresis.
RNA oligonucleotide "FITC-N20” (2.5 µM in 25 mM NaCl, 1 mM Tris•HCl pH 8.3, with or without 10 mM MgCl2) incubated at room temperature or in ice, and analysed by native (non-denaturing) (top panel) or denaturing (bottom panel) PAGE. Under non-denaturing conditions, high molecular weight species can be observed following incubation at room temperature or in ice, which resolve to single bands under denaturing conditions indicating that these are non-covalently associated RNAs. A higher proportion of non-covalently associated RNA can be observed in the presence of MgCl2. Single-sequence (i.e. non-random) 21mer and 30mer RNA oligonucleotides do not show formation of such intermolecular complexes and were included as molecular weight markers.
Figure 2 with 6 supplements
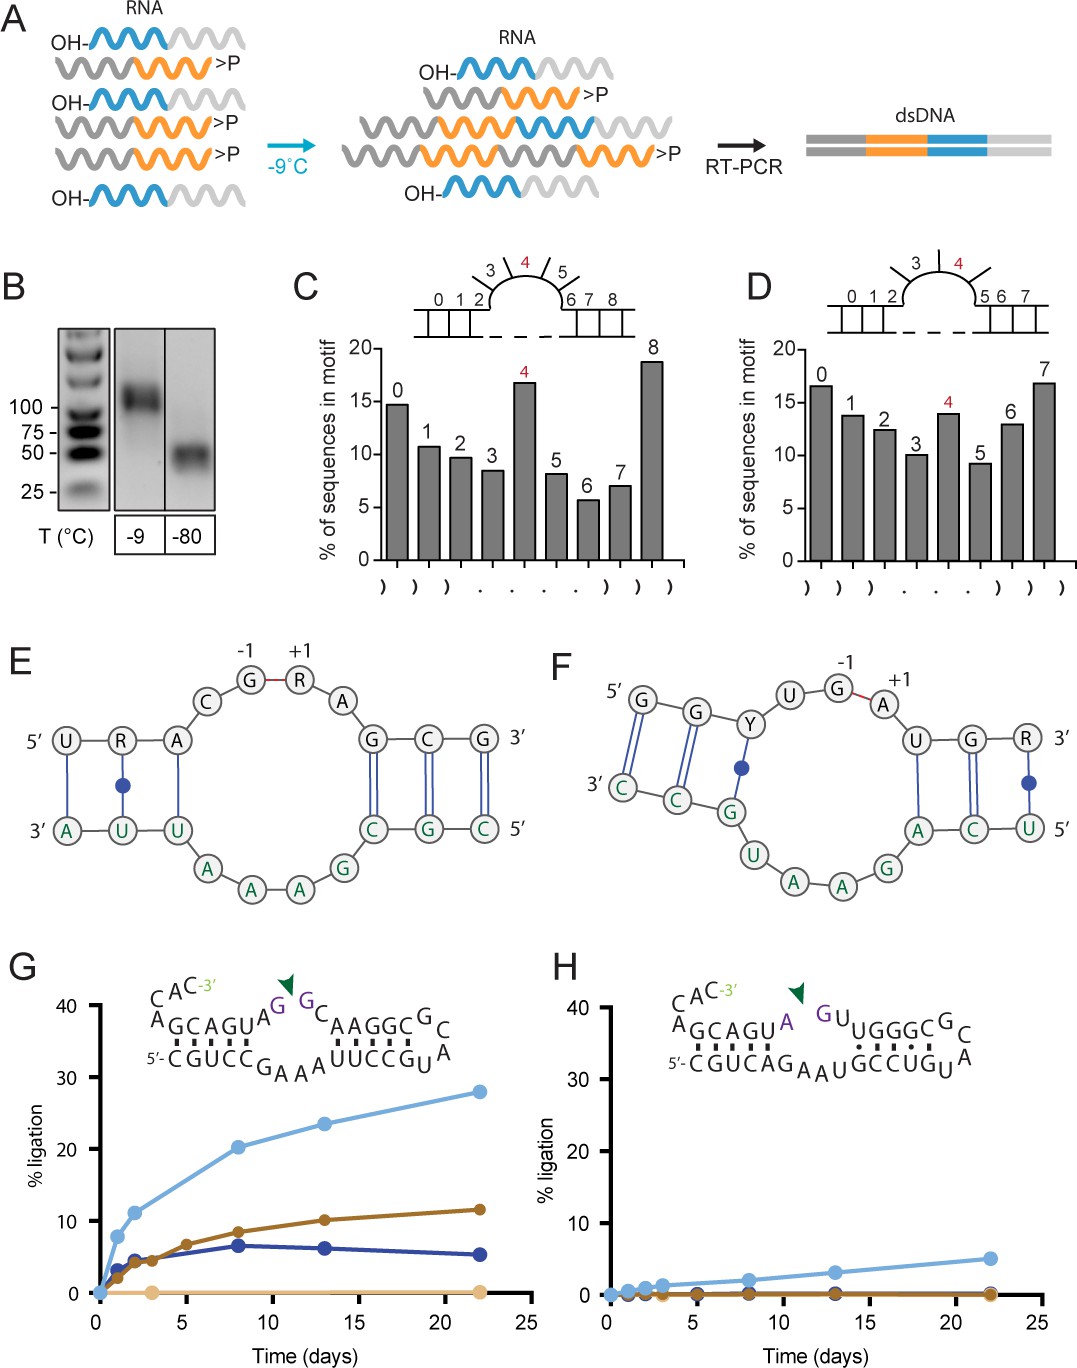
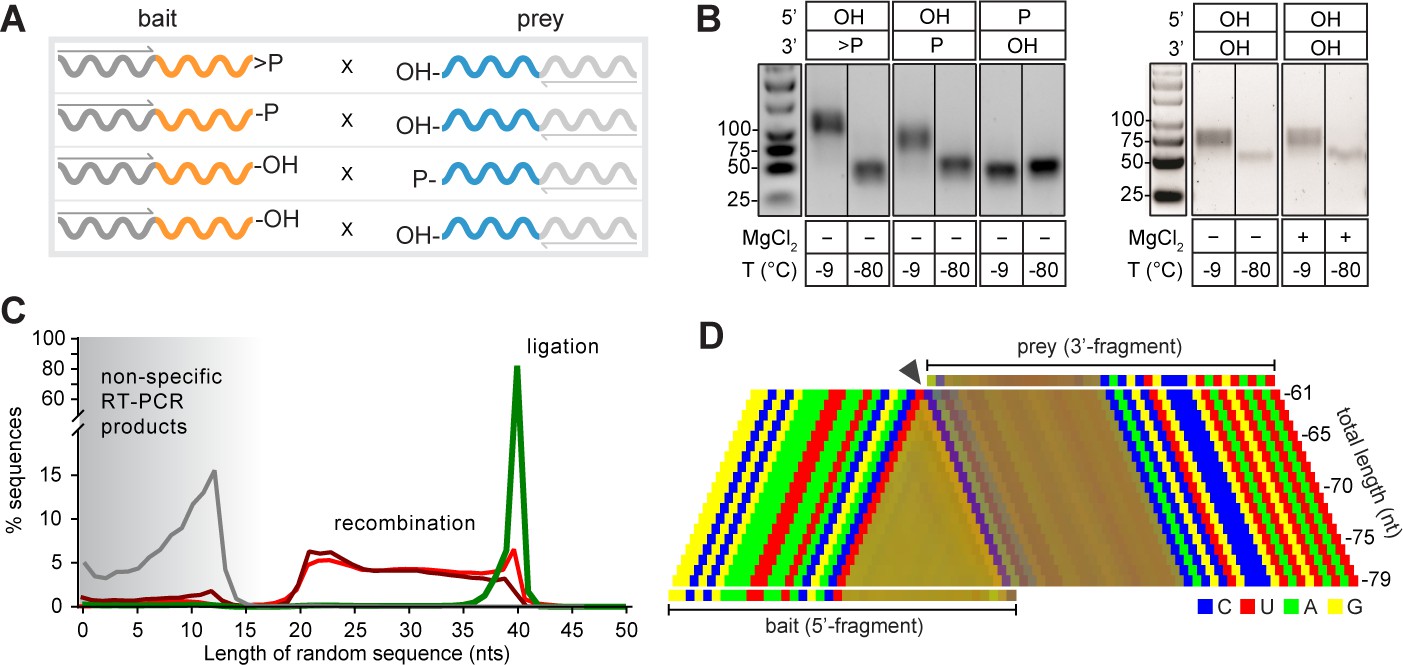
Reactivity of semi-random RNA pools with different termini.
(A) Assembly scheme: The random N20 regions of both semi-random RNAs are illustrated in orange (bait) and cyan (prey). Only direct ligation products comprising the constant primer binding site segments 5’-C120 (dark grey) and 3’-C220 (light grey) are detected by RT-PCR. (B) RT-PCR products for bait>p × 5’OH-prey reactions after incubation at −9 °C or −80 °C for 51 days. Shorter PCR products recovered at −80 °C result from unspecific annealing of the RT-primer in the 3’-random region of the bait fragment (Figure 2—figure supplement 1A). (C, D) Ligation frequencies for motif J (C) respectively motif H (D) in bait>p × 5’OH-prey products. Motif J is defined by four unpaired bases flanked by 3 nt helical regions. The plot shows the normalized amount of ligation sites located between two adjacent nucleotides within motif J. Although the ligation frequency generally drops in regions predicted to be unpaired, in submotifs J4 and H4 it is enriched (shown in red). (E) Consensus motif for J4 extracted from the sequence peak in (C). The constant regions form the strand opposite of the ligation site (green letters). (F) Consensus motif for H4. As for J4, the ligation site comprises parts of the constant region (green). (G) A minimal RNA construct with the J4 core-motif catalyses bimolecular ligation under frozen conditions in ice (-MgCl2, cyan; +10 mM MgCl2, dark blue) as well as under ambient temperature (17 °C) in presence of MgCl2 (brown). No ligation under ambient conditions is observed in absence of MgCl2 (light brown). (H) H4 catalyses slow 3’−5’ ligation reactions exclusively under frozen conditions and in absence of Mg2+ (blue).
-
Figure 2—source data 1
Source data for panel C, D, G, and H.
The file also contains the ligation kinetics of the other motifs used during fitting of the apparent rate constants shown in Figure 2—figure supplement 6.
- https://doi.org/10.7554/eLife.43022.015
Figure 2—figure supplement 1

Detection of ligation of >p activated semi-random sequence pool RNA by RT-PCR.
(A) >p dependent ligation products (80mer) of semi-random sequence pool RNA can already be detected after 1 week of incubation at −9 °C (red star, lane 1: C120-N20>p × 5’OH-N20-C220). No 80mer ligation product is visible after incubation at −80 °C (lane 2) and separate incubation of C120- N20>p or 5’OH-N20-C220 alone (lanes 3–6). Note that the band for ligation at −9 °C (lane 1) becomes much more prominent after longer incubation times (see Figure 2B). RT-PCR of C120-N20>p in absence of 5’OH-N20-C220 gives a strong, reproducible signal resulting from annealing of RT-primer to the random region (lanes 5, 6). (B) Upper panel: nucleotide frequency profile of the 80mer product pool (from Figure 1; 51 days at −9 °C). Lower panel: Average base-pairing differences between the experimental 80mer product pool from Figure 2B (1,197,879 sequences) and randomly generated in silico sequence pools (1,000,000 sequences) using the experimental nucleotide frequencies from the upper panel with secondary structure calculated using RNAfold. Arrows indicate the position of the ligation site. (C) Nucleotide frequency profile of C120-N20>p (using >p activated material as RT template) and 5’OH-N20-C220 starting material. (D) Difference between the nucleotide profile of the ligation product from (B) and artificially joined starting pools from (C) assuming direct bait-prey ligation. The arrow indicates the position of the ligation site.
-
Figure 2—figure supplement 1—source data 1
Source data for panel B, C, and D as well as pre-ligation frequencies of all semi-random RNA pools used for recombination/ligation.
- https://doi.org/10.7554/eLife.43022.009
Figure 2—figure supplement 2
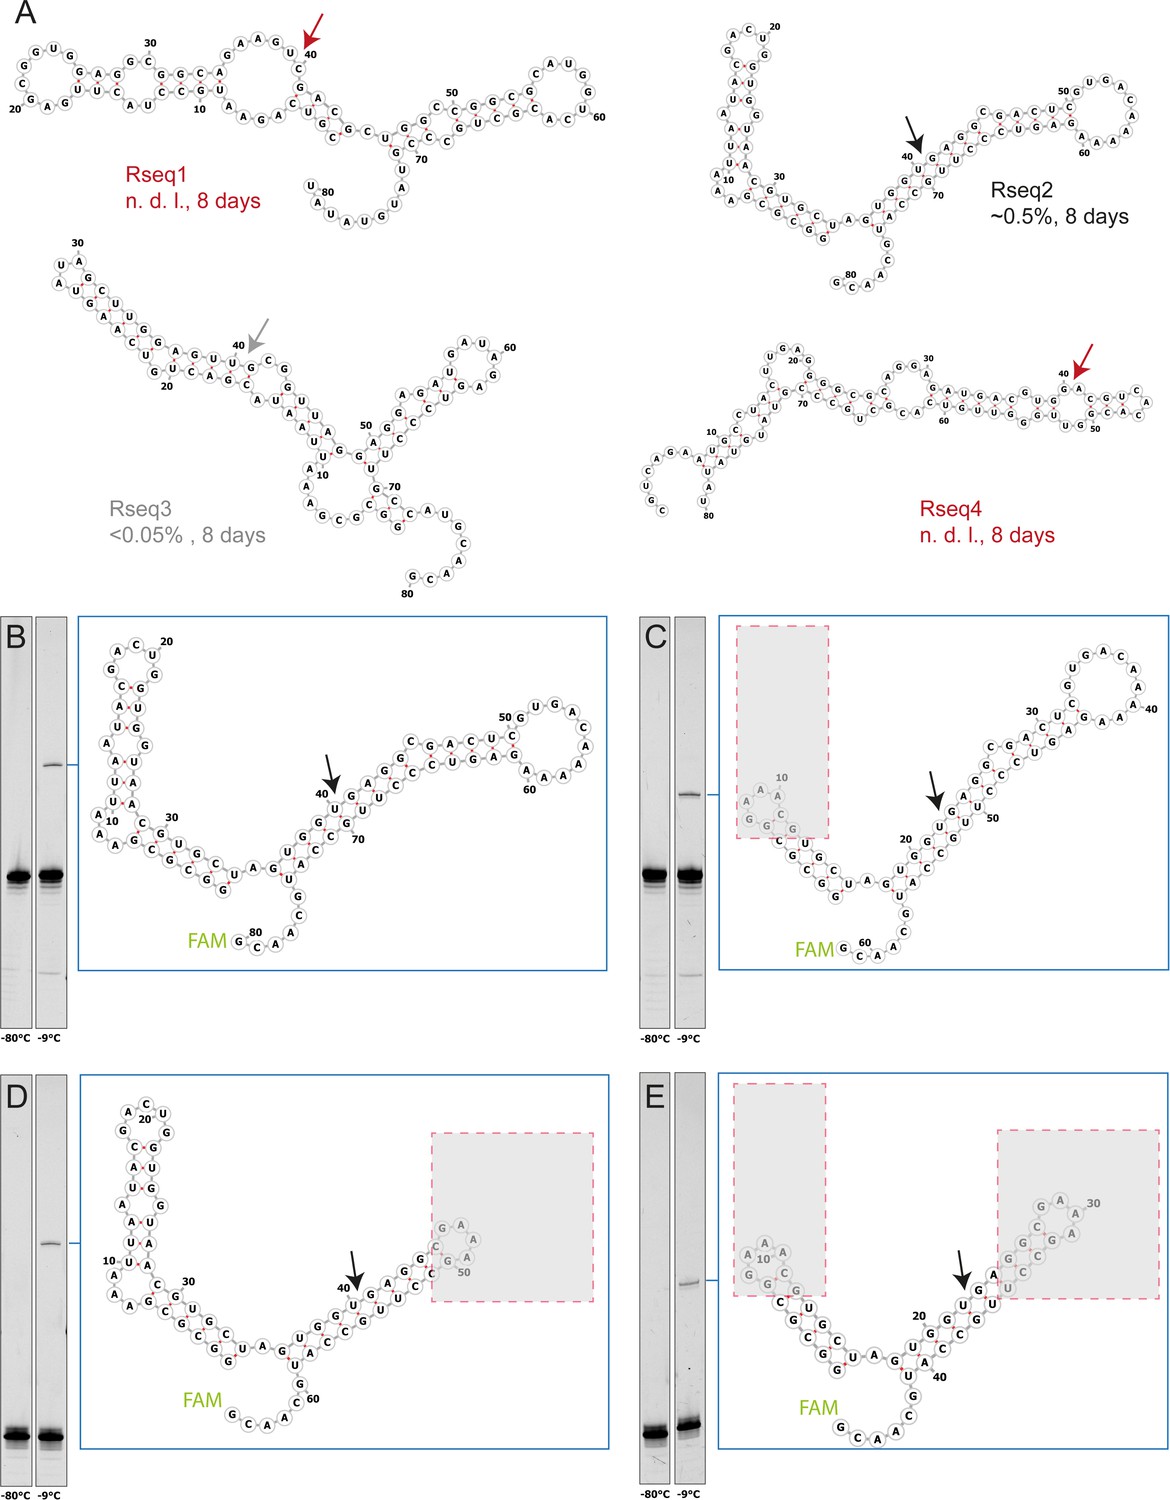
Characterization of four randomly picked clones from semi-random sequence RNA pool experiments.
(A) The predicted secondary structure of the 40mer full-length ligation products are shown with arrows indicating the expected ligation site. To test ligation, >p activated bait fragments (1 µM) were co-incubated with 3’-FAM-labelled prey fragments (1 µM) for 8 days in 1 mM Tris•HCl, pH 8.3/25 °C, 25 mM NaCl at −9 °C (frozen) and analysed by Urea-PAGE. Fragment sequences are listed in Supplementary file 2. Rseq1 and Rseq3 showed no detectable ligation after incubation, suggesting no (or weak) self-ligation activity (false positive) or involvement of additional unidentified RNA strands in the original mixed pool experiments. Rseq2, whose ligation junction is located inside an extended helical gapped duplex region, shows the strongest ligation of all three picked clones. (B, C, D, E) Ligation of Rseq2 is not dependent on adjacent domains as ligation yields comparable to the full-length product (B) are obtained with truncations (indicated by grey boxes) of either the 5’-fragment (C), 3’-fragment (D) or both (E) indicating that the only requirement for ligation is the gapped duplex formation at the ligation junction.
Figure 2—figure supplement 3
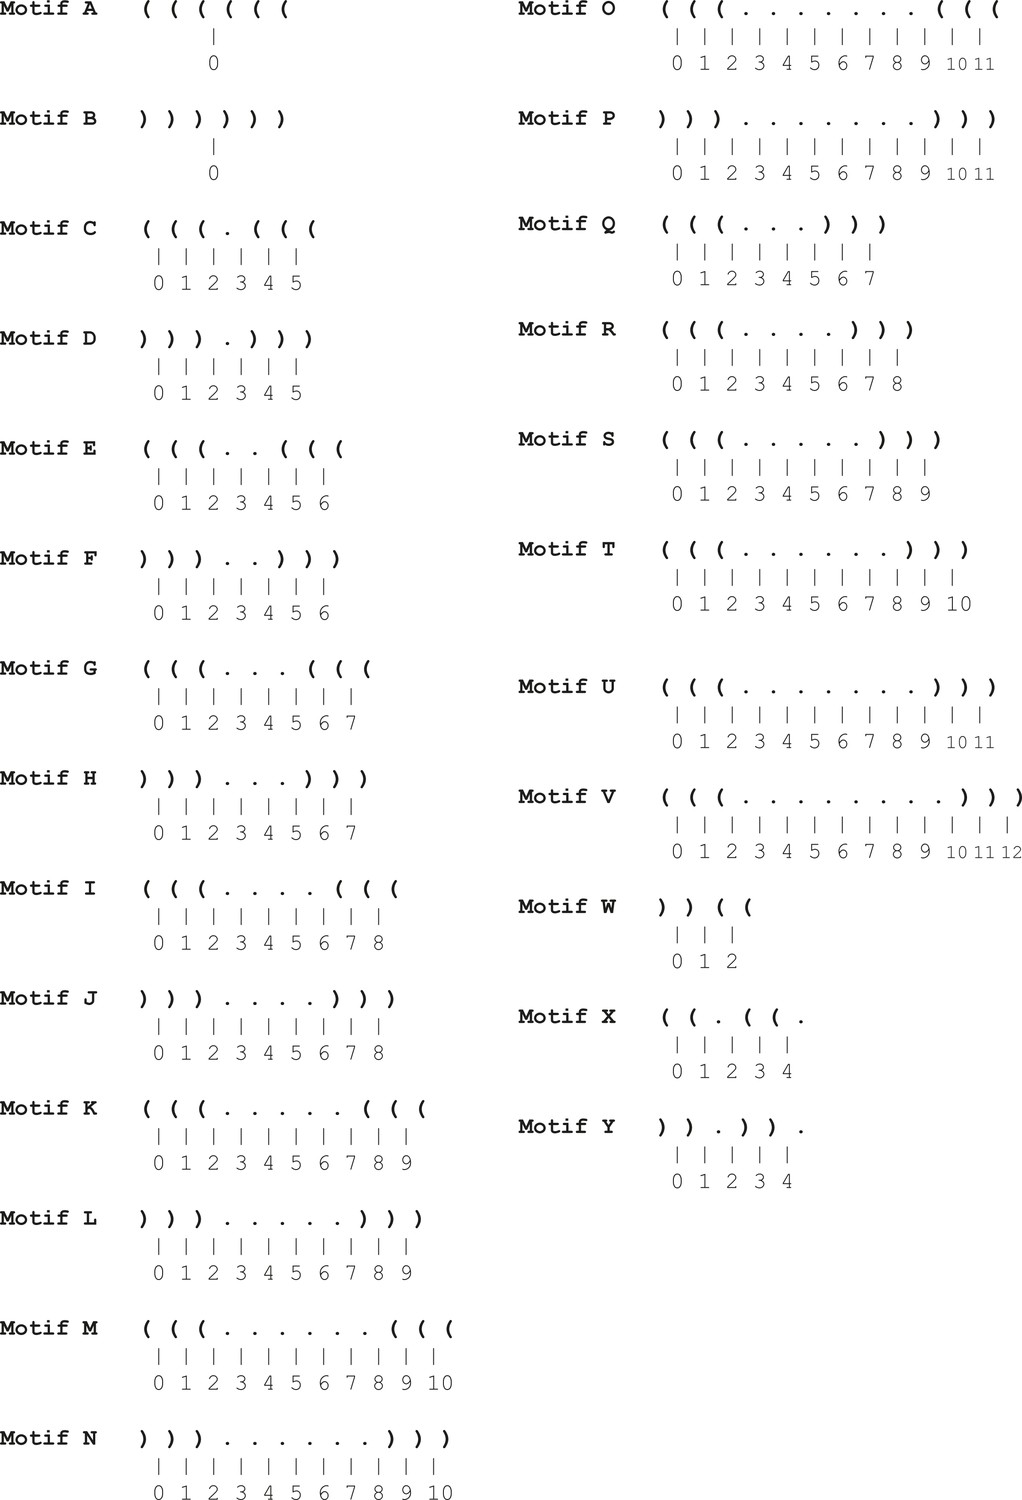
Secondary structure motifs used to classify RNA ligation products according to predicted secondary structures proximal to the ligation junction.
Open parentheses indicate that the base is paired to a downstream (3’) base. Closed parentheses indicate that a base is hybridized to an upstream (5’) base. Dots indicate unpaired bases. Lines and corresponding indices indicate the position of the ligation junction during classification.
Figure 2—figure supplement 4
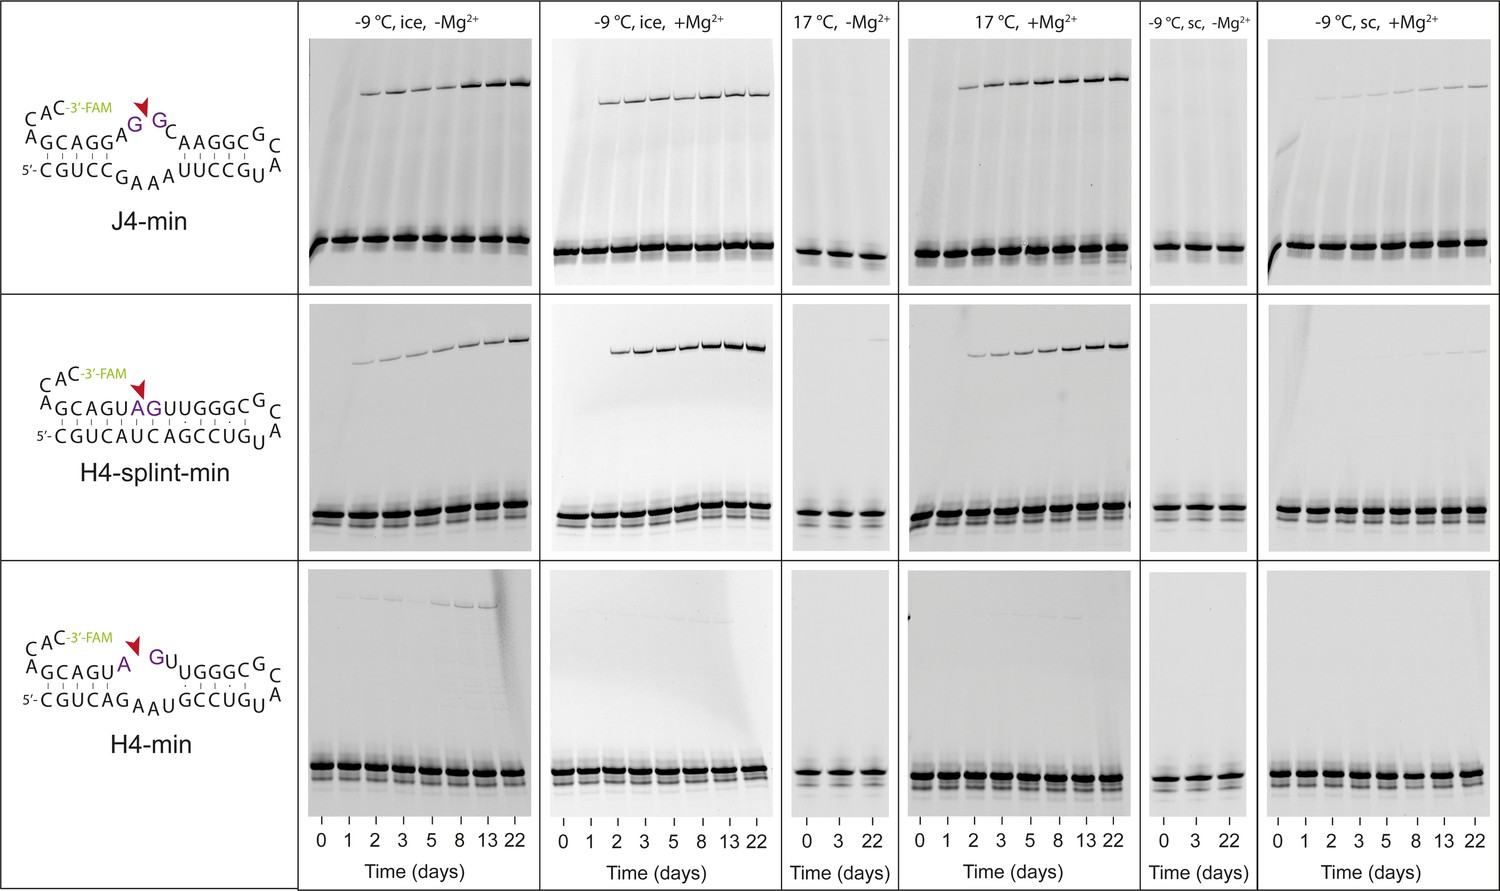
Characterization of ligation activity of minimized versions of H4, J4 (J4-min, H4-min) or a derived gapped duplex (H4-splint-min) RNA (Supplementary file 2) under different conditions.
For each RNA sample, aliquots from a single RNA master-mix were mixed with the respective reaction buffer (1 mM Tris•HCl, pH 8.3/25 °C, 25 mM NaCl, ±10 mM Mg2+) and incubated either at −9 °C under frozen (ice) or supercooled conditions (sc), or at 17 °C. Samples for Urea-PAGE analysis were collected after 1, 2, 3, 5, 8, 13 and 22 days. While J4-min and H4-splint-min are active under a range of conditions, H4-min only shows ligation under eutectic (−9 °C) conditions in the absence of Mg2+.
Figure 2—figure supplement 5
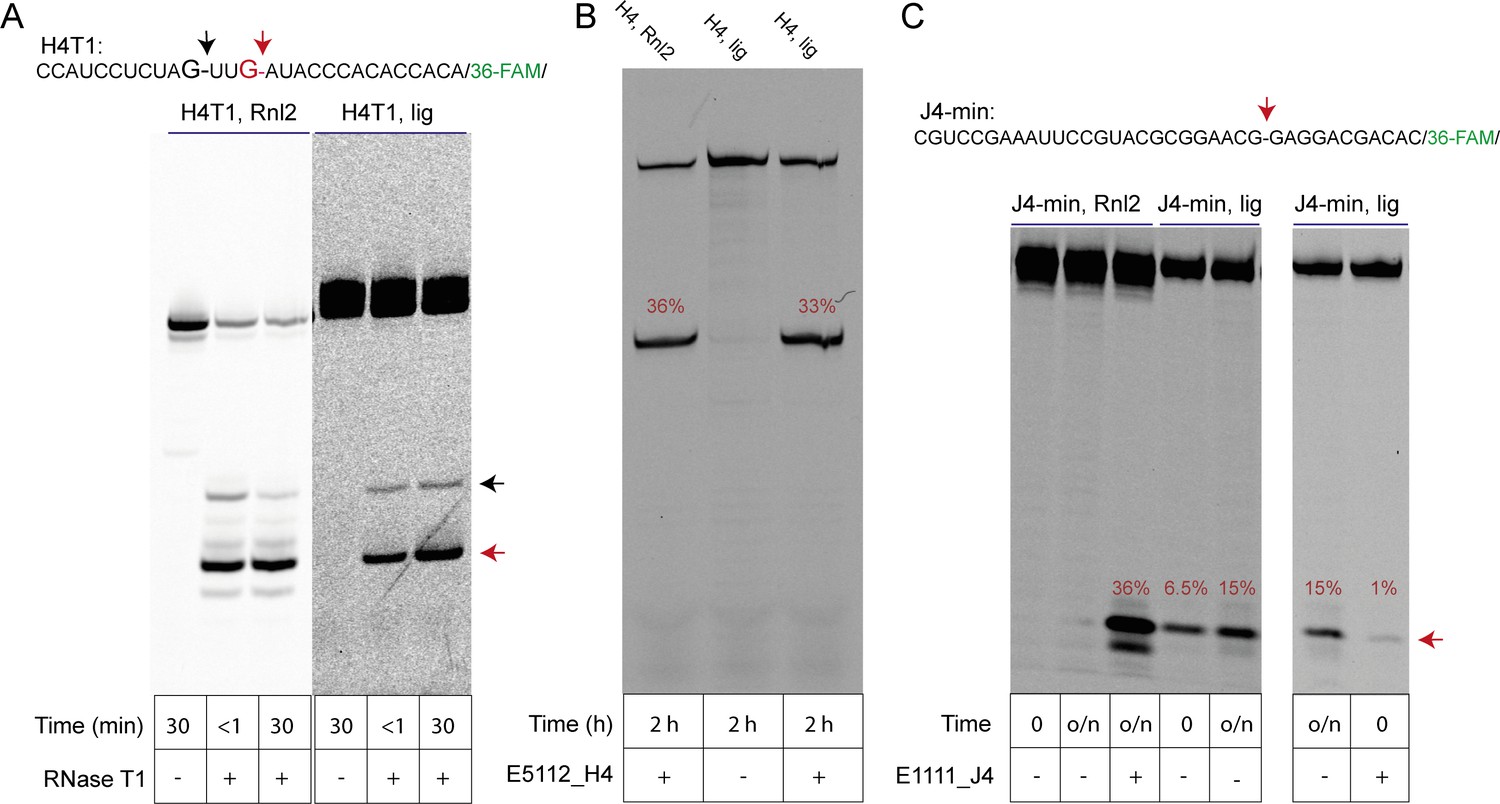
Analysis of regioselectivity of ligation by H4 and J4 RNA motifs.
(A) Partial RNAse T1 digest of T4-RNA Ligase 2 (Rnl2) ligated H4 (H4T) (Tab S2) and self-ligated H4T RNA. Regiospecific nuclease-catalysed cleavage at the ligation junction confirms that 3’−5’ linkages were formed in both ligation reactions. Note that cleavage of self-ligated H4T by RNAse T1 is slower due to the presence of the co-purified splint (H4_splintA) RNA used for in-ice H4T ligation. (B) A 3’−5’ regioselective 8–17 DNAzyme cleaves a typical self-ligated (H4, lig) or enzymatically ligated (H4, Rnl2) full-length H4 clone from the original semi-random RNA pool at the ligation junction with similar efficiencies. (C) A minimal J4 cis motif (J4-min) is unable to cleave an enzymatically produced 3’−5’ ligation site (J4-min Rnl2; lane 1, 2; 15 hr, RT, see Material and methods). In contrast, the same Rnl2 product is efficiently cleaved by a custom DNAzyme (lane 3, E1111_J4) under the same conditions. However, J4-min catalyses reverse cleavage of its own gel-purified in-ice ligation product, suggesting that the ligation reaction of J4 yields RNA with a 2’−5’ phosphodiester linkage. Rapid initial cleavage of self-ligated J4-min that occurs during the mixing dead time is inhibited after annealing of the J4-min RNA to the E1111_J4 DNAzyme, suggesting that the J4 internal loop is a prerequisite for rapid self-cleavage.
Figure 2—figure supplement 6
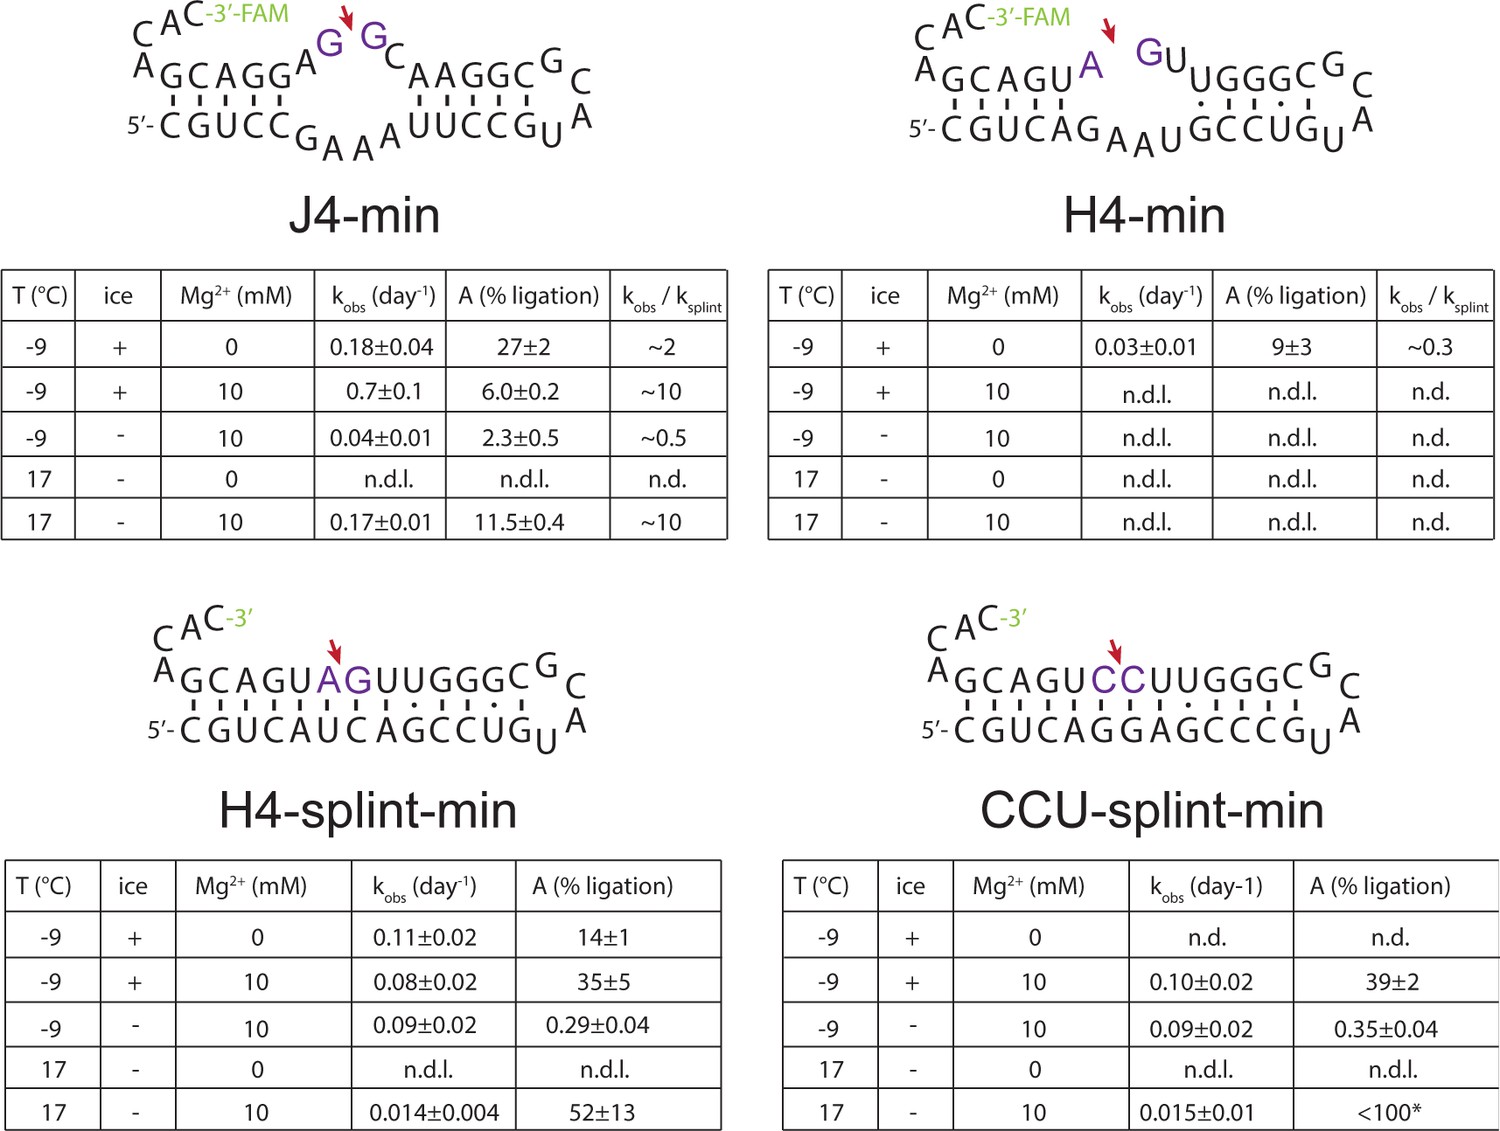
Apparent ligation rates of the minimized versions J4-min, H4-min and representative gapped duplexes (H4-splint-min, CCU-splint-min) under different conditions.
Apparent ligation rates (kobs) were determined by fitting normalized band intensities from Urea-PAGE (see Figure 2—figure supplement 4) with A⋅(1-exp(-kobs⋅t)), where A is the maximal ligation yield. Relative rate enhancements/decreases for J4-min and H4-min compared to gapped-duplexes were estimated by using the averaged apparent rate constants from H4-splint-min and CCU-splint-min) as reference.
Figure 3

Structure of J4-like motifs that occur in natural RNAs.
(A) J4 likely forms a purine-rich 4 × 4 internal loop classified as a triple-sheared GA motif (RNA 3D Motif Atlas id IL_93568.6) by JAR3D (Zirbel et al., 2015), which also occurs naturally in the 23S rRNA of Deinococcus radiodurans (Harms et al., 2008) (PDB ID: 2ZJR) and the Escherichia coli adenosylcobalamin riboswitch (Johnson et al., 2012) (PDB ID: 4GMA). (B) Consecutive GA base pairs in such internal loops have a strong stabilizing effect on the pseudohelical structure (Chen and Turner, 2006). Shown are the consensus motif (top) and the PDB overlay of the 4GMA (yellow) and 2ZJR (green) substructures. Note, the canonical 3’−5’ linkage between the G-1 and G+1 equivalents in 4GMA and 2ZJR is a 2’−5’ linkage in ligated J4. (C) In 2ZJR, the central A (red) of the GAAG coding strand forms a sheared AG base pair with the first G of the opposite CGGA motif (G-1 in J4) indicating that a similar conformation could exist in J4. The adenine moiety of the central A (red) is in close proximity to the 2’OH of the G-1 equivalent suggesting a potential catalytic activation of the 2’OH nucleophile in the reversible transesterification of the 2’−5’ phosphodiester bond between G+1 and G-1 in J4 through H-bonding.
Figure 4 with 4 supplements
Reactivity of semi-random sequence RNA pools with different 2’, 3’- or 5’-substituents
(A) Binary combinations of semi-random sequence bait and prey RNA pools and their reactivity as visualised by RT-PCR (B) after incubation at −9 °C or −80 °C (51 days). As in Figure 2B, smaller PCR products recovered at −80 °C (C) result from unspecific annealing of the RT-primer in the 3’-random region of the bait fragment. (C) Product size distributions from deep sequencing of bait>p × 5’OH-prey (green), bait-2’/3’p × 5’OH-prey (dark red), bait-OH × 5’p-prey (grey) and bait-OH × 5’OH-prey (light red) co-incubation reactions. (D) Nucleotide signature for products created by recombination of bait-2’/3’p × 5’OH-prey. The frequency of the four nucleotides is represented by a linear combination of RGB values (C-blue, U-red, A-green, G-yellow) resulting in mixed colours in random segments (Material and methods). The characteristic CpN signature at the presumed recombination site (arrow) indicates that the 5’-end of the full-length prey ligates to progressively truncated fragments of >p-activated bait suggesting recombination between bait and prey RNAs in both 2’, 3’ phosphorylated (bait-2’/3’p × 5’OH-prey) and unmodified RNA (bait-OH × 5’OH-bait) reactions.
-
Figure 4—source data 1
Source data for panel C.
- https://doi.org/10.7554/eLife.43022.024
Figure 4—figure supplement 1
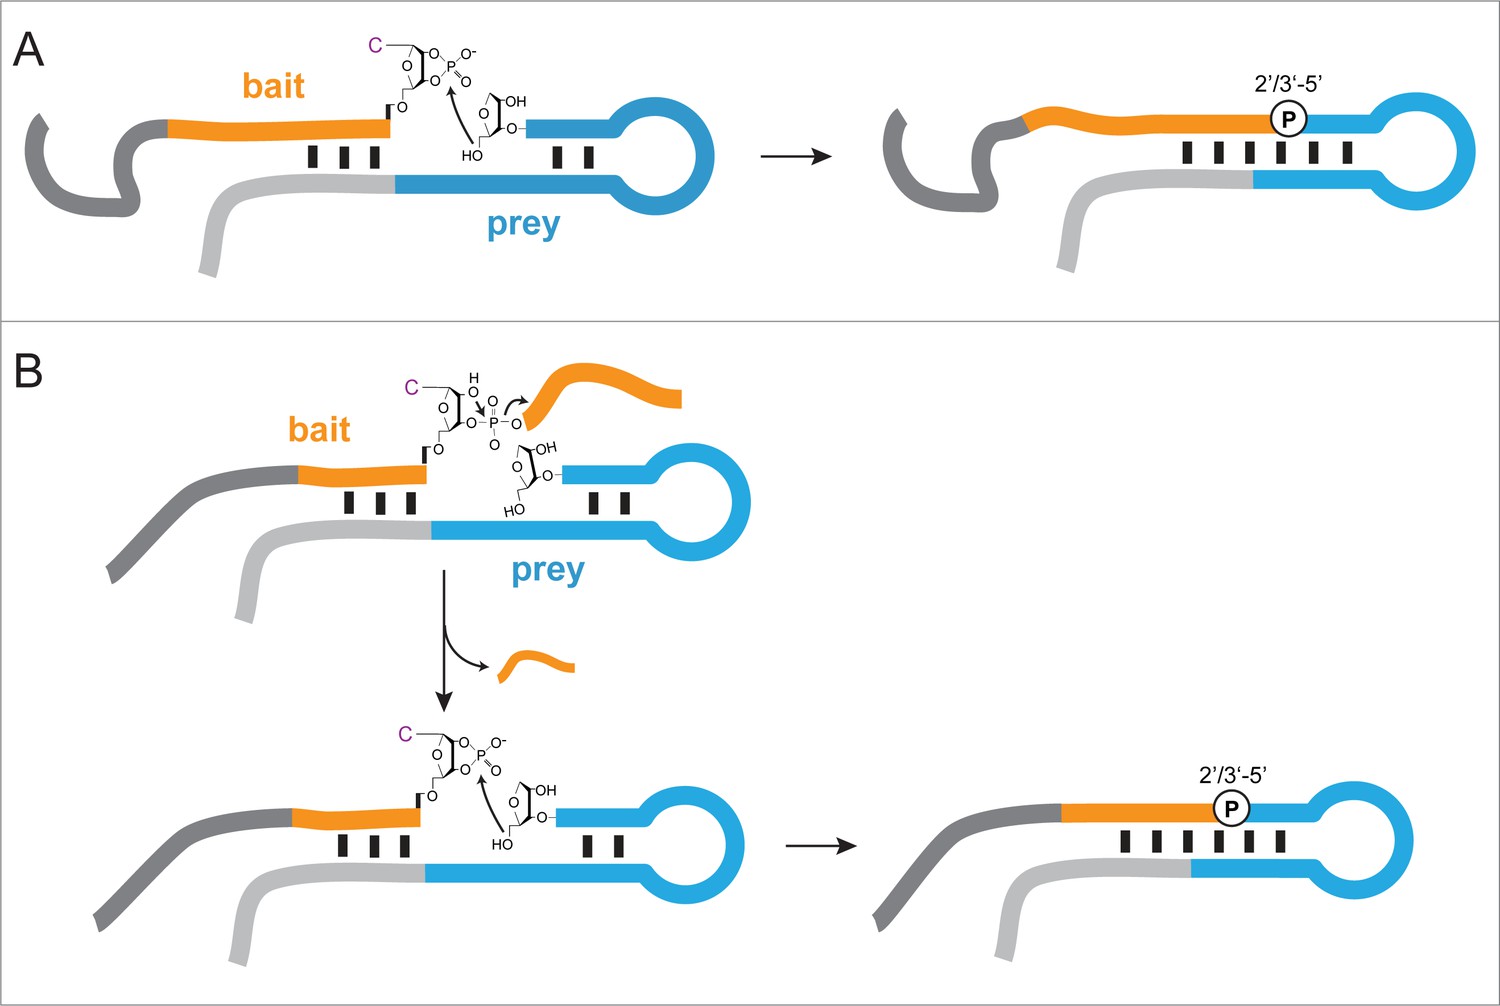
Proposed mechanisms of ligation/recombination in semi-random sequence RNA pools.
(A) Ligation of a >p activated semi-random RNA bait (orange – random segment, dark grey – constant segment) to a semi-random RNA prey (blue – random segment, light grey – constant region) illustrated as a schematic secondary structure with a typical hairpin motif. Ligation proceeds via nucleophilic attack of the prey 5’-OH on the terminal >p. Ligation is more efficient in junctions that are stabilized by base pairing and can result in either a 2’−5’ or a 3’−5’ phosphodiester linkage, with a strong bias towards the former. (B) Recombination is likely to proceed via a two-step mechanism. First, a non-hybridized 3’-terminal RNA fragment is cleaved by internal transesterification (or hydrolysis), resulting in a terminal >p, which subsequently enables ligation in a second step.
Figure 4—figure supplement 2
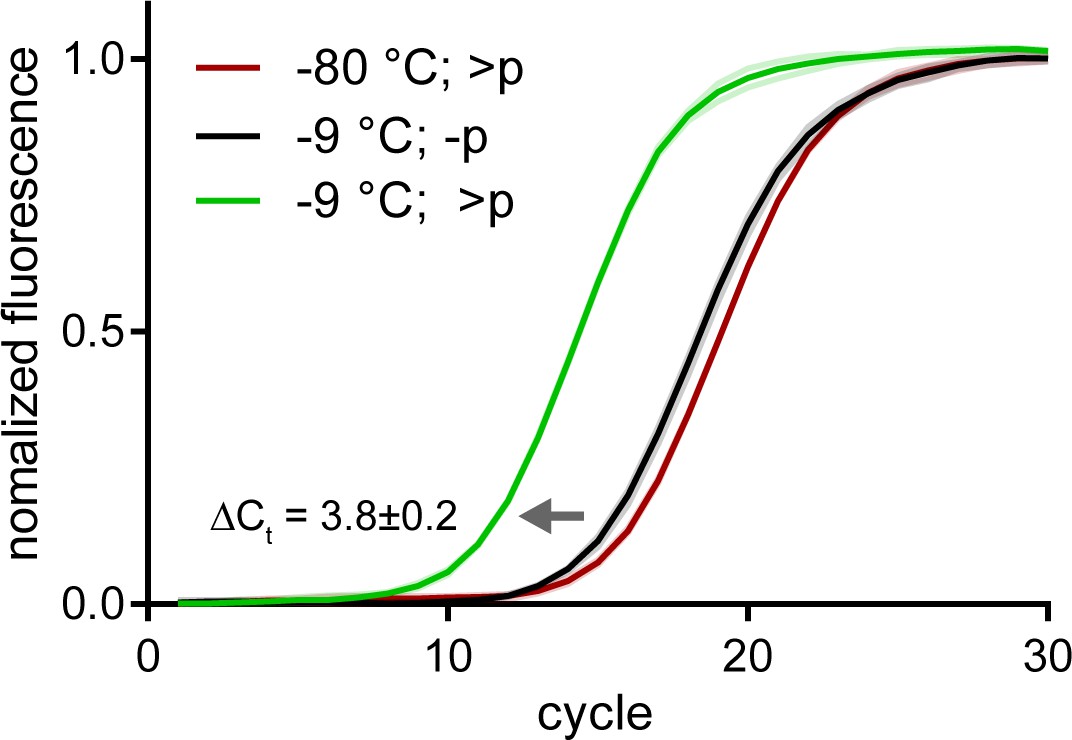
Spontaneous recombination in semi-random pools is much slower than direct >p activated ligation.
Normalized qRT-PCR traces of >p activated semi-random pools incubated at −9 °C (green) or −80 °C (red) for 20 days. Traces from qRT-PCR of non-activated semi-random pools incubated at −9 °C is shown in black. The ΔCt difference implies that levels of amplifiable srRNA products at that time point are ~10 fold higher in the >p reaction. Solid line (mean) and shaded areas (SD) are from n = 3 technical replicates.
-
Figure 4—figure supplement 2—source data 1
qRT-PCR data of >p ligation vs recombination.
- https://doi.org/10.7554/eLife.43022.020
Figure 4—figure supplement 3
Reactivity of 5’ppp activated semi-random sequence RNA pools under eutectic conditions.
(A) Agarose gel of RT-products from C120-N20-2’, 3’OH × 5’ppp-N20-C220 bait × prey reactions incubated at either -9 °C or -80 °C in 1 mM Tris•HCl, pH 8.3 / 25 °C, 25 mM NaCl, 10 mM Mg2+ for 7 months. As a comparison, the same reaction is shown with the non-activated 5’OH semi-random C120-N20>p × 5’OH-N20-C220 bait × prey pair from Figure 4C. (B) Size distributions of the sequenced product reaction from (A) vs the same reaction with a C120-N20>p × 5’OH-N20-C220 pair. (D) Color-coded nucleotide signatures of products from the cDNA libraries derived from the gel shown in (A).
-
Figure 4—figure supplement 3—source data 2
Source data for panel B.
- https://doi.org/10.7554/eLife.43022.022
Figure 4—figure supplement 4

Hypothetical ligation/recombination products that can form in semi-random RNA pools but remain undetectable by RT-PCR.
(A) Examples for non-detectable bait >p / 5’OH-prey ligation products such bait concatemers, circular baits or branched 2’−5’/3’−5’ lariat structures that can potentially result from in-line attack of an internal 2’-OH on a >p moiety. Constant regions are shown in grey, random regions are shown in orange (bait) or blue (prey). The (*) denotes lariat structures, which would likely block reverse transcription (Ruskin et al., 1984) despite the correct polarity of the constant primer binding regions (B) Similar examples for products from recombination reactions, which cannot be detected by RT-PCR.
Figure 5 with 1 supplement
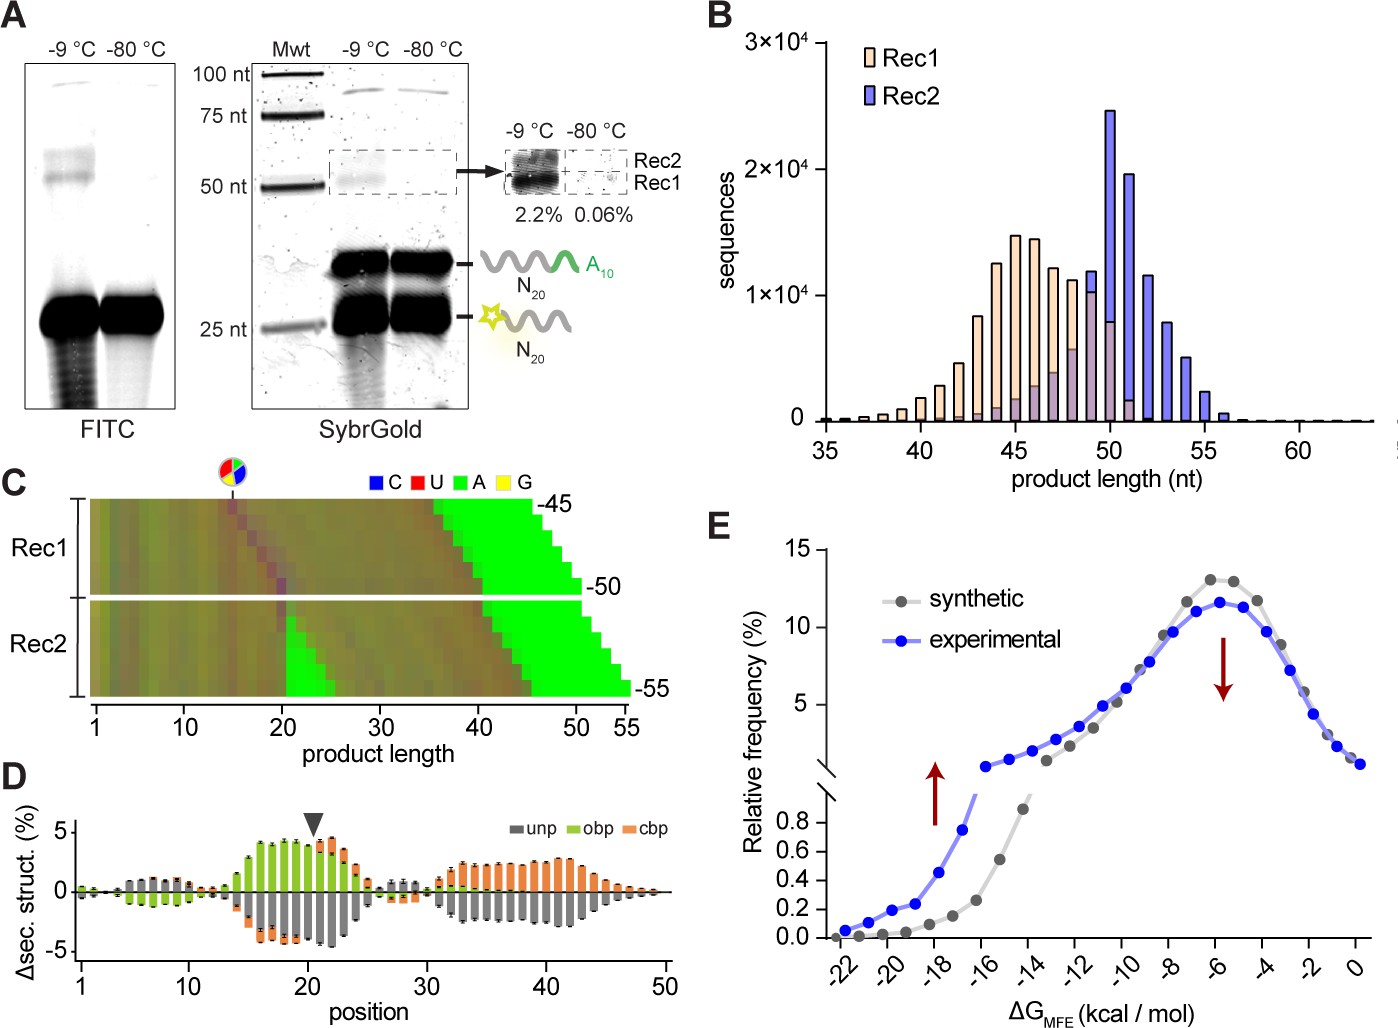
Reactivity of unmodified random RNA pools.
(A). Denaturing gel electrophoresis of unmodified N20A10 and FAM-N20 RNA pools after incubation (−9 °C or −80 °C, 5 months) imaged both for FITC fluorescence (showing FAM-N20 and its products) (left panel) and after SYBRGold staining (showing all RNAs). Two main product bands (Rec1, Rec2) are apparent. Note the RNA degradation products arising upon prolonged -9 °C but not -80 °C incubation. (B) Size distributions of the sequenced Rec1 (yellow) and Rec2 (blue) bands. (C) Color-coded nucleotide frequencies of Rec1 and Rec2 sequences recovered (according to the protocol shown in Figure 5—figure supplement 1A,B). (D) Average base-pairing differences between the experimental 50mer product pool from Rec1 and randomly generated in silico sequence pools (N = 3; 300,000 sequences each) using the experimental nucleotide frequencies from (C) with secondary structure calculated using RNAfold. Grey indicates predicted unpaired (unp) nucleotides, green nucleotides involved in opening base pairs (obp) and orange closing base pairs (cbp). Standard deviations are shown in black. (E) Predicted energies of the minimal free energy (MFE) structures from the three experimental and in silico pools (as in (D)) suggest that recombination product pools show enhanced folding stabilities. Note that the error bars for the energies calculated from the three synthetic datasets are too small to be displayed.
-
Figure 5—source data 1
Source data for panel B, D, and E.
- https://doi.org/10.7554/eLife.43022.029
Figure 5—figure supplement 1
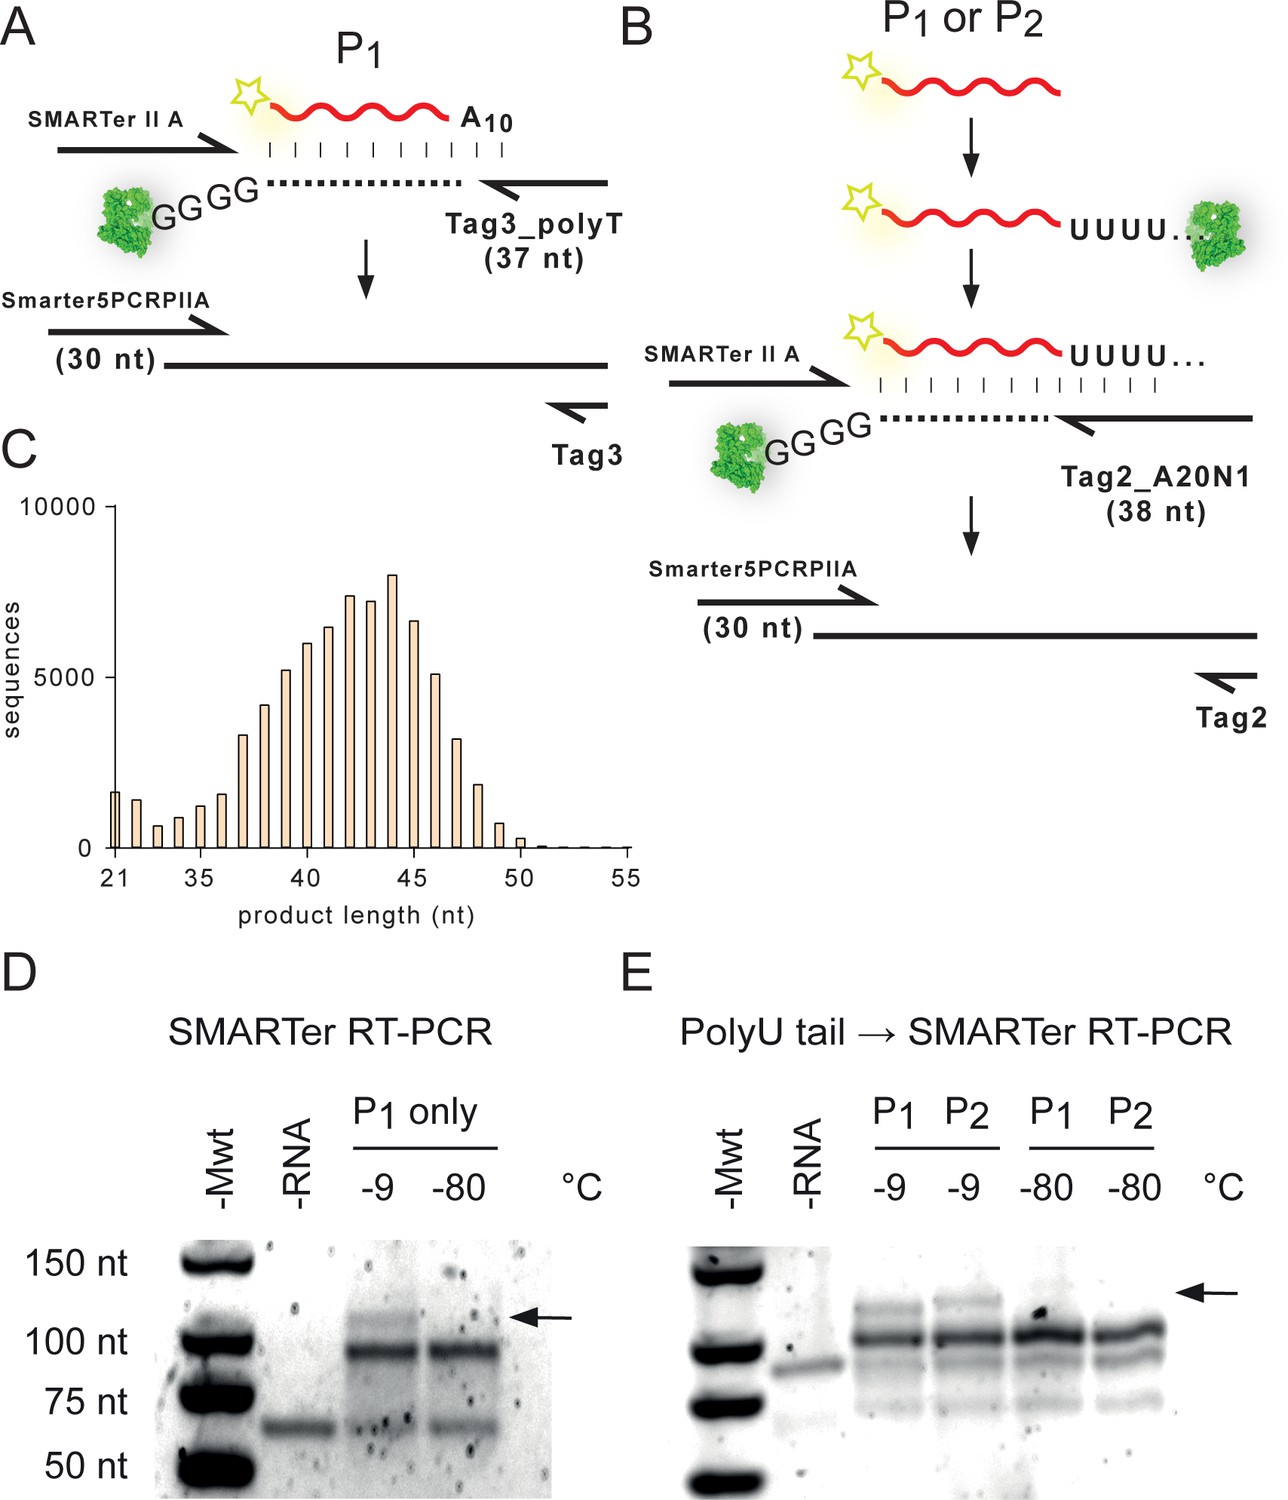
Recovery of products from unmodified RNA N20 / N20A10 recombination reactions (Figure 5).
(A) The gel-purified P1 (Rec1) RNA product was converted into cDNA by SMARTer RT using Tag3_polyT primer (Supplementary file 3) and the proprietary SMARTer II A oligonucleotide. The resulting cDNA was amplified using the Smarter5PCRPIIA/Tag3 primer pair (Supplementary file 3). (B) To recover recombination products devoid of the A10 tag (e.g. from N20 × N20), or containing internal polyA tracts (e.g. from N20A10 × N20A10), both P1 (Rec1) and P2 (Rec2) products were first polyuridinylated, and then reverse transcribed using the Tag2_A20N1 primer before cDNA amplification using the Smarter5PCRPIIA/Tag2 primer pair (Supplementary file 3). (C) Size distribution of recovered cDNA sequences obtained from (A) by Illumina deep sequencing. (D) Agarose gel electrophoretogram of the SMARTer RT-PCR amplicons from (A). Recombination products (>82 nt, black arrow)) are only visible from samples incubated at −9 °C. The non-reacted N20A10 DNA product (expected size ~82 nt) is the only RNA-specific band after incubation at −80 °C. (E) Corresponding electrophoretogram from the recovery protocol shown in (B), using the additional polyuridinylation step before SMARTer RT-PCR. Again, the non-reacted N20A10 DNA product (expected size ~96 nt in this workup) is the only RNA-specific band after incubation at −80 °C. No higher molecular weight cDNA product is produced in RNA samples incubated at −80 °C.
-
Figure 5—figure supplement 1—source data 1
Source data for panel C.
- https://doi.org/10.7554/eLife.43022.028
Figure 6 with 5 supplements

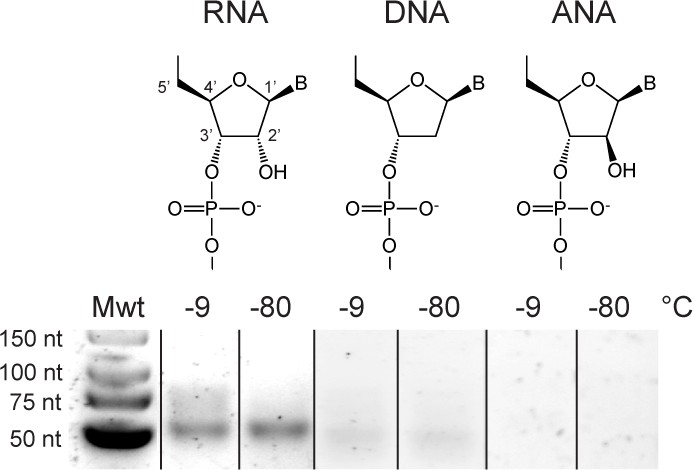
Reactivity of unmodified semi-random sequence pools of RNA and related genetic polymers.
Binary combinations of semi-random sequence bait and prey pools of RNA, DNA, ANA, HNA and AtNA and their reactivity are visualised by RT PCR as in Figure 4. (A) In contrast to semi-random sequence pools of RNA (left panel), DNA and ANA pools show no detectable recombination (−9 °C, 5 months). (B) Unmodified semi-random sequence RNA and AtNA pools show recombination after a brief exposure to alkaline pH, while HNA does not. Note that the typical low-molecular weight band seen in −80 °C negative control reactions is reduced or absent potentially due to the pre-incubation NaOH treatment, which leads to fragmentation of semi-randomers (in the case of RNA and AtNA) and the generally lower RT-sensitivity for HNA and AtNA. (C) Size distributions of the RNA (teal) and AtNA (light red) recombination products. Compared to previous experiments (see Figures 4 and 5) RNA recombination products are biased towards shorter fragments, presumably due to increased hydrolysis during NaOH treatment. (D) Color-coded nucleotide signatures of AtNA recombination products from (B) shows similar bait segment truncation as in RNA (see Figure 4) but with a distinct ApN ligation signature.
-
Figure 6—source data 1
Source data for panel C.
- https://doi.org/10.7554/eLife.43022.037
Figure 6—figure supplement 1
Addition of Zn2+ does not promote ligation/recombination in semi-random sequence DNA or ANA pools while seeming to inhibit recombination in semi-random sequence RNA pools.
Reaction conditions were as in Figure 6A but with addition of 10 mM ZnCl2.
-
Figure 6—figure supplement 1—source data 1
Source data for panel A.
- https://doi.org/10.7554/eLife.43022.032
Figure 6—figure supplement 2
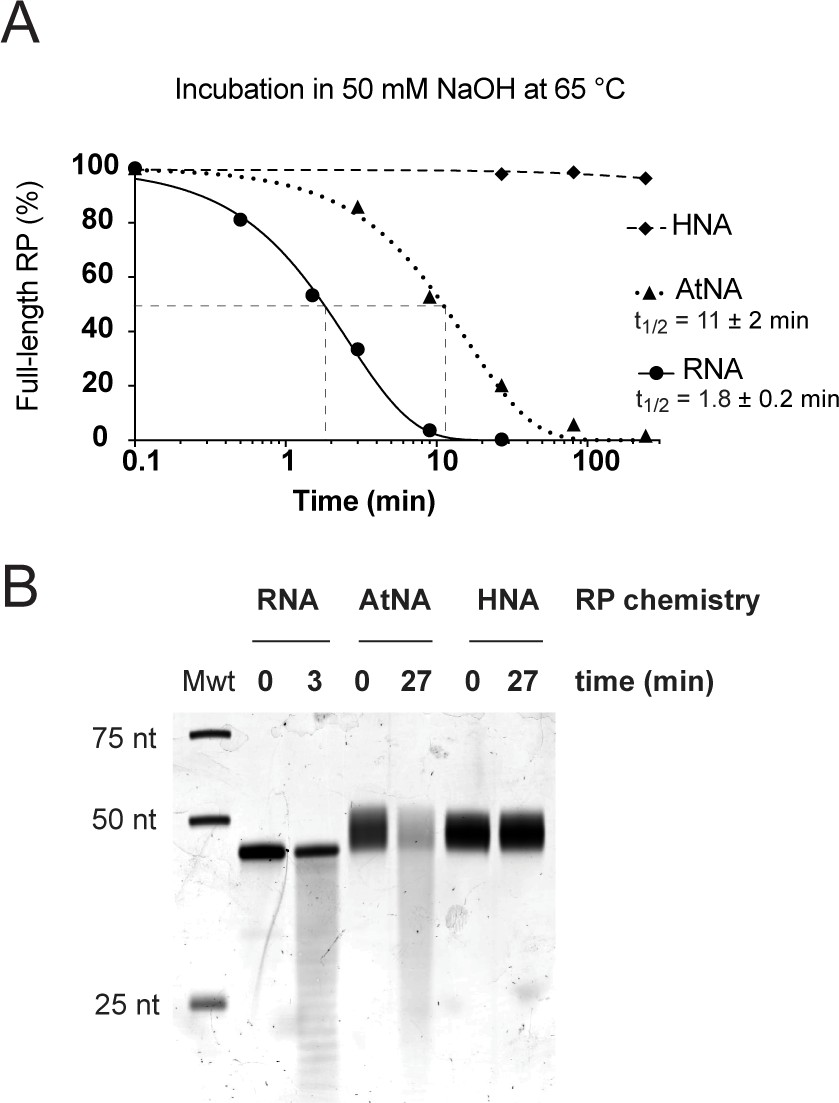
Susceptibility of RNA, HNA and AtNA oligomers to alkaline pH induced hydrolysis.
(A) Fraction of full-length C1-bait semi-random sequence pool (RP) composed of either RNA, HNA or AtNA remaining during incubation in 50 mM NaOH at 65 °C as a function of time, as determined by Urea-PAGE and densitometry of samples neutralized with 1 M Tris•HCl (pH 7.4), stained with SYBR Gold (ThermoFisher Scientific). Half-lives (t1/2) for hydrolysable chemistries (RNA and AtNA) were determined by non-linear regression using GraphPad Prism. (B) Urea-PAGE of C1-bait pools (RP) composed of either RNA, HNA or AtNA following partial hydrolysis for 3 min (RNA) or 27 min (AtNA), stained with SYBR Gold (ThermoFisher Scientific). Both RNA and AtNA show alkaline pH induced hydrolysis, while HNA is inert.
Figure 6—figure supplement 3
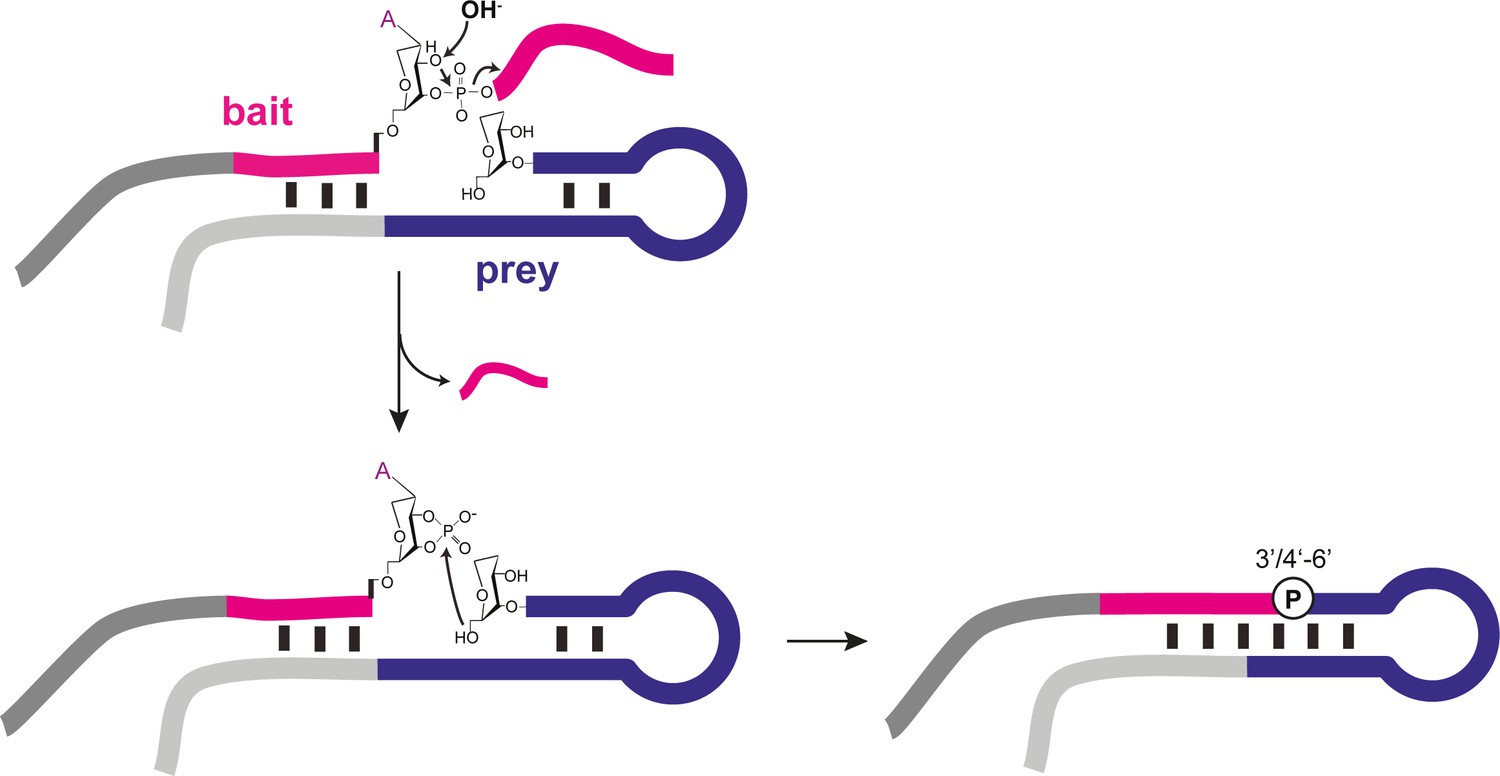
Proposed recombination mechanism of semi-random sequence AtNA pools.
Alkaline pH (OH-) treatment of AtNA (and RNA, not shown) catalyses backbone cleavage and formation of a 3’, 4’ cyclic phosphate (>p), which acts as the activating group for re-ligation through nucleophilic attack of an adjacent 6’OH (analogous to RNA 5’OH, Figure 4—figure supplement 1).
Figure 6—figure supplement 4
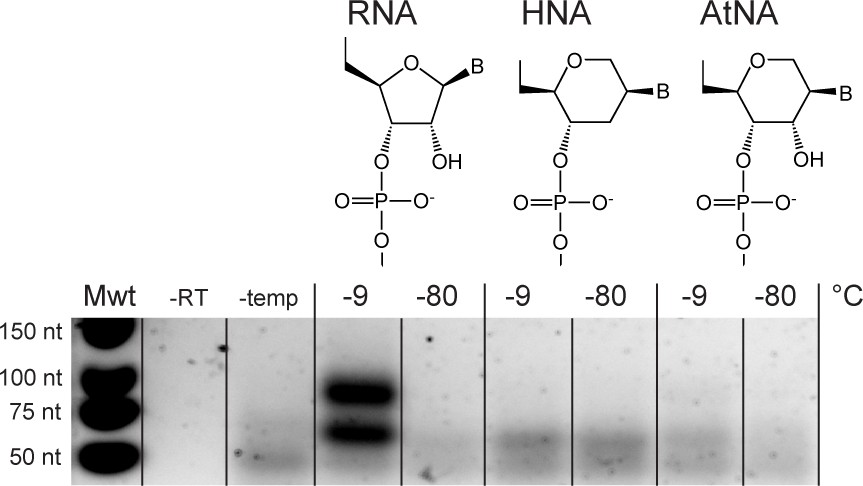
Without alkaline pH (NaOH) treatment, recombination is only efficient in semi-random RNA pools.
Only a very weak recombination band of the expected size is observed for AtNA but yields were not sufficient for sequencing library preparation. No recombination is observed for HNA. Experimental conditions were the same as in Figure 6B but without NaOH incubation prior to incubation. Negative controls omitting RT polymerase, or template, are denoted by (–RT) and (-temp), respectively.
Figure 6—figure supplement 5
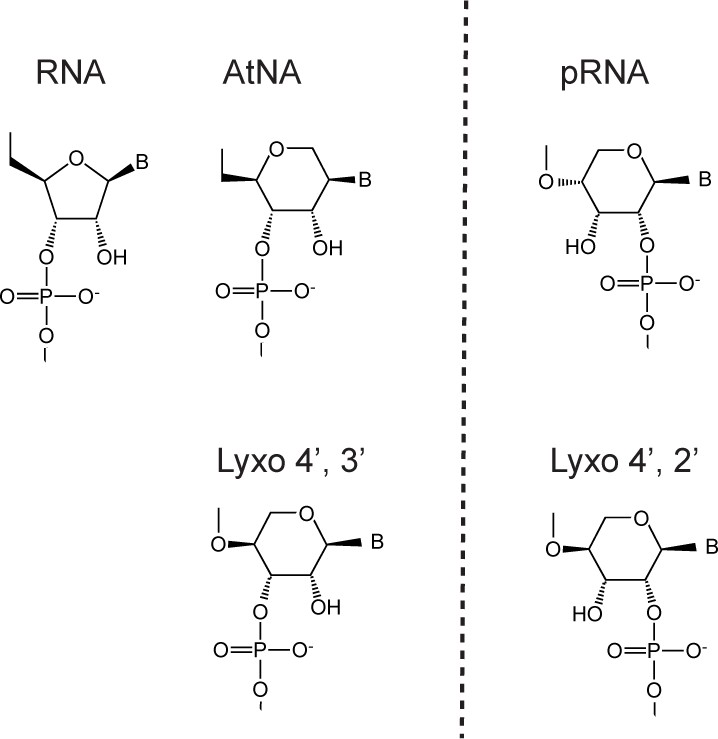
Natural and synthetic polymers with vicinal diols (presumably) enabling ligation/recombination: ribonucleic acid (RNA), altritol-nucleic acid (AtNA), pyranoysl-RNA (pRNA) and (4'→3') or (4'→2') lyxopyranosyl-RNA (Lyxo). Genetic polymers to the left of dotted line (AtNA, Lyxo4', 3') can crosspair with natural nucleic acids, while polymers to the right (pRNA, Lyxo 4', 2') are orthogonal to the natural system.
https://doi.org/10.7554/eLife.43022.036
Figure 7 with 1 supplement
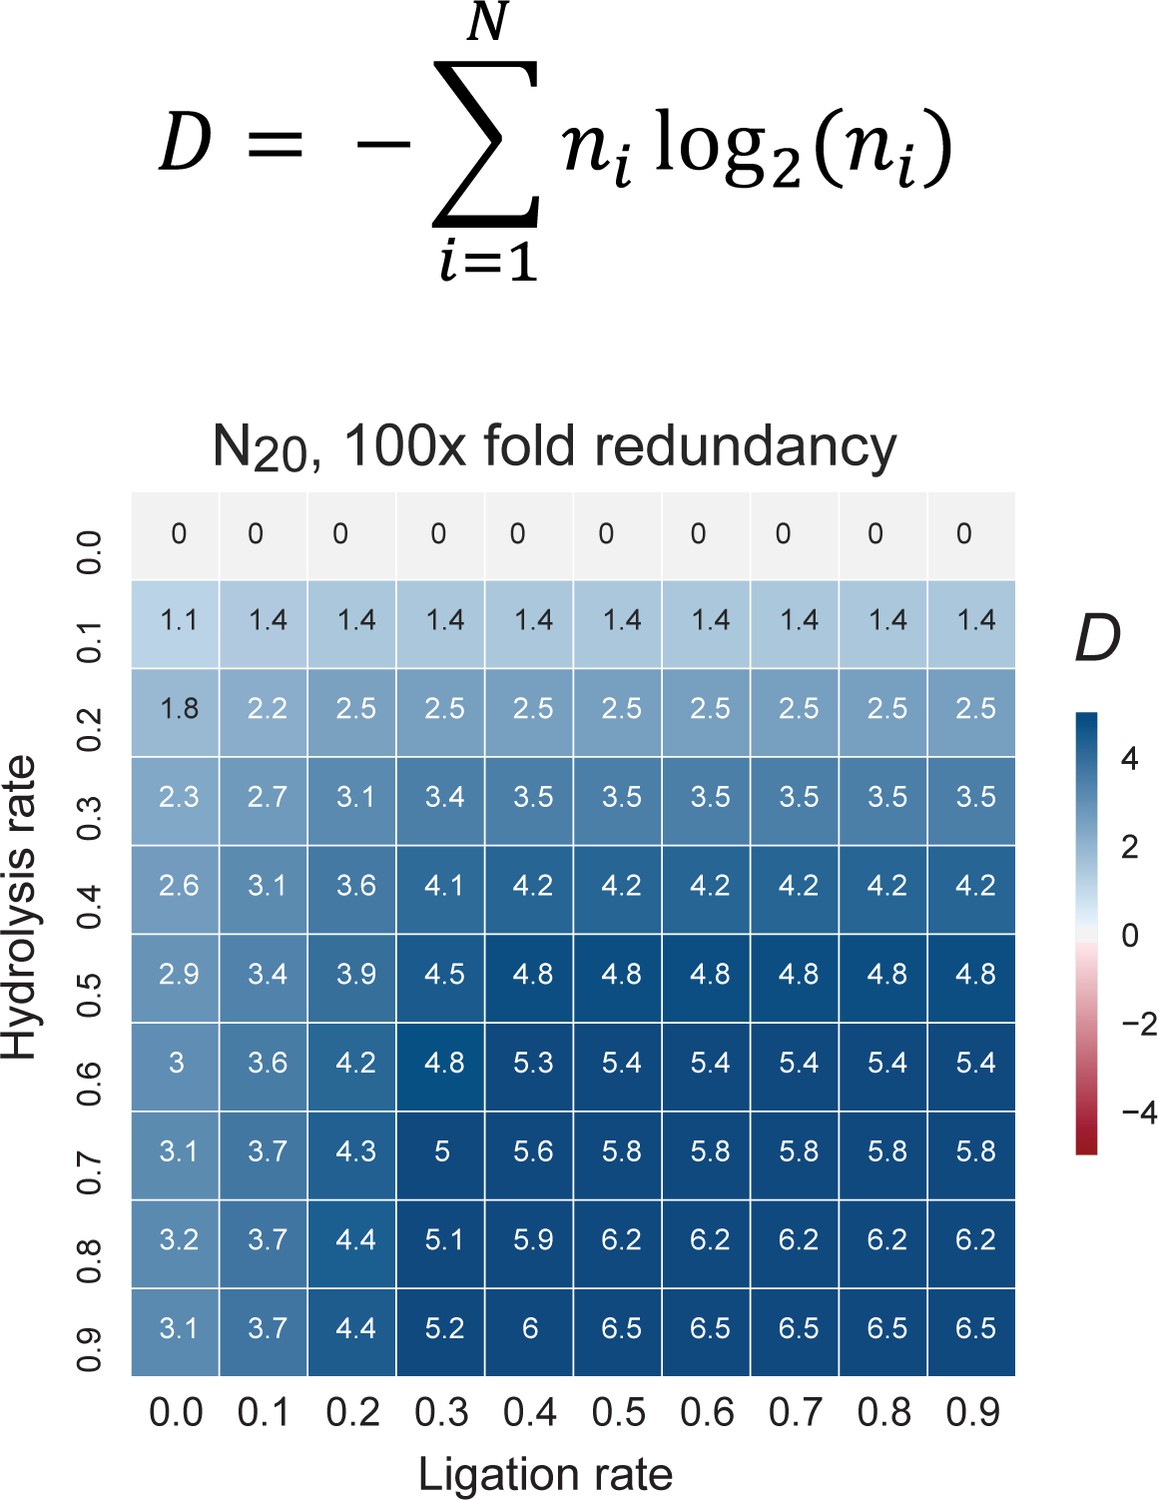
The change in information content in a random sequence pool as a consequence of recombination.
Informational content / complexity change is computed as the population level Shannon entropy (Diversity index: D (Derr et al., 2012)), where N is the total number of unique sequences in the pool, and ni is the proportion of individuals belonging to the ith unique sequence. D is zero if all molecules are identical and D is maximal when molecules are uniformly distributed through sequence space (top panel). D changes after recombination of a N20 4-letter code, random sequence pool of 100-fold redundancy (each sequence is present in 100 copies). The difference of pool diversity before and after recombination (ΔD) plotted as a heat map as a function of hydrolysis and ligation rates (bottom panel). Under these boundary conditions (mimicking the RNA pools experimentally analysed for example in Figure 5), D increases under all examined combinations of hydrolysis and ligation rates.
Figure 7—figure supplement 1
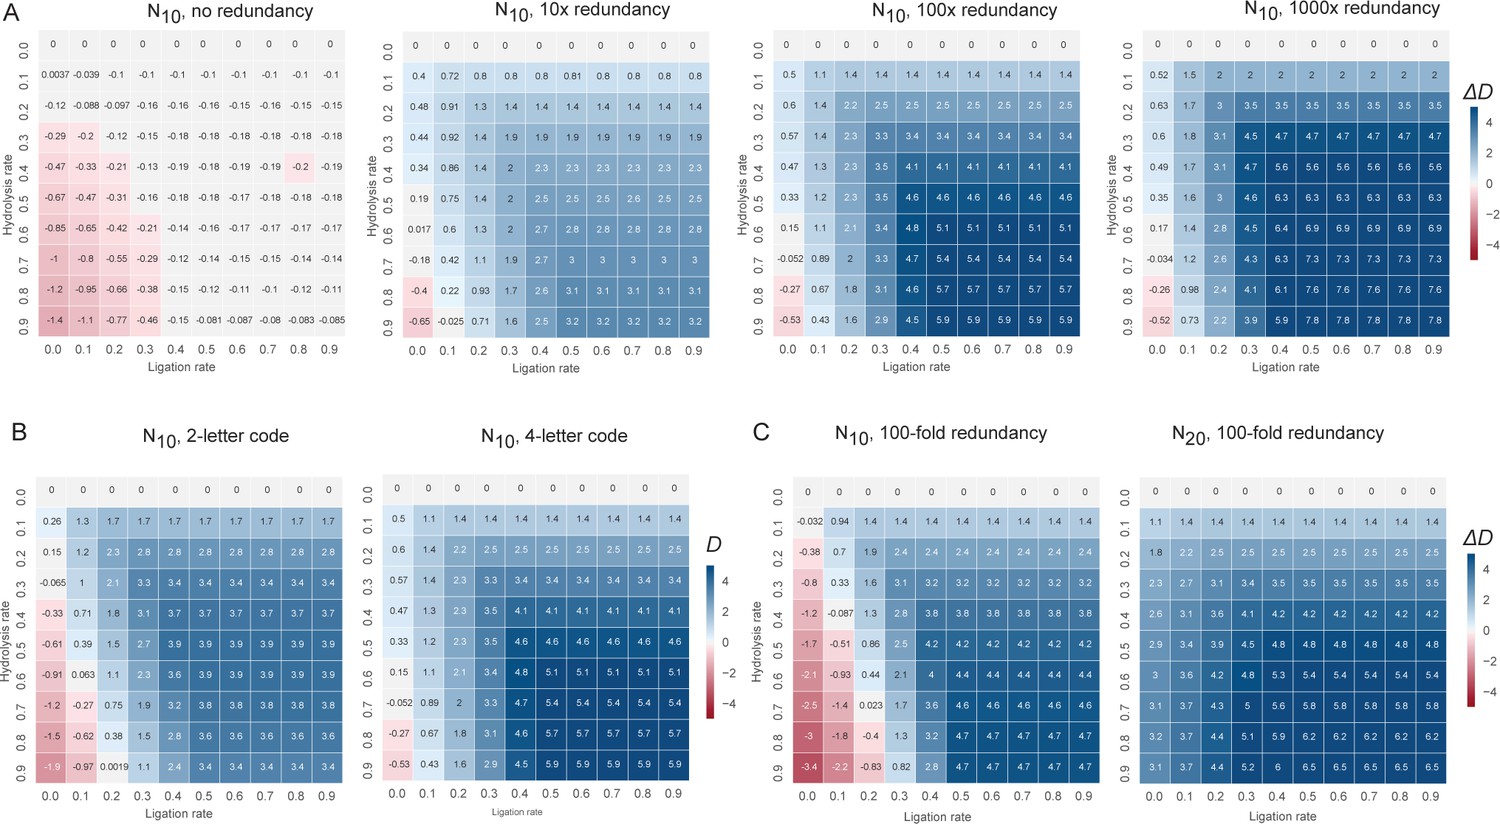
The change in information content in a random sequence pool as a consequence of recombination under different boundary conditions.
Informational content /complexity change is computed by the population level Shannon entropy (Derr et al., 2012) (Diversity index: D), where N is the total number of unique sequences in the pool, and ni is the proportion of individuals belonging to the ith unique sequence. D is zero if all molecules are identical and D is maximal when molecules are uniformly distributed through sequence space. (A) D changes after recombination of a N10 4-letter code, random sequence pool of different pool redundancy (from left to right) (ranging from no redundancy (all sequence are unique) to 1000-fold redundancy (each sequence is present in 1000 copies) are plotted as a heat map and a function of hydrolysis versus (vs.) ligation rates. D increase scales with redundancy, with non-redundant pools losing information (D change negative) under all conditions, while highly redundant pools gain information (D change positive) under all but the highest hydrolysis rates. (B) D changes after recombination of a N10 2-letter (left panel) vs. 4-letter (right panel) code, random sequence pool (with 100-fold redundancy) are plotted as a heat map as a function of hydrolysis and ligation rates. D increase scales with code complexity, with information gains from recombination higher in a more information-rich 4-letter code than in a binary code. (C) D changes after recombination of a N10 (left panel) vs. N20 (right panel) 4-letter code, random sequence pool of equal size (with 100-fold redundancy) are plotted as a heat map as a function of hydrolysis and ligation rates. D increase scales with oligomer length, with information gains from recombination higher in more information-rich pool of longer oligomers.
Scheme 1
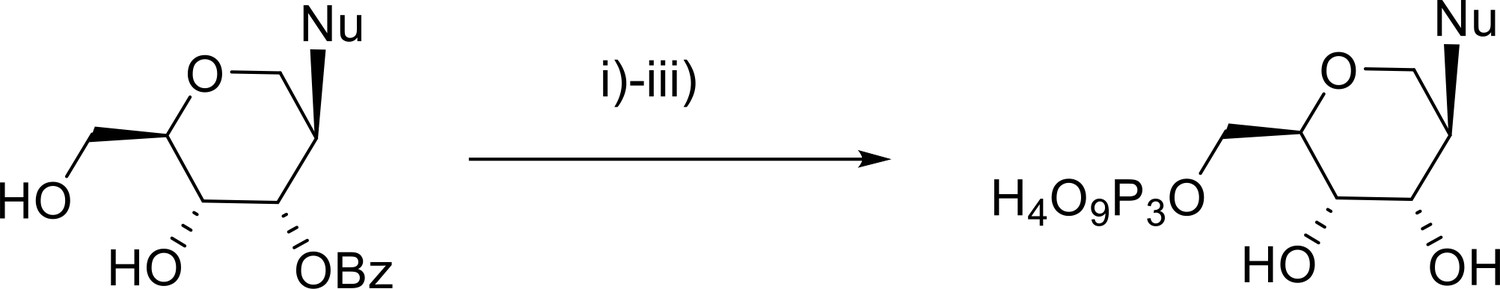
Nu = ABz, CBz, dmfG, and U.
i) POCl₃, trimethylphosphate; ii) tetrabytylammonium pyrophosphate, NBu3, DMF; iii) 25% NH3.
Videos
Video 1
Animated scan through all sequenced products of different length of a C120-N20-2’/3’p (bait) × 5’OH-N20-C220 (prey) recombination reaction.
The nucleotide signature of the different-length products indicate that they were predominantly formed through ligation of full-length prey to truncated and therefore >p activated bait segments.
Additional files
-
Source Code 1
Example shell script for the extraction of the sequence length distributions from a FASTA file.
- https://doi.org/10.7554/eLife.43022.041
-
Source Code 2
Python script for the generation of FASTA files containing random DNA sequences based on a given nucleotide distribution.
The script requires a tab-separated ASCII-file containing tab-separated frequencies (0–1) of the bases A,C,G,T,N as input.
- https://doi.org/10.7554/eLife.43022.042
-
Source Code 3
Shell script for the extraction of dot-bracket frequencies.
Requires RNAfold and a FASTA-file as input.
- https://doi.org/10.7554/eLife.43022.043
-
Source Code 4
Shell script used to identify frequent ligation motifs using an RNAfold file as input.
- https://doi.org/10.7554/eLife.43022.044
-
Source Code 5
Python script for the simulated recombination reactions and Shannon Index calculations.
- https://doi.org/10.7554/eLife.43022.045
-
Supplementary file 1
Quantification of N20>p ligation products (Urea-PAGE, stained with SYBRgold).
- https://doi.org/10.7554/eLife.43022.046
-
Supplementary file 2
RNA oligonucleotides used in this study.
- https://doi.org/10.7554/eLife.43022.047
-
Supplementary file 3
DNA oligonucleotides used in this study.
- https://doi.org/10.7554/eLife.43022.048
-
Transparent reporting form
- https://doi.org/10.7554/eLife.43022.049
Download links
A two-part list of links to download the article, or parts of the article, in various formats.
Downloads (link to download the article as PDF)
Open citations (links to open the citations from this article in various online reference manager services)
Cite this article (links to download the citations from this article in formats compatible with various reference manager tools)
Random-sequence genetic oligomer pools display an innate potential for ligation and recombination
eLife 7:e43022.
https://doi.org/10.7554/eLife.43022


