Neurogenetic dissection of the Drosophila lateral horn reveals major outputs, diverse behavioural functions, and interactions with the mushroom body
- Howard Hughes Medical Institute, Janelia Research Campus, United States
- MRC Laboratory of Molecular Biology, United Kingdom
- University of Cambridge, United Kingdom
Figures
Figure 1 with 1 supplement
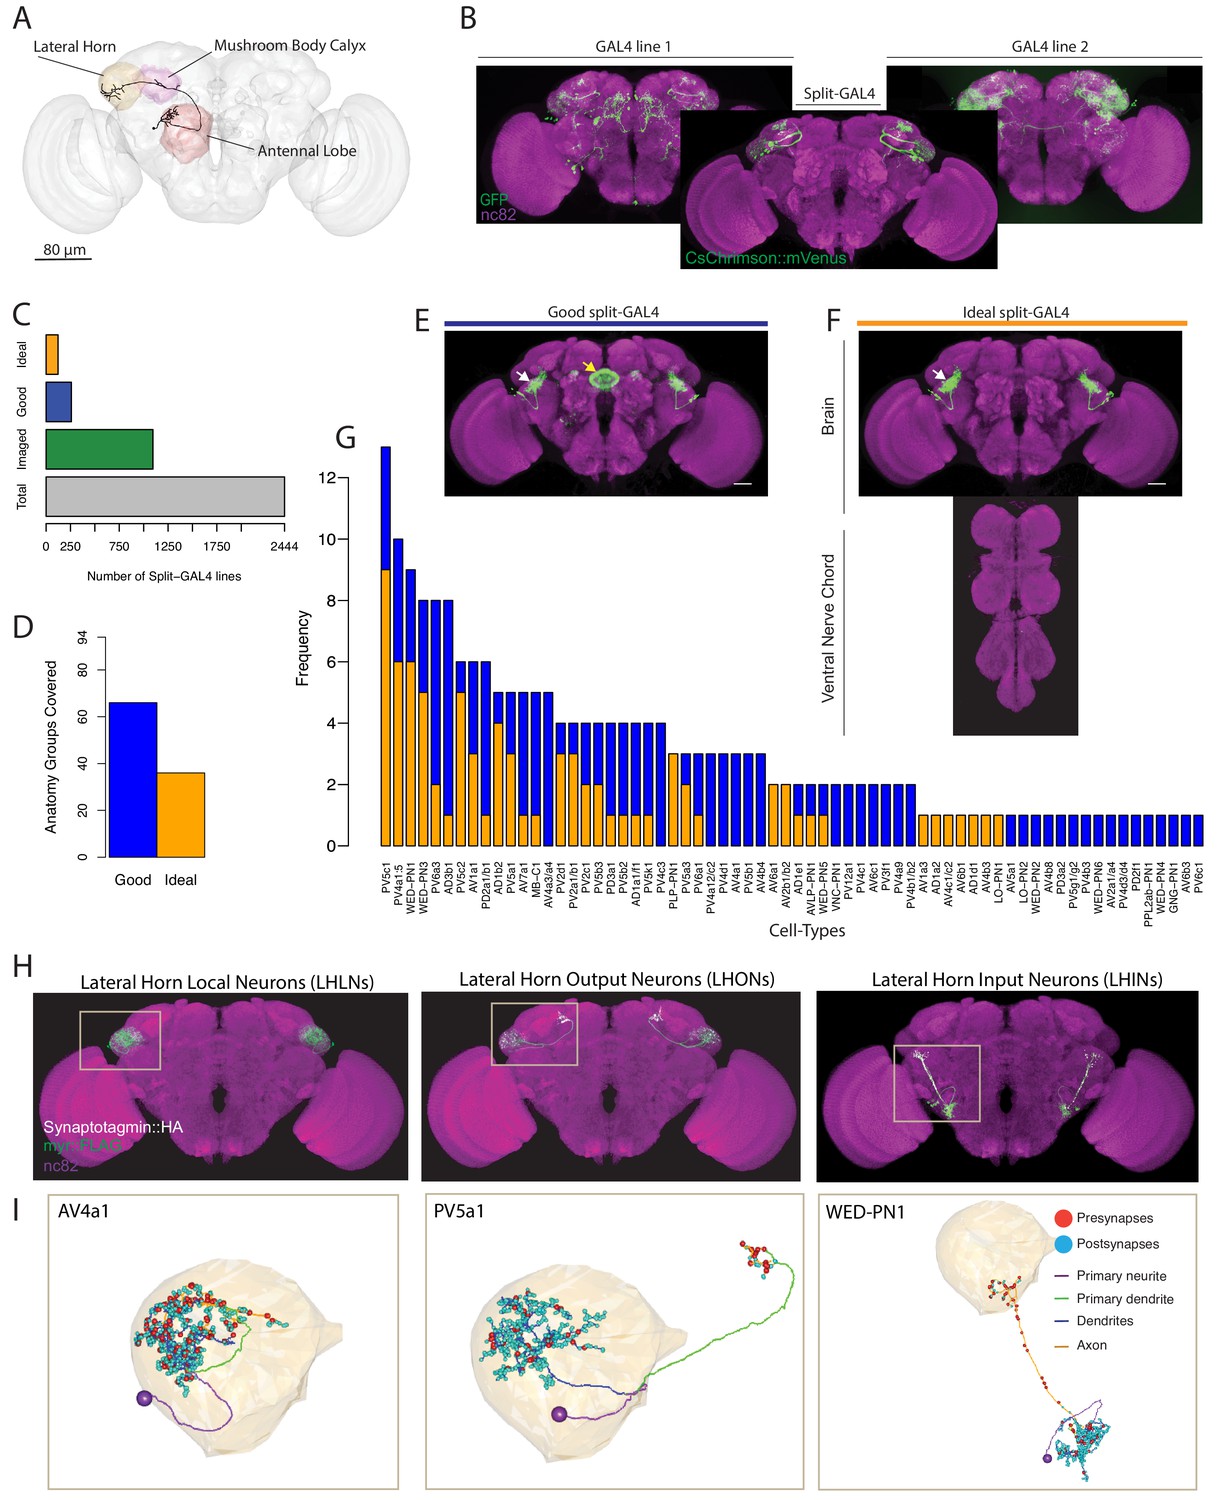
Generation and characterisation of a split-GAL4 lines for LH neurons.
(A) A volume rendering of the adult Drosophila brain (grey) with the antennal lobe (red), mushroom body calyx (magenta) and lateral horn (yellow) neuropils labelled. A uniglomerular projection neuron (mPN1, black) from the DA1 glomerulus projects to the calyx and lateral horn. (B) Illustration of a split-GAL4 intersection. The expression patterns of two first-generation GAL4 lines are shown along with a split-GAL4 line (center) made by using the enhancer fragments from lines 1 and 2 to create GAL4 AD and DBD hemidrivers. Placing the two hemidrivers in the same fly results in a split-GAL4 line (foreground) specifically labelling an LH cell type that was present in both GAL4 lines. (C) Numbers of split-GAL4 combinations screened (grey), that underwent immunohistochemistry (green) and that were good (blue) and ideal (orange) out of the total 2444 split-GAL4 lines. See text and Figure 1E–F for definitions of good and ideal. (D) Number of known LH anatomy groups (as opposed to cell types, see text for definitions) targeted in this study covered by at least one good (blue) and ideal (orange) split-GAL4 line. (E) Example of a good split-GAL4 line, clearly labelling a LH cell type (white arrow) with off-target expression in the ellipsoid body (yellow arrow). (F) Example of an ideal split-GAL4 line, labelling the same cell type as E (white arrow). Note absence of off-target expression in brain. For E-F, scale bar represents 30 μm. (G) Number of good and ideal split-GAL4 lines identified across all LH cell types. (H) Segmented projections of example LH cell types for LHLNs (1D, left), LHONs (PV5a1, center) and LHINs (70C, right). A presynaptic marker (Syt::smHA, white) and a membrane marker (myr::smFLAG, green) is expressed in the neurons. The images are registered to the JFRC2013 template brain (magenta). (I) Reconstruction of a single neuron of the same cell types as (H) in the whole brain EM volume. Single neuron example of LHLN (AV4a1, left), LHON (3A, middle) and LHIN (WED-PN1, right). Polyadic presynapses are labelled with red spheres. Postsynapses are labelled with blue spheres. Dendritic and axonal domains are illustrated in different colours.
Figure 1—figure supplement 1
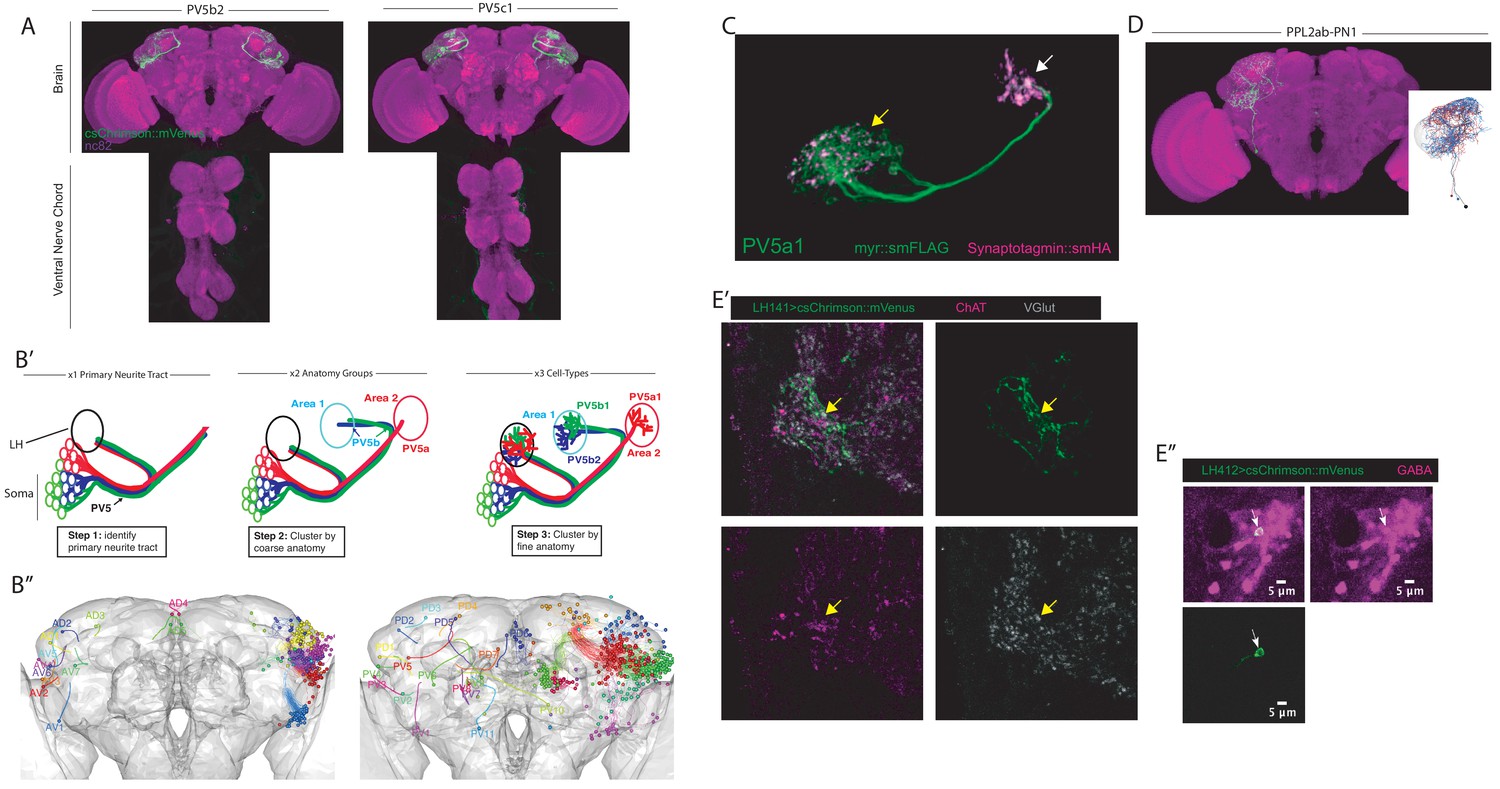
Further analysis, examples and characterization of split-GAL4 lines.
(A) Z-projection of confocal stack of the brain and VNC of two ideal split-GAL4 lines for two different LH cell types. The reporter is csChrimson::mVenus (green) and the neuropil stain is nc82 (magenta). (B’–B’’) Summary schematic for the nomenclature system used to define LH anatomy groups and cell types. (B’) Illustration of the hierarchical steps of the naming scheme using three PV5 LHONs as an example. First the primary neurite tract was identified (left panel, in this case PV5). This is the region of the neuron that connects the soma to axon and dendrite. Next the coarse zones of projection are determined and used to classify the anatomy group (middle panel, PV5b projects to Area one while PV5a projects to Area 2). This can often be done with registered images of full GAL4 or split-GAL4 expression patterns. Finally, fine anatomical differences are determined (right panel, both PV5b1 and PV5b2 project to Area one while PV5a1 projects to Area 1). This often necessitates morphological clustering using single cell data. (B’’) Projections of identified primary neurite tracts of neurons that directly innervate the LH. Anterior primary neurite tracts are shown on the left while posterior primary neurite tracts are on the right. Neuropil is in grey. Both B’-B’’ were modified with permission from Frechter et al., 2019. (C) Higher magnification view of LH cell type PV5a1, a LHON: membrane reporter (green) and Synaptotagmin::smHA, a presynaptic marker (magenta). Presynapses are clearly visible in both the axonal (white arrow) and the dendritic segments (yellow arrow). (D) Projection of LH cell type PPL2ab-PN1. Note this cell type is likely dopaminergic as it is generated by crossing TH-AD to R42H01-DBD and its soma lie in the PPL2ab dopaminergic cell-body cluster. (E’) Neurotransmitter staining a split-GAL4 line (LH141, labelling PD3a1) using a triple stain for csChrimson::mVenus (green), Choline acetyltransferase (ChAT, magenta) and Vesicular glutamate transporter (VGlut, grey). This cell type colocalizes with VGlut. Synaptic boutons are analyzed with for colocalization. (E’’) Neurotransmitter staining for GABA-positive cell bodies in LH412 (labelling AV4b4, magenta is GABA, csChrimson are the neurons).
Figure 2 with 1 supplement
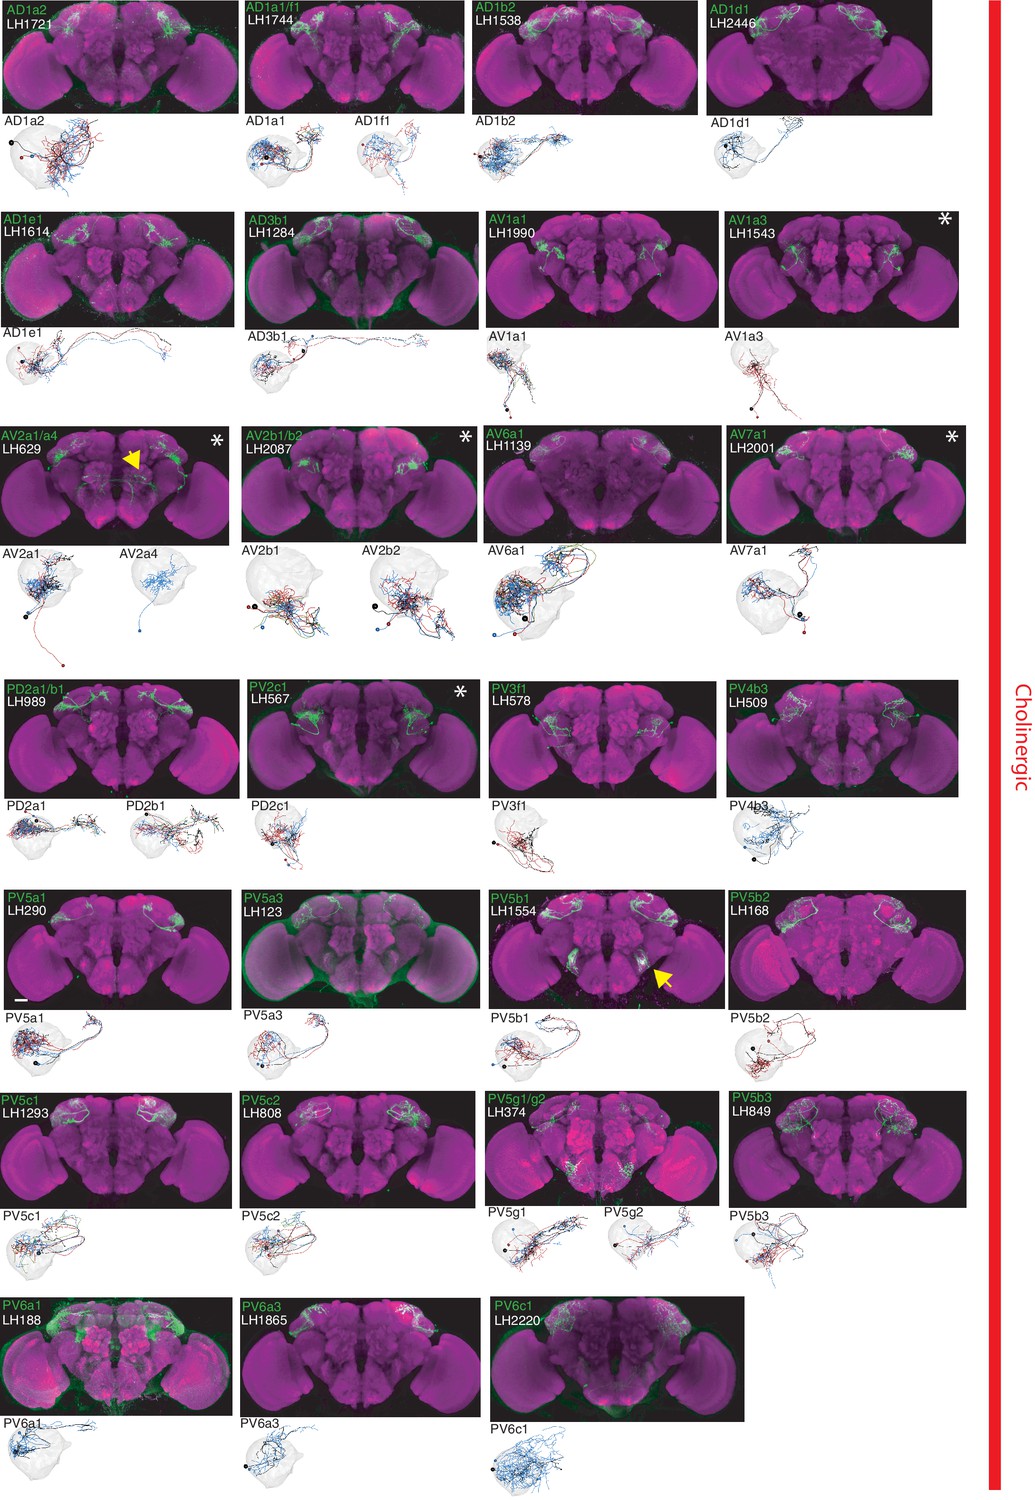
The most specific split-GAL4 lines for identified cholinergic LHONs.
Array of projections of the most specific split-GAL4 line for each cholinergic LHON cell-type. Where available, a neuron from that class traced to at least to identification in the EM volume (inset, black represents tracing, grey the lateral horn, blue and brown the single neuron labelling, Nern et al., 2015). Expression of split-GAL4 lines are visualized using UAS-csChrimson::mVenus in attP18 (green), with nc82 as a neuropil stain (magenta). Each image is registered to JFRC2010, while the EM data is registered to JFRC2013. The cell-type (eg. PV5a1) labelled is in the top left of each panel, while the line code (eg. LH290) is listed below. Cell-types that stained positive for more than one neurotransmitter are labelled with an asterix in the top right. Off-target expression in the brain for non-ideal lines labelled with a yellow arrow. See www.janelia.org/split-gal4 for image data.
Figure 2—figure supplement 1
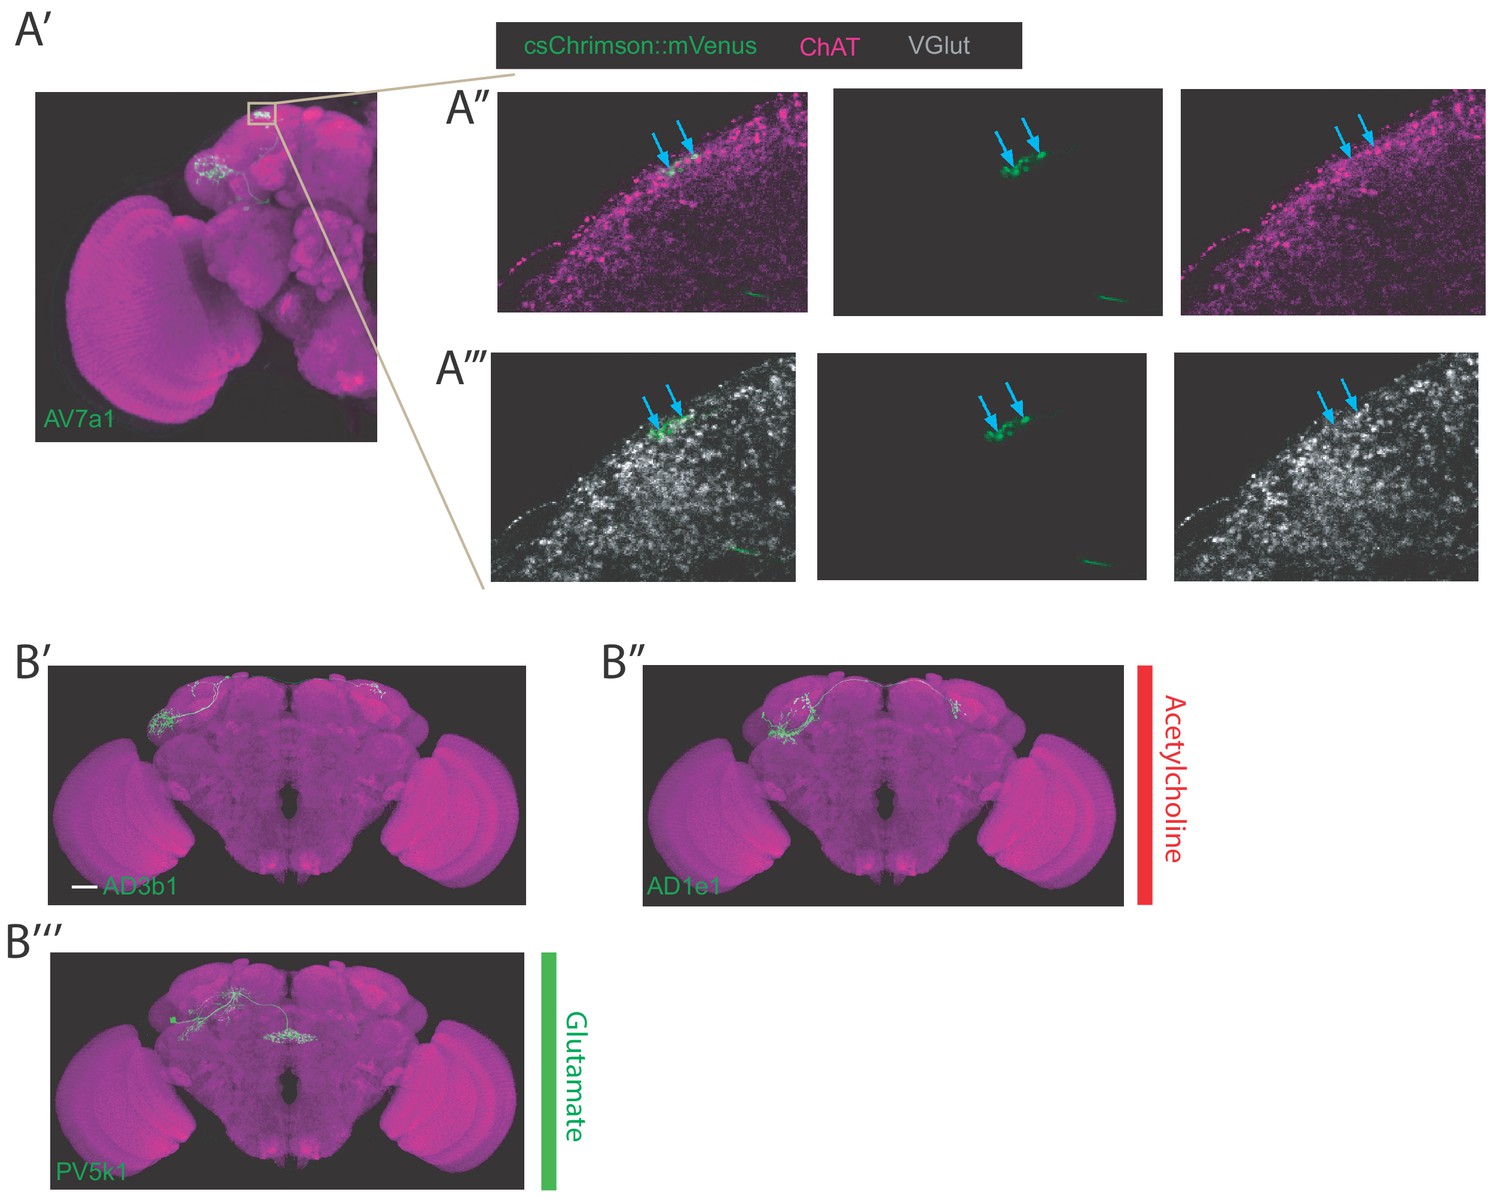
Examples of cell type staining positive for two neurotransmitters, examples of bilateral LHONs.
(A’) Projection of half a brain with cell type AV7a1 labelled. The grey box represents the axons of the neuron where we focused our imaging for the neurotransmitter staining of acetylcholine and glutamate. Note: these neurons did not stain positive for GABA (data not shown). (A’’) Single confocal slice showing colabelling of the axonal boutons of AV7a1 (labelled with csChrimson::mVenus in green) with a stain for ChAT in magenta (marker for cholinergic neurons). Blue arrows label two particular presynaptic sites where colocalization is visible indicating these cells are cholinergic. (A’’’) Single confocal slice showing colabelling of the axonal boutons of AV7a1 (labelled with csChrimson::mVenus in green) with a stain for VGlut in grey (marker for glutamatergic neurons). Blue arrows label two particular presynaptic sites (same sites as in A’’) where colocalization is visible indicating these cells are also glutamatergic. (B’) Projection of a confocal stack of a single bilateral cholinergic AD3b1 neuron using MultiColor FlpOut (MCFO) in green, registered to the JFRC2013 template brain. (B’’) Projection of a confocal stack of a single bilateral cholinergic AD1e1 neuron using MultiColor FlpOut (MCFO) in green, registered to the JFRC2013 template brain. (B’’’) Projection of a confocal stack of a single bilateral glutamatergic PV5k1 neuron using MultiColor FlpOut (MCFO) in green, registered to the JFRC2013 template brain.
Figure 3
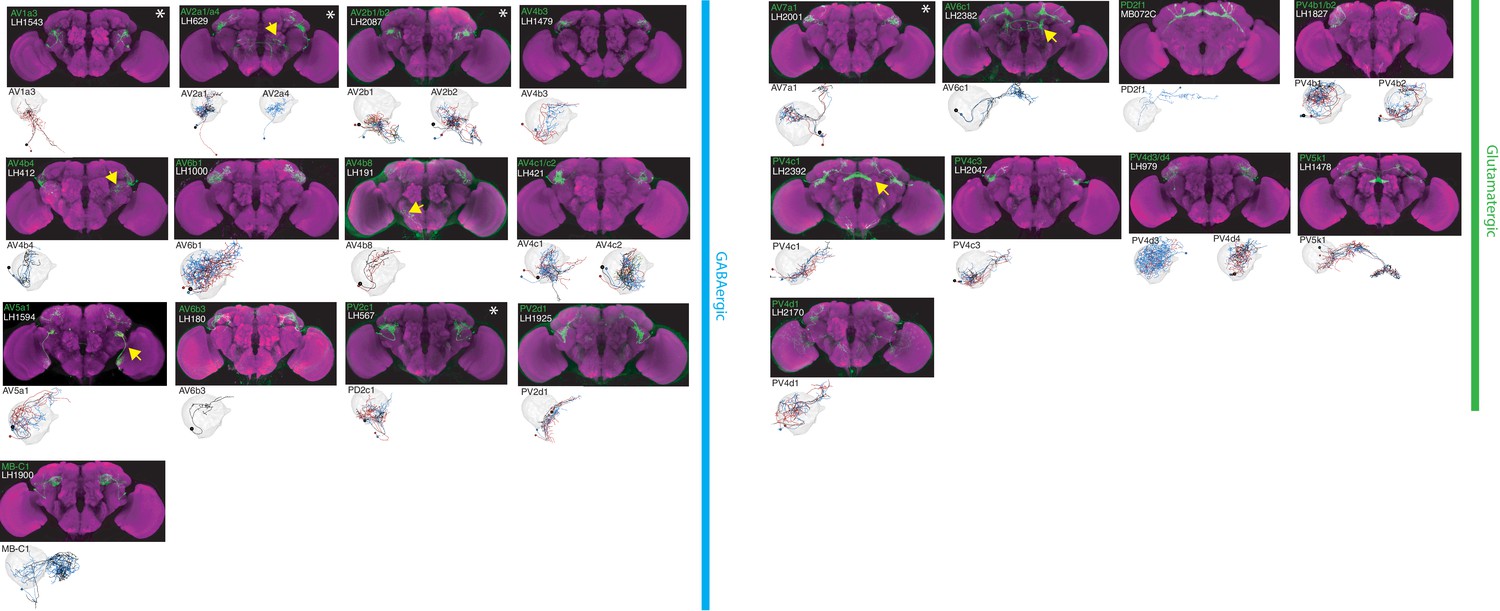
The most specific split-GAL4 lines for identified GABAergic and glutamatergic LHONs.
Array of projections of the most specific split-GAL4 line for each LHON cell-type. All LHON cell-types are organized by principle fast neurotransmitter: GABAergic and Glutamatergic. Images are otherwise presented as Figure 2. Note that MB-C1 was identified and named in a previous study (Aso et al., 2014a). See www.janelia.org/split-gal4 for image data.
Figure 4 with 1 supplement
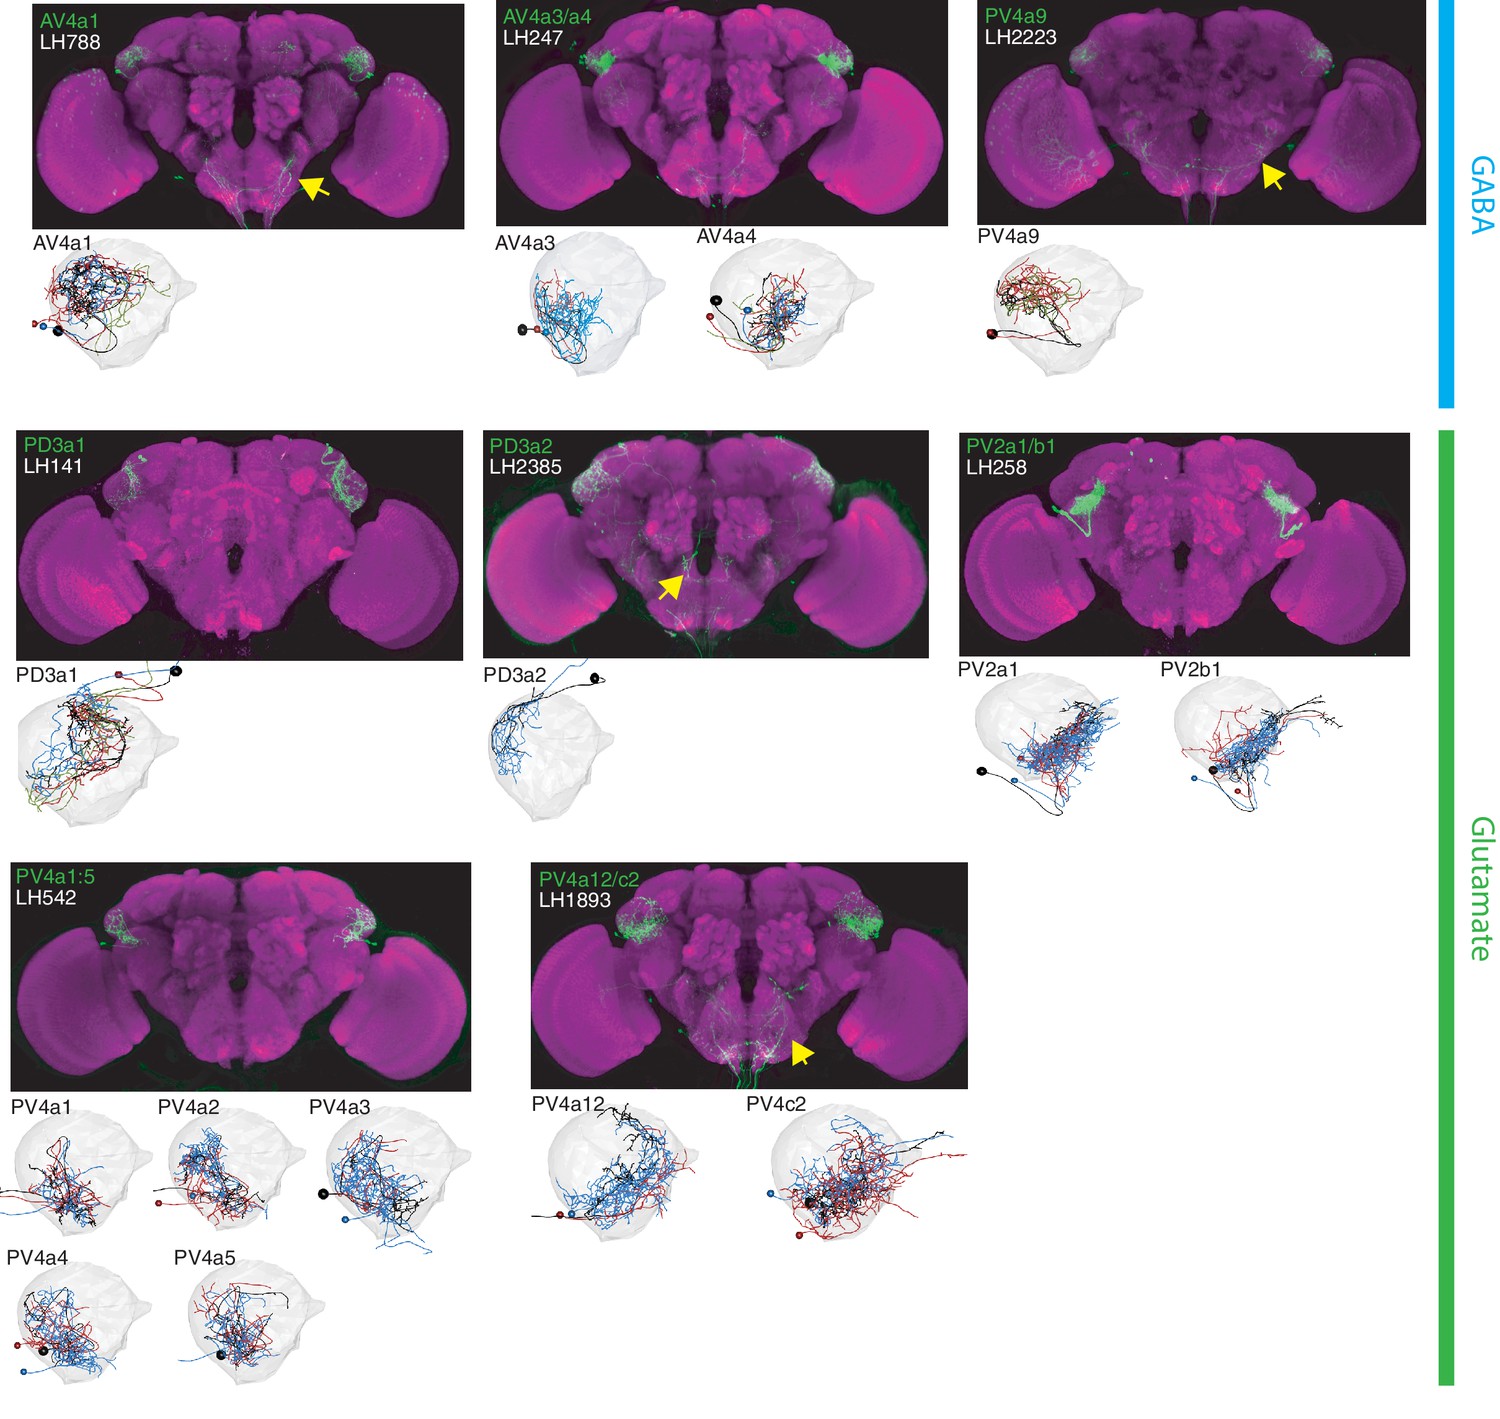
The most specific split-GAL4 lines for identified LHLNs.
Array of projections of the best split-GAL4 line for each LHLN and where available, a neuron from that class traced in the EM volume (inset, black represents tracing, red the lateral horn, blue and brown the single neuron labelling, Nern et al., 2015). Each split-GAL4 line is expressing csChrimson::mVenus in attP18, and has nc82 as neuropil stain (magenta). Each image is registered to JFRC2010, while the EM data is registered to JFRC2013. The cell-type labelled is in the top left of each panel, while the panel number and line code is listed on the bottom left (eg. LH542). All cell-types are organized by fast neurotransmitter (GABA or glutamate). Cell-types that stained positive for more than one neurotransmitter are labelled with an asterix in the top right. See www.janelia.org/split-gal4 for image data.
Figure 4—figure supplement 1

LHLN tracts, novel PNs and an identified ascending LHIN.
(A’) Volume rendering of single cell types that each take one of the four main LHLN primary neurite tracts. The cell types displayed are PV4a1:5 (green), AV4a1 (magenta), PV2a1/b1 (orange) and PD3a1 (blue). The neurite tracts (except AV4a1) are labelled with same colour arrows. All cell types are registered to the JFRC2013 template brain. (A’’) Dorsal down view of the same cell types in A’. The anterior AV4a1 primary neurite tract is labelled with a magenta arrow. (B–C) Images of novel PN cell types identified in this study. Brains are labelled with a neuropil stain (magenta) and neurons are labelled with csChrimson::mVenus (green). (D) Analysis of an identified ascending neuron cell type VNC-PN1. (D’) MultiColor FlpOut (MCFO) of a broad split-GAL4 line (LH2387) that labels VNC-PN1, demonstrating these are ascending neurons (yellow neurite and yellow arrow). (D’’) A split-GAL4 line (LH2445) that labels VNC-PN1 driving expression of a presynaptic (Synaptotagmin::smHA, white) and neuronal marker (smFLAG, green). The presynaptic marker is localized to the ventral LH indicating this LHIN is an ascending neuron (yellow arrow).
Figure 5
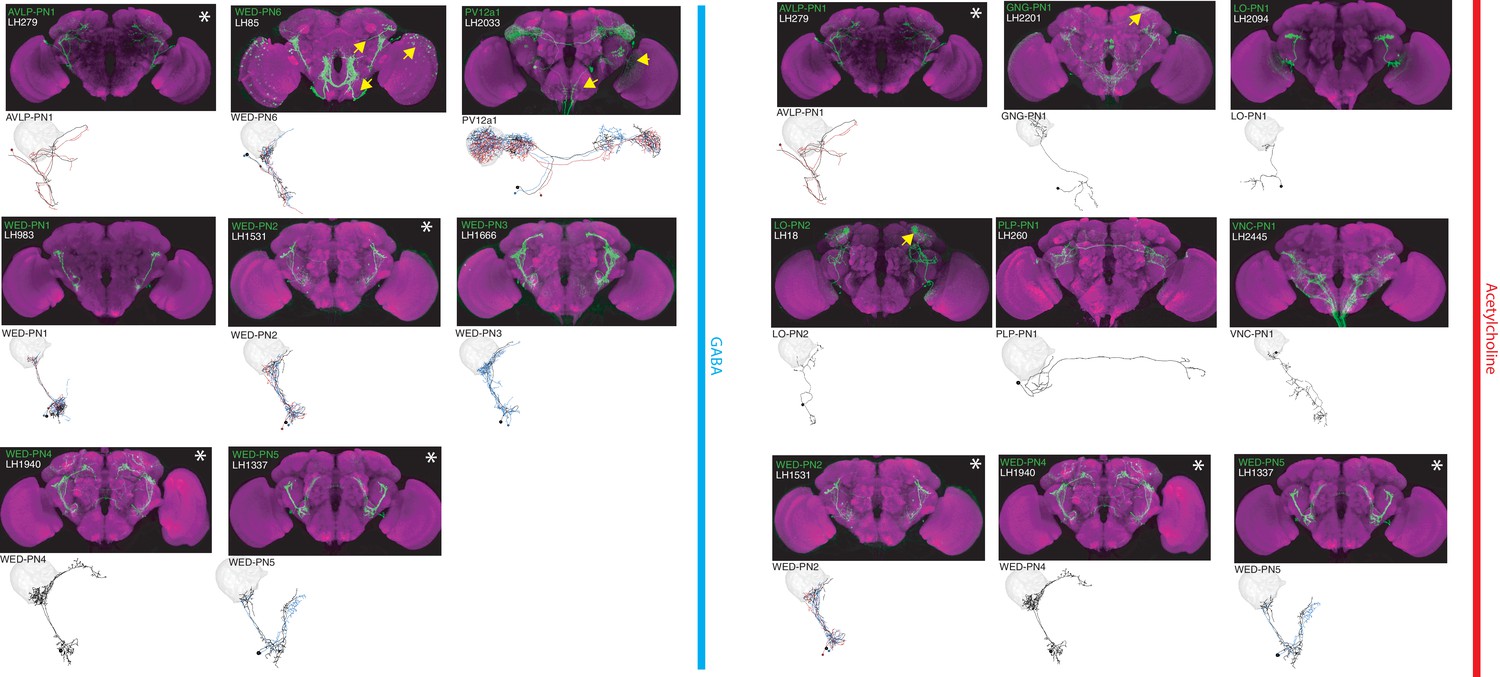
The most specific split-GAL4 lines for identified LHINs.
Array of projections of the best split-GAL4 line for each LHIN cell-type and where available, a neuron from that class traced in the EM volume (inset, black represents tracing, red the lateral horn, blue and brown the single neuron labelling, Nern et al., 2015). Each split-GAL4 line is expressing csChrimson::mVenus in attP18, and has nc82 as neuropil stain (magenta). Each image is registered to JFRC2010, while the EM data is registered to JFRC2013. The cell-type labelled is in the top left of each panel, while the panel number and line code is listed on the bottom left. All cell-types are organized by principle fast neurotransmitter (GABA or acetylcholine). Cell-types that stained positive for more than one neurotransmitter are labelled with an asterix in the top right. For LHINs, we named the majority according to their main region of dendritic arborization using the shorthand defined in Ito et al. (2014). See www.janelia.org/split-gal4 for image data.
Figure 6 with 1 supplement
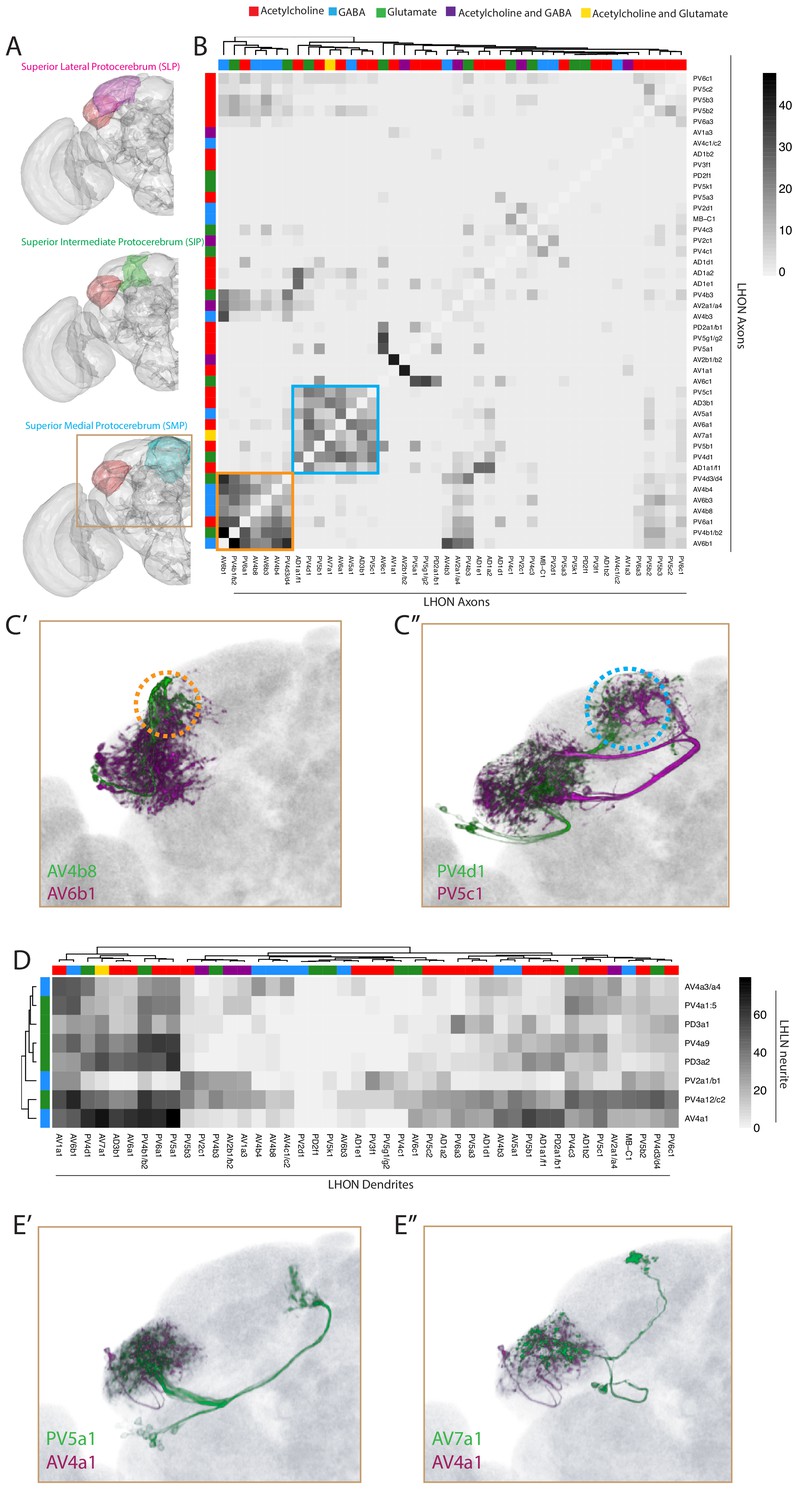
Inter- and intra-LH interactions.
(A) Volume renderings of fly brain (grey) with the SLP (magenta), SIP (green) and SMP (cyan) labelled. The LH in each panel is labelled in red. The brown inset is the region displayed in C and E. (B) Heatmap of percentage overlap score (white to black) between masks of LHON axons against themselves. Scores between the same LHON axon and itself are set from 100 to −1 for clarity. The tracks of the rows and columns both represent the neurotransmitter, as determined by immunohistochemistry for acetylcholine, GABA and glutamate. Two main clusters of axons emerged from the analysis (orange and blue bound). (C’) Volume rendering of AV4b8 (green) and AV6b1 (magenta), both are expression patterns from different brains registered to the JFRC2013 template brain. The orange dashed circle shows the axonal projections of these two cell types which coclustered in the heatmap orange box. (C’’) Volume rendering of PV4d1 (green) and PV5c1 (magenta), both are expression patterns from different brains registered to the JFRC2013 template brain. The blue dashed circle shows the axonal projections of these two cell types which coclustered in the heatmap blue box. (D) Heatmap of percentage overlap score (white to black) between masks of LHON dendrites against the neurites of LHLNs. The tracks of the rows and columns both represent the neurotransmitter, for LHLNs and LHONs respectively (see Figure 6B for neurotransmitter colour code). (E’) Volume rendering of PV5a1 LHON (green) and AV4a1 LHLN (magenta), both are expression patterns from different brains registered to the JFRC2013 template brain. (E’’) Volume rendering of AV7a1 LHON (green) and AV4a1 LHLN (magenta), both are expression patterns from different brains registered to the JFRC2013 template brain.
Figure 6—figure supplement 1
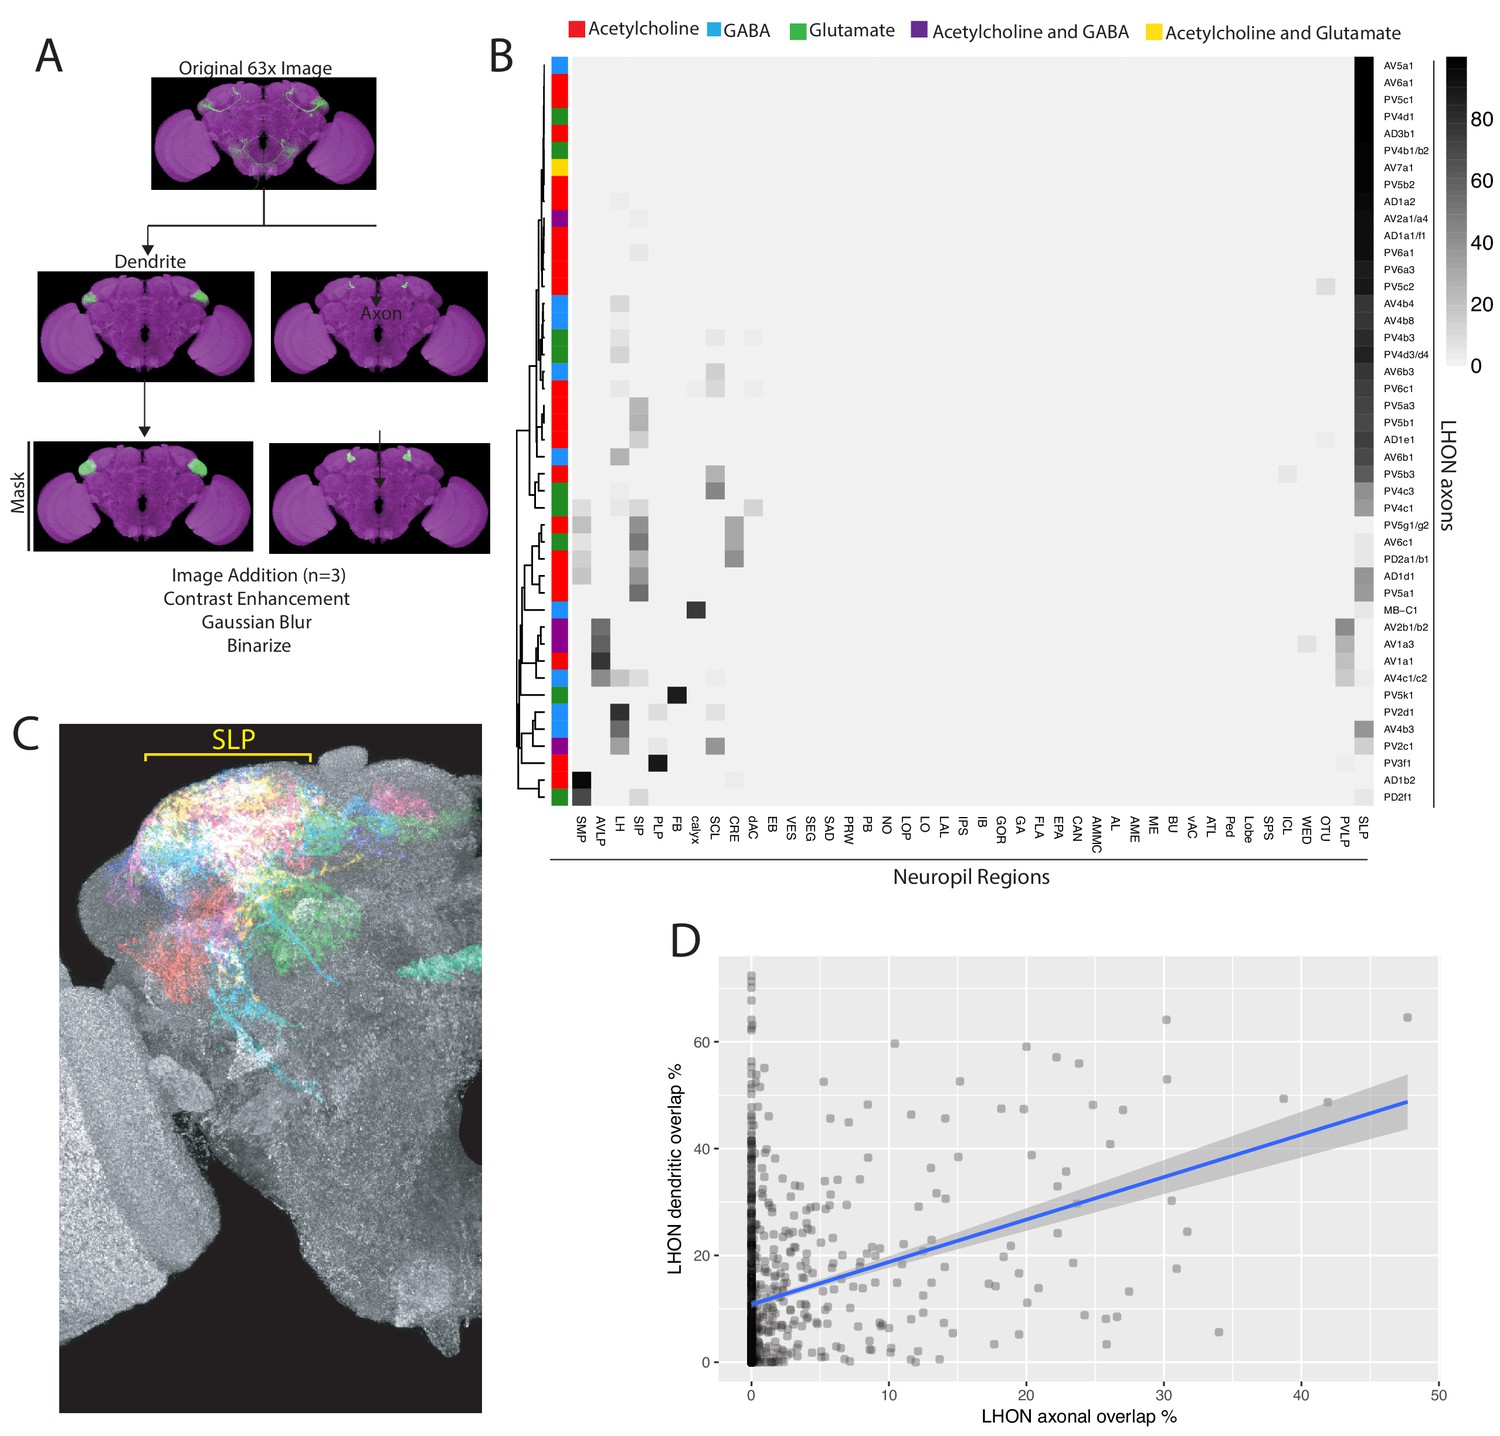
Analysis of light microscopy data, LHON neuropil projections, LHON and LHLN interactions.
(A) Schematic of the light microscopy overlap analysis pipeline. An original high-resolution image (row one) for a given cell type is segmented into its dendritic and axonal segments guided by Synaptotagmin::smHA polarity marker (row two). For each compartment of each cell type, three compartmental segmentations from different samples were added together, underwent contrast enhancement, gaussian blur and then binarized into a cell type mask for axon or dendritic domains (row three). These masks were used for the overlap calculations in the heatmaps displayed in this paper. A similar pipeline was used to generate PN, LHIN, DAN and MBON compartmental masks in Figures 7–8. See Materials and methods for full details. (B) Heatmap of percentage overlap score between masks of LHON axons and masks generated of the different neuropil regions of the fly brain. The region nomenclature used for the columns is derived from Ito et al. (2014). (C) Volume rendering of LHON axon segmentations (one for each cell type) from different brains registered to the JFRC2013 template brain. Broad coverage in the SLP is observed (yellow bracket) (D) Correlation between pairwise overlaps of LHON axons against LHON axons (x-axis) and LHON dendrites against LHON dendrites (y-axis). R2 = 0.09402, p-value<2.2e−16.
Figure 7 with 1 supplement
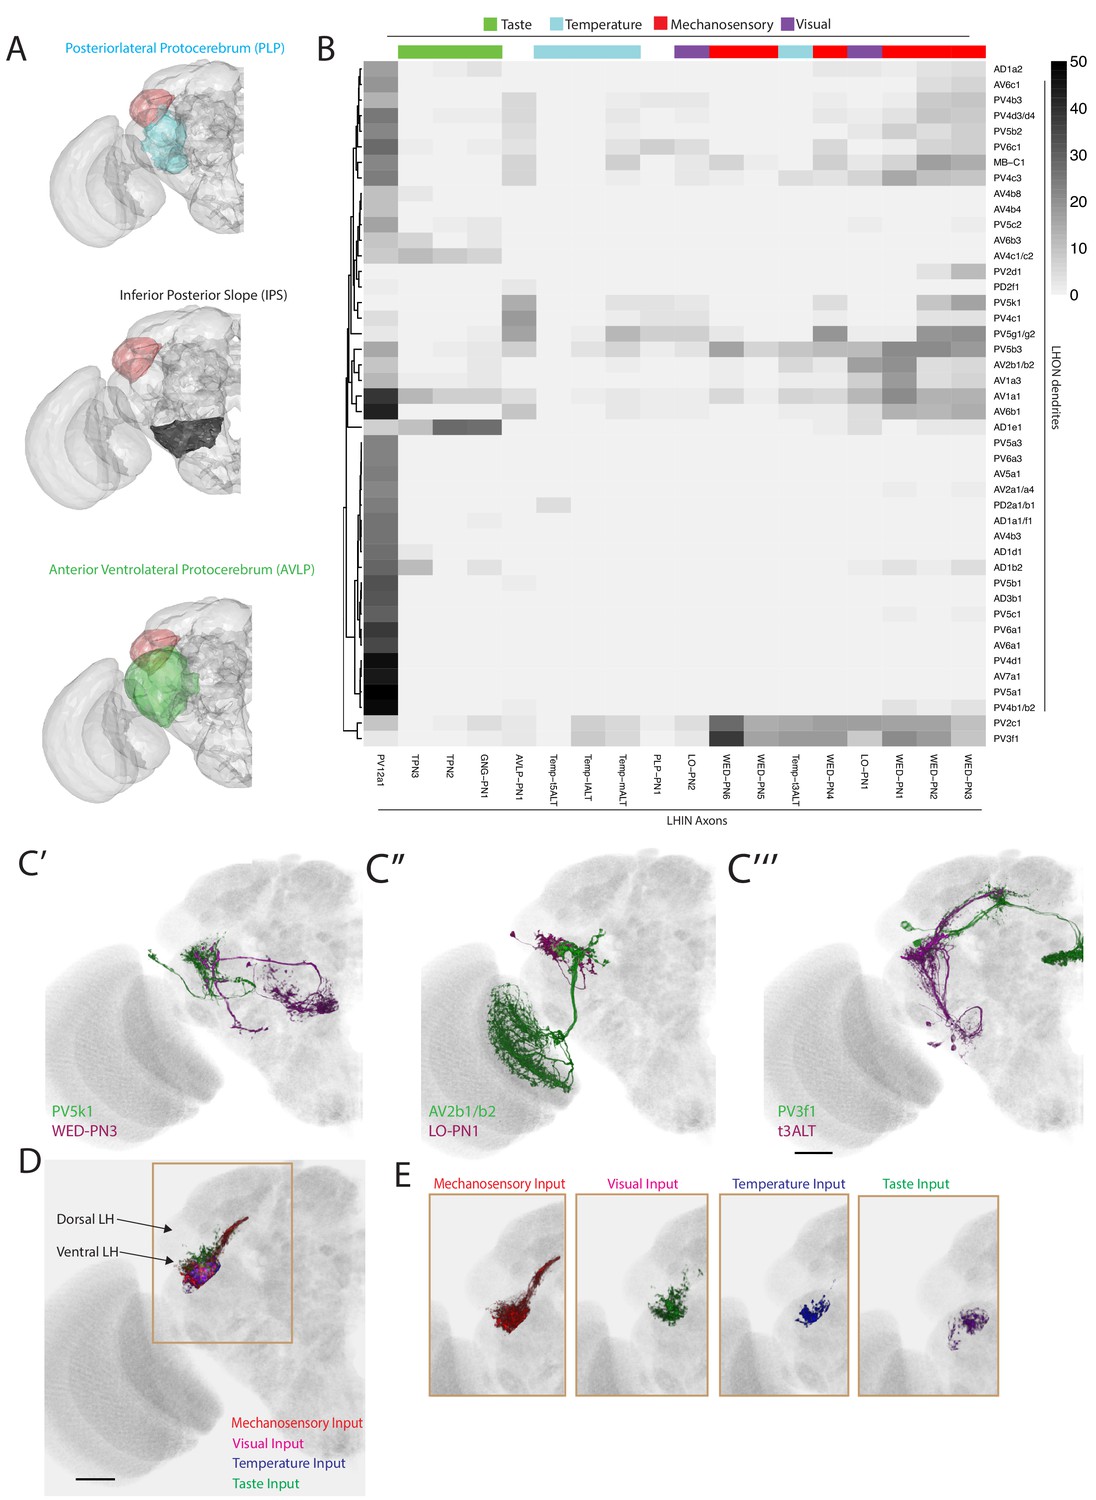
The LH receives non-olfactory input to a restricted ventral zone.
(A) Volume renderings of fly brain (grey) with PLP (blue), IPS (black) and AVLP (green) labelled. The LH in each panel is labelled in red. (B) Heatmap of percentage overlap score between masks of LHON dendrites against the axons of non-canonical LHINs. The tracks of columns represent the presumed modality of the LHIN, as determined by position of their dendrites. Temp-ALT etc represents four different types of temperature PNs (Frank et al., 2015). (C’) Volume rendering showing overlap of PV5k1 (green) and WED-PN3 (magenta), both of which are expression patterns from different brains registered to the JFRC2013 template brain. (C’’) Volume rendering showing overlap of AV2b1/b2 (green) and LO-PN1 (magenta), both of which are expression patterns from different brains registered to the JFRC2013 template brain. (C’’’) Volume rendering showing overlap of PV3f1 (green) and the temperature projection neuron t3ALT (magenta), both of which are expression patterns from different brains registered to the JFRC2013 template brain. (D) Mutimodal input to the LH is restricted to a ventral zone. Averaged axonal representations across different cell types for each non-olfactory sensory modality (mechanosensory, temperature, visual and taste) overlaid onto the JFRC2013 template brain demonstrating these inputs are restricted to the ventral LH. Scale bar is 30 μm. (E) Individual volume renderings of the averaged axonal representations (only pixels in the LH are displayed) for each sensory modality, visual (top left), temperature (top right), mechanosensory (bottom left) and taste (bottom right).
Figure 7—figure supplement 1
Input to the LH from PNs, MBONs and LHINs.
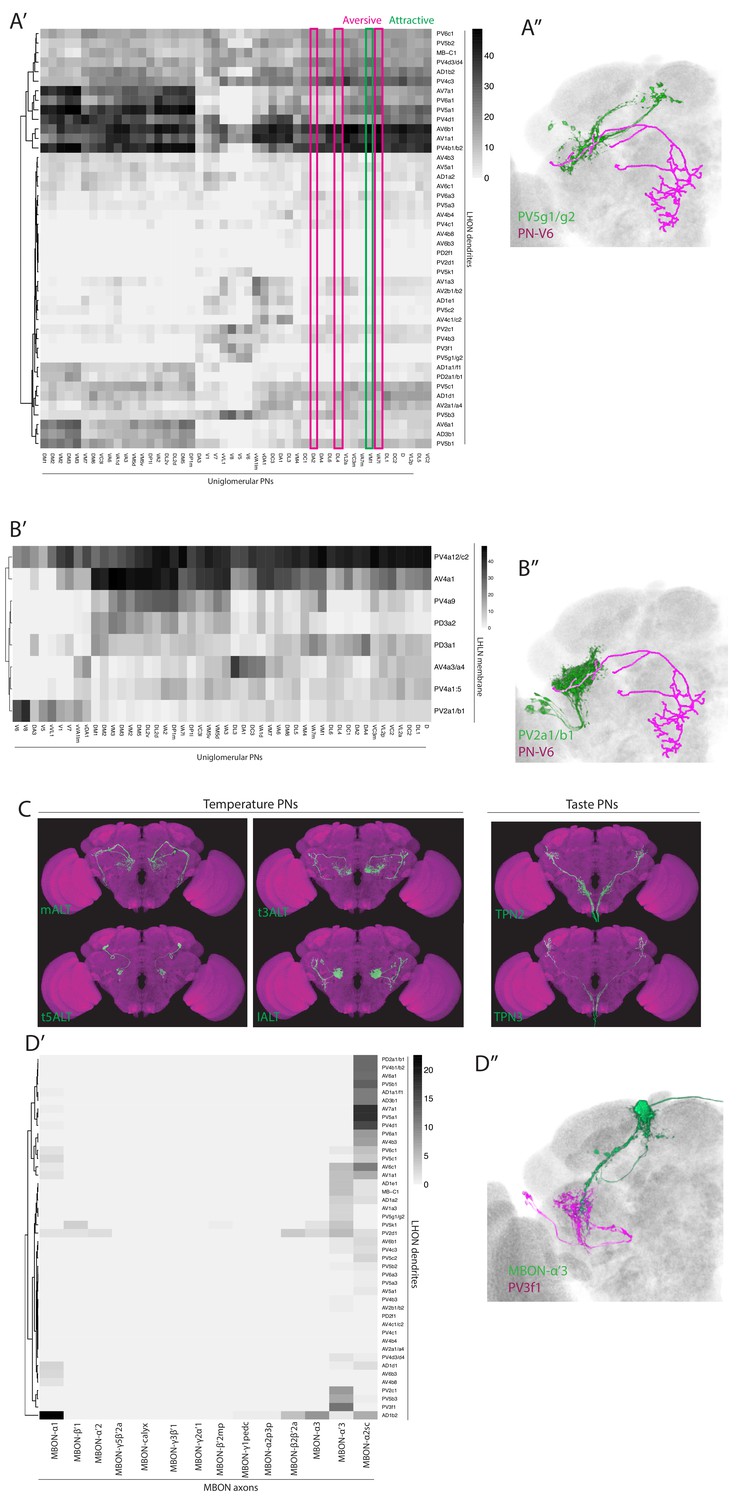
(A’) Heatmap of percentage overlap score between masks of LHON dendrites (rows) against and the axons of uniglomerular mPN1s (columns). The magenta and green rectangles label columns for selected aversive or attractive glomeruli mentioned in the main text. (A’’) Volume rendering of PV5g1/g2 (green) and the V glomerulus PN-V6 PN (magenta), both are expression patterns from different brains registered to the JFRC2013 template brain. (B’) Heatmap of percentage overlap score between masks of LHLNs (rows) against and the axons of uniglomerular mPN1s (columns). (B’’) Volume rendering of PV2a1/b1 (green) and the V glomerulus PN-V6 PN (magenta), both are expression patterns from different brains registered to the JFRC2013 template brain. (C) Z-projections of the segmented confocal stacks for temperature (left) and taste PNs (right) added to the overlap analysis in Figure 7. Images are registered to the JFRC2013 template brain. (D’) Heatmap of percentage overlap score between masks of LHON dendrites (rows) against and the axons of MBONs (columns). (D’’) Volume rendering of MBON-α’3 (green) and PV3f1 (magenta), both expression patterns from different brains registered to the JFRC2013 template brain.
Figure 8 with 1 supplement

Identifying interactions between the innate and learned olfactory processing centers.
(A) Heatmap of percentage overlap score between masks of LHON axons and DAN dendrites. The tracks of the rows represent the neurotransmitter, as determined by immunohistochemistry for acetylcholine, GABA and glutamate. (B) Heatmap of percentage overlap score between masks of LHON axons and MBON axons. The tracks of the rows and columns represent the neurotransmitter for LHONs and MBONs respectively. White asterisks represent cell type pairs that are illustrated with volume renderings (see below). (C’) Volume rendering showing overlap of AD1a1/f1 (green) and PAM-β1 (magenta) (C’’) Overlap between PV6a1 and MBON-α1 (C’’’) PV5a1 and MBON-β2β′2a. All of C’-C’’’ are expression patterns from different brains registered to the JFRC2013 template brain. (D) EM reconstructions of AD1b2 (green) and MBONs (magenta), illustrating synaptic connectivity from MBON-α1, MBON-γ5β′2a, MBON-α′two and MBON-γ2α′one onto AD1b2. (D’) MBON-α1 forms synapses on AD1b2 dendrites which are outside of the LH. (D’’–D’’’’) MBON-γ5β′2a, MBON-α′two and MBON-γ2α form axoaxonic synapses onto AD1b2 in the SMP. The LH and MB volumes are labelled in orange and light grey respectively. Red spheres represent synapses from MBON onto AD1b2. Black circle highlights region of synapses. (D’’) Reconstruction of seven AD1b2 neurons (green) and MBON-γ2α1 (black) in the EM volume. The LH and MB volumes are labelled in red and light grey respectively. Red spheres represent synapses from MBON-γ2α1 onto the AD1b2 axonal compartment. (E) Heatmap of synaptic connectivity from MBONs onto each AD1b2 neuron revealing the variability of connectivity across individual AD1b2 neurons. Green dendrogram is a morphological clustering of individual AD1b2 neurons by NBLAST. (F) Cartoon summary of dendritic and axoaxonal connectivity from MBONs onto AD1b2 axons. Note that all MBONs also have other currently unknown downstream synaptic partners .
Figure 8—figure supplement 1
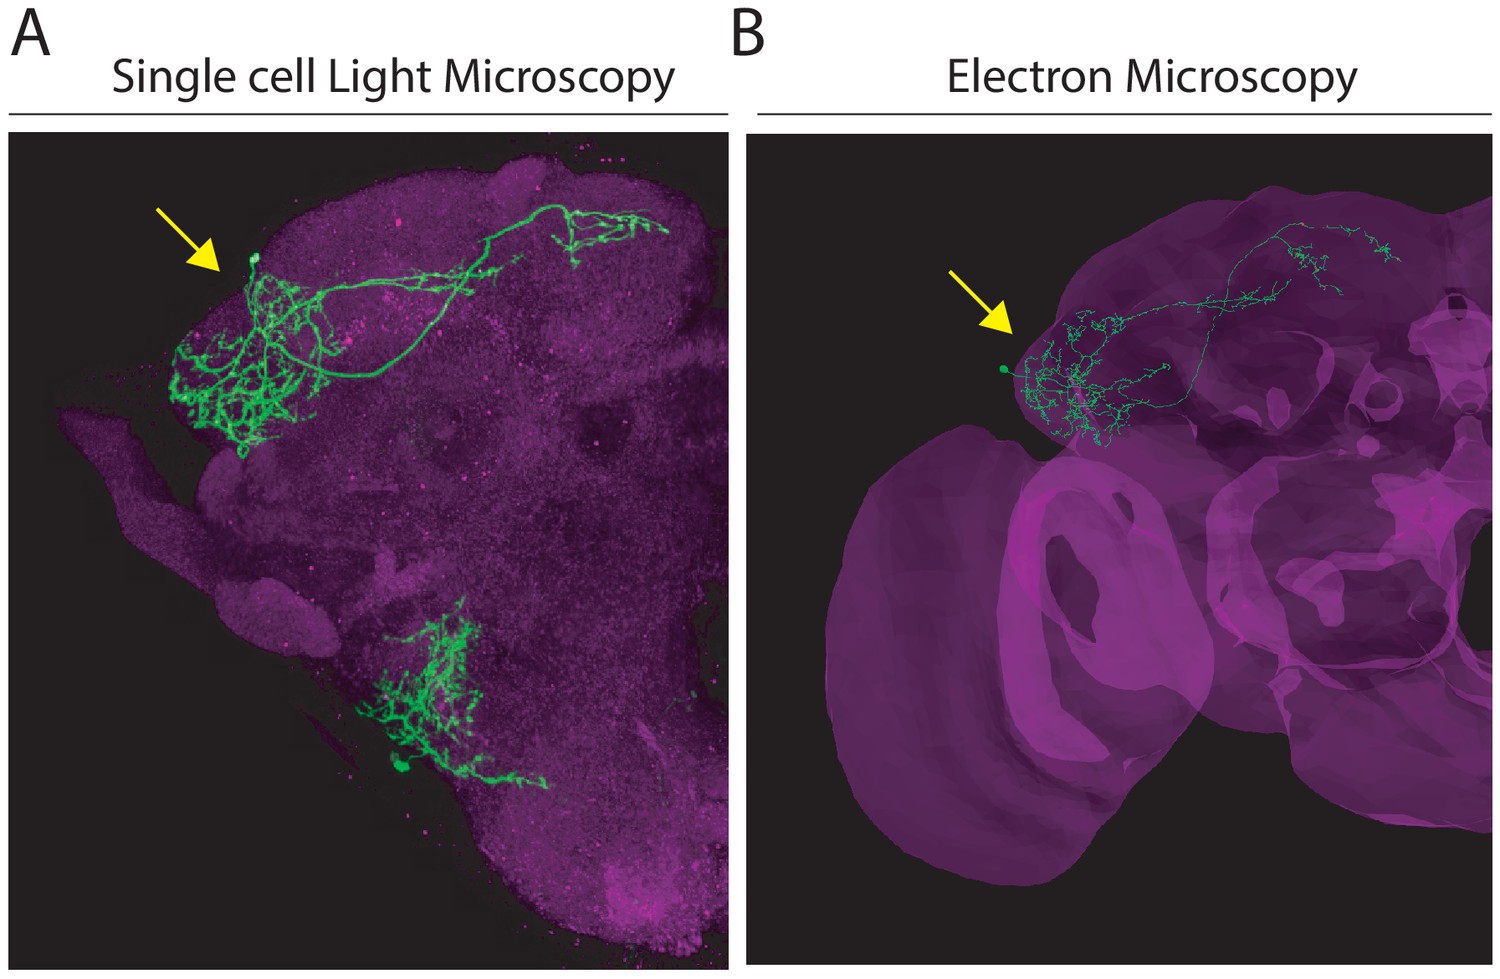
Comparison of single AD1b2 neurons between Light and Electron Microscopy.
(A) Projection of a single-cell labelling experiment (MCFO, green, single neuron marked by yellow arrow) of LH2278, a split-GAL4 line labelling AD1b2. Magenta represents the neuropil stain. (B) Volume rendering of the EM volume with a single reconstructed AD1b2 neuron displayed (green, marked by yellow arrow). Brain mesh labelled in magenta. Both images are registered to the JFRC2013 template brain.
Figure 9 with 1 supplement
Identification of LH neurons that drive aversion and attraction.
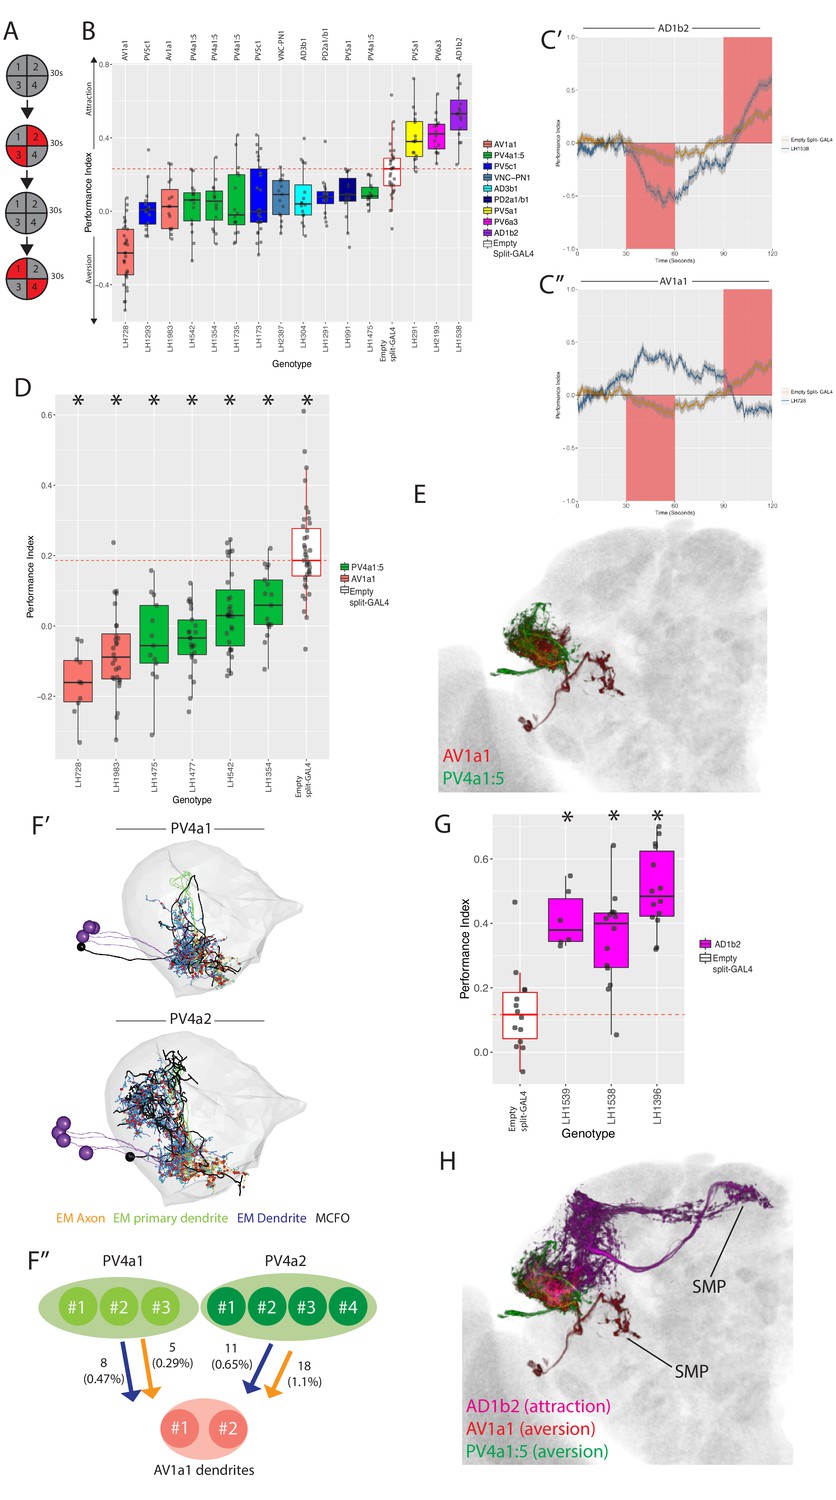
(A) Schematic of the optogenetic stimulation paradigm. Flies are introduced to the chamber and allowed to acclimatize for 30 s followed by illumination of two opposing quadrants for 30 s, a 30 s period of no stimulation, and then a 30 s illumination of the other two opposing quadrants. Distribution of the flies was continuously tracked and used to calculate a preference index (PI). The PI = [(number of flies in Q2 and 3) - (number of flies in Q1 and 4)]/(total number of flies), Q1-4 represents each quadrant. (B) Summary box plots showing the single value performance index (PI) upon activation of each of the split-GAL4 lines screened that were significantly different from the empty split-GAL4 control (white). The single value PI was calculated by averaging the PIs from the final 5 s of each of the two red-light ON segments of the paradigm (see Materials and methods). Split-GAL4 lines are colour-coded by cell type and the exact cell type is also listed on top of each boxplot. See Figure 9—figure supplement 1A for full dataset and statistics. In our assay, Split-GAL4 control flies lacking genomic enhancers to drive effector expression (Hampel et al., 2015) had a reproducible attraction to light which was not the case with GAL4 insertion lacking an enhancer (Figure 9—figure supplement 1B). Based on this data, we used the Split-GAL4 control as a reference point for calculating optogenetically driven approach or avoidance by LH neurons (red dashed line). (C’) A graph of the PI across time, where the split-GAL4 line LH1538 (blue) is plotted against empty split-GAL4 (orange). Activation of LH1538 drives attraction. Red rectangle indicates light ON period. (C’’) A graph of the PI across time (in seconds), where the split-GAL4 line LH728 (blue) is plotted against empty split-GAL4 (orange). Activation of LH728 drives aversion. Red rectangle indicates light ON period. Line is mean, grey is SEM. (D) Optogenetic valence experiments repeated in a different assay (see Materials and methods) for multiple split-GAL4 lines labelling either AV1a1 or PV4a1:5. Asterisk indicates significantly different from the empty split-GAL4 control (p<0.05), n = 10–39 groups. (E) Volume rendering showing overlap of AV1a1 (green) and PV4a1:5 (magenta), both are expression patterns from different brains registered to the JFRC2013 template brain. (F’) EM reconstruction of PV4 neurons, PV4a1 (top) and PV4a2 (bottom) with presynapses connected to AV1a1 labelled (red spheres). Black neurons represents single PV4 neurons from MCFO data while the EM reconstructed neurons are coloured by axon (orange), primary dendrite (green) and dendritic compartments (magenta), indicating these local neurons have a distinct polarity. The LH is represented by light gray mesh. (F’’) Summary of EM connectivity from PV4a1/a2 neurons onto AV1a1 dendrites. Numbers represent the number of synapses, numbers in brackets are the percentage of total input from PV4a1 or PV4a2 onto AV1a1 dendrites. (G) Optogenetic valence experiments with several split-GAL4 lines labelling cell type AD1b2. Asterisk indicates significantly different from the empty split-GAL4 control (p<0.05), n = 6–14 groups. (H) Summary of neurons identified in the valence screen with output regions labelled.
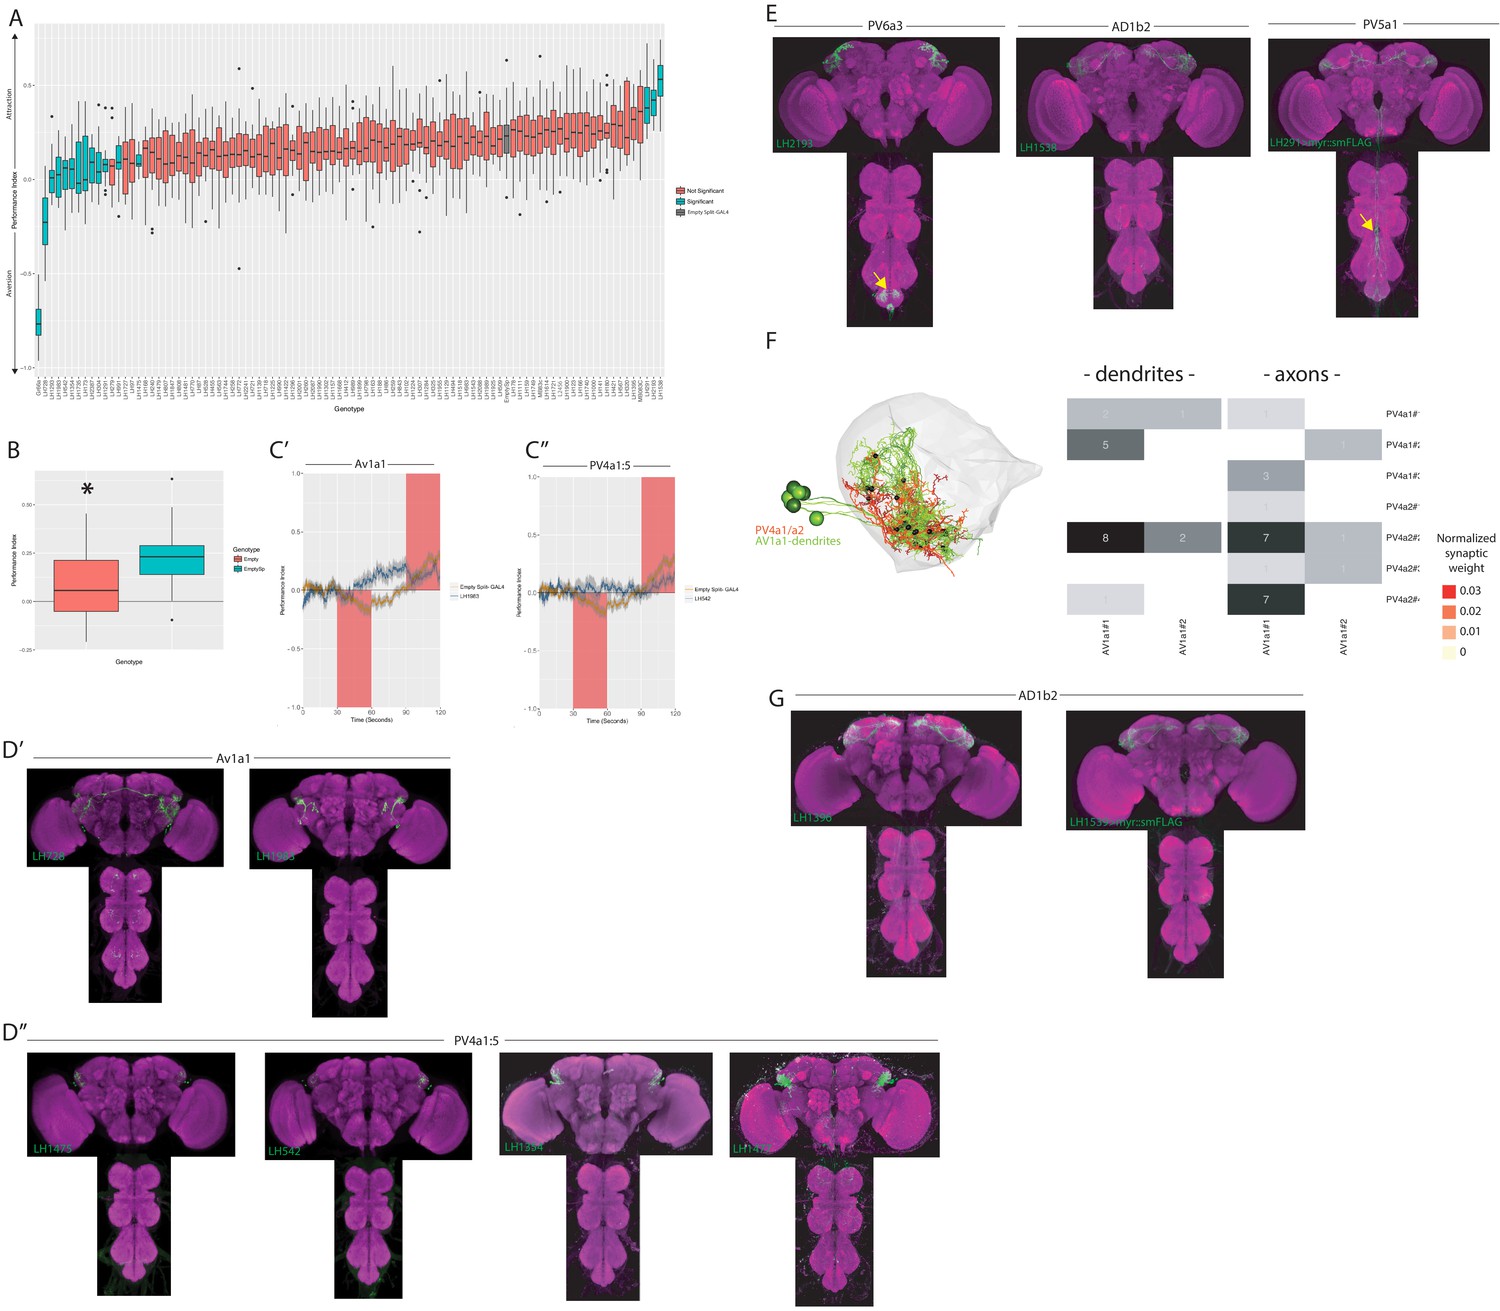
Figure 9—figure supplement 1
Further valence screen details and full expression patterns of all split-GAL4 lines discussed in text.
(A) Summary box plots describing the single value performance index (PI) upon activation of each of the split-GAL4 lines screened. The single value PI was calculated by averaging the PIs from the final 5 s of each of the two red-light ON segments of the paradigm (Figure 9A). Split-GAL4 lines that produce significant differences in either aversion or attraction compared to the empty split-GAL4 control are labelled in blue. Those are non-significant compared to the empty split-GAL4 control are labelled in orange. The PI of empty split-GAL4 control is labelled in grey. A Kruskal-Wallis rank sum test reported a significant difference between genotypes (Kruskal-Wallis chi-squared = 349.5344, p-value<2.2e-16), and a post-hoc Dunn's test between empty split-GAL4 and each experimental genotypes was used to determine significance. P-values that were less than 0.10 after adjustment for the False Discovery Rate were declared significant, while all others were considered not significant. Note that this figure also includes the attractive (MB83c) and aversive (Gr66a) controls, n = 33 for empty split-GAL4, n = 88 for Gr66a (not used in statistics) and n = 9–18 for each split-GAL4 line. (B) Optogenetic valence experiments comparing the PI of empty GAL4 (Empty) and empty split-GAL4 (Emptysp) to light stimulation. Empty Split-GAL4 animals showed attraction to the light ON stimulus (Kruskal-Wallis test, p<2.2e−16). (C’) A graph of the PI across time (in seconds), where the split-GAL4 line LH1983 (blue) is plotted against empty-GAL4 (orange). Activation of LH1983 drives attraction. Red rectangle indicates light ON period. (C’’) A graph of the PI across time (in seconds), where the split-GAL4 line LH542 (blue) is plotted against empty split-GAL4 (orange). Activation of LH542 drives attraction. Red rectangle indicates light ON period. (D’) Z-projection of the full expression pattern (split-GAL4 driving csChrimson::mVenus (green) brain and ventral nerve cord) of two AV1a1 split-GAL4 lines identified in the valence screen, LH728 (left) and LH1983 (right). (D’’) Z-projection of the full expression patterns (split-GAL4 driving csChrimson::mVenus (green), brain and ventral nerve cord) of four PV4a1:5 split-GAL4 lines identified in the valence screen: LH1475, LH542, LH1354 and LH1477. (E) Z-projection of the full expression patterns (brain and ventral nerve cord) of the three split-GAL4 lines that drove significant attraction when optogenetically stimulated in the valence screen (see Figure 9A): LH2193, LH1538 and LH291. Note that LH291 is expressing myr::smFLAG neuronal marker (see Materiala and methods) while LH2193 and LH1538 are driving csChrimson::mVenus. Note for all expression pattern images, the neuropil stain is nc82 (magenta). Off-target expression in the ventral nerve cord is labelled with yellow arrow. (F) Left, EM reconstruction of two cell types (PV4a1/a2, magenta) with the dendrites of reconstructed 17B neurons (AV1a1#1–3, green). Right, heatmap of the normalized synaptic weight (see Materials and methods) of connections between different 17B neurons (AV1a1#1–3) and the axons (left) and dendrites (right) of the three PV4a1 (PV4a1#1–3) and four PV4a2 (PV4a2#1–4) neurons. Cell numbers represent the total number of synapses. (G) Z-projection of the full expression patterns (brain and ventral nerve cord) of the two other AD1b2 split-GAL4 lines that drove significant attraction when optogenetically stimulated: LH1396 and LH1539. Note that LH1539 is expressing myr::smFLAG neuronal marker (see Materials and methods) while LH1396 is driving csChrimson::mVenus. Note for all expression pattern images, the neuropil stain is nc82 (magenta).
Figure 10 with 2 supplements
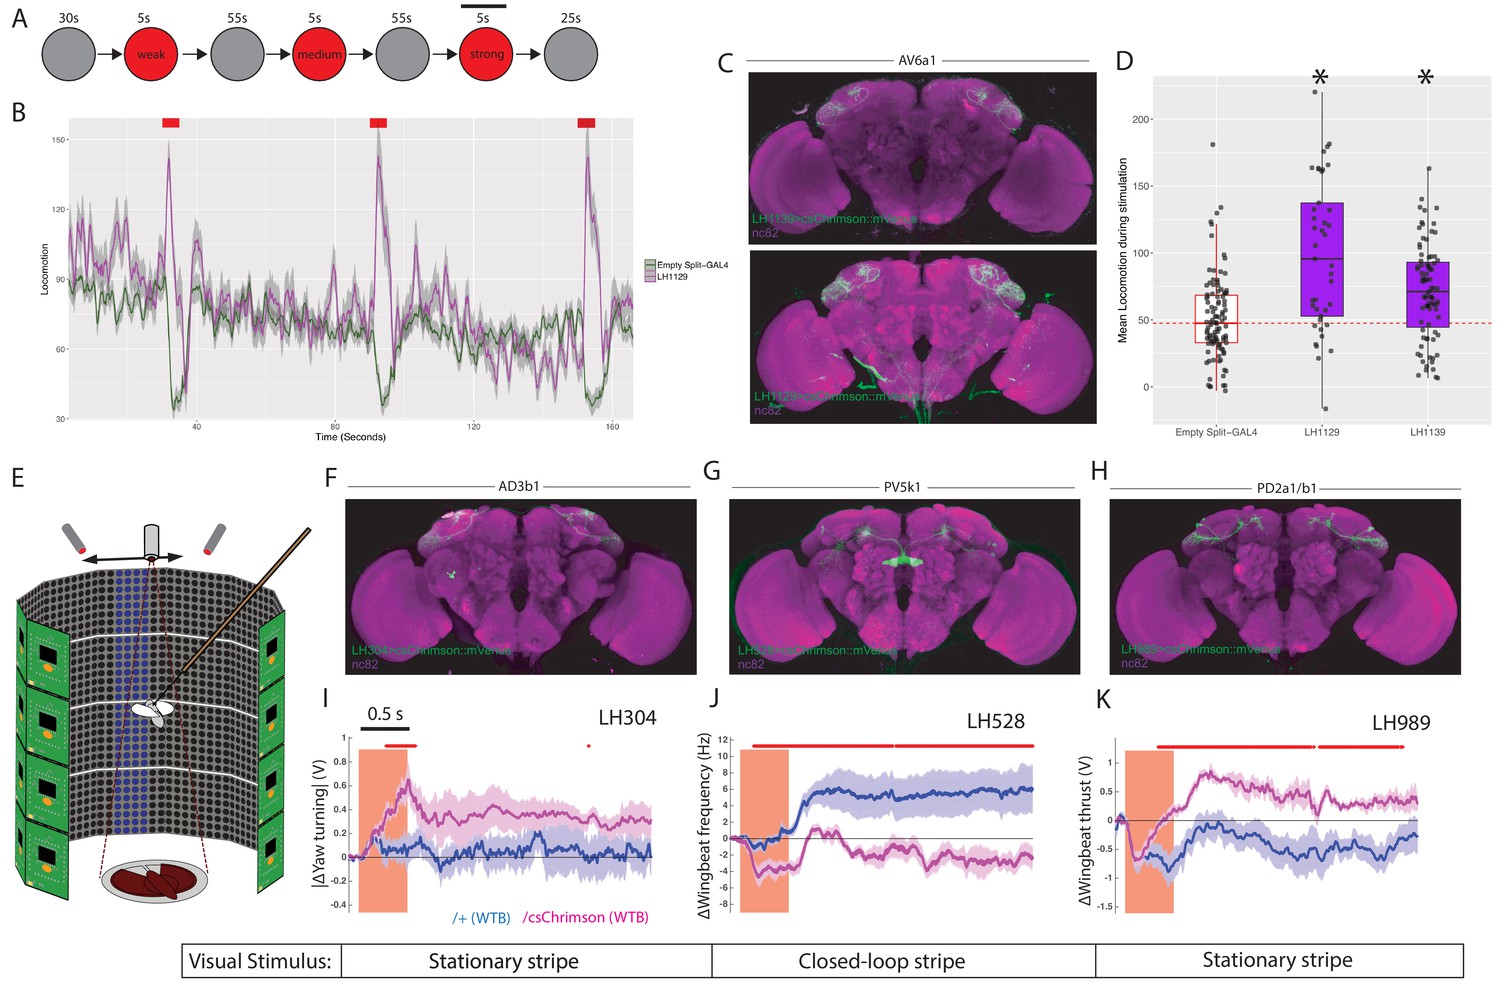
LH neurons drive motor behaviours.(A) Schematic of the Flybowl optogenetic stimulation paradigm.
Flies are introduced to the chamber and allowed to acclimatize for 30 s followed by illumination for 5 s, repeated three times. Each stimulation is of a different intensity, from lowest to highest. The flies were continuously tracked and their movements used to calculate the forward locomotion.The black bar above the 3rd stimulation represents the analysis window for D. (B) A graph of the forward locomotion (pixels per second, one pixel is ~0.12 mm) across time, where the split-GAL4 line LH1129 (magenta) is plotted against empty split-GAL4 (green). Line is the mean, grey is the SEM. Activation of LH1129, a split-GAL4 line labelling LH cell type AV6a1, drives an increase in forward locomotion compared to control. Red rectangle indicates light ON period of increasing intensity. (C) Z-projection of the brain expression patterns of the two split-GAL4 lines for cell type 7A, LH1139 (top) and LH1129 (bottom). Note minor trachea labelling in LH1129. All split-GAL4 lines are driving csChrimson::mVenus (green), the neuropil stain is nc82 (magenta). See Figure 10—figure supplement 1 for full brain and nerve cord expression patterns. (D) Boxplots analysing the mean locomotion during the strongest stimulation window of five seconds (locomotion measured in pixels per second, one pixel is ~0.12 mm). Each dot represents the behaviour of a single fly. Asterisk indicates significantly different from the empty split-GAL4 control. (E) Schematic of the flying optogenetic stimulation paradigm. Animals are tethered in a flight area. Flying animals have either no visual stimulus, a stationary bar or a closed loop blue bar. During flight optogenetic stimulation is driven by LED stimulation bilaterally. Schematic was modified with permission. (F–H) Z-projection of the brain expression patterns of the three split-GAL4 lines used in the flight assay: (F) LH304, (G) LH528 and (H) LH989. All split-GAL4 lines are driving csChrimson::mVenus (green). Note for all expression pattern images, the neuropil stain is nc82 (magenta). See Figure 10—figure supplement 1 for full brain and nerve cord expression patterns. (I) The absolute value of yaw (turning) over time (seconds) of single LH304 split-GAL4 flies crossed to experimental (magenta) and control genotypes (dark purple). This represents turning. (J) The wingbeat frequency over time (seconds) of single LH528 split-GAL4 flies crossed to experimental (magenta) and control genotypes (dark purple). The reduction in wingbeat frequency represents a reduction in speed and persists after stimulation. (K) The wingbeat thrust over time (seconds) of single LH989 split-GAL4 flies crossed to experimental (magenta) and control genotypes (dark purple). The increase in thrust represents increased power. WTB = Wild Type Berlin background strain. In I-K, lines are mean traces from all animals, coloured shades around the lines are standard errors of the mean across the animals (n = 6 for each genotype). The rectangle pink shades indicate the periods of activation light on. The red +marks above each plot indicate the time points at which the CsChrimson traces are significantly different from the negative control traces (Wilcoxon rank sum test, p<0.05). Time scale for 0.5 s is on the top of the first stimulation period.
Figure 10—figure supplement 1
Expression patterns of split-GAL4 lines used for single fly behaviour.
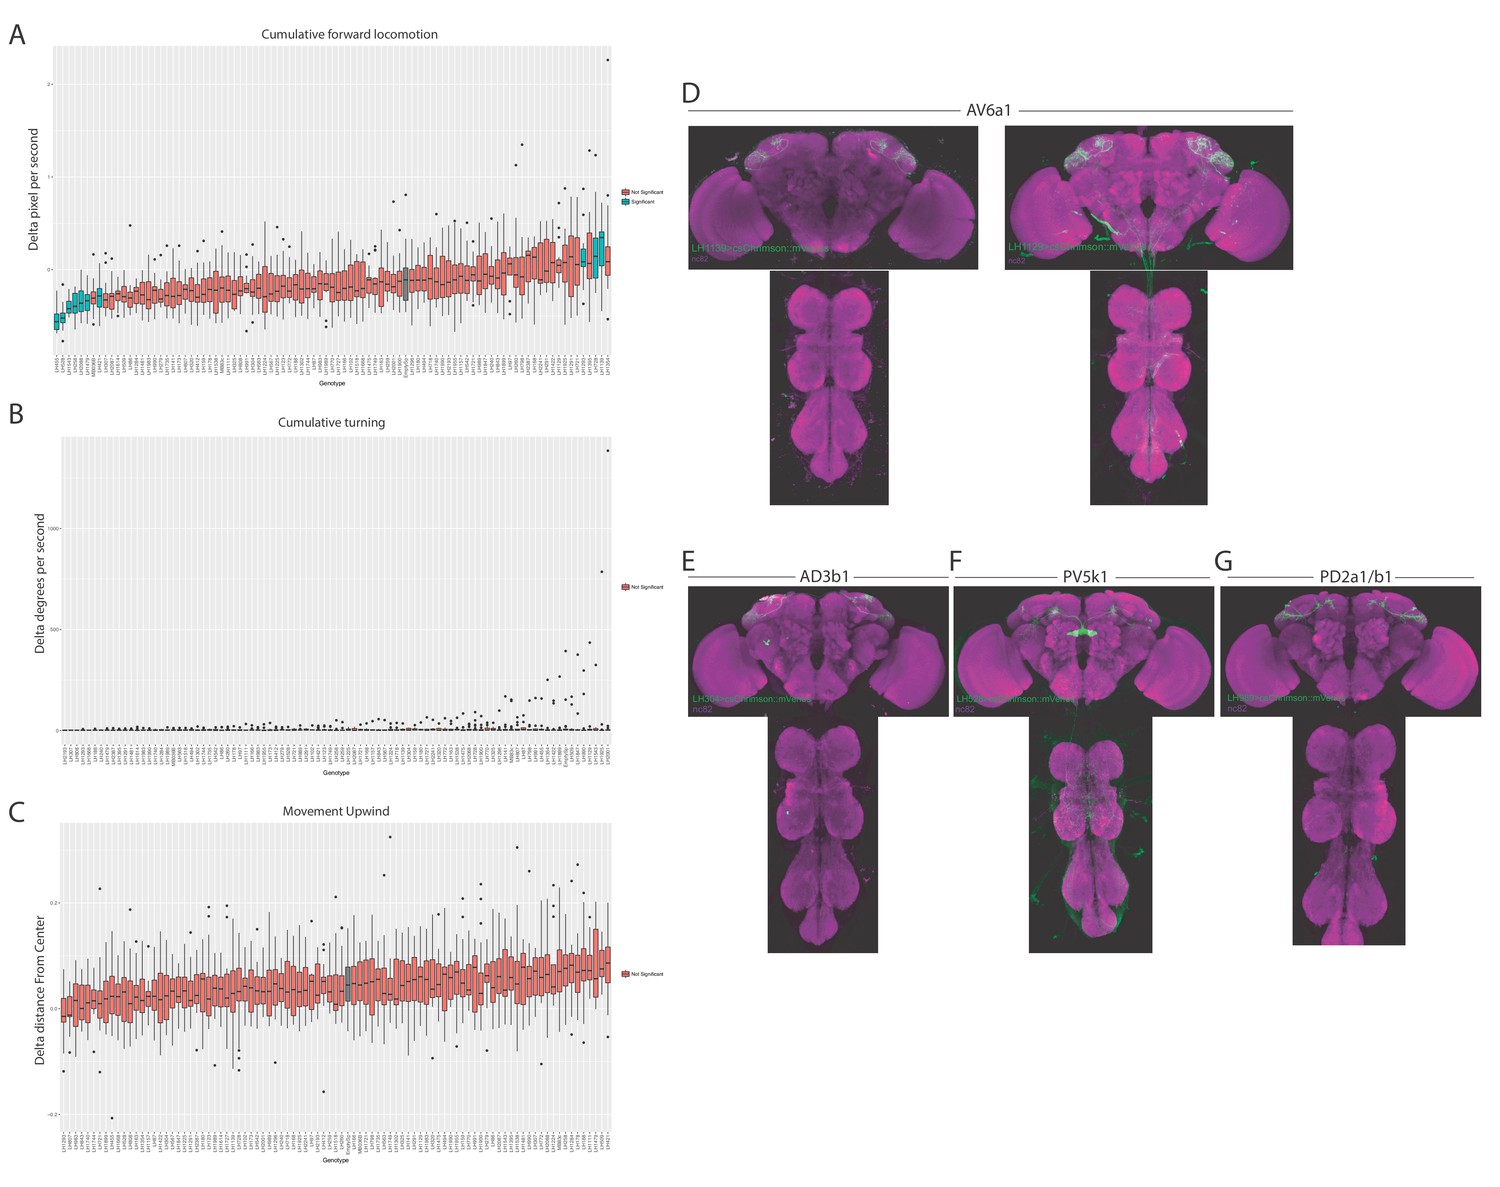
(A–C) Summary box plots describing the change in locomotion (A), turning (B) or movement upwind (C) upon activation of each of the split-GAL4 lines screened. Note this is an analysis of data from the valence experiments. The single value metric delta was calculated by taking the difference of that metric during five seconds of stimulation and prior to stimulation and normalizing it to the fly’s behaviour prior to stimulation. Only animals that were in the red-light ON segments of the paradigm for the full five second window were used for analysis (Figure 9A). Split-GAL4 lines that produce significant differences in either aversion or attraction compared to the empty split-GAL4 control are labelled in blue. Those are non-significant compared to the empty split-GAL4 control are labelled in orange. Control empty split-GAL4 line is labelled in grey. (D) Z-projection of the brain and nerve chord expression patterns of the two split-GAL4 lines used to label LH cell type AV6a1. All split-GAL4 lines are driving csChrimson::mVenus (green). Note for all expression pattern images, the neuropil stain is nc82 (magenta). (E–G) Z-projection of the brain and nerve chord expression patterns of the three split-GAL4 lines used in the flight assay: (E) LH304, (F) LH528 and (G) LH989. All split-GAL4 lines are driving csChrimson::mVenus (green). Note for all expression pattern images, the neuropil stain is nc82 (magenta).
Figure 10—figure supplement 2
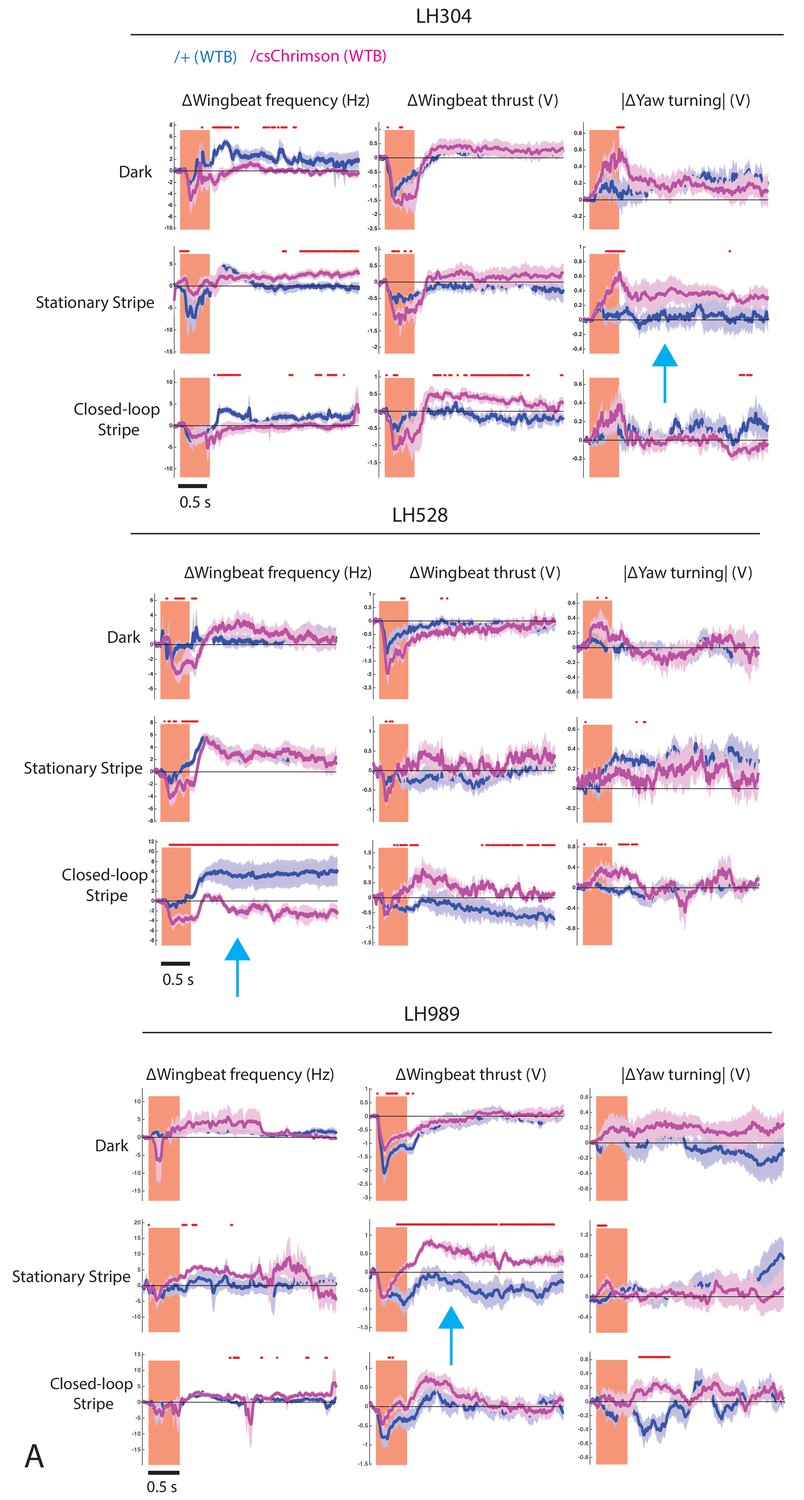
Full behavioural data for flying optogenetic experiments.
Related to Figure 10. Time trace plots for the flight parameter changes induced by the activation of CsChrimson (magenta) expressed in LH304 (A), LH528 (B) and LH989 (C), compared to without CsChrimson expression (dark purple). Each column corresponds to a different flight parameter: change of wingbeat frequency, change of wingbeat thrust, and absolute change of yaw turning. Each row corresponds to a different visual condition: all dark, a vertical blue stripe stationary in front, closed-loop vertical blue stripe. Lines are mean traces from all animals, coloured shades around the lines are standard errors of the mean across the animals (n = 6 for each genotype). The rectangle pink shades indicate the periods of activation light on. The red +marks above each plot indicate the time points at which the CsChrimson traces are significantly different from the negative control traces (Wilcoxon rank sum test, p<0.05). Time scale for 0.5 s is at bottom left. Blue arrows represent the figures included in Figure 10I–K.
Tables
Key resources table
| Reagent type (species) or resource | Designation | Source or reference | Identifiers | Additional information |
|---|---|---|---|---|
| Genetic reagent (D. melanogaster) | Drosophila split-GAL4 Line, LH989 | Dolan et al., 2018 | LH989 | http://splitgal4. janelia.org/cgi-bin/splitgal4.cgi |
| Genetic reagent (D. melanogaster) | Drosophila split-GAL4 Line, LH991 | Dolan et al., 2018 | LH991 | http://splitgal4.janelia.org/cgi-bin/splitgal4.cgi |
| Genetic reagent (D. melanogaster) | Drosophila split-GAL4 Line, LH2447/MB077B | Aso et al., 2014a | LH2447/MB077B | http://splitgal4.janelia.org/cgi-bin/splitgal4.cgi |
| Genetic reagent (D. melanogaster) | Drosophila split-GAL4 Line, LH2449/MB380B | Aso et al., 2014a | LH2449/MB380B | http://splitgal4.janelia.org/cgi-bin/splitgal4.cgi |
| Genetic reagent (D. melanogaster) | Drosophila LH split-GAL4 Line, LH split-GAL4 lines generated in this study | this study, see Supplementary file 1 | LHXXXX | http://splitgal4.janelia.org/cgi-bin/splitgal4.cgi |
| Genetic reagent (D. melanogaster) | csChrimson Reporter/Optogenetic effector, 20xUAS- csChrimson::mVenus (attP18) | Klapoetke et al., 2014 | 55134, Bloomington Stock Center | |
| Genetic reagent (D. melanogaster) | Polarity reporter , w; +; 3xUAS-Syt:: smGFP-HA (su(Hw)attP1), 5xUAS-IVS- myr::smGFP-FLAG (VK5) | Aso et al., 2014a | ||
| Antibody | Mouse anti-Brp, monoclonal | DSHB, University of Iowa, USA | nc82 | 1/30 |
| Antibody | Rabbit anti-GFP, polyclonal | Life Technologies | A-11122 | 1/1000 |
| Antibody | Goat anti-Rabbit AF488 | Life Technologies | A-11008 | 1/400 |
| Antibody | Goat anti-Rabbit AF568 | Life Technologies | A-11004 | 1/800 |
| Antibody | Rat anti-FLAG, monoclonal | Novus Biologicals | NBP1-06712SS | 1/200 |
| Antibody | Rabbit anti-HA, monoclonal | Cell Signalling Technologies | C29F4 | 1/300 |
| Antibody | ATTO 647N Goat α-Rat IgG | Rockland | 612-156-120 | 1/300 |
| Antibody | Cy3 Goat α-Rabbit | Jackson Immuno Research | 111-165-144 | 1/1000 |
| Antibody | Cy2 Goat α-Mouse | Jackson Immuno Research | 115-225-146 | 1/600 |
| Antibody | Mouse α-V5, polyclonal | AbD Serotec | DL550 | 1/500 |
| Antibody | AF488 Goat α-Mouse | Life Technologies | A-11001 | 1/400 |
| Antibody | AF594 Donkey α-Rabbit | Jackson Immuno Research | A-21207 | 1/500 |
| Chemical compound, drug | Paraformaldehyde | Electron Microscopy Sciences | #15713 | |
| Software, algorithm | Fluorender | Wan, 2012 | http://www.sci.utah.edu/software/fluorender.html | |
| Software, algorithm | Fiji | Schindelin et al., 2012 | http://fiji.sc/ | |
| Software, algorithm | CMTK | https://www.nitrc.org/projects/cmtk/ | ||
| Software, algorithm | CATMAID | Schneider-Mizell et al., 2016 | www.catmaid.org | |
| Software, algorithm | R | https://www.r-project.org/ | ||
| Software, algorithm | nat | 10.5281/zenodo.1136106 | http://jefferis.github.io/nat/ | |
| Software, algorithm | elmr | Zheng et al., 2018 | 10.5281/zenodo.1401050 | https://jefferis.github.io/elmr/ |
| Software, algorithm | lhns | This study and Frechter et al., 2019 | 10.5281/zenodo.2631765 | https://github.com/jefferislab/lhns |
| Software, algorithm | 2018lhsplitcode | This study | https://github.com/jefferislab/2018lhsplitcode | |
| Software, algorithm | flywatch | This study | 10.5281/zenodo.2631286 | https://github.com/jefferislab/flywatch |
| Software, algorithm | LHLibrary | Frechter et al., 2019 | 10.5281/zenodo.2635574 | https://github.com/jefferislab/LHlibrary |
| Software, algorithm | NMF | Gaujoux and Seoighe, 2010 | https://cran.r-project.org/package=NMF |
Table 1
Table of V Glomerulus PN designations.
Name refers to their use in this paper, Flycircuit ID refers to the neuron ID in the Flycircuit database (http://www.flycircuit.tw/) and their corresponding figure (Lin et al., 2013).
| Name | Flycircuit ID | Figure in Lin et al., 2013 |
|---|---|---|
| PN-V1 | VGlut-F-2000095 | Figure 1Ad |
| PN-V5 | VGlut-F-000463 | Figure 1Ca |
| PN-V6 | VGlut-F-800016 | Figure S2Ba |
| PN-V7 | VGlut-F-200269 | Figure 2Da |
| PN-V8 | VGlut-F-600026 | Figure S2Aa |
Additional files
-
Supplementary file 1
All LH cell types presented in this study.
A table of each cell type listed in this study. Where we could not separate cell types genetically we grouped them together as one (see text). For each cell type we display the best two lines (where available), the polarity (Output, Input or Local), the neurotransmitter (acetylcholine, GABA and/or glutamate), the average number of neurons in these lines, if that LH cell type is a ‘core’ LH cell type (see discussion) and, where available, a match to the cell types in Jeanne et al., 2018.
- https://doi.org/10.7554/eLife.43079.022
-
Supplementary file 2
All split-GAL4 lines presented in this study.
A table of all split-GAL4 lines listed by their line code, hemidrivers, constituent cell types and line quality (good, ideal or combinatorial, see text). Note that combinatorial lines with multiple cell types have an entry for each cell type.
- https://doi.org/10.7554/eLife.43079.023
-
Supplementary file 3
All split-GAL4 lines screened in optogenetic valence assay.
A table of split-GAL4 lines are listed by their line code, presence of a significant valence response in our assay (see Materials and methods for statistics) and cell type. Note the screen included three control genotypes: empty split-GAL4, Gr66a (aversion) and MB83c (attraction).
- https://doi.org/10.7554/eLife.43079.024
-
Supplementary file 4
Summary MCFO data for PV4a1:5 single cell labelling.
Different lines for PV4a1:5 which had a behavioural phenotype were used to generate single neurons by the MCFO approach (Nern et al., 2015). Each split-GAL4 line and the number of neurons of each cell type (eg. PV4a2) are listed.
- https://doi.org/10.7554/eLife.43079.025
-
Transparent reporting form
- https://doi.org/10.7554/eLife.43079.026
Download links
A two-part list of links to download the article, or parts of the article, in various formats.
Downloads (link to download the article as PDF)
Open citations (links to open the citations from this article in various online reference manager services)
Cite this article (links to download the citations from this article in formats compatible with various reference manager tools)
Neurogenetic dissection of the Drosophila lateral horn reveals major outputs, diverse behavioural functions, and interactions with the mushroom body
eLife 8:e43079.
https://doi.org/10.7554/eLife.43079


