Two distinct mechanisms target the autophagy-related E3 complex to the pre-autophagosomal structure
- Tokyo Institute of Technology, Japan
- Yokohama City University, Japan
Figures
Figure 1
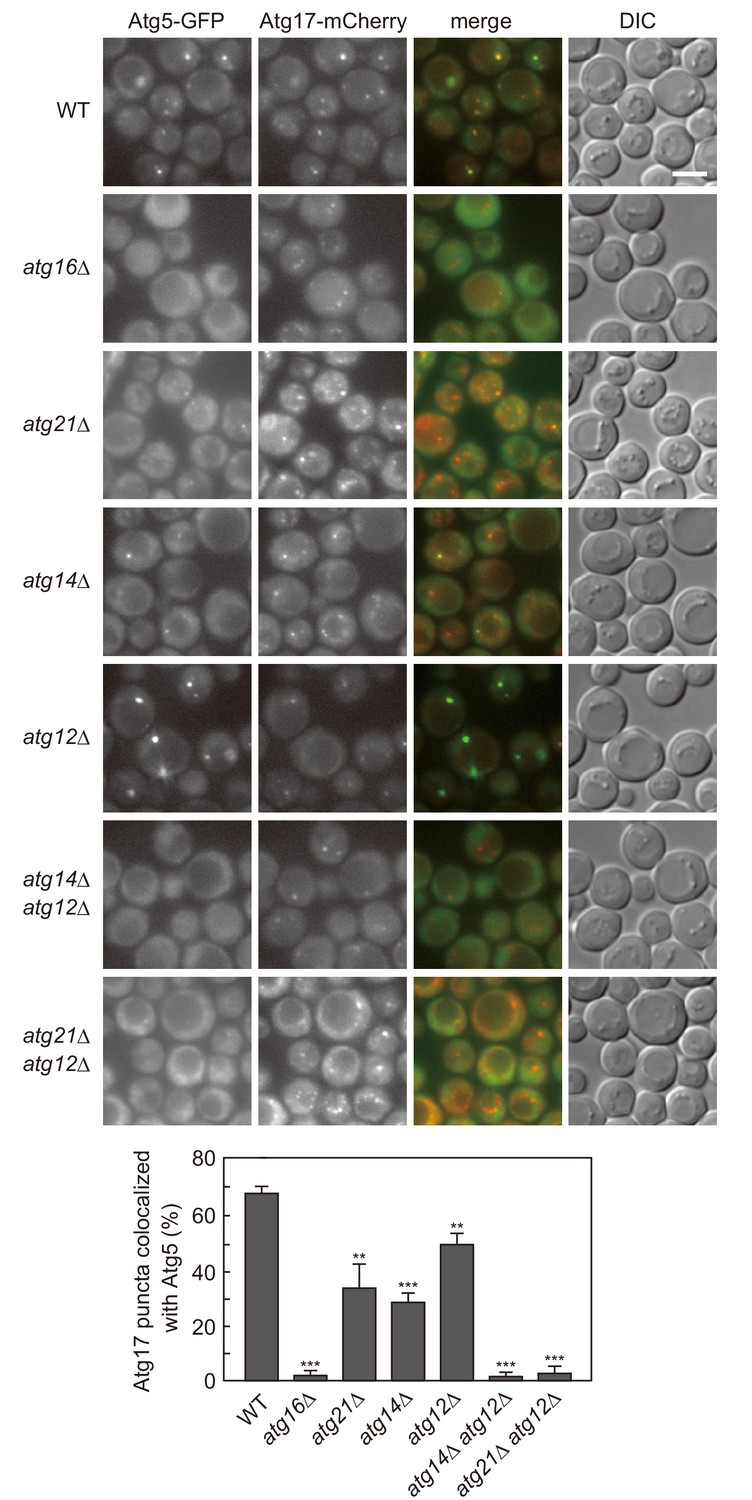
Atg12- and PI3P-dependent mechanisms cooperatively act to recruit the Atg16 complex to the PAS.
Cells expressing Atg5-GFP and Atg17-mCherry were treated with rapamycin for 90 min, and analyzed by fluorescence microscopy. DIC, Differential interference contrast microscopy. Bars, 5 μm. The ratios of Atg17-mCherry puncta positive for Atg5-GFP to total Atg17-mCherry puncta were calculated, and the mean values are shown with standard deviations (n = 3). **p<0.01; ***p<0.001 (unpaired two-tailed Student’s t-test).
Figure 2 with 2 supplements
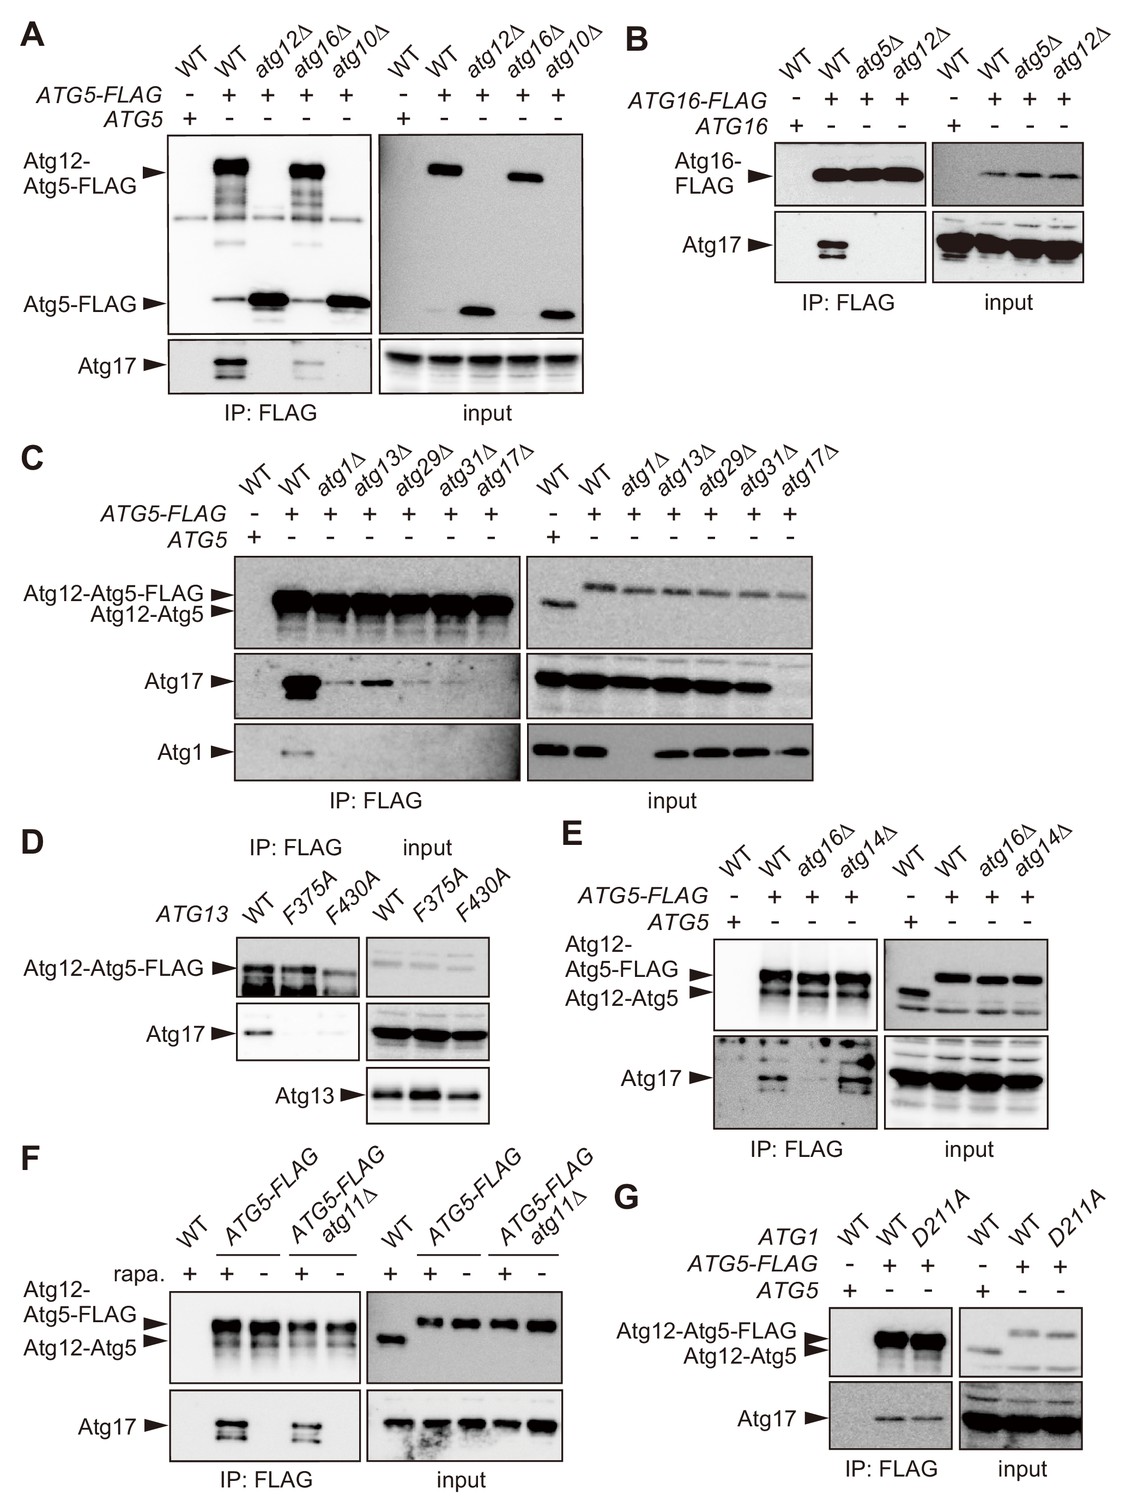
The Atg16 complex interacts with the Atg1 complex.
(A–C, E) Yeast cells expressing Atg5-FLAG (A, C–E) or Atg16-FLAG (B) from each chromosomal locus were treated with rapamycin for 2 hr, and subjected to immunoprecipitation using anti-FLAG antibody. The immunoprecipitates were analyzed by immunoblotting using antibodies against FLAG (A, B), Atg12 (C, E), Atg17 (A–C, E), and Atg1 (C). (D) atg13Δ cells expressing wild-type Atg13, the F375A mutant, or the F430A mutant from centromeric plasmids were treated with rapamycin for 2 hr, subjected to immunoprecipitation using anti-FLAG antibody, and the immunoprecipitates were analyzed by immunoblotting using antibodies against Atg12, Atg13 and Atg17. (F) Yeast cells were treated with or without rapamycin for 2 hr, and coimmunoprecipitation of Atg17 with Atg5-FLAG was examined as described in Figure 2C. (G) Coimmunoprecipitation of Atg17 with Atg5-FLAG was analyzed in cells expressing wild-type Atg1 or the D211A mutant from the original chromosomal locus as described in Figure 2C.
Figure 2—figure supplement 1
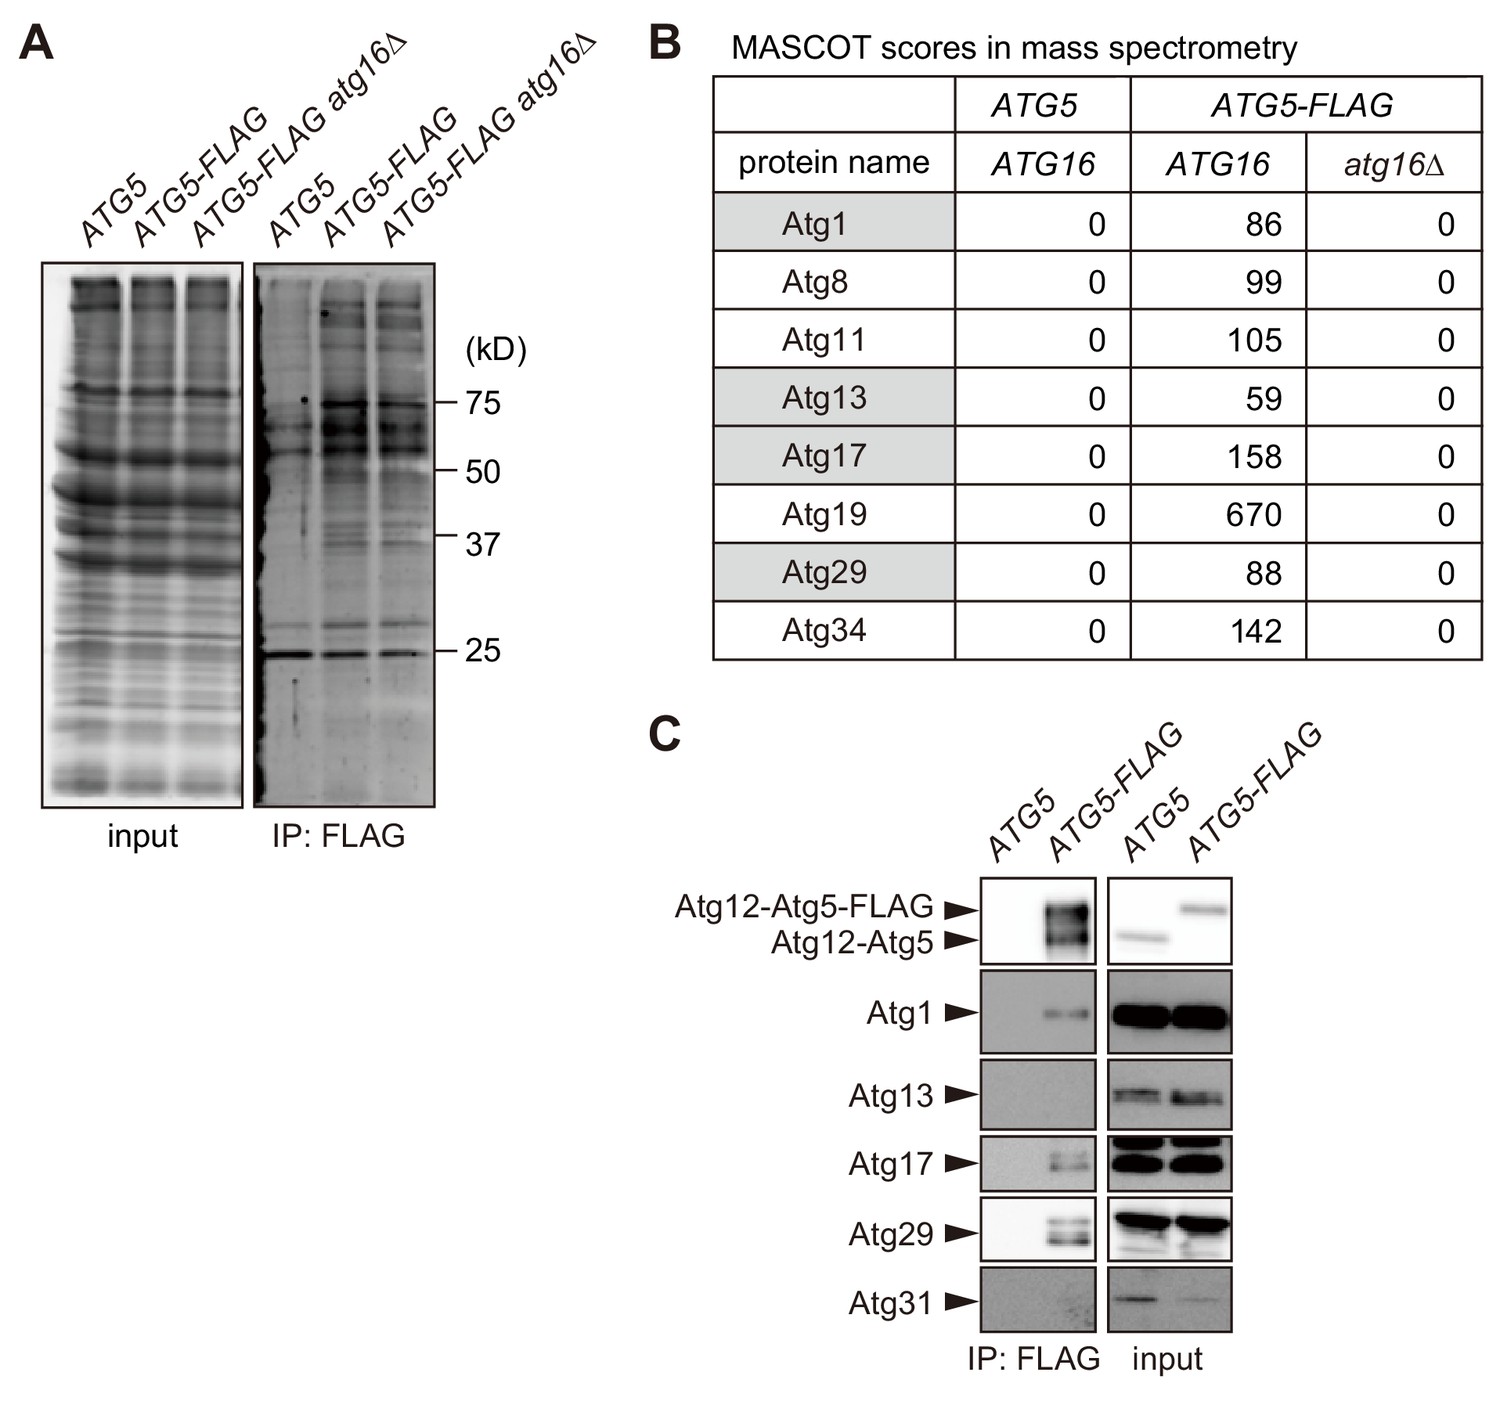
Proteomic analysis to identify proteins bound to the Atg16 complex.
(A) Yeast cells expressing Atg5-FLAG were converted to spheroplasts, treated with rapamycin for 2 hr, solubilized with 1% DDM, and subjected to immunoprecipitation using anti-FLAG antibody. Immunoprecipitates were analyzed by SDS-PAGE, followed by SYPRO Ruby staining. (B) Immunoprecipitates analyzed in (A) were subjected to mass spectrometry, and the MASCOT scores for Atg proteins identified are shown. Proteins with gray background are components of the Atg1 complex. (C) Immunoprecipitates of Atg5-FLAG were prepared as described in (A), and analyzed by immunoblotting using antibodies against Atg12, Atg1, Atg13, Atg17, Atg29 and Atg31.
Figure 2—figure supplement 2
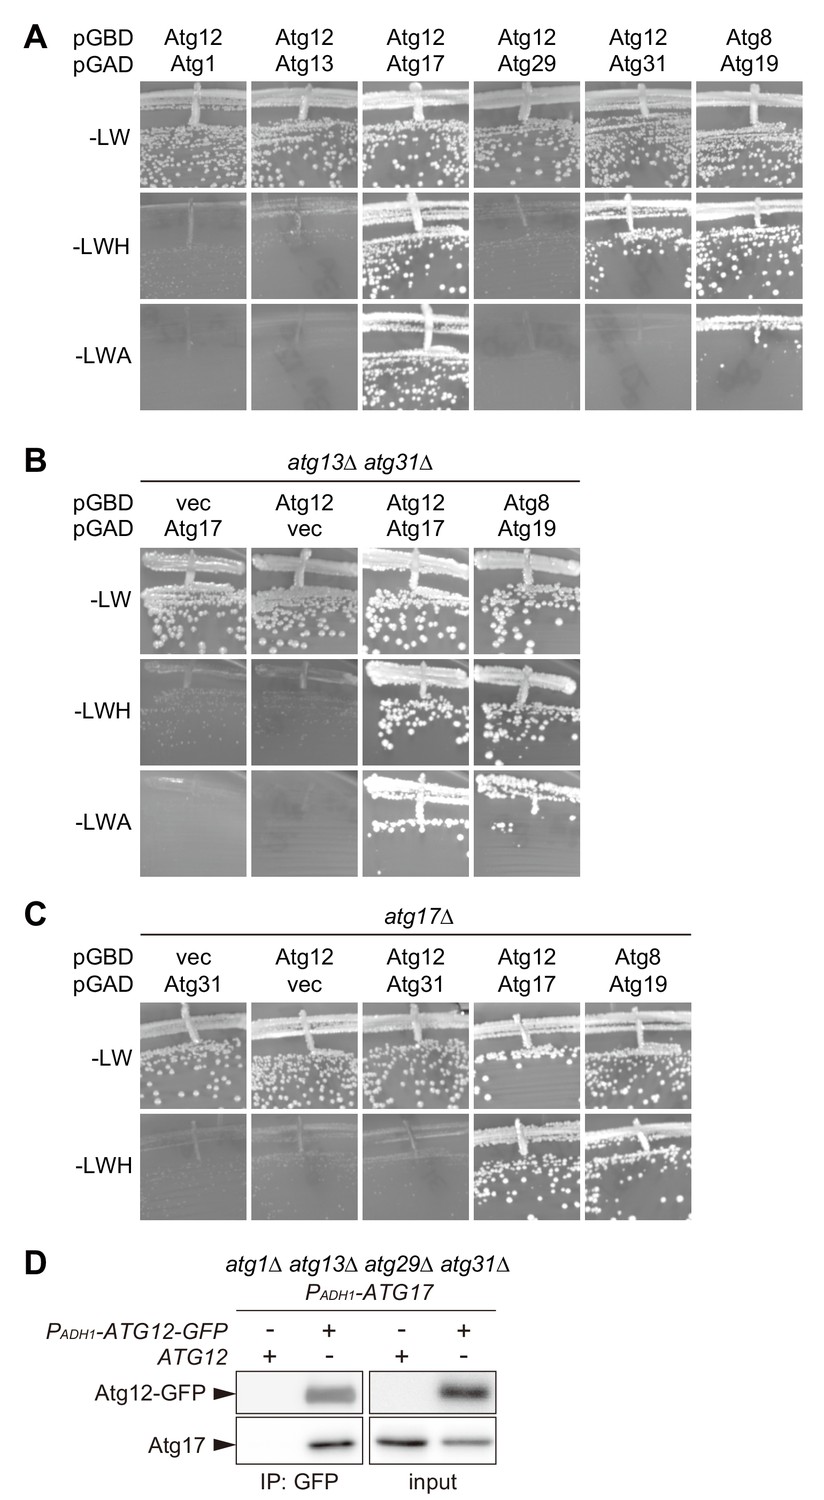
Atg17 interacts with Atg12.
(A–C) AH109 cells expressing Atg proteins fused with the Gal4 activation domain (GAD) or Gal4 DNA-binding domain (GBD) as indicated were grown at 30°C for 3 days on SC agar plates lacking leucine and tryptophan for the maintenance of the GAD and GBD plasmids, respectively (-LW), and additionally either histidine (-LWH) or adenine (-LWA) for the assessment of interactions. Cells carrying pGBD-ATG8 and pGAD-ATG19 serve as a positive control. pGAD-C1 and pGBD-C1 were used as vector controls. (D) atg1Δ atg13Δ atg29Δ atg31Δ cells expressing both ATG17 and ATG12-GFP with the ADH1 promoter (PADH1) were treated with rapamycin for 2 hr, subjected to immunoprecipitation using GFP-binding protein-conjugated beads, and the immunoprecipitates were analyzed by immunoblotting using antibodies against Atg12 and Atg17.
Figure 3 with 1 supplement
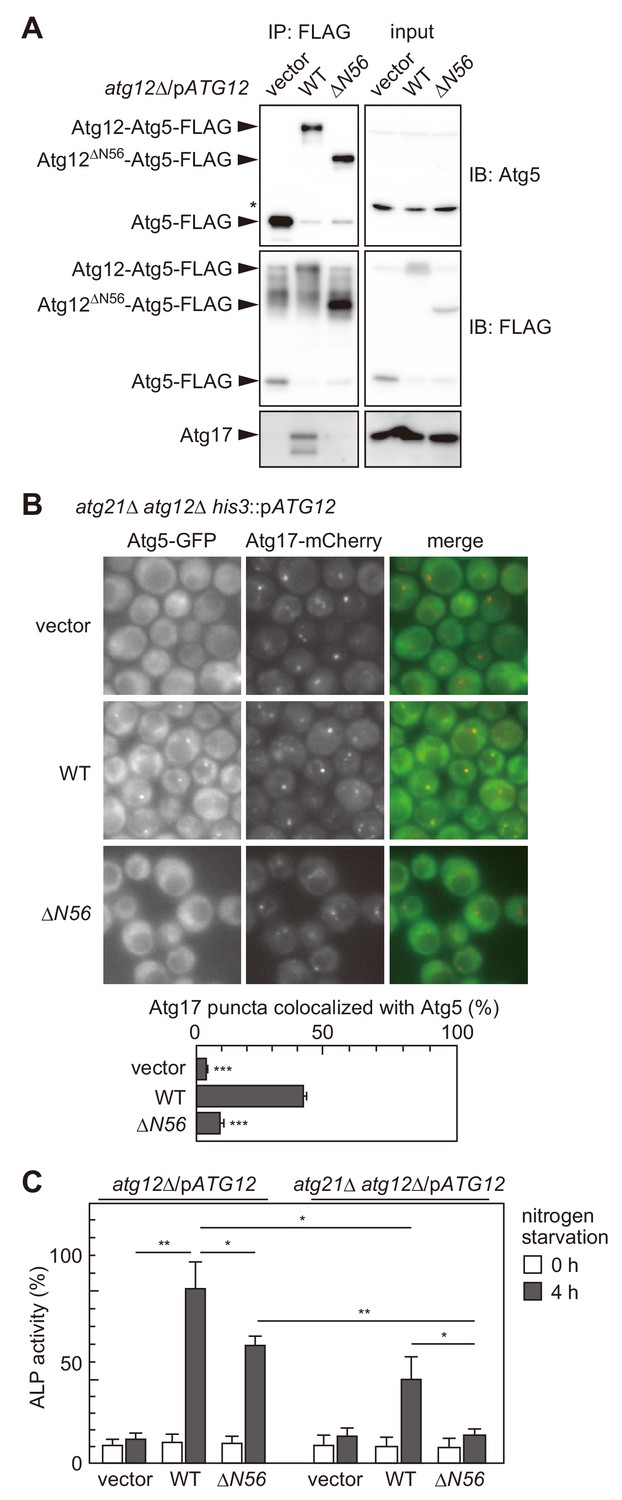
The interaction of the Atg16 complex with the Atg1 complex is involved in the PAS targeting of the Atg16 complex.
(A) atg12Δ cells expressing wild-type Atg12 or Atg12ΔN56 from centromeric plasmids were treated with rapamycin for 2 hr, and examined for coimmunoprecipitation of Atg17 with Atg5-FLAG as described in Figure 2C. The upper and middle panels were immunoblots obtained using antibodies against Atg5 and FLAG, respectively. Asterisk, non-specific bands. (B) Yeast cells were treated with rapamycin for 2 hr, and the PAS localization of Atg5-GFP was assessed by fluorescence microscopy as described in Figure 1. **p<0.01; ***p<0.001 (unpaired two-tailed Student’s t-test). (C) atg12Δ and atg12Δ atg21Δ cells expressing wild-type Atg12 or Atg12ΔN56 from centromeric plasmids were grown in nutrient-rich medium (open bars) and then starved in SD-N medium for 4 hr (closed bars), and their autophagic activities were evaluated by ALP assay. The mean values are shown with standard deviations (n = 3). *p<0.05; **p<0.01 (unpaired two-tailed Student’s t-test).
Figure 3—figure supplement 1
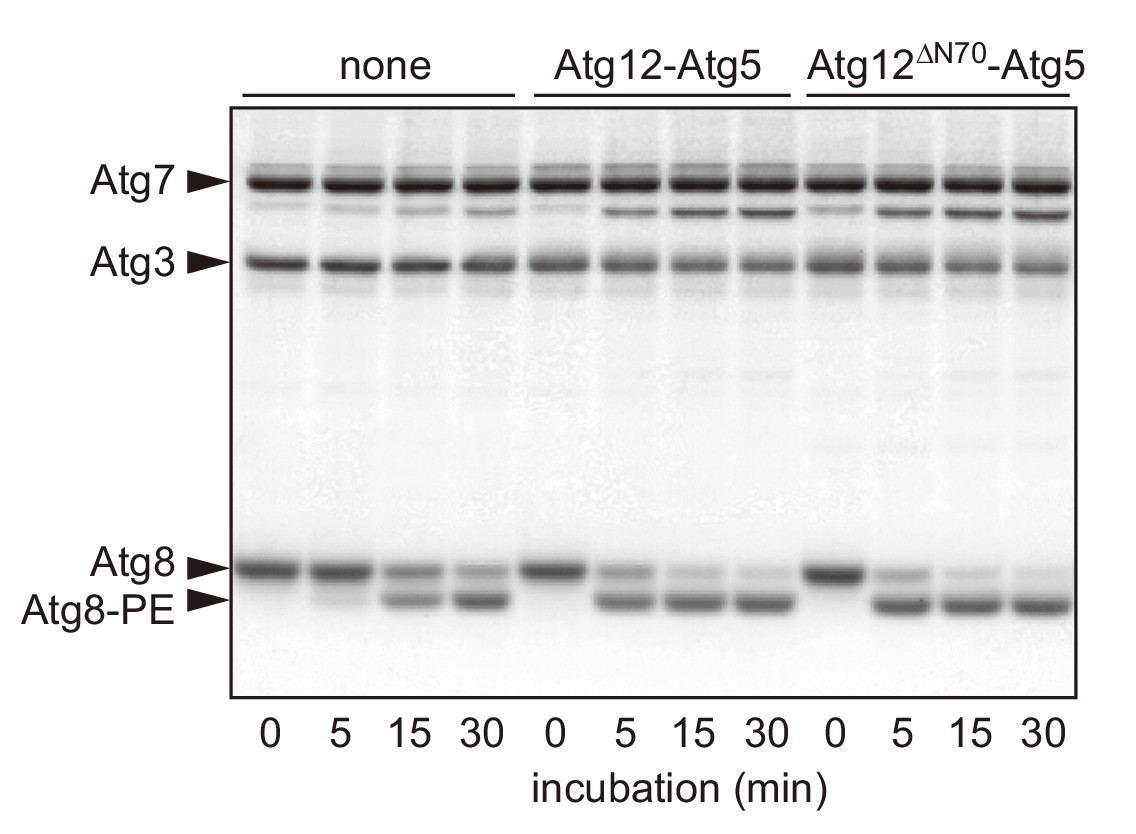
The N-terminal region of Atg12 is not required for the E3 activity of the Atg12-Atg5 conjugate.
Recombinant proteins and liposomes (20 mol% DOPE, 70 mol% POPC, and 10 mol% yeast PI) were prepared as described previously (Nakatogawa et al., 2007; Sakoh-Nakatogawa et al., 2013). Atg8 (5 μM), Atg7 (1 μM), Atg3 (1 μM), ATP (1 mM), and liposomes (350 μM lipids) were incubated with wild-type Atg12-Atg5 or Atg12ΔN70-Atg5 (0.2 μM) at 30°C for the indicated time periods, and analyzed by urea-SDS-PAGE and subsequent CBB staining. Protein bands of Atg12-Atg5 are not visible in this analysis due to its low concentration.
Figure 4
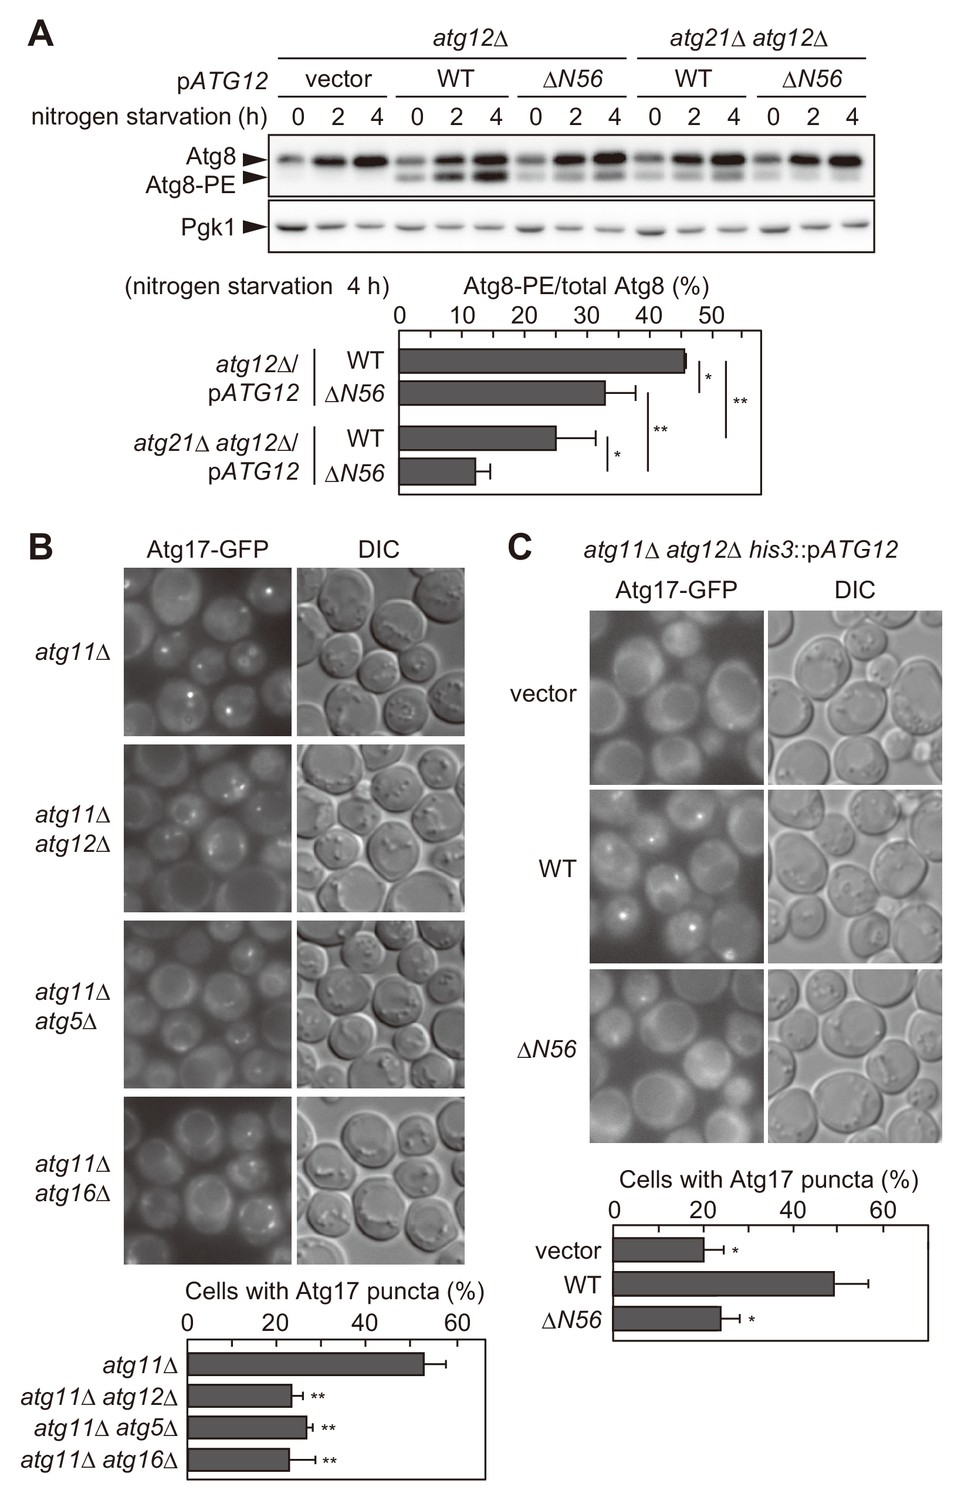
The Atg16 complex recruited via the association with the Atg1 complex facilitates Atg8 lipidation and PAS scaffold assembly.
(A) Yeast cells were incubated in nitrogen starvation medium and examined for the production of Atg8-PE by urea-SDS-PAGE and immunoblotting using anti-Atg8 antibodies (see Materials and methods). The ratio of Atg8-PE to total Atg8 was calculated, and the mean values are shown with standard deviations (n = 3). *p<0.05; **p<0.01 (unpaired two-tailed Student’s t-test). Pgk1 serves as a loading control. (B and C) Yeast cells expressing Atg17-GFP were treated with rapamycin for 90 min (B) or 2 hr (C), and observed under a fluorescence microscope. The proportion of cells containing Atg17-GFP puncta to total cells was calculated, and the mean values are shown with standard deviations (n = 3). **p<0.01 (unpaired two-tailed Student’s t-test).
Figure 5

Model for the PAS recruitment of the Atg16 complex.
The Atg16 complex is recruited to the PAS through two different pathways (Atg12-dependent targeting and PI3P-dependent targeting). Upon autophagy induction (starvation or TORC1 inactivation), the Atg1 complex is assembled, and multiple copies of Atg1 complexes further form a higher order assembly. During the process, the Atg16 complex associates with Atg1 complexes via the N-terminal region of Atg12, promoting PAS scaffold assembly. The Atg16 complex recruited at this stage also facilitates lipidation of Atg8 at a later stage in PAS organization (dashed arrow). As reported previously, following the recruitment of PI3K complex I and the production of PI3P by this complex, the Atg16 complex localizes to the PAS via the interaction with the PI3P-binding protein Atg21 to stimulate Atg8 lipidation.
Author response image 1

Cells were treated with rapamycin for 2 h, and examined by fluorescence microscopy.
Tables
Table 1
Yeast strains used in this study.
https://doi.org/10.7554/eLife.43088.010| Name | Genotype | Figures | Reference |
|---|---|---|---|
| W303-1a | MATa ade2-1 ura3-1 his3-11,15 trp1-1 leu2-3,112 can1-100 | - | (Thomas and Rothstein, 1989) |
| ScKH146 | W303-1A, ade2::ADE2 ATG5-EGFP-kanMX6 ATG17-2×mCherry-hphNT1 | 1A | This study |
| ScKH153 | ScKH146 atg16Δ::natNT2 | 1A | This study |
| ScKH182 | ScKH146 atg21Δ::zeoNT3 | 1A | This study |
| ScKH151 | ScKH146 atg14Δ::natNT2 | 1A | This study |
| ScKH149 | ScKH146 atg12Δ::natNT2 | 1A | This study |
| ScKH162 | ScKH146 atg14Δ::natNT2 atg12Δ::zeoNT3 | 1A | This study |
| ScTK623 | ScKH146 atg21Δ::natNT2 atg12Δ::zeoNT3 | 1A | This study |
| BJ2168 | MATa leu2 trp1 ura3-52 prb1-1122 pep4-3 prc1-407 gal2 | 2A-C, 2E, 2F, 2-S1A, 2-S1C | (Jones, 1991) |
| MAN169 | BJ2168 ATG5-TEV-3×FLAG-kanMX4 | 2A, 2C, 2E, 2F, 2-S1A, 2-S1C | This study |
| ScKH10 | MAN169 atg16Δ::natNT2 | 2A, 2E, 2-S1A | This study |
| ScKH32 | MAN169 atg12Δ::natNT2 | 2A, 3A | This study |
| ScKH96 | MAN169 atg10Δ::natNT2 | 2A | This study |
| ScKH90 | BJ2168 ATG16-TEV-3×FLAG-kanMX4 | 2B | This study |
| ScKH92 | ScKH90 atg5Δ::natNT2 | 2B | This study |
| ScKH93 | ScKH90 atg12Δ::natNT2 | 2B | This study |
| ScKH141 | MAN169 atg1Δ::natNT2 | 2C | This study |
| ScKH99 | MAN169 atg13Δ::natNT2 | 2C, 2D | This study |
| ScKH216 | MAN169 atg17Δ::natNT2 | 2C | This study |
| ScKH101 | MAN169 atg29Δ::natNT2 | 2C | This study |
| ScKH143 | MAN169 atg31Δ::natNT2 | 2C | This study |
| ScKH98 | MAN169 atg14Δ::natNT2 | 2E | This study |
| ScKH97 | MAN169 atg11Δ::natNT2 | 2F | This study |
| ScYH3184 | BJ2168 leu2::LEU2 | 2G | This study |
| ScKH66 | ScHY3184 ATG5-TEV-3×FLAG-kanMX4 | 2G | This study |
| ScKH68 | ScHY3184 atg1D211A-hphNT1 ATG5-TEV-3×FLAG-kanMX4 | 2G | This study |
| AH109 | MATa trp1-901 leu2-3, 112 ura3-52 his3-200 gal4Δ gal80ΔLYS2::GAL1UAS-GAL1TATA-HIS3 MEL1 GAL2UAS-GAL2TATA-ADE2 URA3::MEL1UAS-MEL1TATA-lacZ | 2-S2A | Clontech |
| ScTK967 | AH109 atg13Δ::natNT2 atg31Δ::hphNT1 | 2-S2B | This study |
| ScTK968 | AH109 atg17Δ::natNT2 | 2-S2C | This study |
| ScTK877 | BJ2168 atg11Δ::LEU2 atg29Δ::zeoNT3 atg31Δ::hphNT1 atg1Δ::natNT2 atg13Δ::Klura3 PADH1-ATG17-CgTRP1 | 2-S2D | This study |
| ScTK958 | ScTK877 KlURA3-PADH1-ATG12-EGFP-kanMX4 | 2-S2D | This study |
| ScTK649 | ScTK623 his3-11::pRS303 | 3B | This study |
| ScTK650 | ScTK623 his3-11::pRS303-ATG12 | 3B | This study |
| ScTK651 | ScTK623 his3-11::pRS303-atg12ΔN56 | 3B | This study |
| BY4741 | MATa his3Δ1 leu2Δ0 met15Δ0 ura3Δ0 | - | (Brachmann et al., 1998) |
| ScTK557 | BY4741 pho8Δ::kanMX4- PGPD-pho8Δ60 atg12Δ::natNT2 | 3C, 4A | This study |
| ScTK559 | BY4741 pho8Δ::kanMX4- PGPD-pho8Δ60 atg21Δ::zeoNT3 atg12Δ::natNT2 | 3C, 4A | This study |
| ScKH119 | W303-1A, ade2Δ::ADE2 ATG17-EGFP-kanMX4 atg11Δ::zeoNT3 | 4B | This study |
| ScKH121 | ScKH119 atg5Δ::natNT2 | 4B | This study |
| ScKH123 | ScKH119 atg12Δ::natNT2 | 4B | This study |
| ScKH125 | ScKH119 atg16Δ::natNT2 | 4B | This study |
| ScTK657 | YKH123 his3-11::pRS303 | 4C | This study |
| ScTK658 | YKH123 his3-11::pRS303-ATG12 | 4C | This study |
| ScTK659 | YKH123 his3-11::pRS303-atg12ΔN56 | 4C | This study |
Additional files
-
Transparent reporting form
- https://doi.org/10.7554/eLife.43088.011
Download links
A two-part list of links to download the article, or parts of the article, in various formats.
Downloads (link to download the article as PDF)
Open citations (links to open the citations from this article in various online reference manager services)
Cite this article (links to download the citations from this article in formats compatible with various reference manager tools)
Two distinct mechanisms target the autophagy-related E3 complex to the pre-autophagosomal structure
eLife 8:e43088.
https://doi.org/10.7554/eLife.43088


