Collider bias and the apparent protective effect of glucose-6-phosphate dehydrogenase deficiency on cerebral malaria
- Mahidol University, Thailand
- University of Oxford, United Kingdom
- The University of Melbourne, Australia
Figures
Figure 1
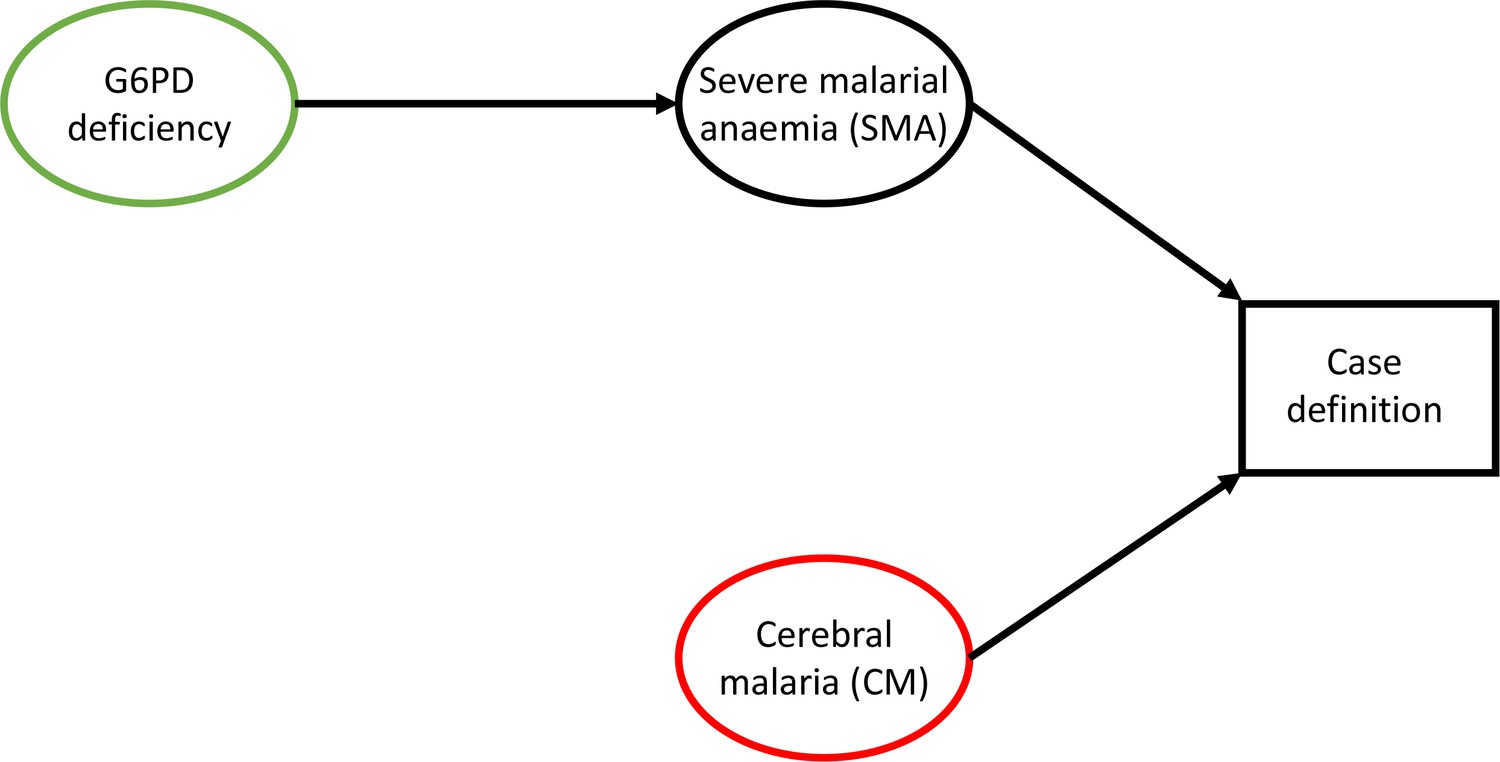
Causal diagram highlighting collider bias in Clarke et al. (2017) and Malaria Genomic Epidemiology Network et al. (2014).
G6PD deficiency is the exposure of interest (green) and cerebral malaria (CM) is the outcome of interest (red). By defining the CM cases as those who had coma but no severe anaemia, collider bias operates on the effect of G6PDd on CM.
Figure 2
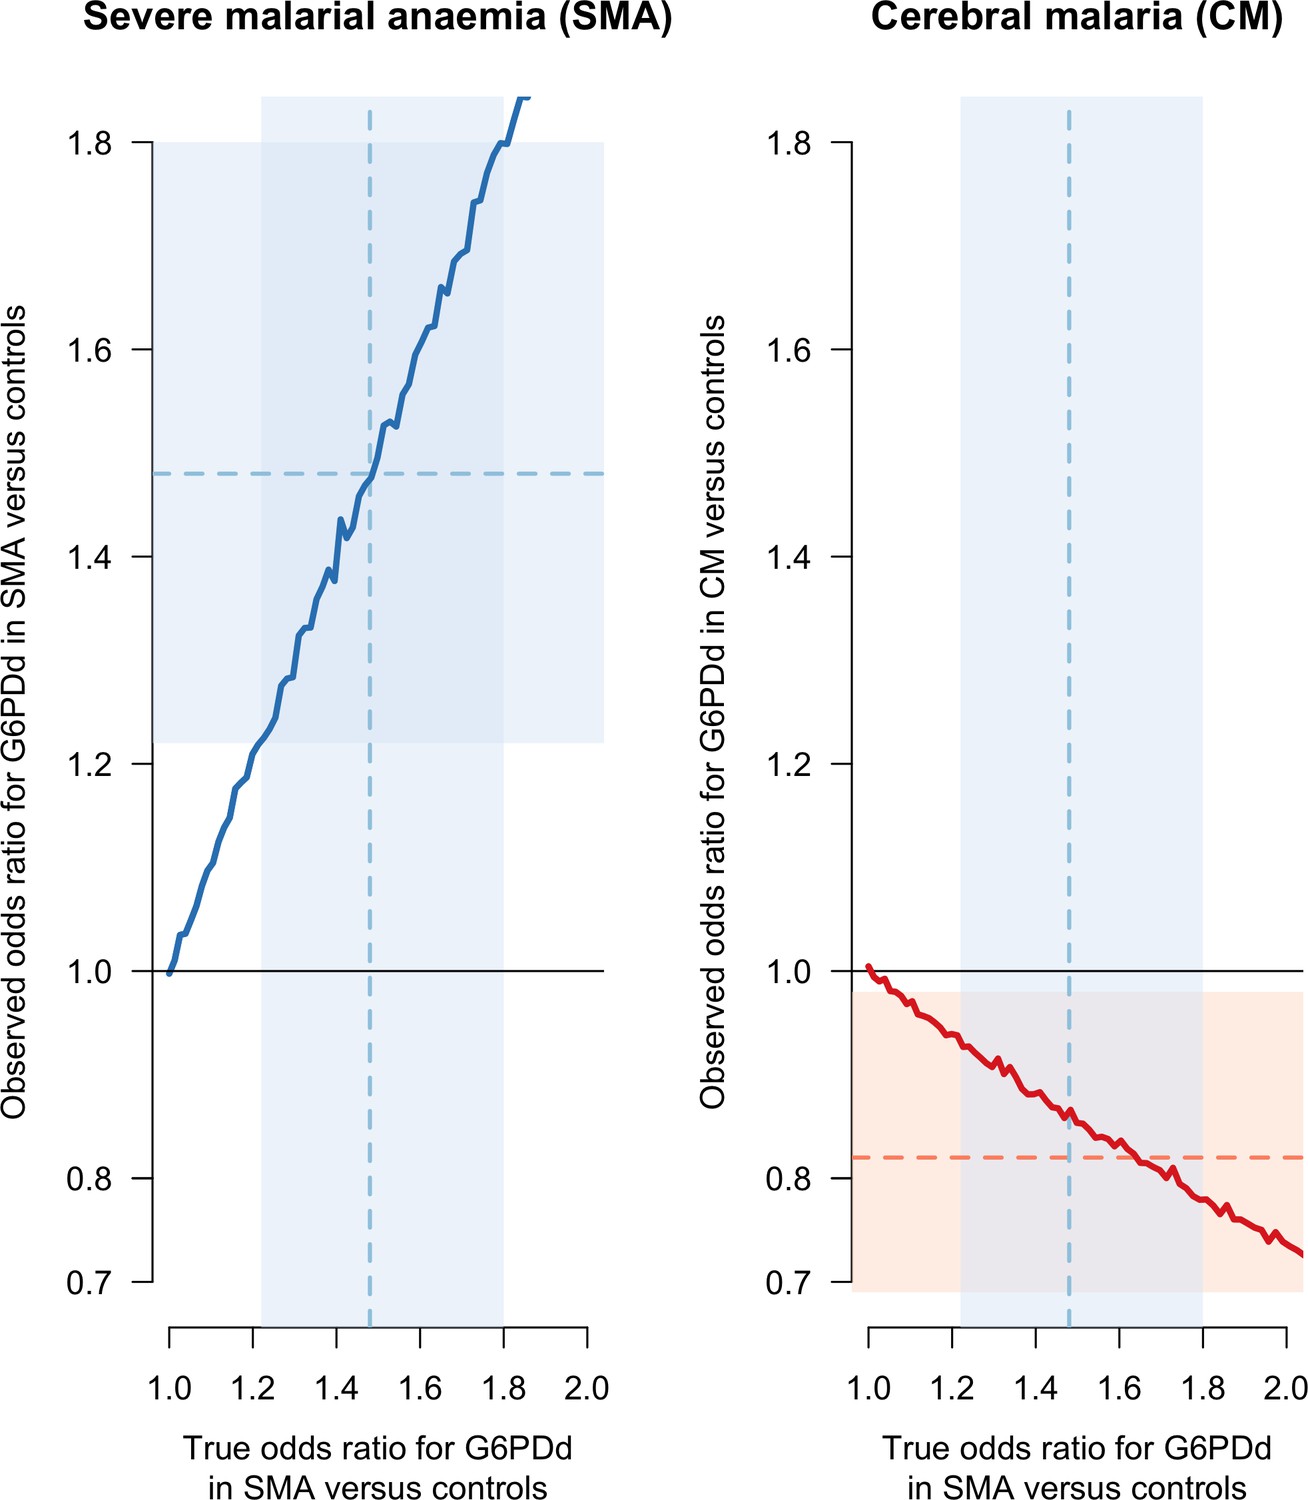
Results of the simulation based sensitivity analysis showing how collider bias can explain all the reported association between CM and G6PDd.
The simulation assumes that CM is independent of G6PD status but that SMA is dependent on G6PDd status (Figure 1). Case definitions of CM and SMA exclude patients with both. The left panel shows the observed simulation based estimate of the odds ratio (OR) for G6PDd in SMA cases versus controls (y-axis) as a function of the true simulated value (x-axis). No bias arises (the observed and true values lie on the line of identity). The right panel shows the observed simulation based estimate of the OR for G6PDd in CM cases versus controls (y-axis), again as a function of the true simulated value of the OR for G6PDd in SMA cases versus controls (x-axis). This estimate suffers from collider bias since the true value of the OR for G6PDd in SMA cases versus controls was set to 1). The faint blue shaded areas show the 95% CI [1.22–1.8] for the odds ratio of G6PDd in SMA cases versus controls, restricted to males (Clarke et al., 2017). The point estimate (1.48) is shown by the dashed blue line. The faint red shaded area shows the 95% CI [0.69–0.98] for G6PDd in CM cases versus controls, also restricted to males, with the point estimate (0.82) shown by the dashed red line. CI: confidence interval.
Author response image 1
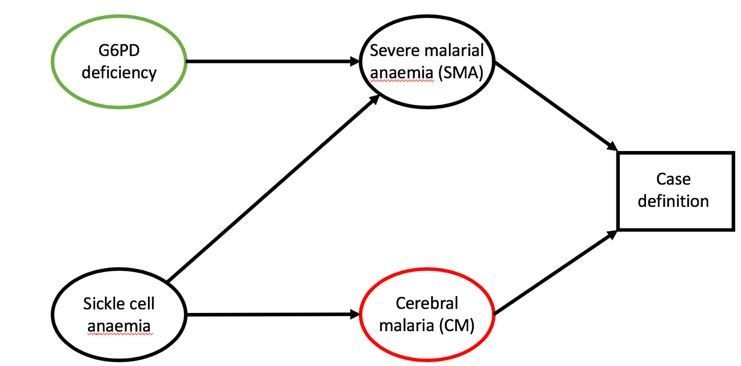
Role of sickle cell in case definitions of SMA and CM.
Sickle cell mutations will increase the likelihood of anaemia and are presumed protective against CM.
Additional files
-
Transparent reporting form
- https://doi.org/10.7554/eLife.43154.004
Download links
A two-part list of links to download the article, or parts of the article, in various formats.
Downloads (link to download the article as PDF and Executable version)
Open citations (links to open the citations from this article in various online reference manager services)
Cite this article (links to download the citations from this article in formats compatible with various reference manager tools)
Collider bias and the apparent protective effect of glucose-6-phosphate dehydrogenase deficiency on cerebral malaria
eLife 8:e43154.
https://doi.org/10.7554/eLife.43154


