The cryo-EM structure of a 12-subunit variant of RNA polymerase I reveals dissociation of the A49-A34.5 heterodimer and rearrangement of subunit A12.2
- European Molecular Biology Laboratory, Germany
- European Molecular Biology Laboratory and Heidelberg University, Faculty of Biosciences, Germany
Figures
Figure 1 with 3 supplements

Structures of the Pol I* EC and Pol I EC bound to GMPCPP.
(A) In the Pol I* EC, the A49-A34.5 is absent and the A12.2C adopts a position on the A135 surface. The overlap between this position and the C-terminal domain of A34.5 is indicated in the Pol I EC as a dashed yellow surface. (B) The 14-subunit Pol I bound to a DNA-RNA scaffold is shown colored according to the subunits indicated in the legend. In this conformation, only up to residue 67 of A12.2 is observed (A12.2 hinge), while the C-terminal domain (A12.2C) is disordered. (C) Comparison between the apo (left), Pol I EC (middle) and Pol I* EC (right) reveals that the A12.2C can alternate between TFIIS-like (apo) or Rpb9-like (right) positions. Movement of the A12.2C is around a hinge at residue 67, also indicated in the Pol I EC (A). The position of the External domain 1 (ED1) and hybrid binding (HB) interaction surfaces are indicated in the Pol I EC. A12.2 is shown as ribbon diagram and yellow surface (not EM density) for easier visualization. See also Figure 1—figure supplements 1–3.
Figure 1—figure supplement 1
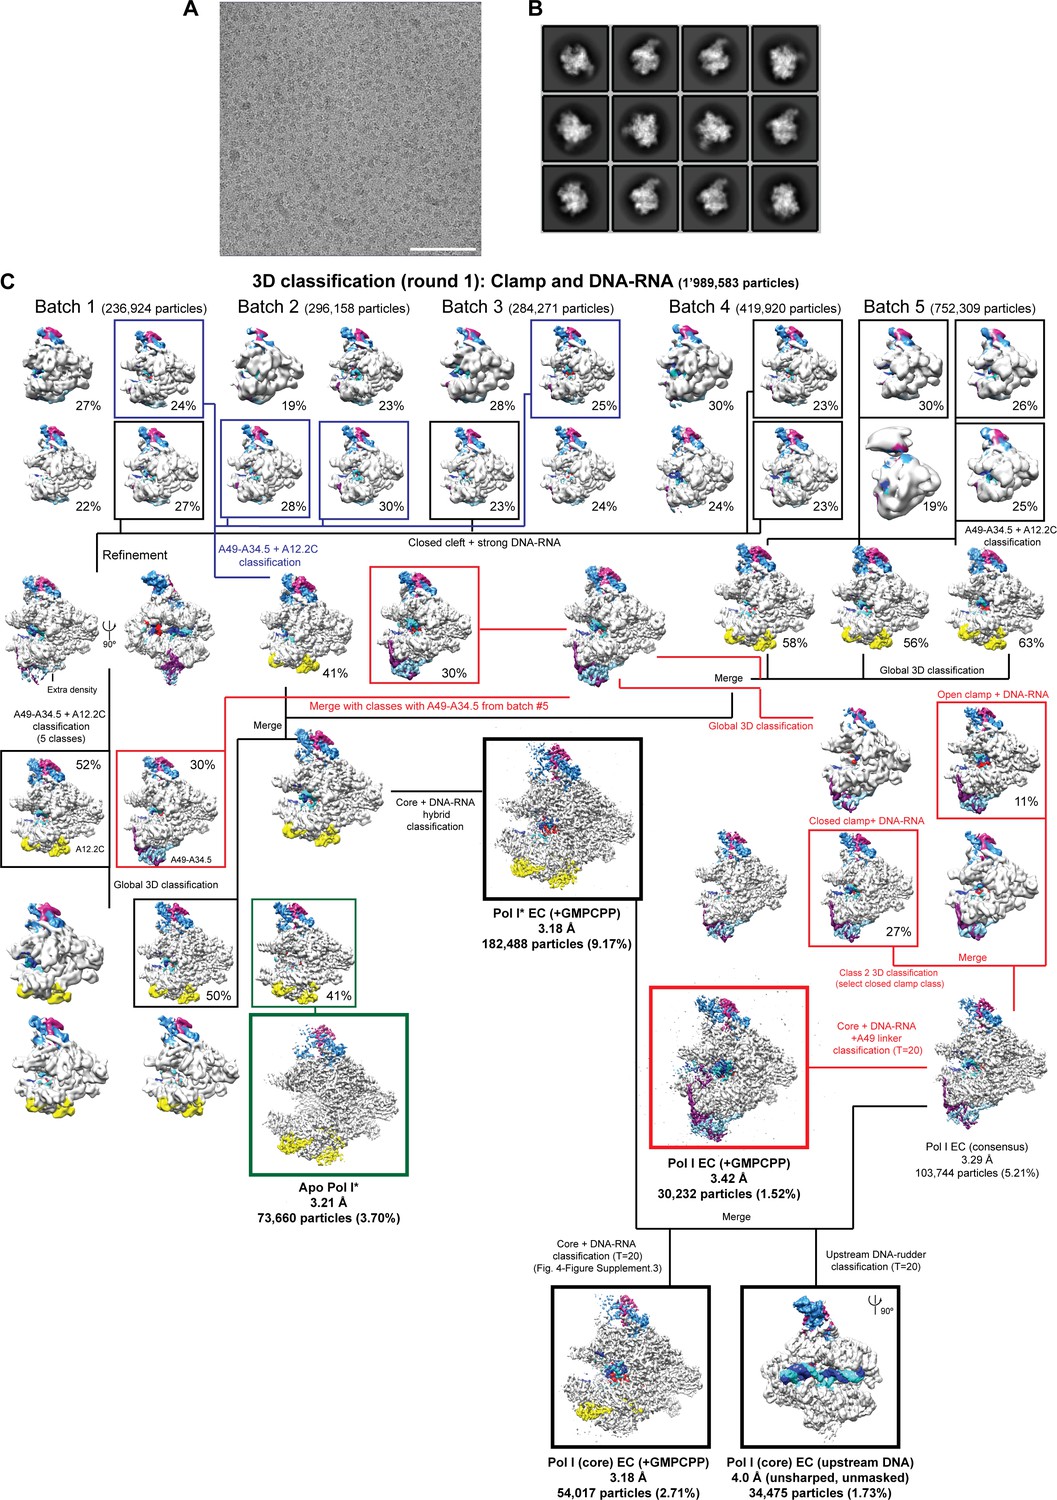
Cryo-EM data and processing.
(A) Representative micrograph. Scale bar = 100 nm. (B) 2D class averages from the initial auto-picked particles. (C) Processing pipeline. The resolution, number of particles and percentage of particles with respect to the initial number of particles after 2D classification is shown below each class. The stalk subunits (A43–A14), the DNA-RNA, the heterodimer (A49-A34.5) and A12.2 are colored as in Figure 1.
Figure 1—figure supplement 2

Average and local resolution estimates for the reconstructions.
(A) Fourier-shell correlation (FSC) curves for the reconstructions. (B) FSC curves for the models versus experimental maps. (C–F) Local resolution estimates for all the reconstructions and angular distribution plots. (G). Representative densities.
Figure 1—figure supplement 3
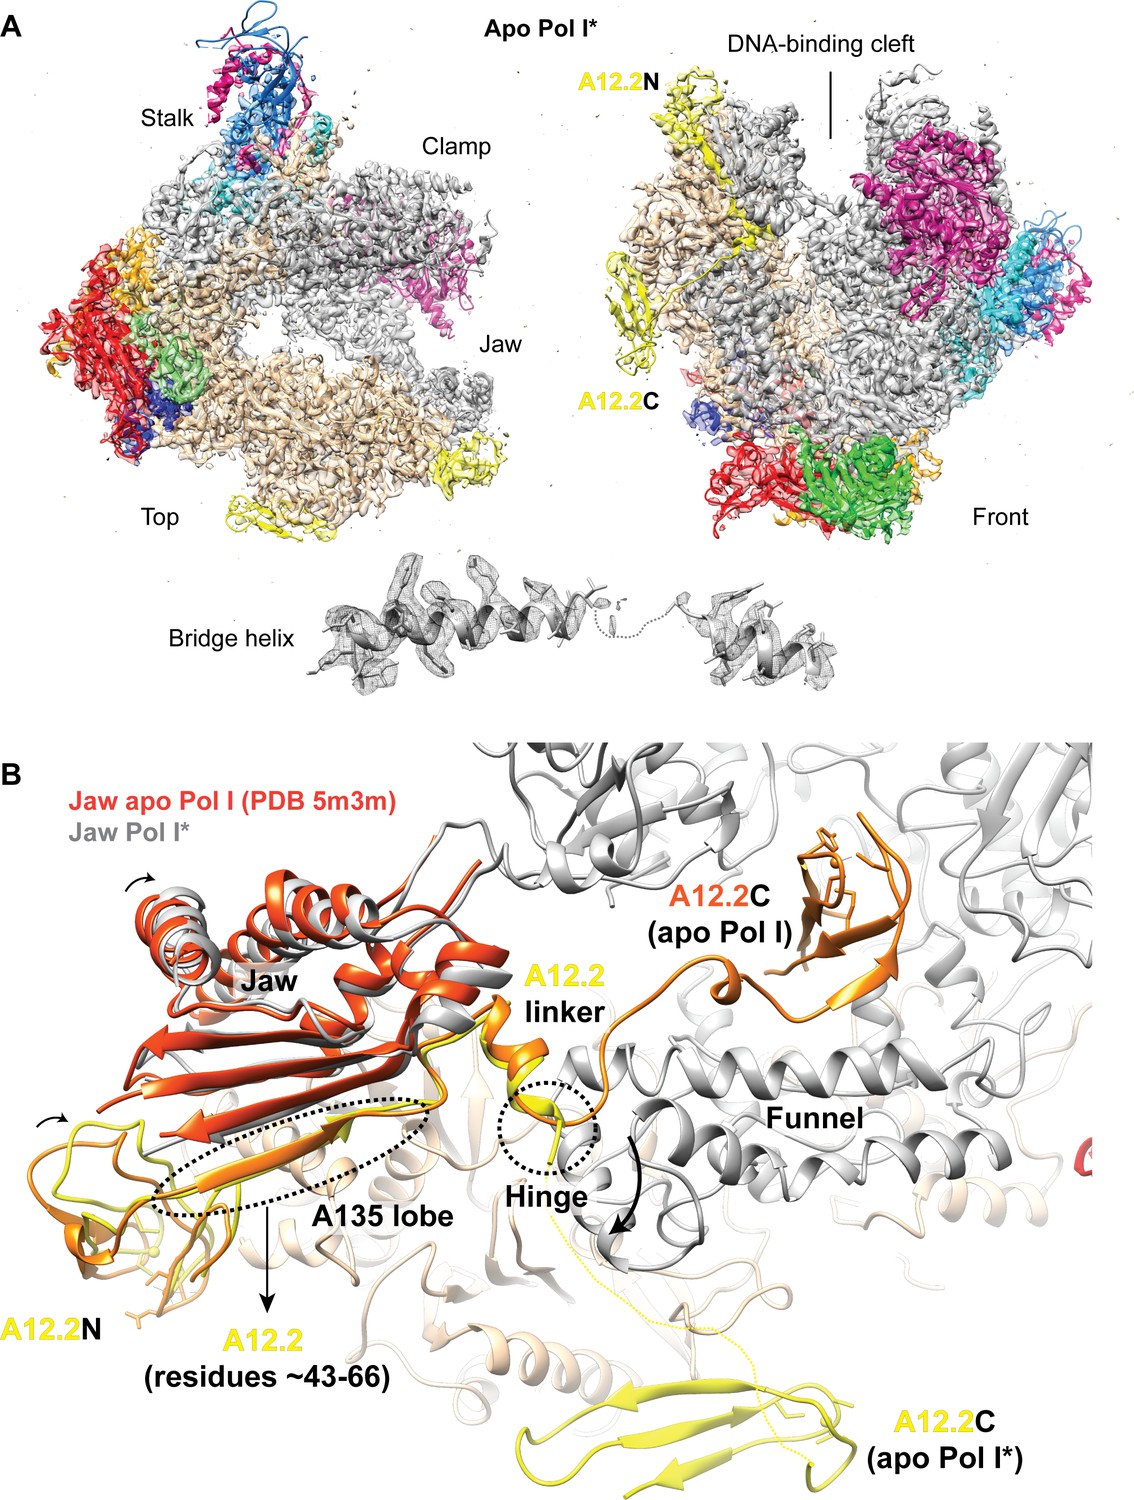
Structure of the apo Pol I*.
(A) Top and front views for the apo Pol I* model fitted into the sharpened density. The bridge helix is unfolded and shown below the models. (B) Comparison between the A12.2 in the apo Pol I (PDB: 5m3m) (Neyer et al., 2016) and apo Pol I*. In the apo Pol I, the A12.2C is in the TFIIS-like position (orange), while in the apo Pol I*, the A12.2C is in the Rpb9-like position (yellow). Movement of the A12.2C induces a shift in the N-terminal A12.2 Zn ribbon domain A12.2N, which moves towards the lobe. The flexible jaw helices also move slightly compared to the apo Pol I (orange red).
Figure 2

Interactions of the A12.2C with the A135 External domain one and Hybrid binding domain.
(A) Two interfaces are differently arranged in Pol I* versus Pol I. Both A34.5-Ct and A12.2C can bind to the A135 External Domain 1 (ED1, red), and A34.5-Ct and the N-terminal tail of A135 (A135-Nt) can bind to the A135 Hybrid Binding domain (HB). (B). In the ED1, the A12.2C interacts with both A135 N683 and N684 through Y96 and T98, respectively. (C). In the ED1, the A34.5-Ct interacts with A135 N683 and N684 through R154 and Y150, respectively. (D) In the HB surface, the A135-Nt folds back and positions R12 next to D990. (E) A34.5-Ct interacts with D990 from the HB domain through R157. Densities shown for panels B-E are from the sharpened Pol I* and Pol I EC (+GMPCPP). See also Figure 1—figure supplement 2.
Figure 3
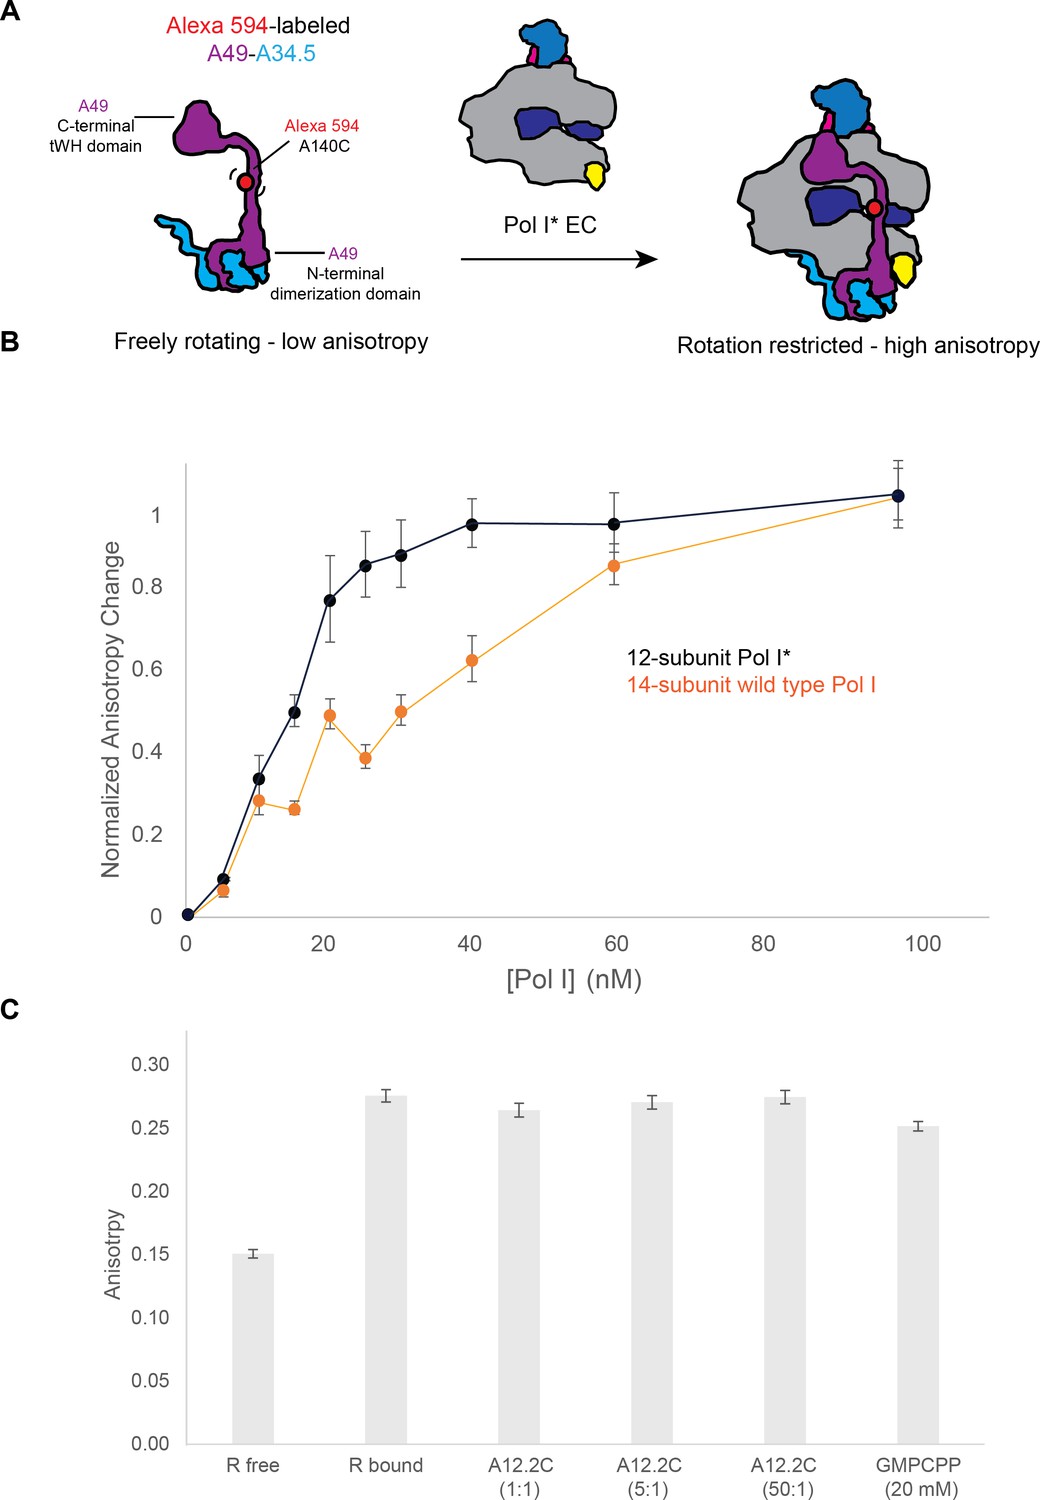
Binding of the A49-A34.5 to the Pol I core in vitro.
(A) Experimental set up. Recombinant A49-A34.5, fluorescently labeled with Alexa 594 at residue 140, was mixed with the reconstituted Pol I* EC. The change in fluorescence anisotropy reflects the binding of A49-A34.5 to the Pol I core (an increase in anisotropy with respect to the free A49-A34.5 represents the formation of the 14-subunit Pol I). (B) Experimental data showing the change in fluorescence anisotropy upon binding of fluorescent A49-A34.5 to Pol I* as well as the replacement of endogenous heterodimer in wild type Pol I by fluorescent A49-A34.5. The points shown are an average of three replicates, with the standard deviation. (C) The reconstituted and labeled 14-subunit Pol I EC was incubated with increasing amounts of recombinant A12.2C (residues 70–125) for 30 min. Compared to the Pol I EC, no change in anisotropy is observed at either 1, 5 or 50-fold molar excess of A12.2C or with 20 mM GMPCPP.
Figure 4
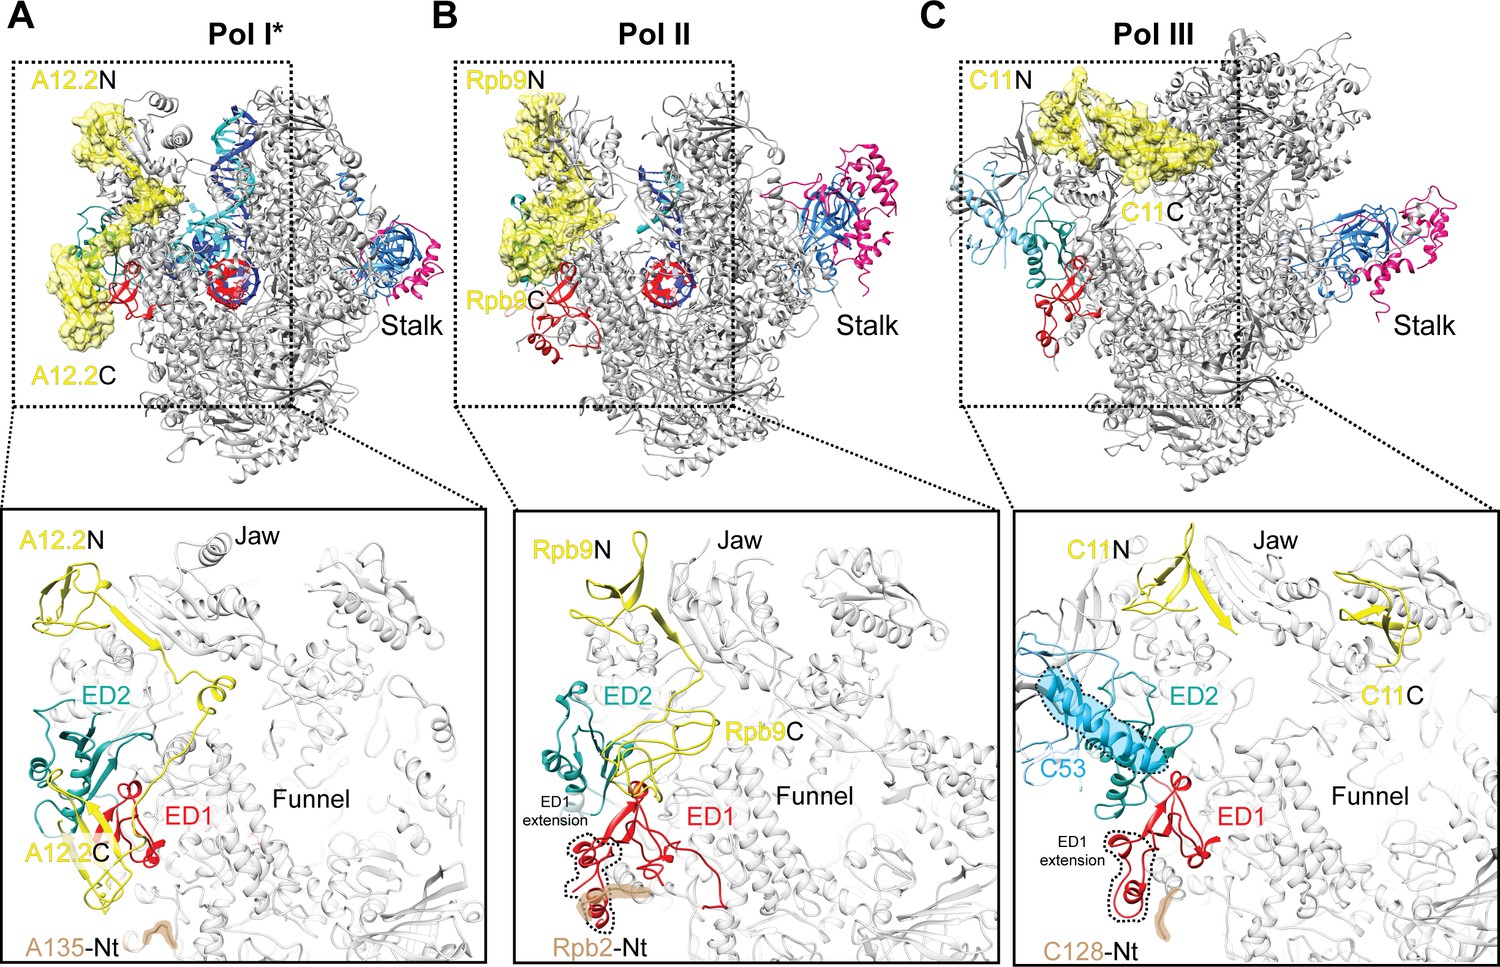
Comparison of the positions of the C-terminal domains of Pol I A12.2, Pol II Rbp9 and Pol III C11.
The positions of A12.2 (A), Rpb9 (B) or C11 (C) are shown in yellow for Pol I*, Pol II (Kettenberger et al., 2004) and Pol III (Hoffmann et al., 2015), respectively. While the ED2 is structurally more conserved (light sea green color), the ED1 in Pol II and Pol III are larger than the Pol I ED1 (red). The structure of the ED1 determines the binding mode of Pol I A12.2C and Pol II Rpb9C, while in Pol III the presence of C53 induces a different binding site for C11C far from the ED. The position of the N-terminal tail of the second largest subunit is also indicated for each polymerase, as well as the extension in the ED1 of Pol II and Pol III.
Figure 5 with 1 supplement
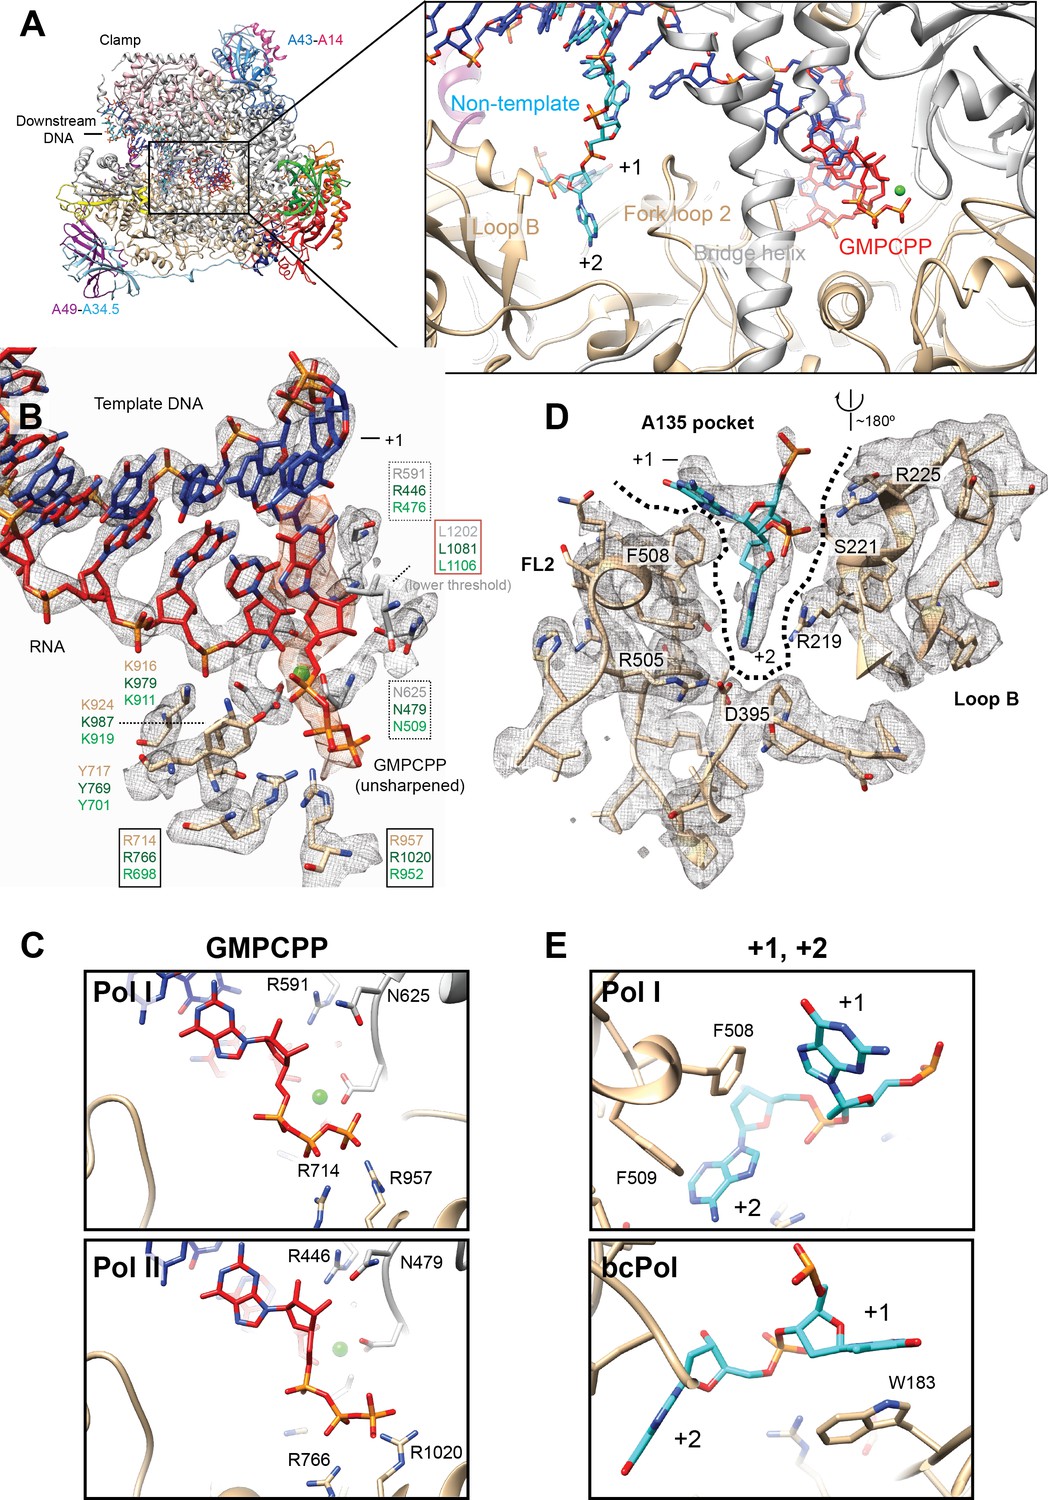
Interactions in the Pol I active site with GMPCPP, and the +1 and+2 bases from the non-template strand.
(A) Pol I can bind the incoming nucleotide (GMPCPP) in the active site, while nucleotides of the opposite, non-template strand (+1 and+2), interact with the Fork loop two and Loop B. (B) GMPCPP is bound by conserved, identical residues in Pol I and Pol II. These include two arginines that interact with the phosphate (R714 and R957), a leucine from the trigger loop that stacks against the DNA base (L1202), and R591 and N625 which recognize the 2’- and 3’-OH groups, respectively. The ‘gating tyrosine’ (Y717), involved in RNA positioning during backtracking (Cheung and Cramer, 2011), and K916 and K924, which bind the 3’-end of the RNA are also indicated. Residues are shown in grey (A190) or tan (A135) for Pol I, while those in Pol II in dark green, and in Pol III in light green. Density for the DNA-RNA hybrid is from the sharpened, Pol I (core) EC (+GMPCPP) reconstruction, while the GMPCPP is from the same reconstruction but from the unsharpened/unmasked map. Density for L1202 is shown at a lower threshold. Residues are boxed according to their proposed role: black box, triphosphate binding; red box, nucleotide base stabilization; dashed box, NTP/dNTP discrimination. (C) Binding of GMPCPP is virtually identical in Pol I (top) and Pol II (bottom, PDB: 4a3j) (Cheung et al., 2011).( D) In the downstream edge of the transcription bubble, the +2 base of the NT strand is flipped into a pocket formed by Fork loop 2 (FL2) and loop B (‘A135 pocket’). These elements interact with the nucleotide through R219, R225 and the conserved D395. (E) These interactions also position the +1 base next to F508 from FL2 (top), resembling the interaction of the +1 base with βW183 in bacterial Pol (bottom, PDB: 6alh) (Kang et al., 2017). See also Figure 5—figure supplement 1.
Figure 5—figure supplement 1

Conformational heterogeneity in the Pol I EC.
Classification of the pooled Pol I EC particles reveals intermediates with slight differences in the width of the cleft, flipping of the +2 base, density for GMPCPP and trigger loop (TL). Closing of the cleft is accompanied by +2 base flipping, stronger density for GMPCPP and appearance of density for A190 L1202. Flipping of DNA base +2 occurs before complete closing of the cleft by the movement of the Jaw/clamp domains towards each other (between state 3 and 4). The transition from state 1 to 5 includes the sequential movement of the protrusion and wall domains towards the clamp, the jaw/clamp movement that induces +2 base flipping and closing of the cleft by movement of modules 1 and 2.
Figure 6 with 1 supplement
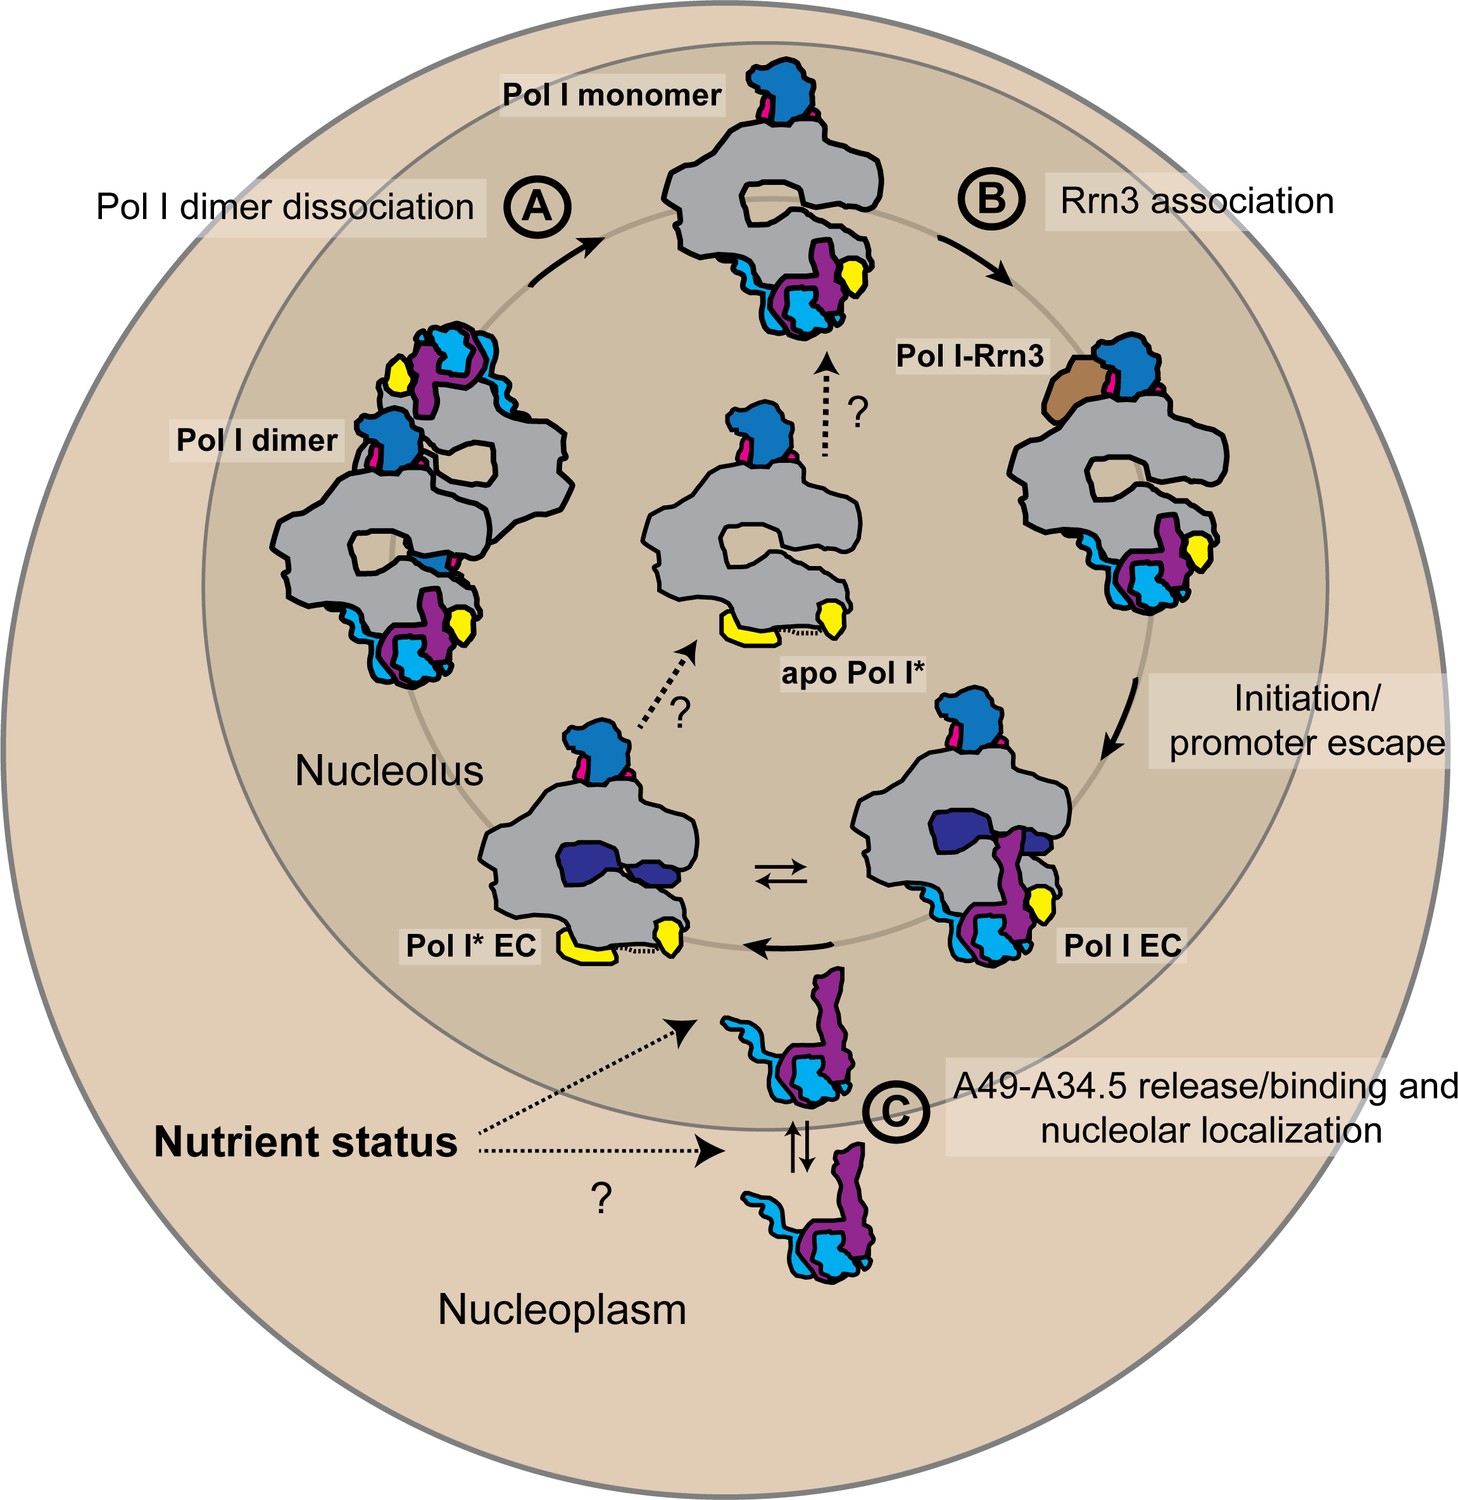
Schematic representation of the possible physiological role of the A49-A34.5 heterodimer in the regulation Pol I activity.
The pool of initiation-competent Pol I particles is controlled by Pol I homo-dimerization (A) and binding of Rrn3 to monomeric Pol I (B). After transcription initiation and promoter escape, during elongation, Pol I can alternate between Pol I and Pol I* conformations. Release of the A49-A34.5 heterodimer would allow the recruitment of elongation factors (C). After dissociating from DNA, Pol I* could bind to the A49-A34.5 heterodimer to replenish the pool of initiation-competent Pol I monomers. The concentration of A49-A34.5 heterodimer in the nucleolus might be also regulated by the nutrient status of the cell as in the mammalian system. Regulated localization of the A49-A34.5 heterodimer would serve to alter the ratio of Pol I to Pol I* in the nucleolus, thereby controlling the initiation rate on the rDNA. See also Figure 6—figure supplement 1.
Figure 6—figure supplement 1
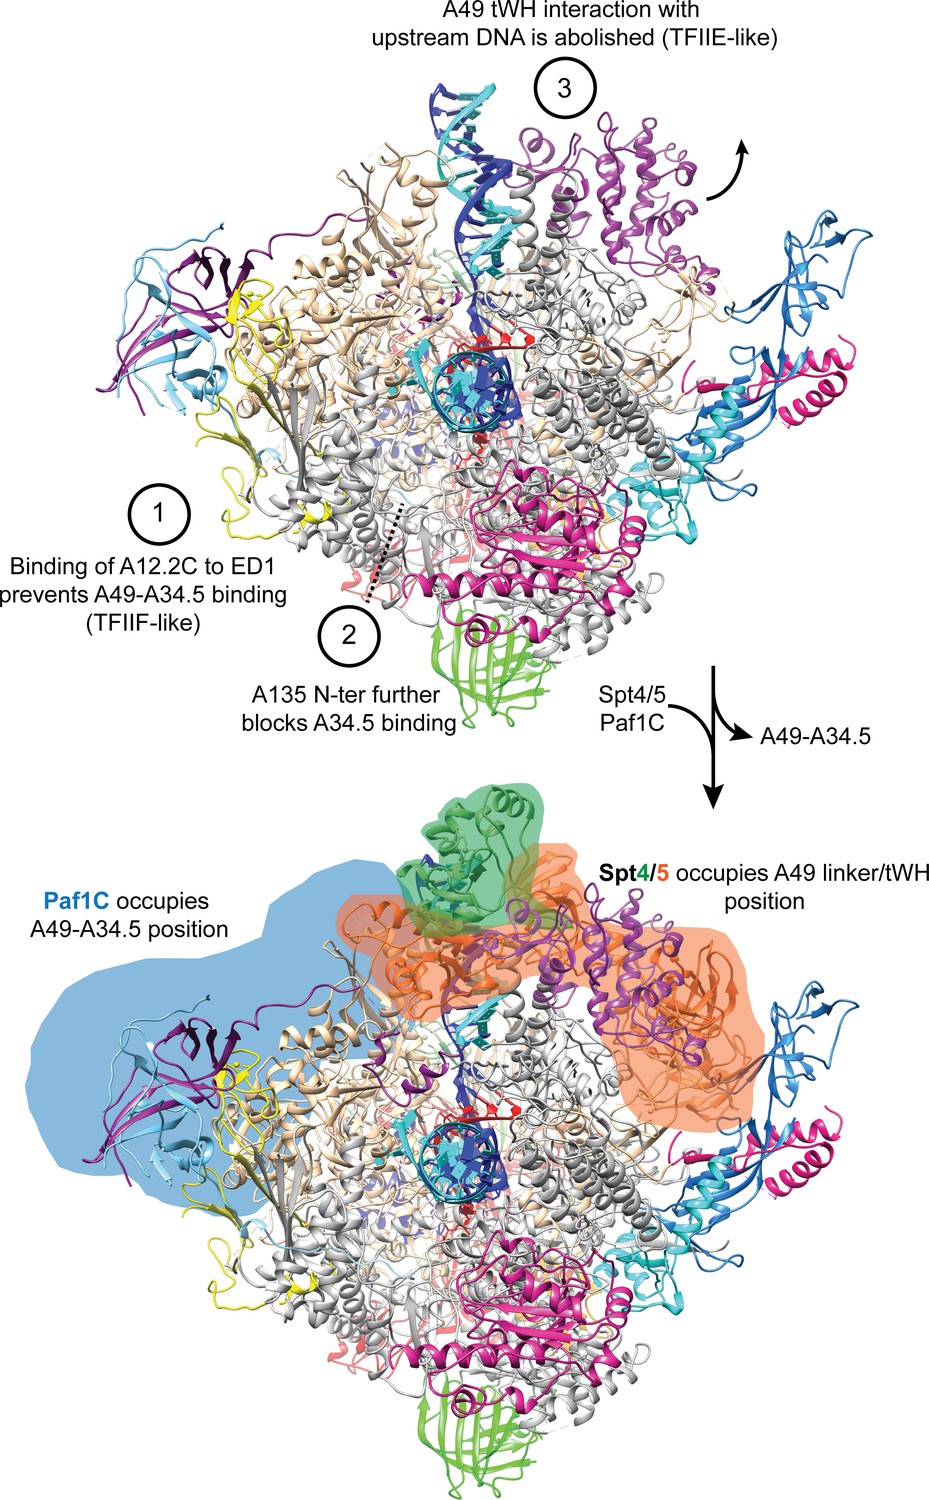
A49-A34.5 heterodimer release frees the binding site for Spt4/5 and Paf1C.
Heterodimer binding to Pol I is prevented by the binding of A12.2C to the ED1 (1) and binding of the A135-Nt to the HB further prevents interactions of Pol I with the A34.5-Ct (2). Without anchoring of the heterodimer to the Pol I core, the interaction of the A49 tWH with the upstream DNA is abolished (3). Both A49-A34.5 dimerization module and A49 tWH sites are replaced by Paf1C and Spt4/5, respectively, in a manner similar to the transition from initiation to elongation in Pol II where TFIIF and TFIIE are replaced by Paf1C and Spt4/5.
Tables
Table 1
Data collection and refinement statistics.
https://doi.org/10.7554/eLife.43204.006| Pol I (core) EC + GMPCPP | Pol I EC + GMPCPP | Pol I* EC + GMPCPP | Apo Pol I* | |
|---|---|---|---|---|
| Data collection | ||||
| Particle number | 54,017 | 30,232 | 182,488 | 73,660 |
| Pixel size (Å/pix) | 1.04 | 1.04 | 1.04 | 1.04 |
| Average resolution (Å) | 3.18 | 3.42 | 3.18 | 3.21 |
| B-factor | −44.5 | −34.2 | −92.9 | −99.6 |
| EMDB code | EMD-0240 | EMD-0238 | EMD-0239 | EMD-0241 |
| Refinement statistics* | ||||
| PDB code | 6HLR | 6HKO | 6HLQ | 6HLS |
| CC (atoms)† | 0.816 | 0.804 | 0.796 | 0.797 |
| RMSD (bonds) | 0.007 | 0.006 | 0.006 | 0.007 |
| RMSD (angles) | 1.22 | 1.18 | 1.18 | 1.25 |
| Clashscore | 4.74 | 5.27 | 5.13 | 5.17 |
| Rotamer outliers (%) | 0.12 | 0.14 | 0.09 | 0.32 |
| C-beta deviations (%) | 0 | 0 | 0 | 0 |
| Ramachandran plot | ||||
| Outliers (%) | 0 | 0 | 0 | 0 |
| Allowed (%) | 4.9 | 5.64 | 4.59 | 5.48 |
| Favored (%) | 95.1 | 94.36 | 95.41 | 94.61 |
| Molprobity score | 1.58 | 1.67 | 1.59 | 1.65 |
-
*Calculated with Molprobity.
†From PHENIX real space refinement.
Additional files
-
Transparent reporting form
- https://doi.org/10.7554/eLife.43204.014
Download links
A two-part list of links to download the article, or parts of the article, in various formats.
Downloads (link to download the article as PDF)
Open citations (links to open the citations from this article in various online reference manager services)
Cite this article (links to download the citations from this article in formats compatible with various reference manager tools)
The cryo-EM structure of a 12-subunit variant of RNA polymerase I reveals dissociation of the A49-A34.5 heterodimer and rearrangement of subunit A12.2
eLife 8:e43204.
https://doi.org/10.7554/eLife.43204


