Optical manipulation of sphingolipid biosynthesis using photoswitchable ceramides
- University of Osnabrück, Germany
- Ludwig Maximilians University Munich, Germany
- Max Planck Institute of Biochemistry, Germany
- New York University, United States
- Oregon Health and Science University, United States
Figures
Figure 1 with 4 supplements

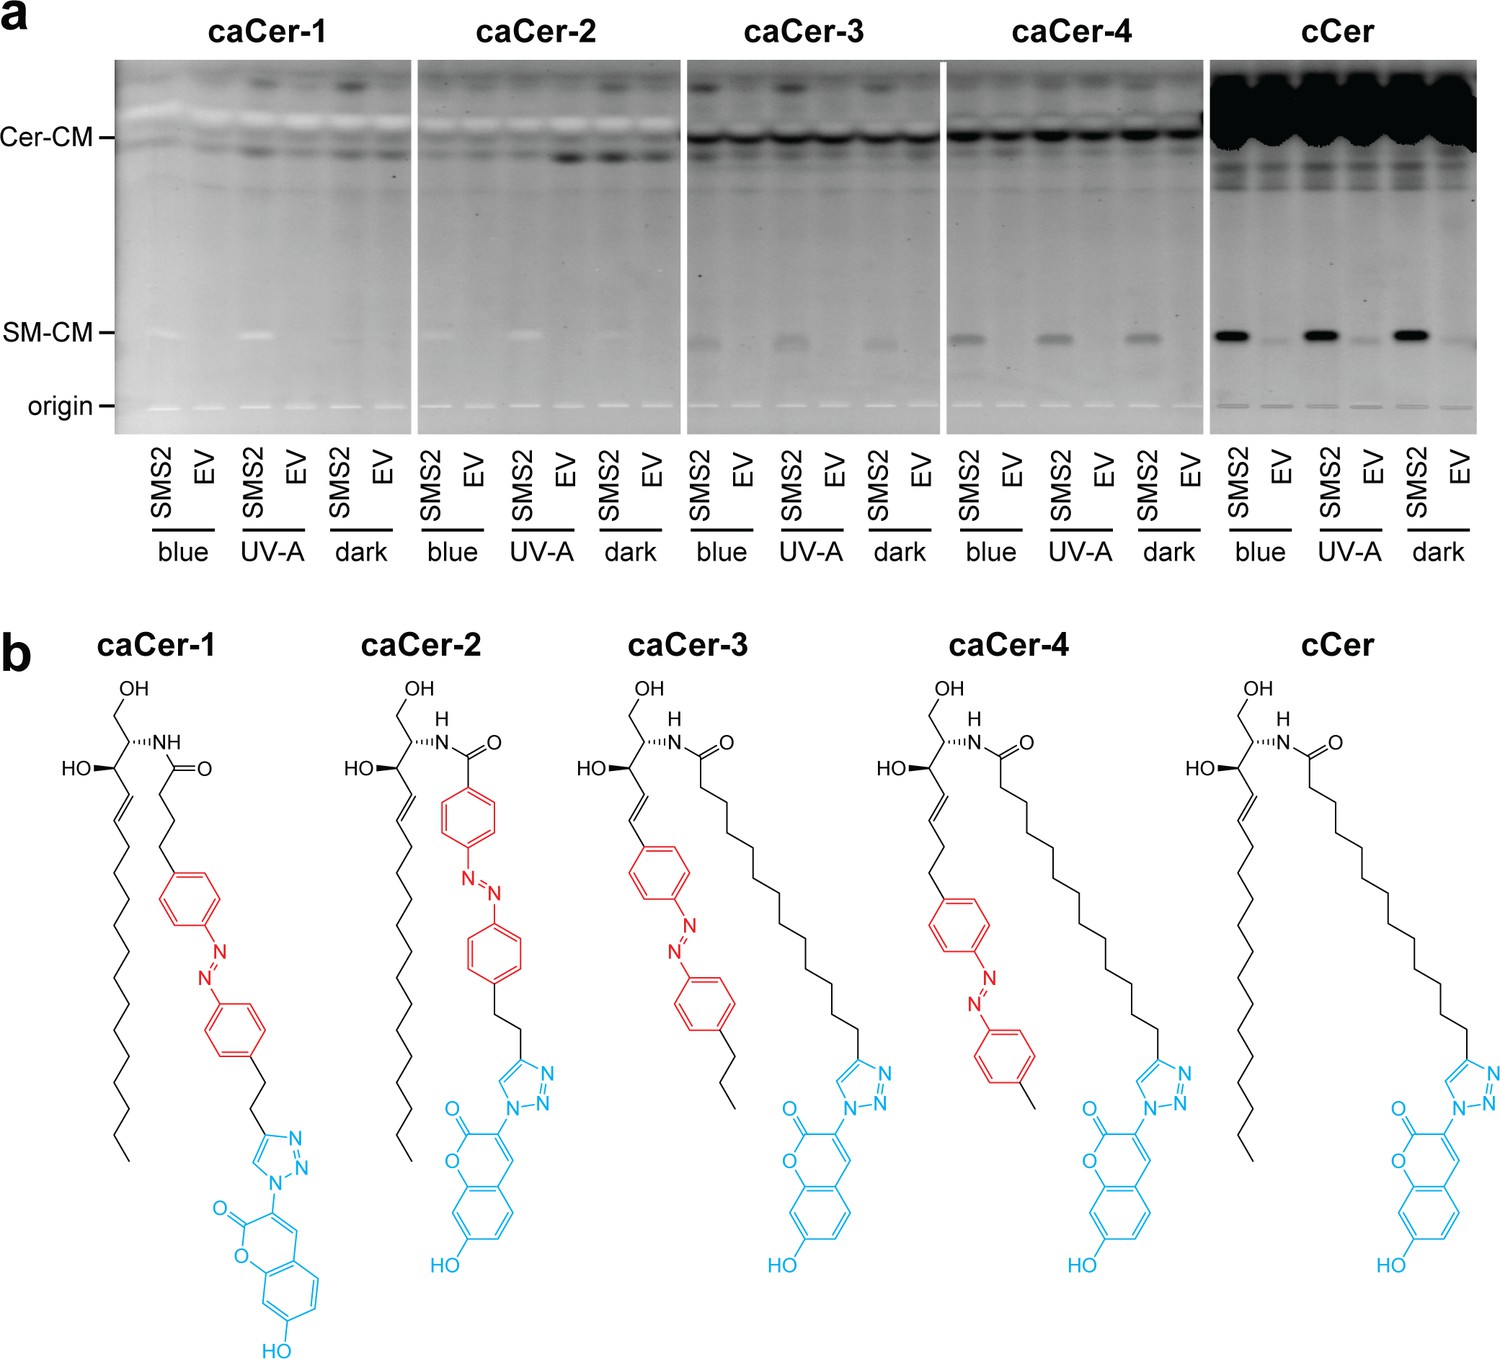
Design and synthesis of clickable and photoswitchable ceramides.
(a) Chemical structure of C16:0-Cer, with color-coded sphingoid base (black) and N-acyl chain (red). (b) Chemical structures of clickable and photoswitchable ceramides caCer-1–4. (c) Chemical structures of clickable ceramide cCer and photoswitchable ceramide ACe-1. (d) caCer-1 undergoes reversible isomerization between its cis- and trans-configuration with UV-A (365 nm) and blue (470 nm) light, respectively. (e) Chemical synthesis of the photoswitchable sphingoid base aSph-1, which was N-acylated with a terminal alkyne-functionalized C15 fatty acid to afford caCer-3. (f) UV-Vis spectra of the red-shifted variant caCer-3 (50 μM in DMSO) in its dark-adapted (trans, black), UV-A-irradiated (cis, violet) and blue-irradiated (trans, blue) states. (g) caCer-3 (50 μM in DMSO) undergoes isomerization to its cis-configuration with UV-A light (350–390 nm), and this effect is completely reversed with blue light (465 nm). Photoswitching was monitored by measuring the absorbance at 365 nm.
Figure 1—figure supplement 1

Chemical synthesis of caCer-1.
The photoswitchable and clickable fatty acid cFAAzo-4 was synthesized and then coupled to d-erythro-sphingosine to afford caCer-1 in good yield.
Figure 1—figure supplement 2

Chemical synthesis of caCer-2.
The photoswitchable and clickable fatty acid cFAAzo-1 was synthesized from known alkyne 3. cFAAzo-1 was then coupled to d-erythro-sphingosine to afford caCer-2 in good yield.
Figure 1—figure supplement 3
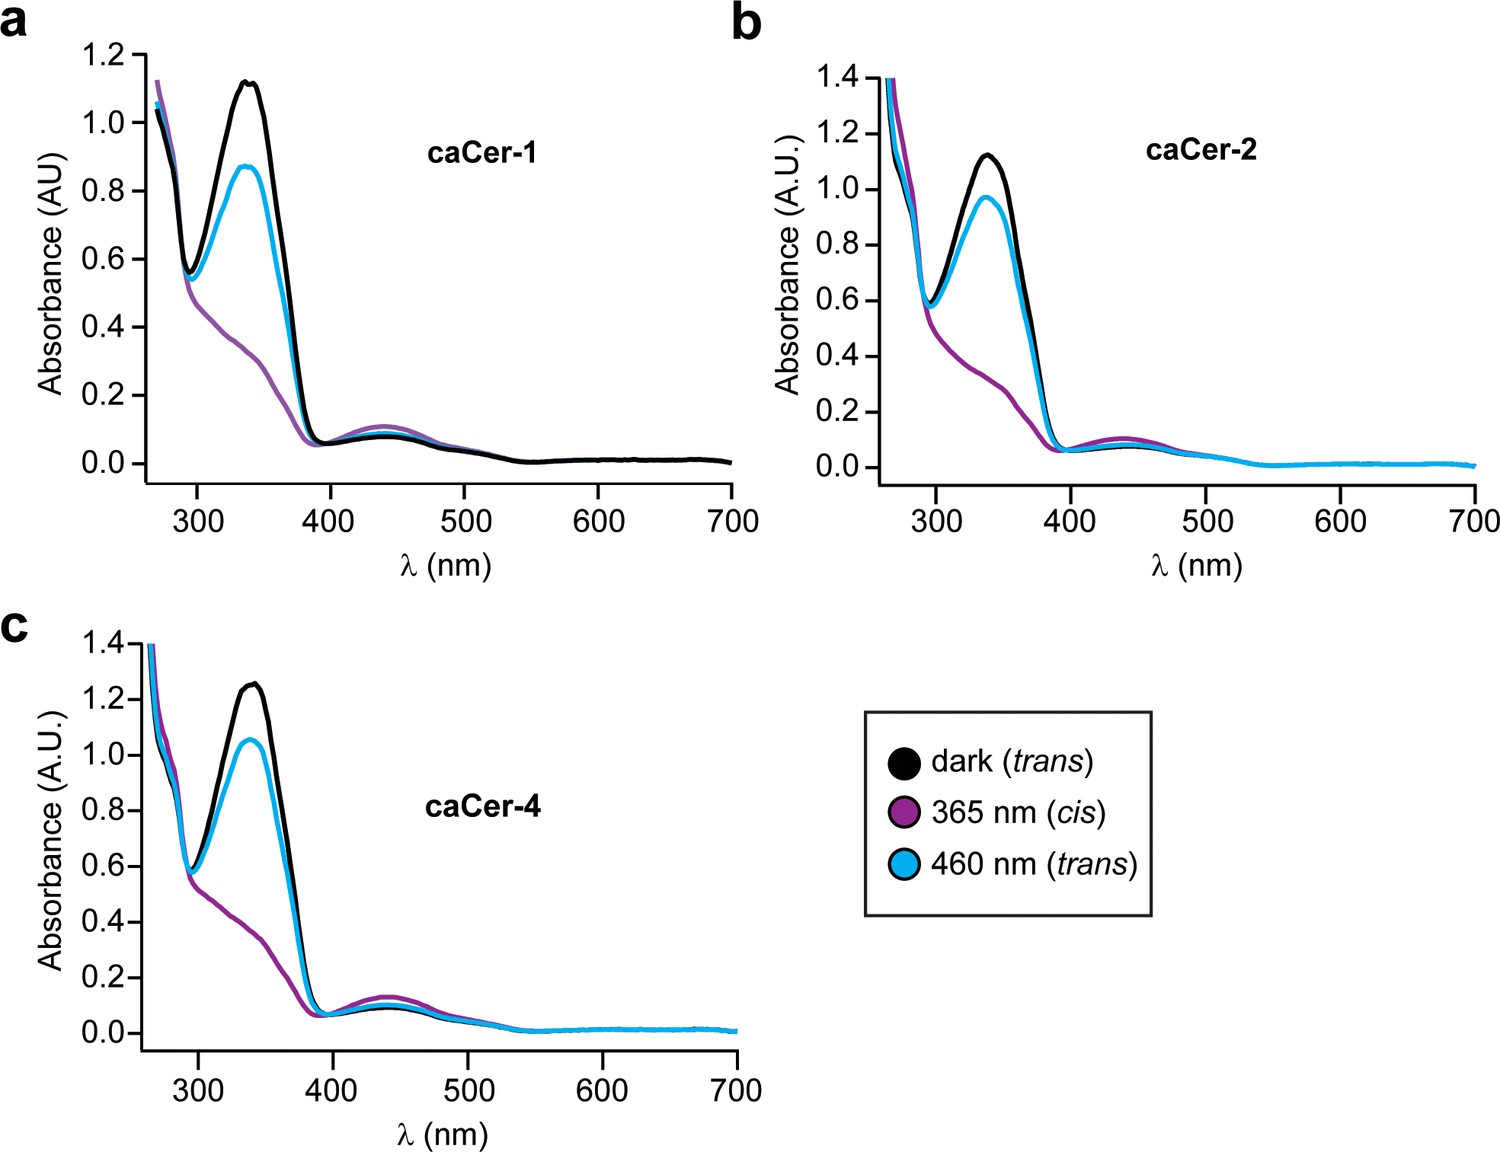
UV-Vis spectra of caCer-1, caCer-2 and Cer-4.
UV-Vis spectra of (a) caCer-1, (b) caCer-2 and (c) caCer-4 (50 μM in DMSO) in their dark-adapted (trans, black), UV-A-irradiated (cis, violet) and blue-irradiated (trans, blue) states.
Figure 1—figure supplement 4
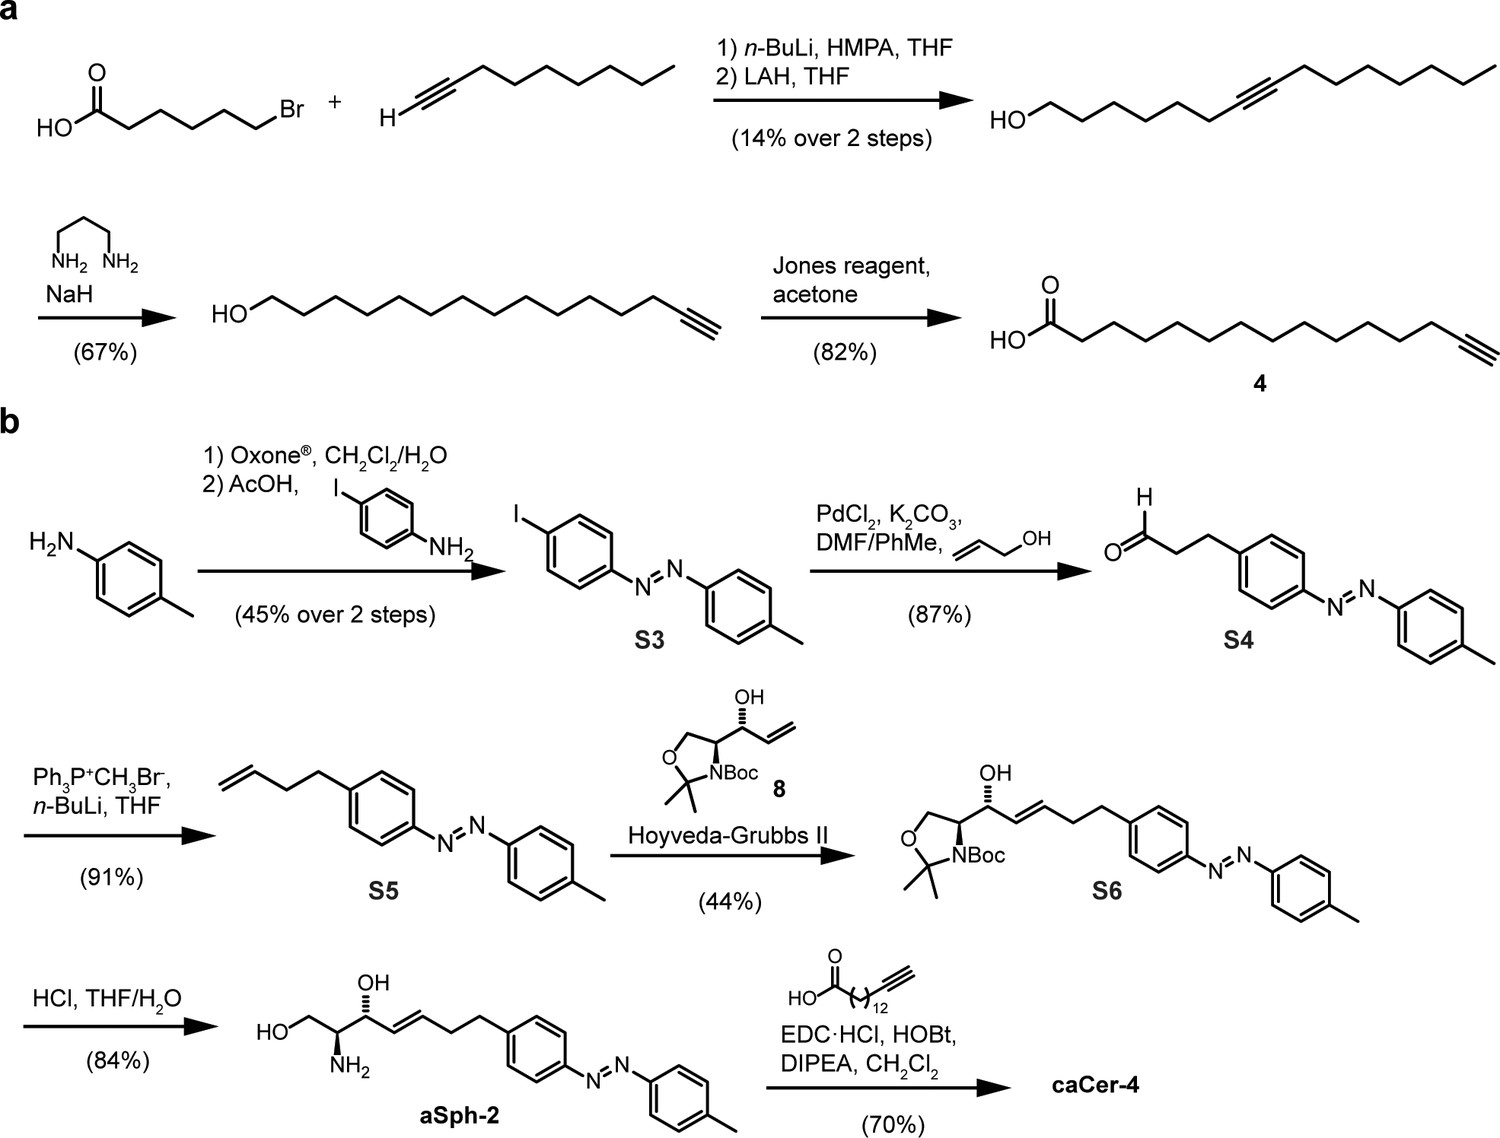
Chemical synthesis of caCer-4.
(a) Chemical synthesis of a terminal alkyne-functionalized C15 fatty acid. (b) Chemical synthesis of the photoswitchable sphingoid base aSph-2, which was N-acylated with a terminal alkyne-functionalized C15 fatty acid to afford caCer-4.
Figure 2 with 2 supplements

Photo-isomerization of caCers affects membrane fluidity and lipid domain structure in supported lipid bilayers.
(a) Confocal fluorescence microscopy of SLBs containing a quaternary mixture of DOPC:cholesterol:SM:caCer (10:6.7:5:5 mol ratio) and 0.1 mol% ATTO655-DOPE. Images of SLBs prepared with dark-adapted trans-caCer-3 and trans-caCer-4 revealed phase separation, with taller liquid-ordered (Lo) domains appearing as dark regions in a liquid-disordered (Ld) phase. Scale bars, 10 μm. (b) Atomic force microscopy of SLBs prepared as in (a). Isomerization of caCer-3 (top) and caCer-4 (bottom) to cis with UV-A light (365 nm) resulted in a fluidification inside the Lo domains, as indicated by the appearance of small fluid Ld lakes and an increased Ld/Lo area ratio. This effect was reversed on isomerization back to trans with blue light (470 nm), marked by a drop in the Ld/Lo area ratio. Scale bars, 2 μm. (c) Time-course plotting the normalized Lo area over multiple 365/470 nm irradiation cycles for caCer-3 (top) and caCer-4 (bottom).
Figure 2—video 1
Reversible remodeling of lipid domains by caCer-3.
A DOPC:Chol:SM:caCer-3 (10:6.7:5:5 mol ratio) lipid mixture was recorded using high-speed AFM (height images). The isomerization to cis-caCer-3 is marked with a pink circle; isomerization back to trans-caCer-3 is marked with a blue circle. Scale bar = 500 nm. Acquisition = 1.5 s/frame. Video frame rate = 13 fps.
Figure 2—video 2
Reversible remodeling of lipid domains by caCer-4.
A DOPC:Chol:SM:caCer-4 (10:6.7:5:5 mol ratio) lipid mixture was recorded using high-speed AFM (error images). The isomerization to cis-caCer-4 is marked with a pink circle; isomerization back to trans-ACe-1 is marked with a blue circle. Scale bar = 500 nm. Acquisition = 1.5 s/frame. Video frame rate = 13 fps.
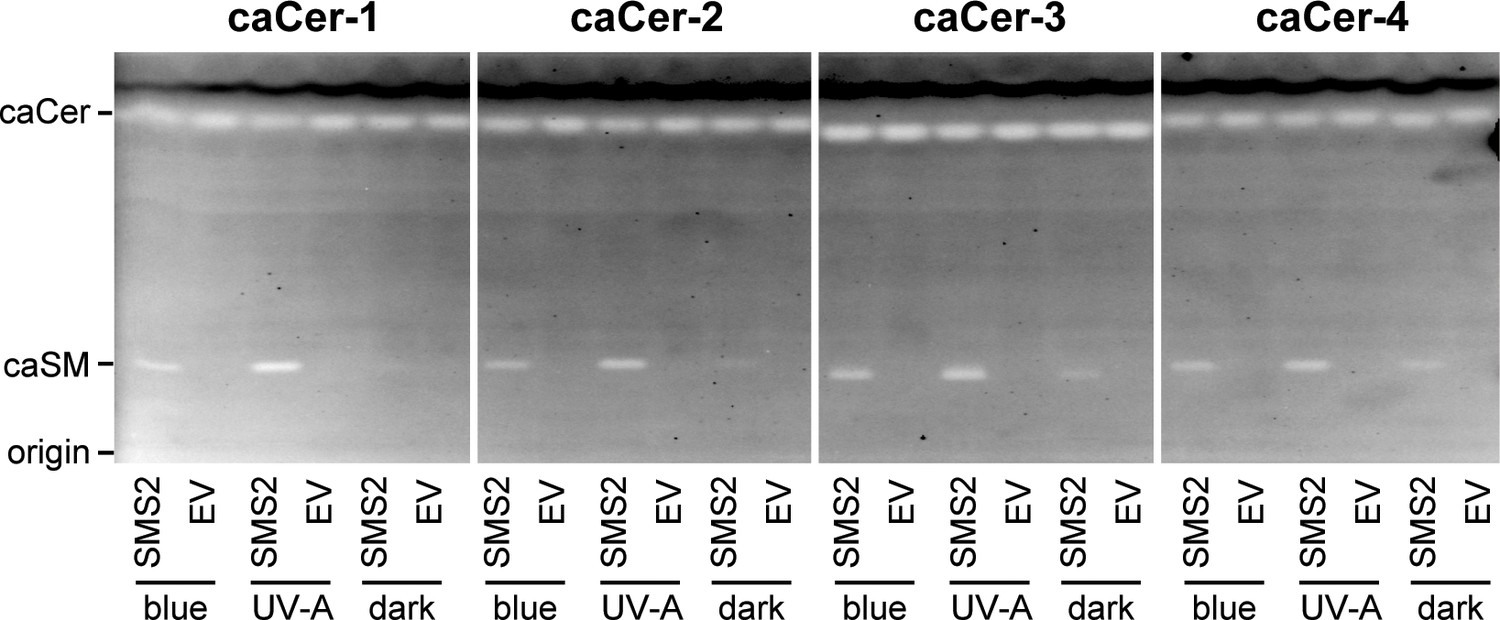
Figure 3 with 2 supplements
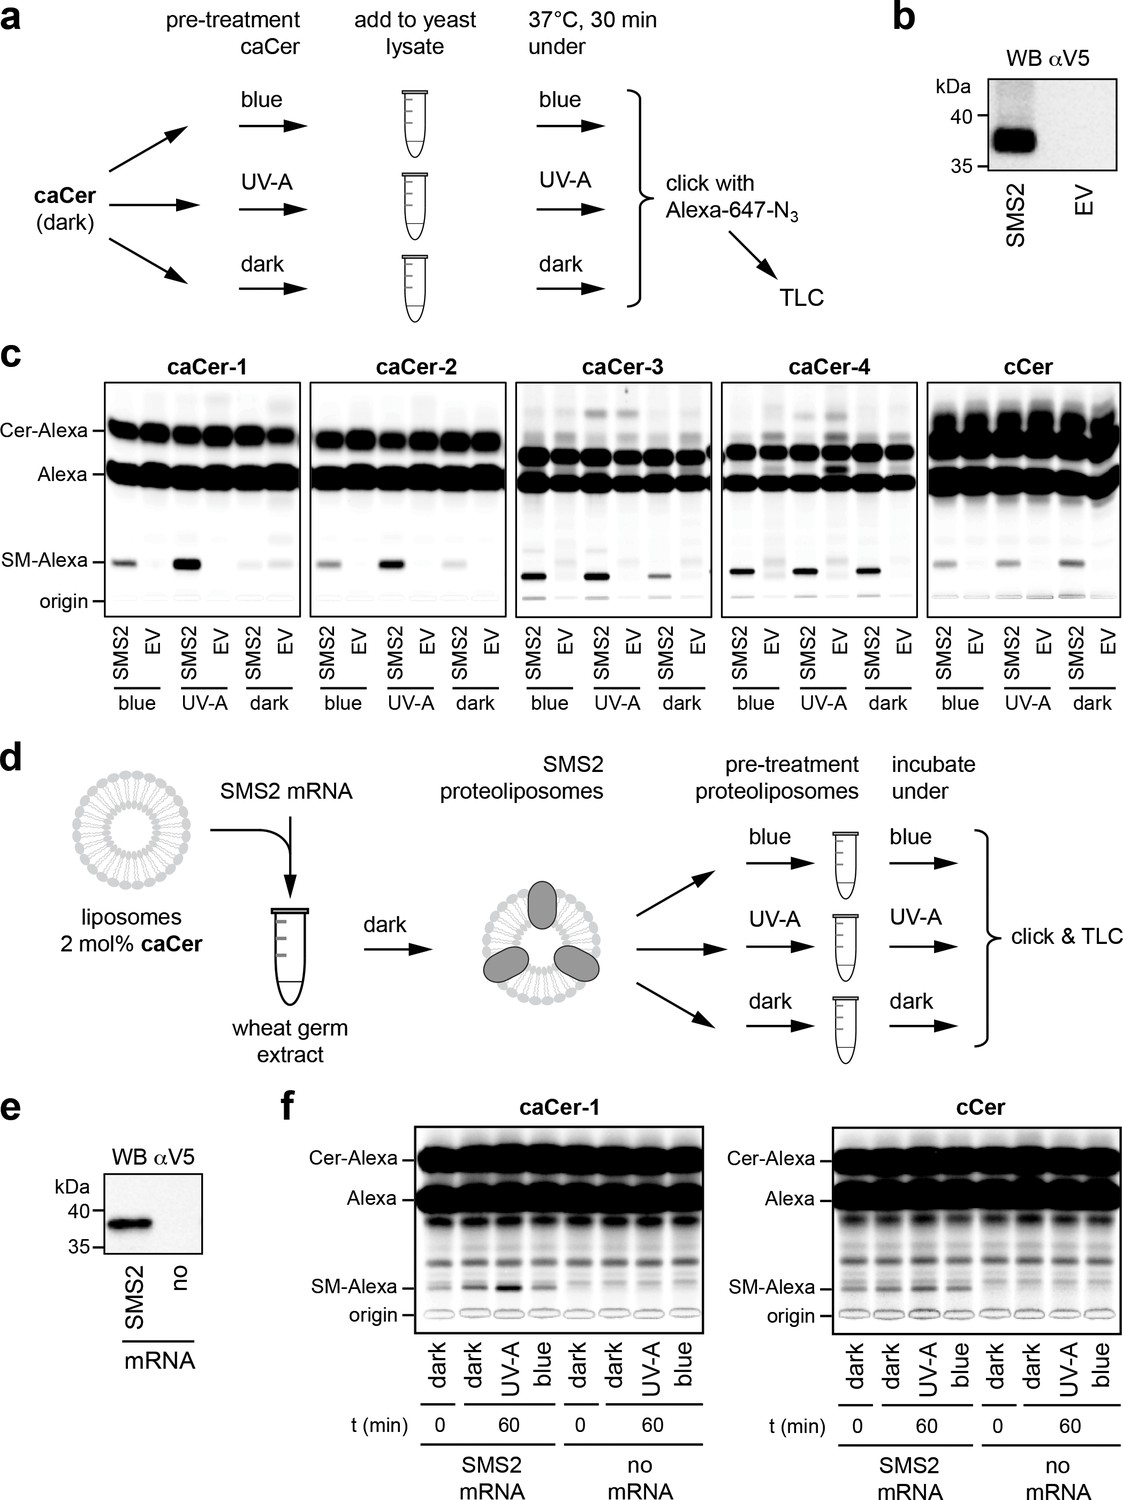
caCers are light-sensitive substrates of sphingomyelin synthase SMS2.
(a) Blue, UV-A or dark-adapted caCers were incubated with lysates of control or SMS2-expressing yeast cells for 30 min at 37°C and their metabolic conversion to SM was determined by TLC analysis of total lipid extracts click-reacted with Alexa-647. (b) Lysates of yeast cells transfected with empty vector (EV) or V5-tagged SMS2 were analyzed by immunoblotting with an anti-V5 antibody. (c) Lysates of control (EV) and SMS2-expressing yeast cells were incubated with caCers or cCer as outlined in (a). Reaction samples were subjected to lipid extraction, click-reacted with Alexa-647 and analyzed by TLC. (d) SMS2 was produced cell-free in the dark at 26°C in the presence of caCer-containing liposomes and then incubated at 37°C in the dark or upon illumination with blue or UV-A light. Reaction samples were subjected to lipid extraction, click-reacted with Alexa-647 and analyzed by TLC. (e) Cell-free translation reactions with or without SMS2-V5 mRNA were analyzed by immunoblotting with an anti-V5 antibody. (f) SMS2 was produced cell-free in the presence of caCer-1 or cCer-containing liposomes and then incubated for 0 or 60 min at 37°C as outlined in (d). Reaction samples were subjected to lipid extraction, click-reacted with Alexa-647 and analyzed by TLC.
Figure 3—figure supplement 1
Monitoring SMS2-mediated metabolic conversion of caCers and cCer using 3-azido-7-hydroxycoumarin as click reagent.
(a) Blue, UV-A or dark-adapted caCers and cCer were incubated with lysates of control (EV) or SMS2-expressing yeast cells for 30 min at 37°C and their metabolic conversion to SM was determined by TLC analysis of lipid extracts click-reacted with 3-azido-7-hydroxycoumarin. Imaging of fluorescent lipids with UV-trans-illumination indicated that the azobenzene moiety in caCers causes a distance-dependent intramolecular quenching of the coumarin fluorescence. (b) Chemical structures of coumarin-derivatized caCers and cCer, with the azobenzene and coumarin moieties marked in red and blue, respectively.
Figure 3—figure supplement 2
Monitoring SMS2-mediated metabolic conversion of caCers independently of fluorescent click-reagents.
Blue, UV-A or dark-adapted caCers were incubated with lysates of control (EV) or SMS2-expressing yeast cells for 30 min at 37°C and their metabolic conversion to SM was determined by TLC analysis. Azobenzene-containing lipids were visualized by UV-trans-illumination, taking advantage of the UV-A absorbing properties of the azobenzene group.
Figure 4
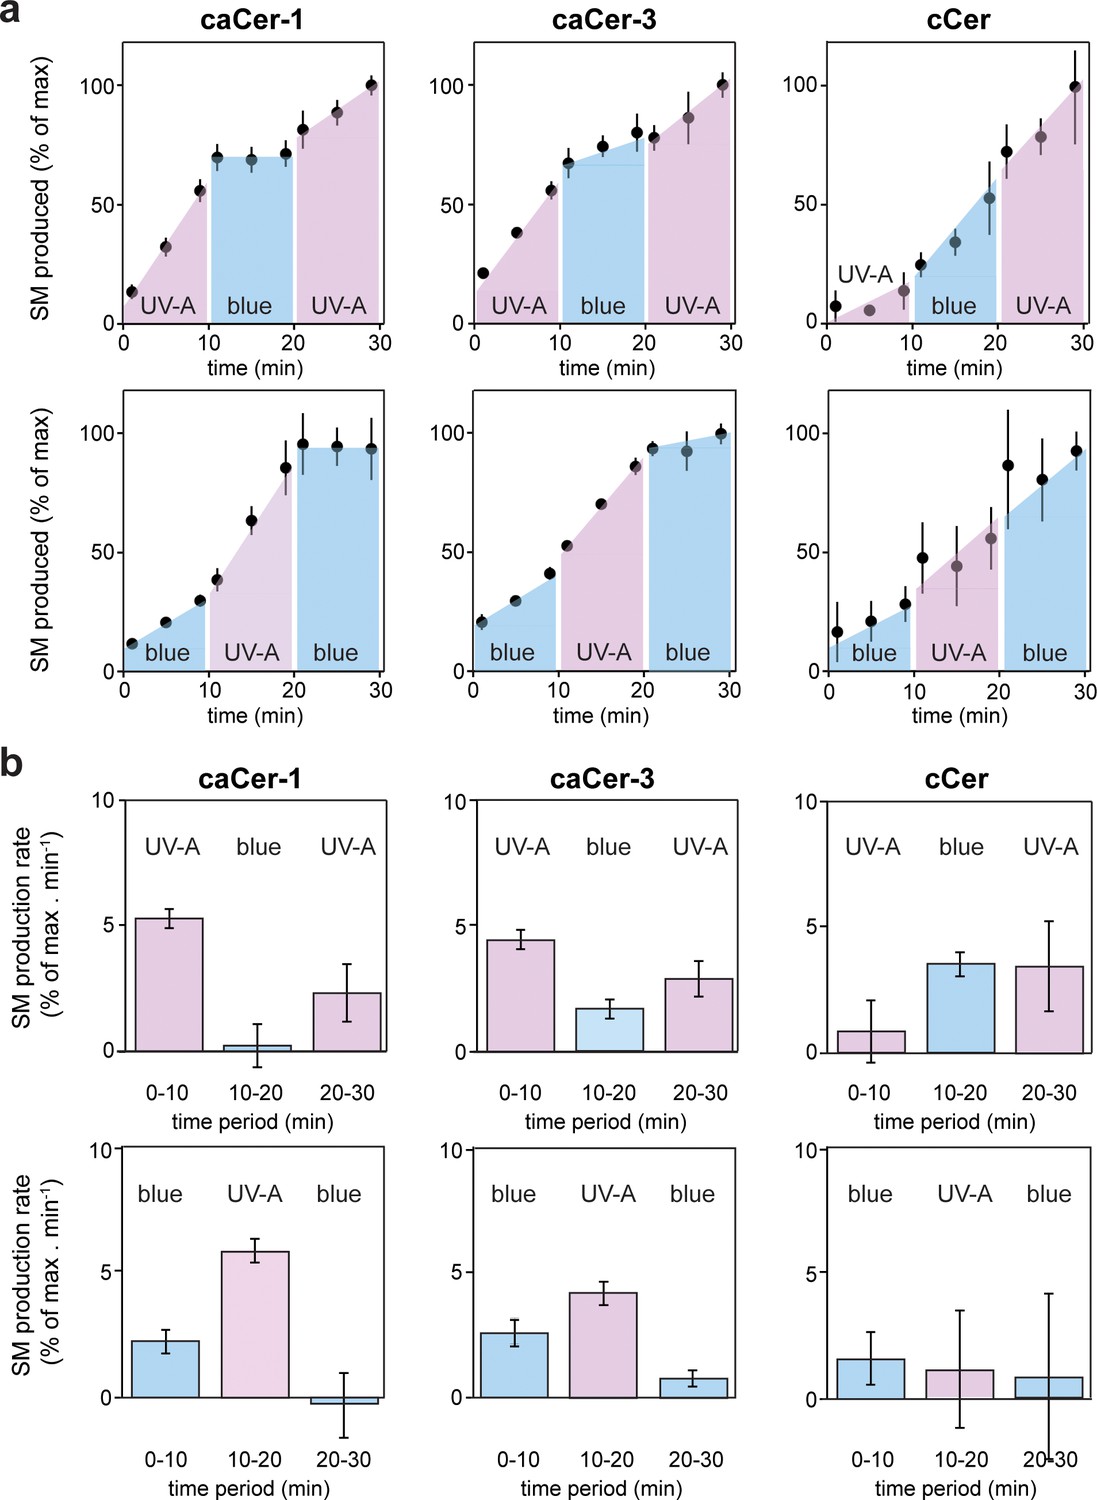
Metabolic conversion of caCers by SMS2 in cell lysates can be switched on and off by light.
(a) caCer-1, caCer-3 or cCer were incubated with lysates of SMS2-expressing yeast cells at 37°C under UV-A or blue illumination. After each 10 min period, the caCer configuration was switched by illuminating the reactions with blue or UV-A light. Reaction samples were taken at the indicated time points, subjected to lipid extraction, click-reacted with Alexa-647 and then analyzed by TLC. Presented are the relative amounts of SM formed per time point. (b) Presented are the relative SM production rates (a.u. of SM formed per min) calculated from the time points presented in (a). Data shown are average values ± s.d. from four technical replicates (n = 4).
-
Figure 4—source data 1
Quantitation of metabolic conversion of caCers by SMS2 in cell lysates.
- https://doi.org/10.7554/eLife.43230.014
Figure 5
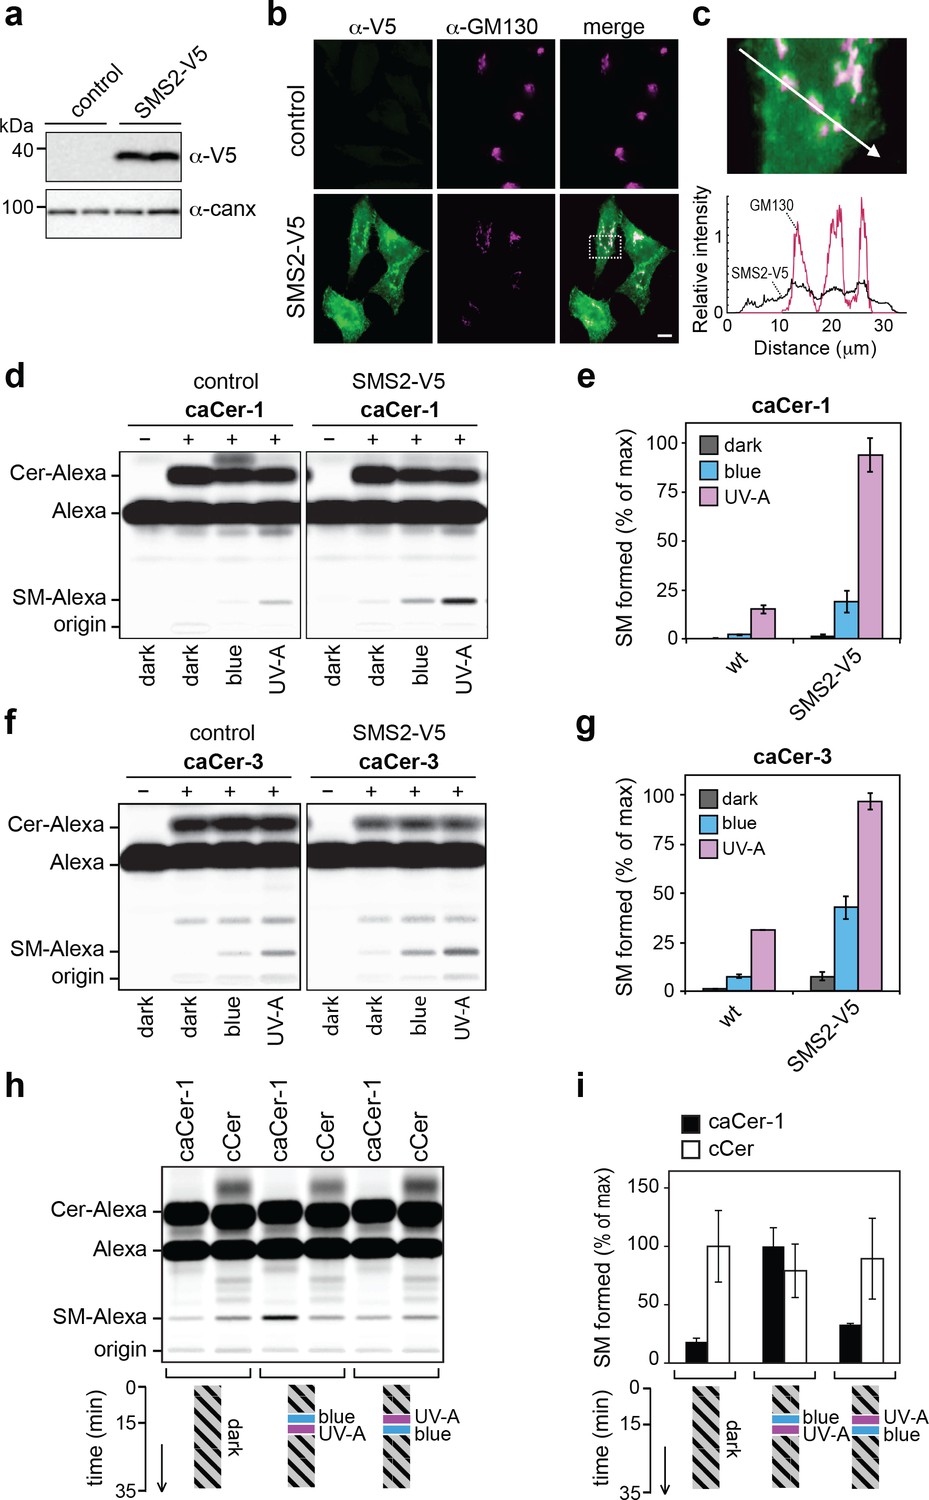
caCers enable optical control of SMS2-mediated SM biosynthesis in living cells.
(a) HeLa cells stably transfected with V5-tagged SMS2 were analyzed by immunoblotting using anti-V5 and anti-calnexin antibodies. Untransfected HeLa cells served as control. (b) Control and SMS2-V5-expressing HeLa cells were fixed, co-stained with antibodies against the V5 epitope and Golgi marker GM130, and then visualized by fluorescence microscopy. Scale bar, 10 μm. (c) Intensity plots along the path marked by the white arrow, showing overlap between anti-V5 (green) and anti-GM130 (magenta) channels. (d) Blue, UV-A or dark-adapted caCer-1 was incubated with control or SMS2-V5-expressing HeLa cells for 1 hr at 37°C. Metabolic conversion of caCer-1 to SM was determined by TLC analysis of total lipid extracts click-reacted with Alexa-647. (e) Quantitative analysis of SM formed from caCer-1 by cells treated as in (c). (f) Blue, UV-A or dark-adapted caCer-3 was incubated with control or SMS2-V5-expressing HeLa cells for 1 hr at 37°C and its metabolic conversion to SM was determined as in (c). (g) Quantitative analysis of SM formed from caCer-3 by cells treated as in (e). (h) caCer-1 or cCer were incubated with SMS2-V5-expressing HeLa cells at 37°C in the dark. After 15 min, cells were flash-illuminated by blue light followed by UV-A or vice versa and then incubated for another 20 min. Cells kept in the dark for the entire incubation period served as control. Metabolic conversion of caCer-1 or cCer to SM was determined by TLC analysis of total lipid extracts click-reacted with Alexa-647. (i) Quantitative analysis of SM formed from caCer-1 or cCer by cells treated as in (g). Data shown are mean values ± s.d. from three biological replicates (n = 3).
-
Figure 5—source data 1
Quantitation of metabolic conversion of pretreated caCer1 by SMS2 in living HeLa cells.
- https://doi.org/10.7554/eLife.43230.016
-
Figure 5—source data 2
Quantitation of metabolic conversion of pretreated caCer3 by SMS2 in living HeLa cells.
- https://doi.org/10.7554/eLife.43230.017
-
Figure 5—source data 3
Quantitation of live manipulation of metabolic conversion of caCer1 and cCer by SMS2 in living HeLa cells.
- https://doi.org/10.7554/eLife.43230.018
Figure 6

caCer-1 is a light-sensitive substrate of glucosylceramide synthase GCS.
(a) Lysates of yeast cells transfected with V5-tagged GCS or empty vector (EV; control) were analyzed by immunoblotting using anti-V5 and anti-Vti1p antibodies. (b) UV-A pretreated caCer-1 (25 μM) was incubated with lysates of control or GCS-expressing yeast cells for 30 min at 37°C in the presence or absence of 1 mM UDP-glucose. Reactions were subjected to lipid extraction, click-reacted with Alexa-647 and then analyzed by TLC. (c) UV-A, blue or dark pretreated caCer-1 and cCer (25 μM, each) were incubated in the dark for 30 min at 37°C with lysates of GCS-expressing yeast in the presence of 1 mM UDP-glucose and analyzed as in (b). (d) Quantitative analysis of GlcCer formed from caCer-1 or cCer in lysates treated as in (c). (e) Dark-adapted caCer-1 or cCer (25 μM, each) and UDP-glucose (1 mM) were incubated with lysates of GCS-expressing yeast in the dark at 37°C. After 15 min, lysates were flash-illuminated by blue light followed by UV-A or vice versa and then incubated for another 20 min. Lysates kept in the dark for the entire incubation period served as control. GlcCer formation was determined by TLC analysis of total lipid extracts click-reacted with Alexa-647. (f) Cell-free translation reactions with or without GCS-V5 mRNA were carried out overnight in the dark at 26°C. GCS was expressed in the presence of liposomes containing caCer-1 or cCer and then analyzed by immunoblotting using an anti-V5 antibody. (g) GCS produced cell-free as in (f) was flash-illuminated with UV-A or kept in the dark and then incubated with 1 mM UDP-glucose for 30 min at 37°C in the dark. GlcCer formation was monitored by TLC as in (e). Data shown are average values ± s.d. (cCer, n = 2; caCer-1, n = 3).
-
Figure 6—source data 1
Quantitation of metabolic conversion of pretreated caCer-1 and cCer by GCS in cell lysates.
- https://doi.org/10.7554/eLife.43230.020
Figure 7
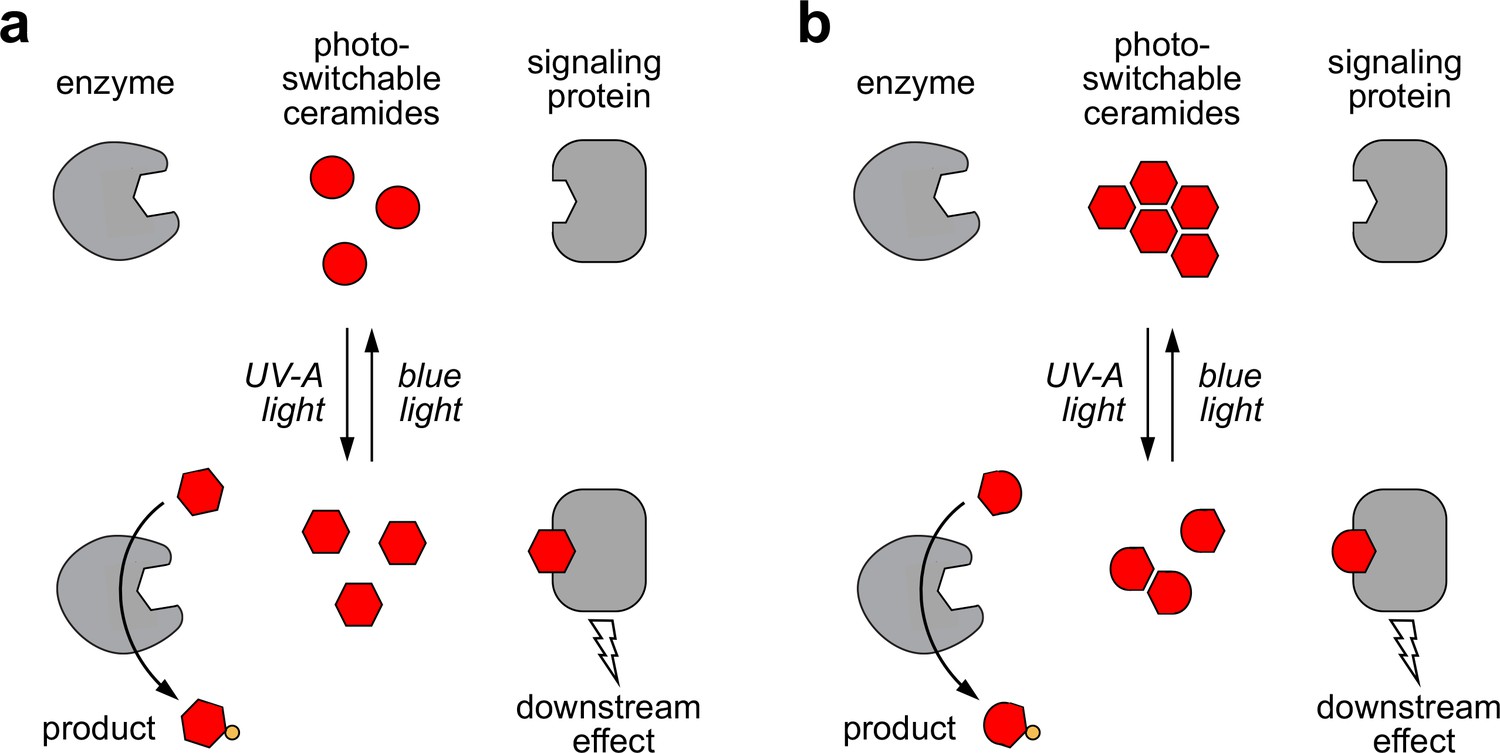
Models of how photoswitchable ceramides may enable optical control over sphingolipid biosynthesis and signaling.
(a) UV-A or blue light trigger alterations in the curvature of the carbon chains of azobenzene-containing ceramides (caCers), which reversibly enhance or reduce their affinity for ceramide metabolic enzymes and signaling proteins. (b) Blue light triggers self-assembly of photoswitchable ceramides (caCers) into tightly packed clusters driven by intermolecular stacking of the flat trans-azobenzene groups. In contrast, UV-A light causes caCers to disperse in the plane of the membrane as the bent cis-azobenzene groups disrupt intermolecular stacking. These light-induced changes in lateral packing of caCers reversibly enhance or reduce their availability for metabolic conversion or stimulating ceramide signaling proteins.
Author response image 1
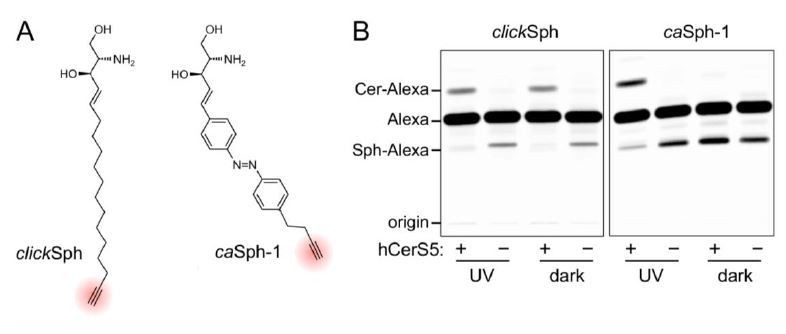
(A) Chemical structures of the clickable and azobenzene-containing sphingosines, clickSph and caSph-1.
(B) UV-A-irradiated or dark-adapted clickSph and caSph-1 were incubated with lysates of yeast cells lacking ceramide synthases (-) or expressing human ceramide synthase CerS5 (+). Metabolic conversion to ceramide was monitored by TLC analysis of lipid extracts click-reacted with Alexa-647-azide. Note that metabolic conversion of caSph-1, unlike that of clickSph, is light sensitive.
Additional files
-
Supplementary file 1
Compound Characterization - NMR spectra.
- https://doi.org/10.7554/eLife.43230.022
-
Transparent reporting form
- https://doi.org/10.7554/eLife.43230.023
Download links
A two-part list of links to download the article, or parts of the article, in various formats.
Downloads (link to download the article as PDF)
Open citations (links to open the citations from this article in various online reference manager services)
Cite this article (links to download the citations from this article in formats compatible with various reference manager tools)
Optical manipulation of sphingolipid biosynthesis using photoswitchable ceramides
eLife 8:e43230.
https://doi.org/10.7554/eLife.43230


