Beta-catenin signaling regulates barrier-specific gene expression in circumventricular organ and ocular vasculatures
- Johns Hopkins University School of Medicine, United States
- Howard Hughes Medical Institute, Johns Hopkins University School of Medicine, United States
Figures
Figure 1 with 2 supplements
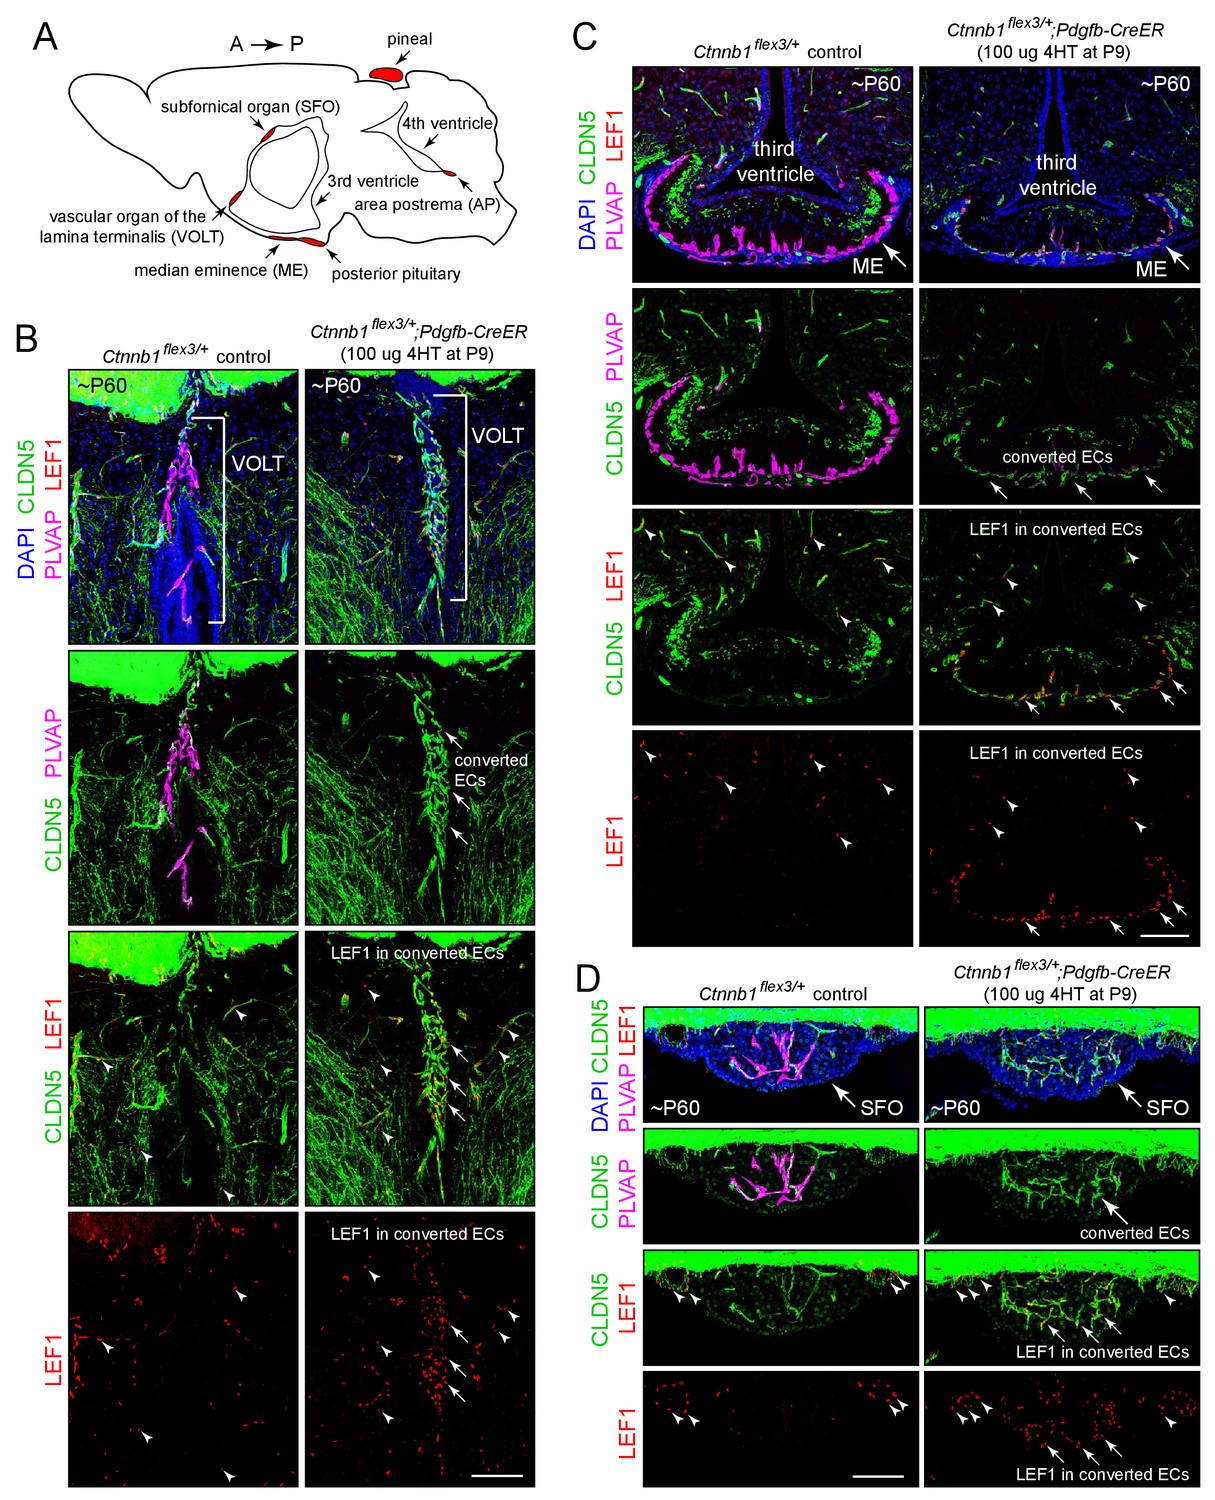
Stabilizing beta-catenin in ECs switches the ME, SFO, and VOLT vasculatures to a BBB-like state.
(A) Schematic of a midline sagittal section of the mouse brain indicating the locations of the CVOs (red). A, anterior; P, posterior. (B–D) Coronal sections showing the VOLT (B), ME (C), and SFO (D) from a control mouse (left) and from a mouse with EC-specific deletion of Ctnnb1 exon 3 (right), immunostained as indicated. In control brains (left panels), ECs in the VOLT, ME, and SFO are CLDN5-/PLVAP+/LEF1-. In mice with EC-specific deletion of Ctnnb1 exon 3 (right panels), ECs in the VOLT, ME, and SFO are CLDN5+/PLVAP-/LEF1+ (‘converted ECs’). In both genotypes, ECs in the surrounding brain parenchyma are CLDN5+/PLVAP-/LEF1+. In the bottom 2 rows of images, arrows point to LEF1 in EC nuclei within the VOLT, ME, and SFO with deletion of Ctnnb1 exon 3. Arrowheads point to LEF1 in EC nuclei in the adjacent brain parenchyma, which are unaffected by deletion of Ctnnb1 exon 3. The efficiency of CreER-mediated recombination in ECs is ~80–90%, as judged by the conversion of EC markers. In this and all other figures, the age of the mouse in postnatal days (P) is embedded in the image panels, and the dose of 4-hydroxytamoxifen (4HT) and age at its delivery is indicated next to the genotype. Unless noted otherwise, tissues were fixed by cardiac perfusion of paraformaldehyde in physiologic buffer. Scale bars, 100 μm.
Figure 1—figure supplement 1
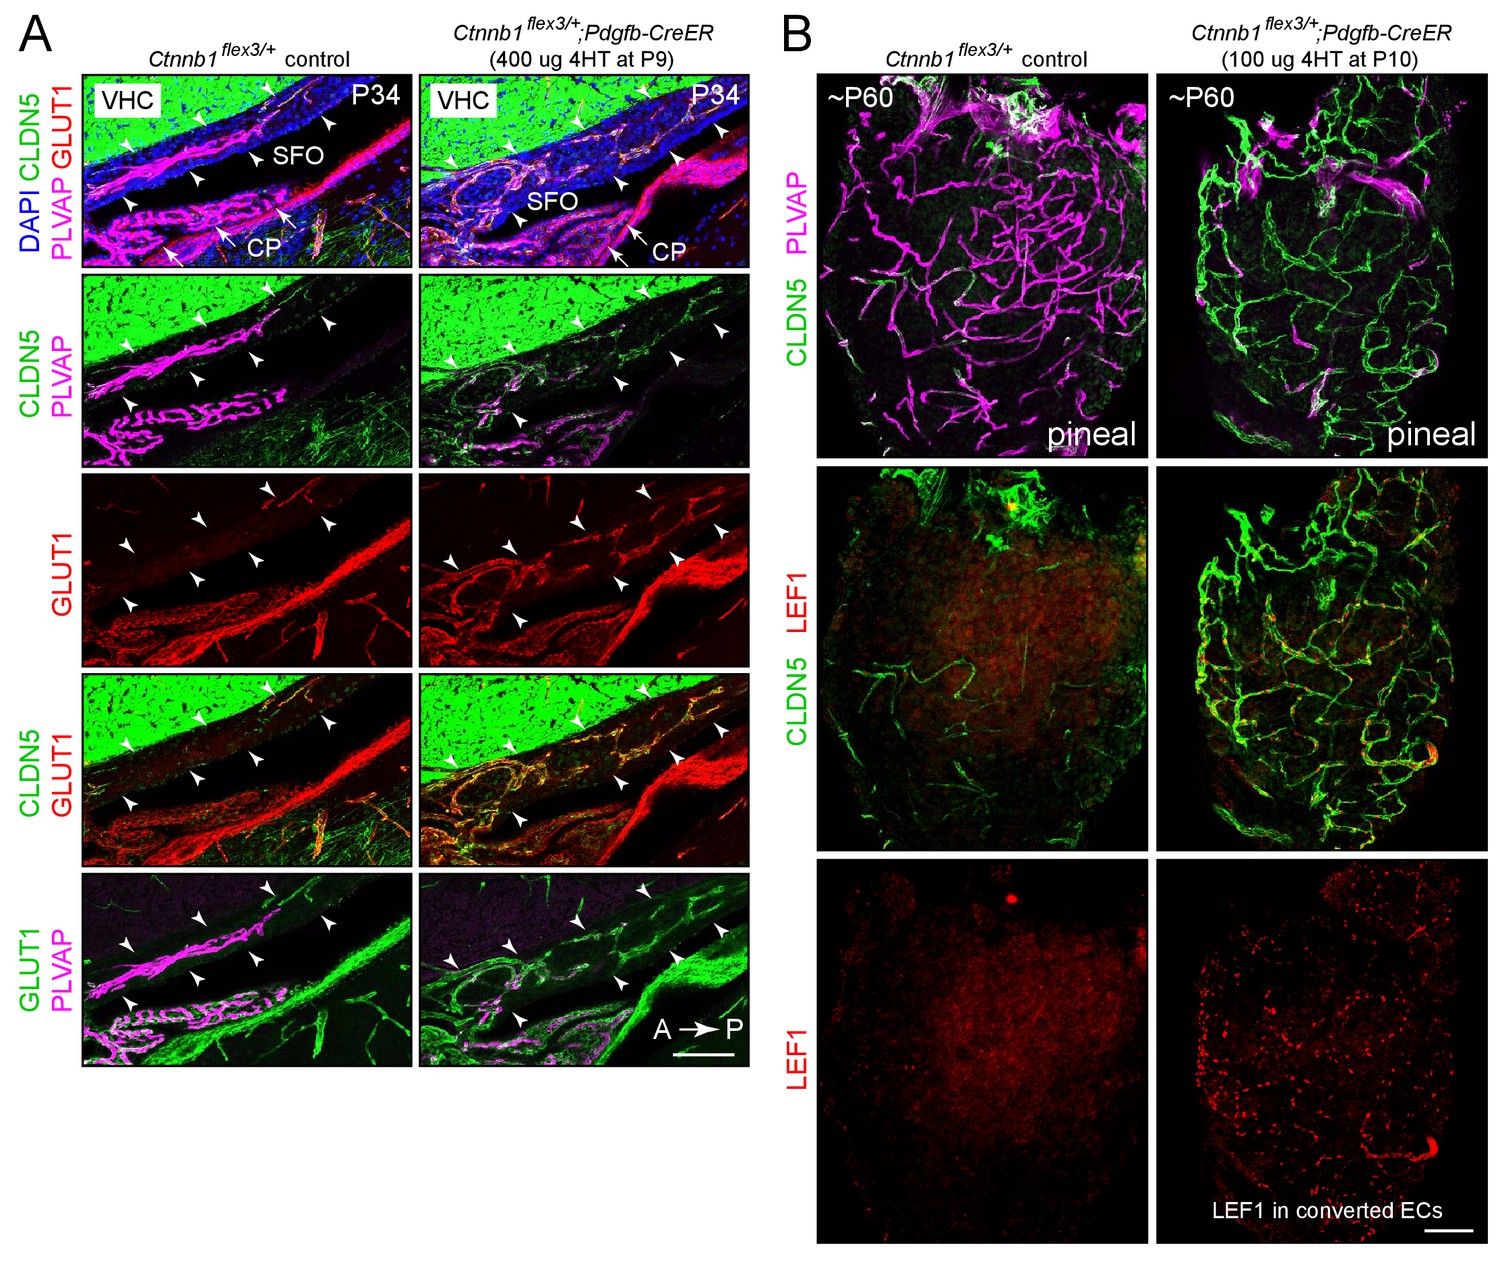
Stabilizing beta-catenin in ECs switches the SFO and pineal vasculatures to a BBB-like state.
(A) Sagittal sections through the SFO from a control mouse (left panels) and from a mouse with EC-specific deletion of Ctnnb1 exon 3 (right panels), immunostained as indicated. In the control SFO (left), ECs are CLDN5-/PLVAP+/GLUT1-. With EC-specific deletion of Ctnnb1 exon 3 (right), ECs in the SFO become CLDN5+/PLVAP-/GLUT1+. In both genotypes, ECs in the surrounding brain parenchyma are CLDN5+/PLVAP-/GLUT1+. The efficiency of CreER-mediated recombination in ECs is ~80–90%, as judged by the conversion of EC markers. VHC is the ventral hippocampal commissure, which binds the CLDN5 antibody. Arrowheads indicate the dorsal and ventral boundaries of the SFO. Arrows point to the choroid plexus. CP, choroid plexus. A, anterior; P, posterior. Scale bar, 100 μm. (B) Whole mount pineal gland from a control mouse (left panels) and from a mouse with Ctnnb1 exon 3 deleted in ECs (right panels), immunostained as indicated. ECs in the control pineal are CLDN5-/PLVAP+/LEF1- and ECs with Ctnnb1 exon 3 deleted are CLDN5+/PLVAP-/LEF1+. Scale bar, 100 μm.
Figure 1—figure supplement 2
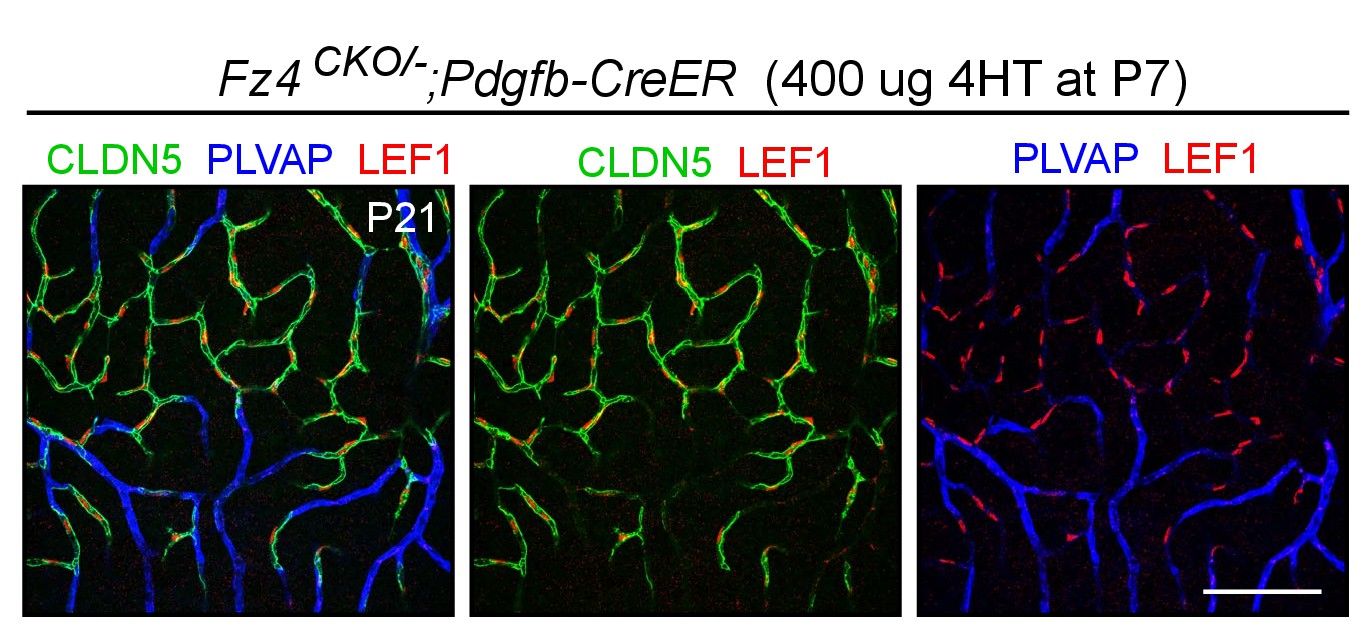
Nuclear LEF1 accumulates in phenotypically WT Fz4+/-retinal ECs and is undetectable in Fz4-/-retinal ECs.
Flatmount of a mosaic P21 Fz4CKO/-;Pdgfb-CreER retina in which ~50% of ECs had recombined the Fz4CKO allele two weeks earlier at P7. WT ECs are CLDN5+/PLVAP- and Fz4-/-ECs are CLDN5-/PLVAP+. Nuclear LEF1 accumulates exclusively in CLDN5+/PLVAP- ECs. Scale bar, 100 μm.
Figure 2 with 4 supplements
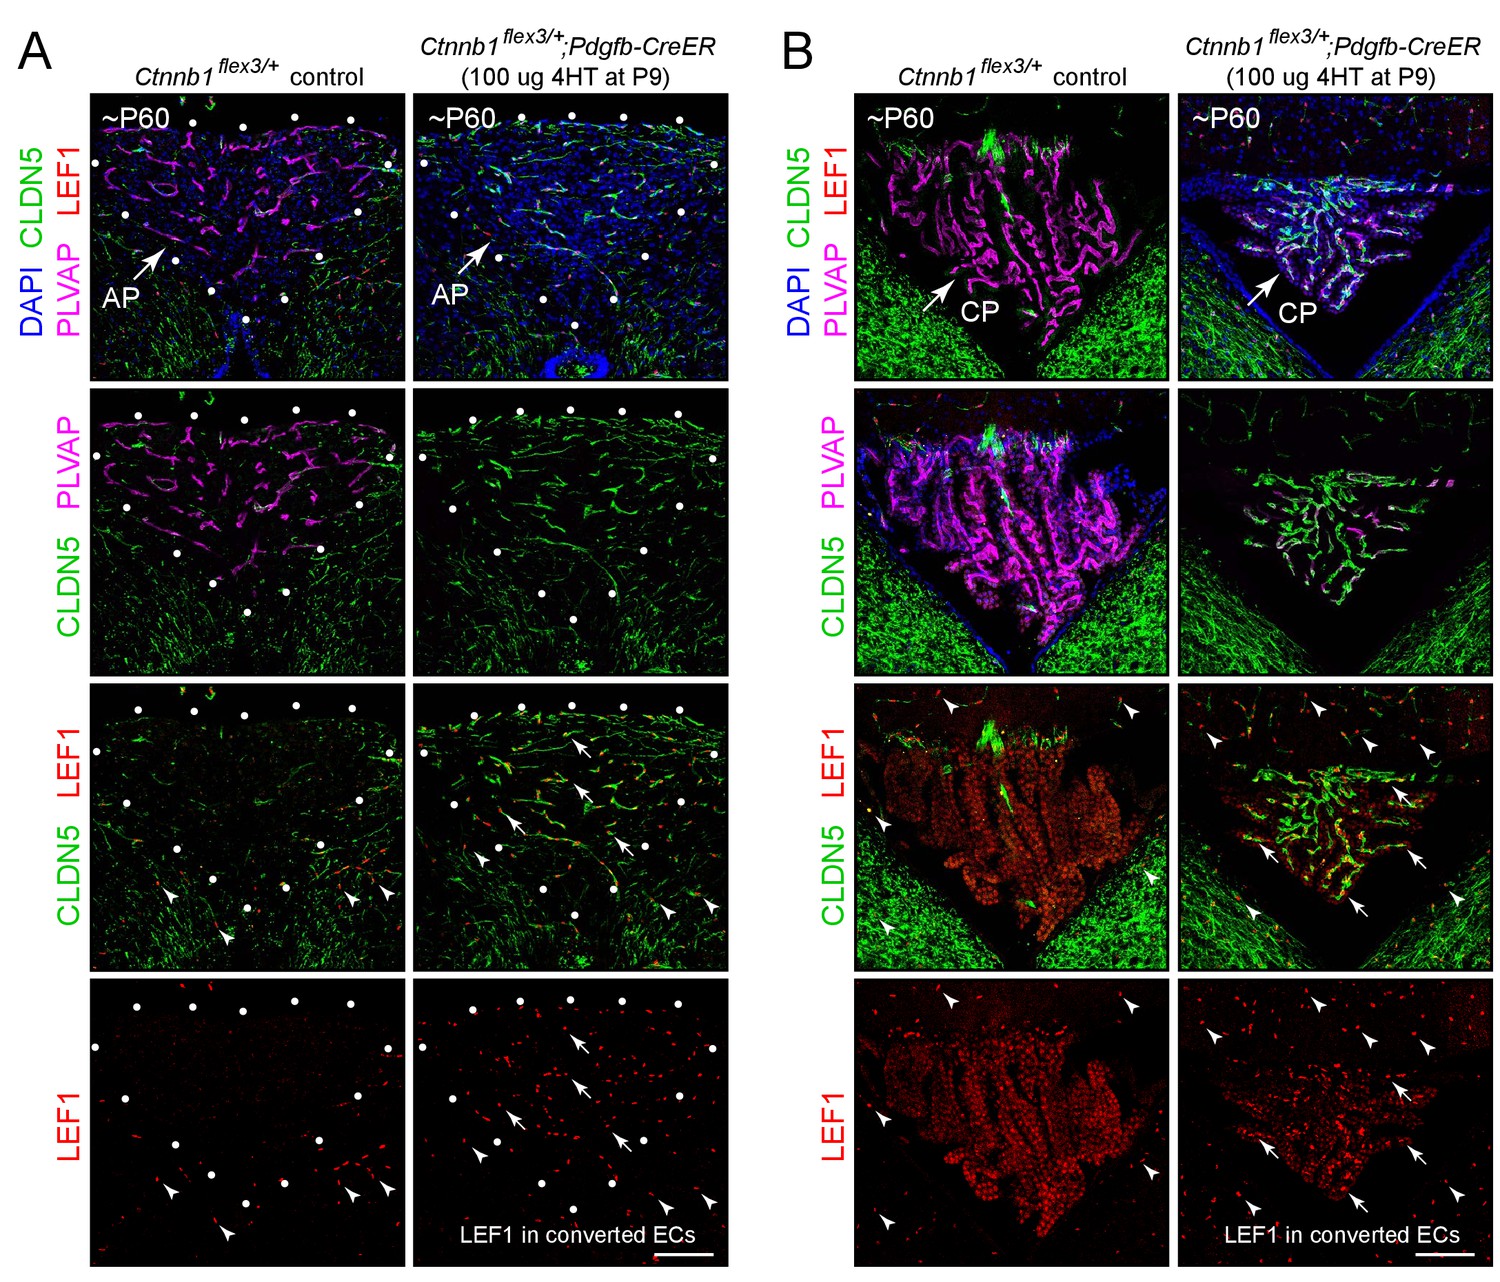
Stabilizing beta-catenin in ECs switches the area postrema and choroid plexus vasculatures to a BBB-like state.
(A,B) Coronal sections showing the area postrema (A; demarcated by white dots and abbreviated AP) and choroid plexus (B; abbreviated CP) from a control mouse (left panels) and from a mouse with EC-specific deletion of Ctnnb1 exon 3 (right panels), immunostained as indicated. In the area postrema and choroid plexus, ECs in the control are CLDN5-/PLVAP+/LEF1-, and ECs with deletion of Ctnnb1 exon 3 are CLDN5+/PLVAP-/LEF1+. ECs in the surrounding brain parenchyma are CLDN5+/PLVAP-/LEF1+. In the right panels of the bottom 2 rows of images, arrows point to LEF1 in EC nuclei within the area postrema and choroid plexus with deletion of Ctnnb1 exon 3. Arrowheads in the bottom 2 rows of images point to LEF1 in EC nuclei in the adjacent brain parenchyma, which are unaffected by deletion of Ctnnb1 exon 3. The efficiency of CreER-mediated recombination in ECs is >90% in the area postrema and ~80–90% in the choroid plexus, as judged by the conversion of EC markers. Scale bars, 100 μm.
Figure 2—figure supplement 1
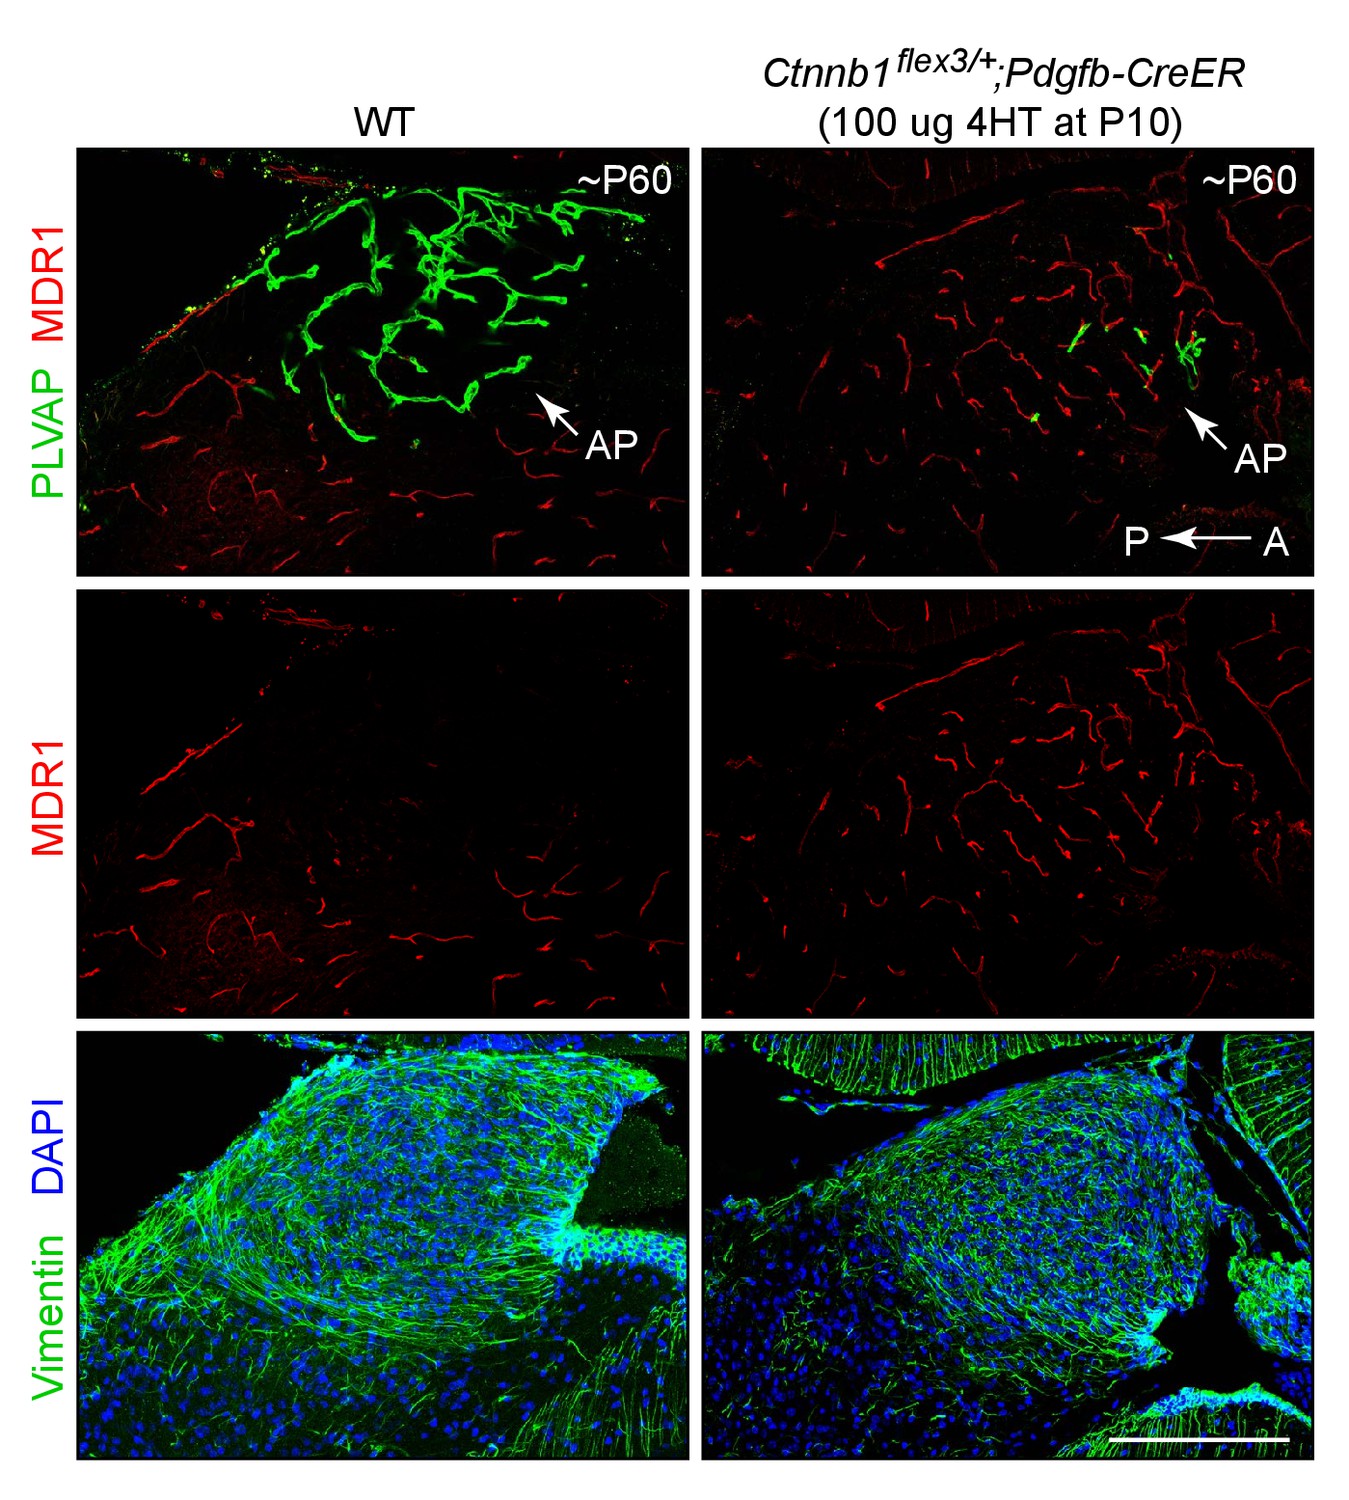
Stabilizing beta-catenin in ECs induces expression of MDR1 in area postrema ECs.
Sagittal sections through the area postrema from a WT control mouse (left panels) and from a mouse with EC-specific deletion of Ctnnb1 exon 3 (right panels), immunostained as indicated. Vimentin is enriched in area postrema glia and together with the higher cell density (marked by DAPI staining) serves to distinguish the area postrema from surrounding neural tissue. In the control area postrema (left panels), ECs are MDR1-/PLVAP+. With EC-specific deletion of Ctnnb1 exon 3 (right panels), ECs in the area postrema become MDR1+/PLVAP-. In both genotypes, ECs in the surrounding brain parenchyma are MDR1+/PLVAP-. The efficiency of CreER-mediated recombination in ECs is ~90%, as judged by the conversion of EC markers. A, anterior. P, posterior. AP, area postrema. Scale bar, 200 μm.
Figure 2—figure supplement 2
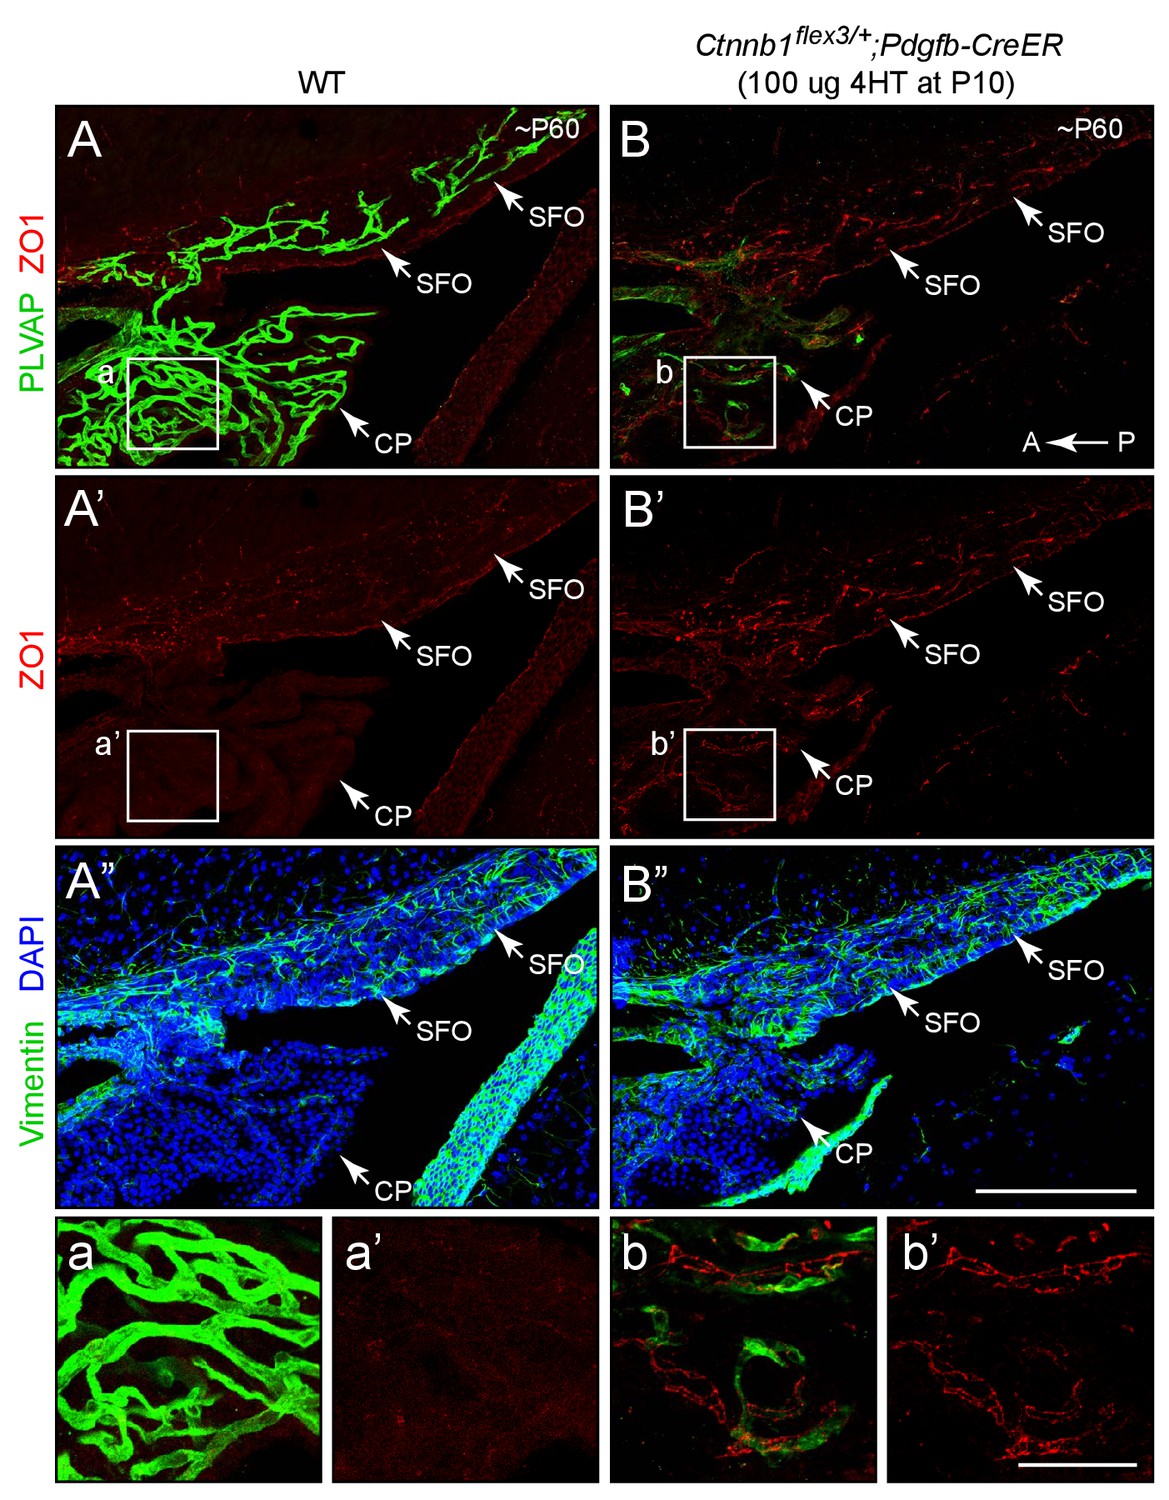
Stabilizing beta-catenin in ECs induces expression of ZO1 in SFO and choroid plexus ECs.
Sagittal sections through the SFO and adjacent choroid plexus from a WT control mouse (left panels) and from a mouse with EC-specific deletion of Ctnnb1 exon 3 (right panels), immunostained as indicated. Vimentin is enriched in SFO glia and together with the higher cell density (marked by DAPI staining) serves to distinguish the SFO from surrounding neural tissue. In the control SFO (left panels), ECs are ZO1-/PLVAP+. With EC-specific deletion of Ctnnb1 exon 3 (right panels), ECs in the SFO and choroid plexus become ZO1+/PLVAP-. In both genotypes, ECs in the surrounding brain parenchyma are ZO1+/PLVAP-. T he efficiency of CreER-mediated recombination in ECs is ~90%, as judged by the conversion of EC markers. The region demarcated by the squares labeled a-b’ are enlarged at the bottom. Tissues were fixed by methanol perfusion. A, anterior. P, posterior. Scale bar for A-B’, 200 μm. Scale bar for insets a-b’, 50 μm.
Figure 2—figure supplement 3
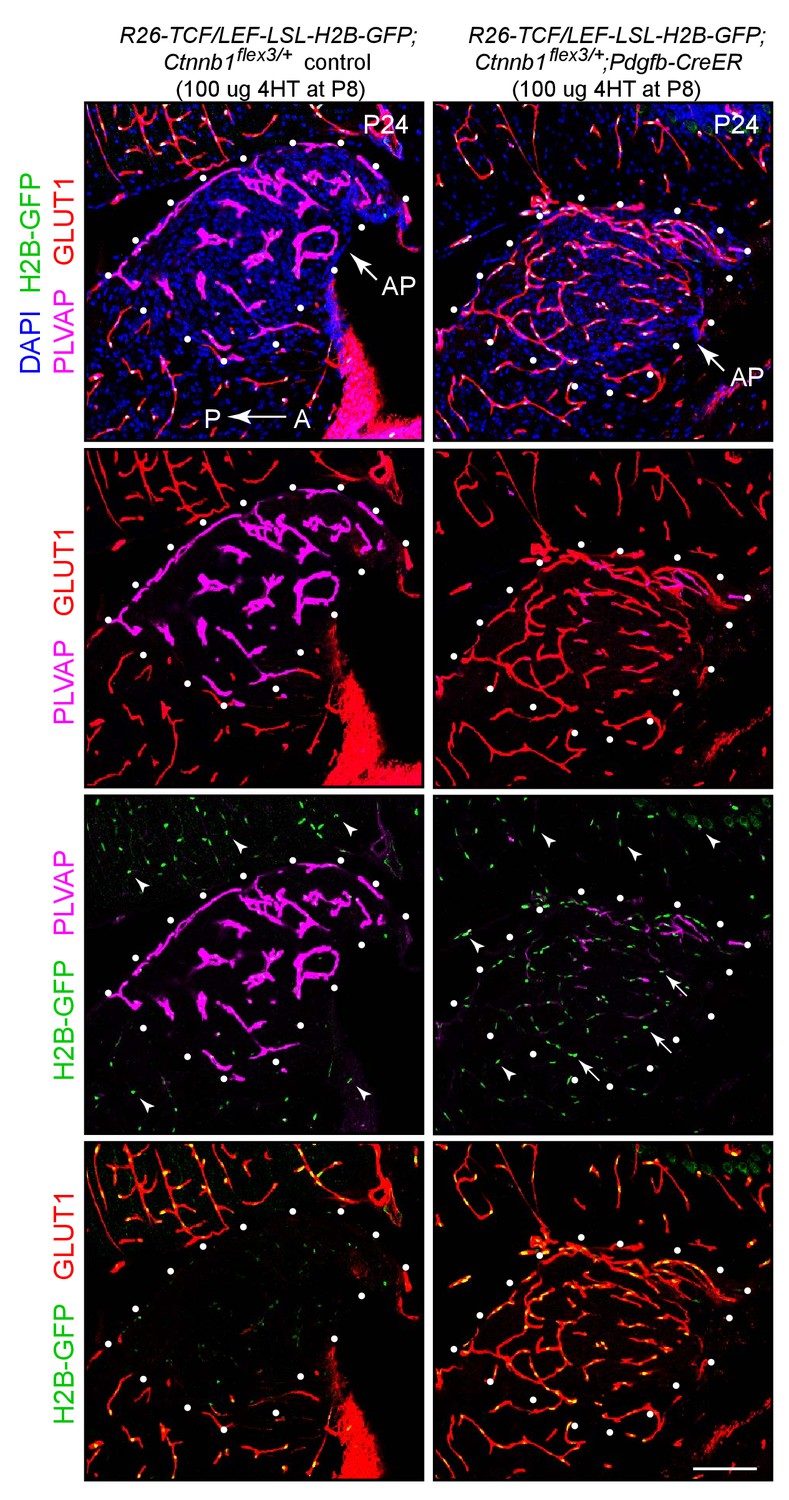
Stabilizing beta-catenin in ECs induces expression of the canonical Wnt reporter R26-8xTCF/LEF-LSL-H2B-GFP and accumulation of GLUT1 in ECs in the area postrema.
Sagittal sections from a control mouse (left panels) and from a mouse with EC-specific deletion of Ctnnb1 exon 3 (right panels), immunostained as indicated. Both mice carry the R26-8xTCF/LEF-LSL-H2B-GFP canonical Wnt reporter, which is accessible for induction in ECs based on excision of the LSL cassette by Pdgfb-CreER. The H2B-GFP reporter is visualized by immunostaining for a 6xmyc epitope tag appended to GFP (arrows). In both genotypes, H2B-GFP accumulates in the nuclei of the adjacent conventional CNS ECs (arrowheads). White dots outline the area postrema (AP). A, anterior. P, posterior. Scale bar, 100 μm.
Figure 2—figure supplement 4
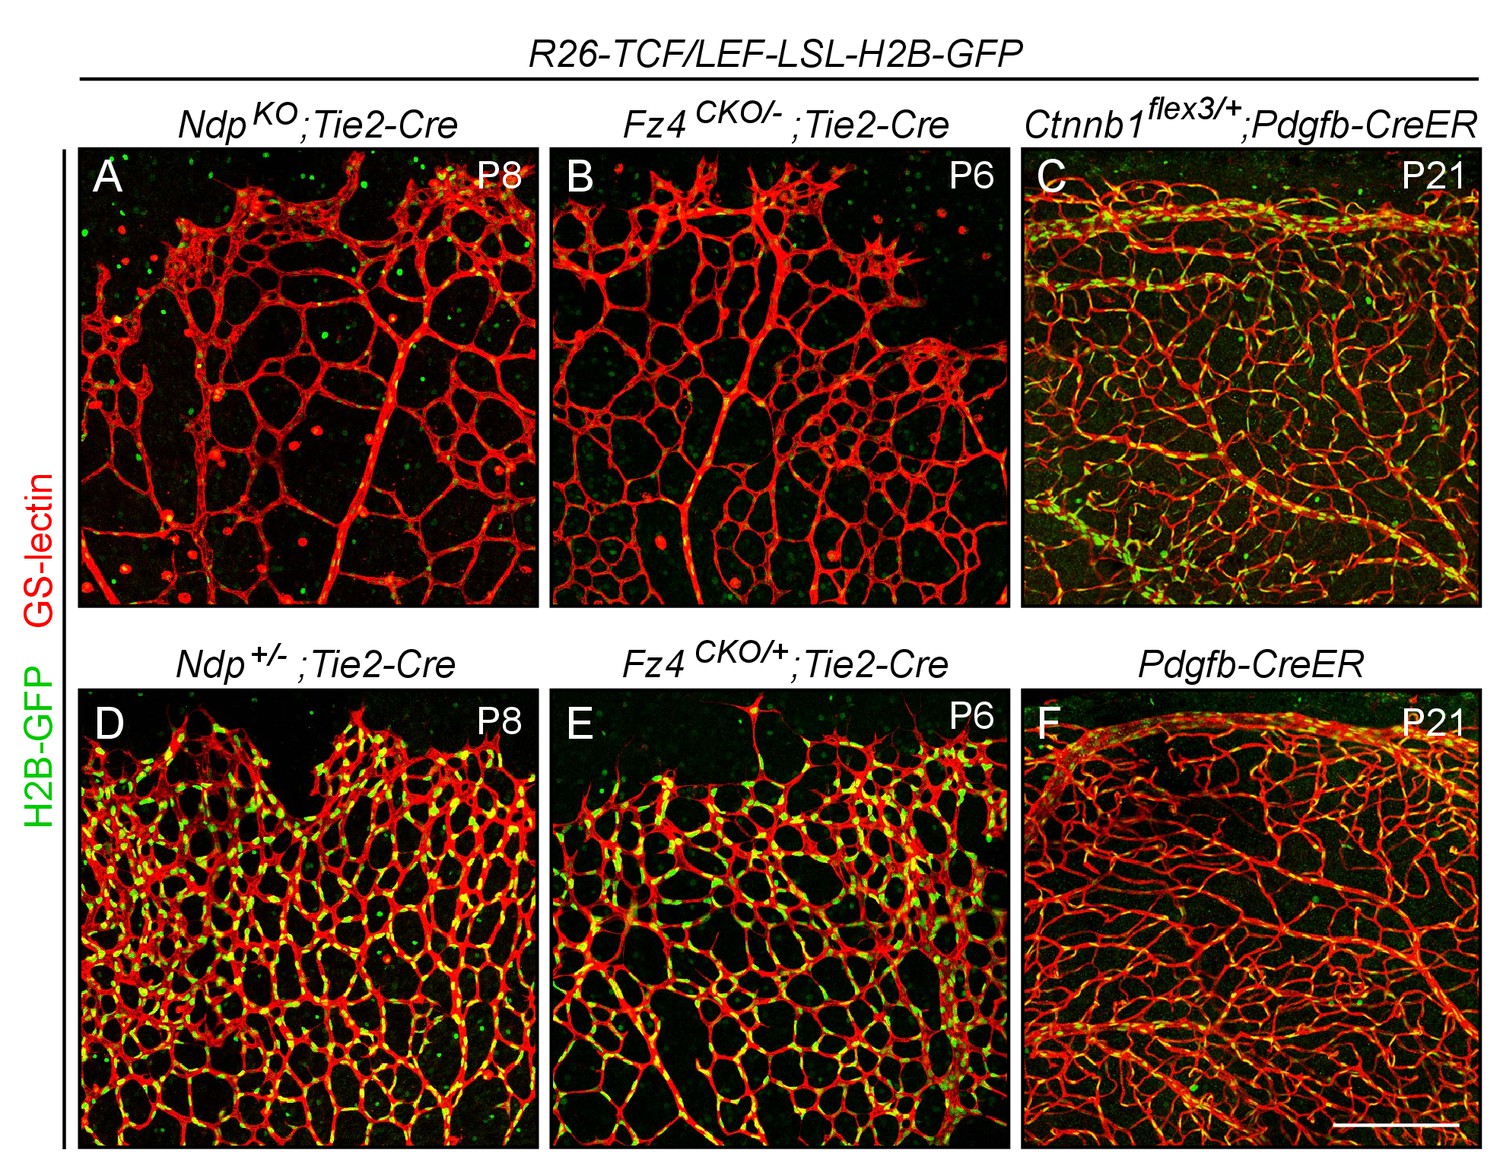
Assessing the specificity and sensitivity of the R26-8xTCF/LEF-LSL-H2B-GFP canonical Wnt reporter in the retinal vasculature by assessing its response to decreased or increased beta-catenin signaling.
Flatmounted retinas with EC-specific Cre recombination were stained with GS lectin to visualize ECs and macrophages, and immunostained with anti-myc antibodies for H2B-GFP-6xmyc. In developing retinas [P6-P8]; panels (A), (B), (D), and (E), the LSL cassette has been removed in all ECs using Tie2-Cre. ECs in R26-8xTCF/LEF-LSL-H2B-GFP;NdpKO;Tie2-Cre (A) and R26-8xTCF/LEF-LSL-H2B-GFP;Fz4CKO/-;Tie2-Cre (B) retinas have little or no beta-catenin signaling and show a nearly complete loss of expression of the nuclear-localized H2B-GFP reporter. [Ndp is X-linked, and ‘NdpKO’ refers to both male Ndp-/Y males and Ndp-/-females.] Littermate controls were heterozygous for Ndp or Fz4 (D, E) and show reporter expression at approximately WT levels. In mature retinas [P21]; panels (C) and (F), the LSL cassette was removed in nearly all ECs using Pdgfb-CreER and 200 ug 4HT at P4. ECs in the R26-8xTCF/LEF-LSL-H2B-GFP;Ctnnb1flex3/+;Pdgfb-CreER retina (C) have high levels of beta-catenin signaling and show a higher level of accumulation of the nuclear-localized H2B-GFP reporter compared to the 8xTCF/LEF-LSL-H2B-GFP;Pdgfb-CreER control retina (F) that lacks Ctnnb1flex3. Paired experimental and control retinas were processed in parallel and imaged with identical microscope settings, and the resulting images were processed identically. Scale bar, 200 μm.
Figure 3 with 3 supplements
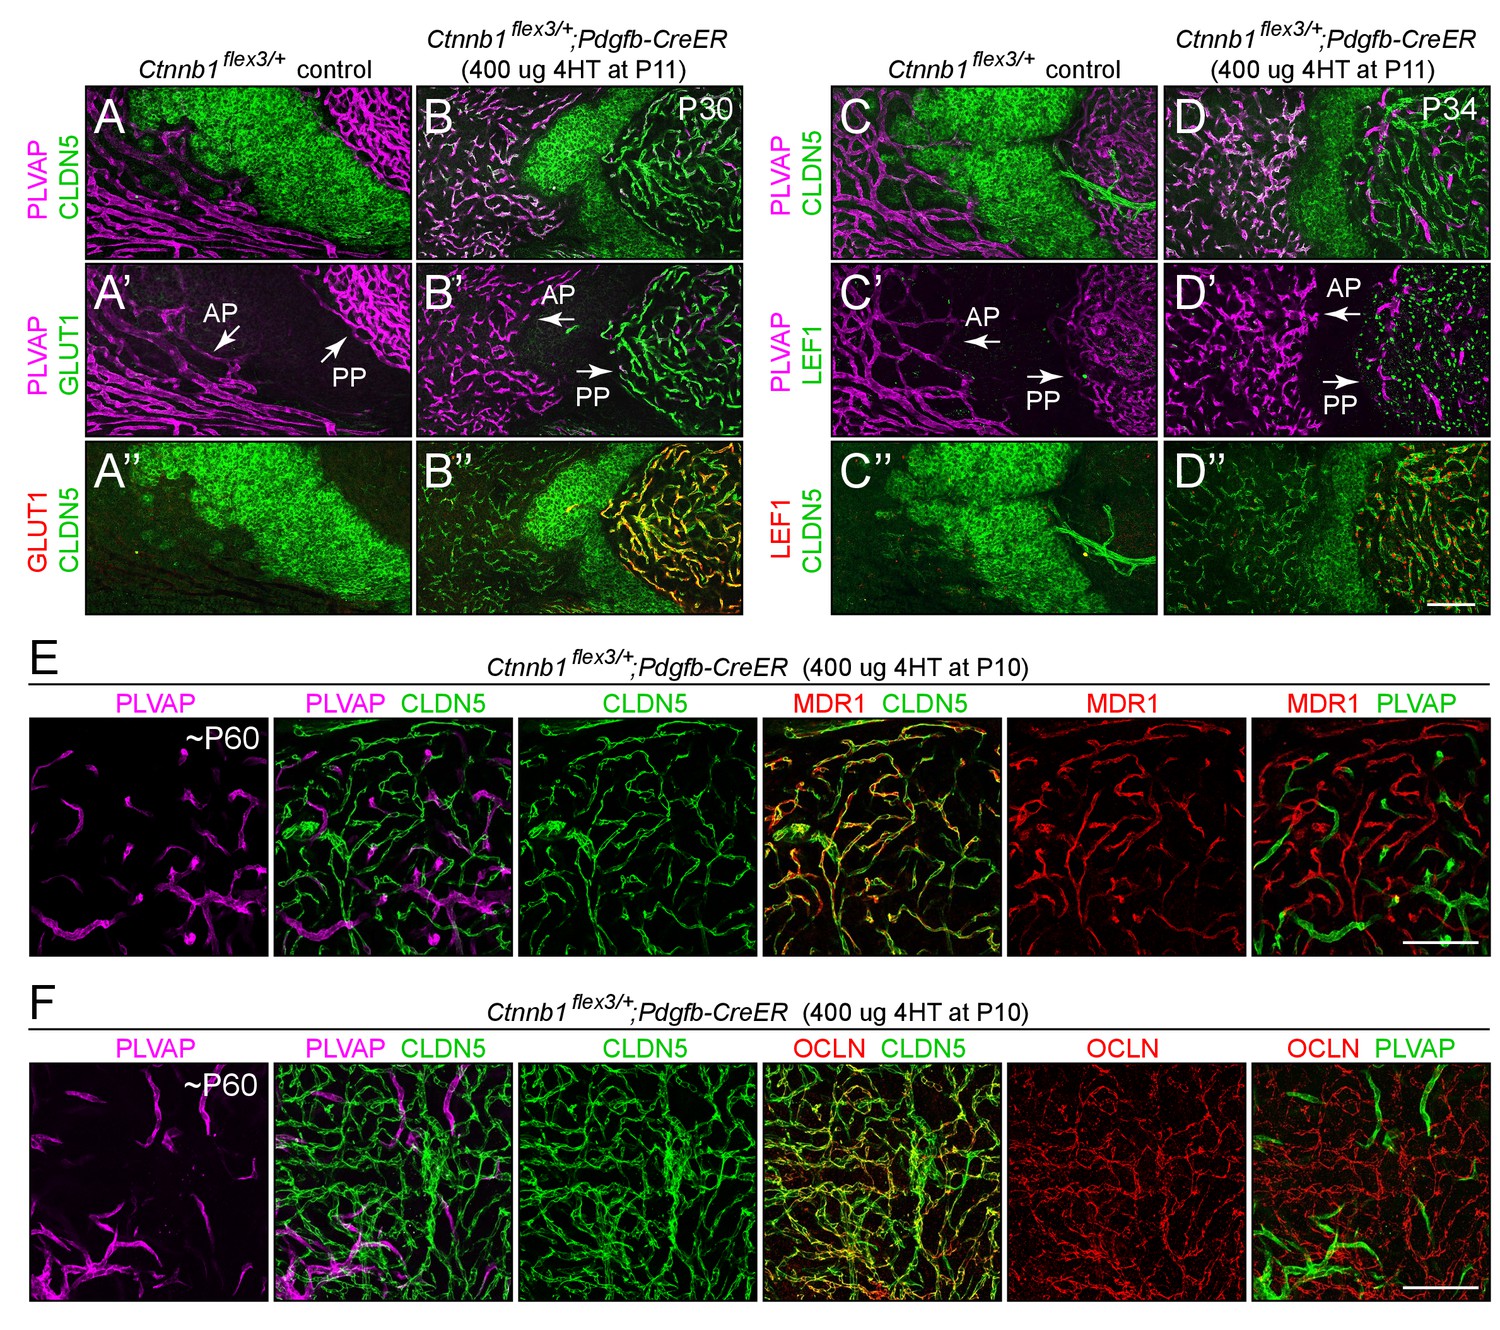
Stabilizing beta-catenin in ECs switches posterior pituitary ECs more than anterior pituitary ECs to a BBB-like state.
(A–D”) Regions of whole-mount pituitaries spanning the junction of the anterior lobe (left), inter-lobe region (middle), and posterior lobe (right) from two control mice (left set of panels) and from two mice with EC-specific deletion of Ctnnb1 exon 3 (right set of panels), immunostained as indicated. With EC-specific deletion of Ctnnb1 exon 3, ECs in the posterior pituitary become CLDN5+/PLVAP-/GLUT1+/LEF1+, whereas anterior pituitary ECs show low levels of CLDN5, a modest reduction in the level of PLVAP, a level of GLUT1 that is below the limit of detection, and rare LEF1+ ECs. In the genetically mosaic Ctnnb1flex3/+;Pdgfb-CreER posterior pituitary vasculature, PLVAP is anti-correlated with CLDN5, LEF1, and GLUT1 on a cell-by-cell basis (B–B” and D–D”). GLUT1 and LEF1 are shown with different colors in B’ and D’ to highlight their co-localization with CLDN5 and their anti-correlation with PLVAP in the posterior pituitary. (E,F) As in A-D’, except images are entirely within the posterior lobe and the pituitaries were immunostained for PLVAP, CLDN5, and either MDR1 or OCLN. In the right-most panels, PLVAP is false-colored green for ease of comparison. The efficiency of CreER-mediated recombination in ECs is ~80%, as judged by the conversion of EC markers. AP, anterior pituitary. PP, posterior pituitary. Scale bar for A-F, 100 μm.
Figure 3—figure supplement 1
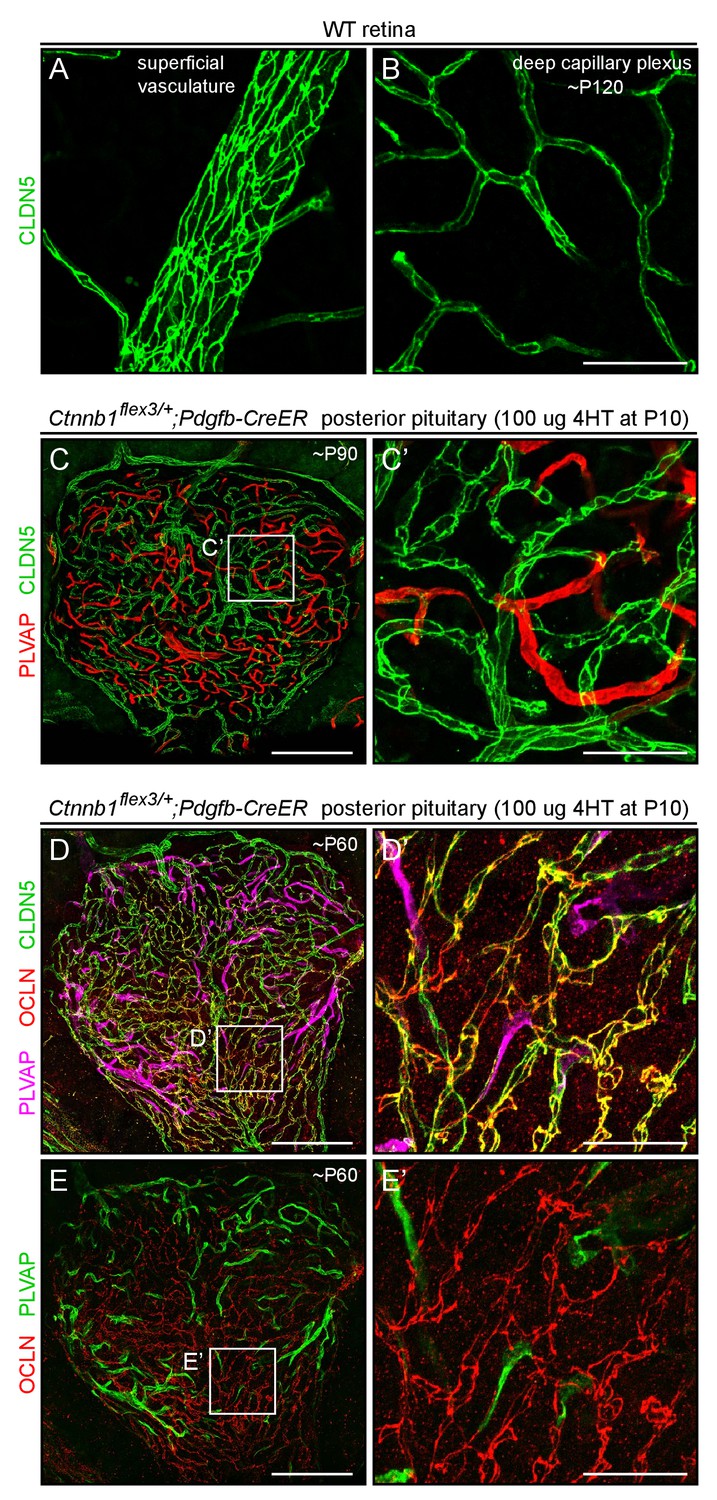
CLDN5 and OCLN co-localize to cell-cell junctions in posterior pituitary ECs that have been converted to a BBB-like state by beta-catenin stabilization.
(A,B) CLDN5 staining of WT retina, at two Z-planes, and shown at the same magnification as panels C’, D’, and E’. CLDN5 localizes to the periphery of each EC, at the sites of tight junctions. (C–E) Posterior pituitary with mosaic EC-specific stabilization of beta-catenin, stained for PLVAP and CLDN5 (C) or PLVAP, CLDN5, and OCLN (D and E), at low magnification. Panels D-E’ are from the same image; in panels E and E’, the PLVAP signal has been false-colored green. (C’, D’, and E’) Higher magnification images of the regions indicated by the white squares in (C–E). Tissues shown in D-E’ were fixed by methanol perfusion. Scale bar in C, D, and E, 200 μm. Scale bars for A and B, and for C’, D’, and E’, 50 μm.
Figure 3—figure supplement 2
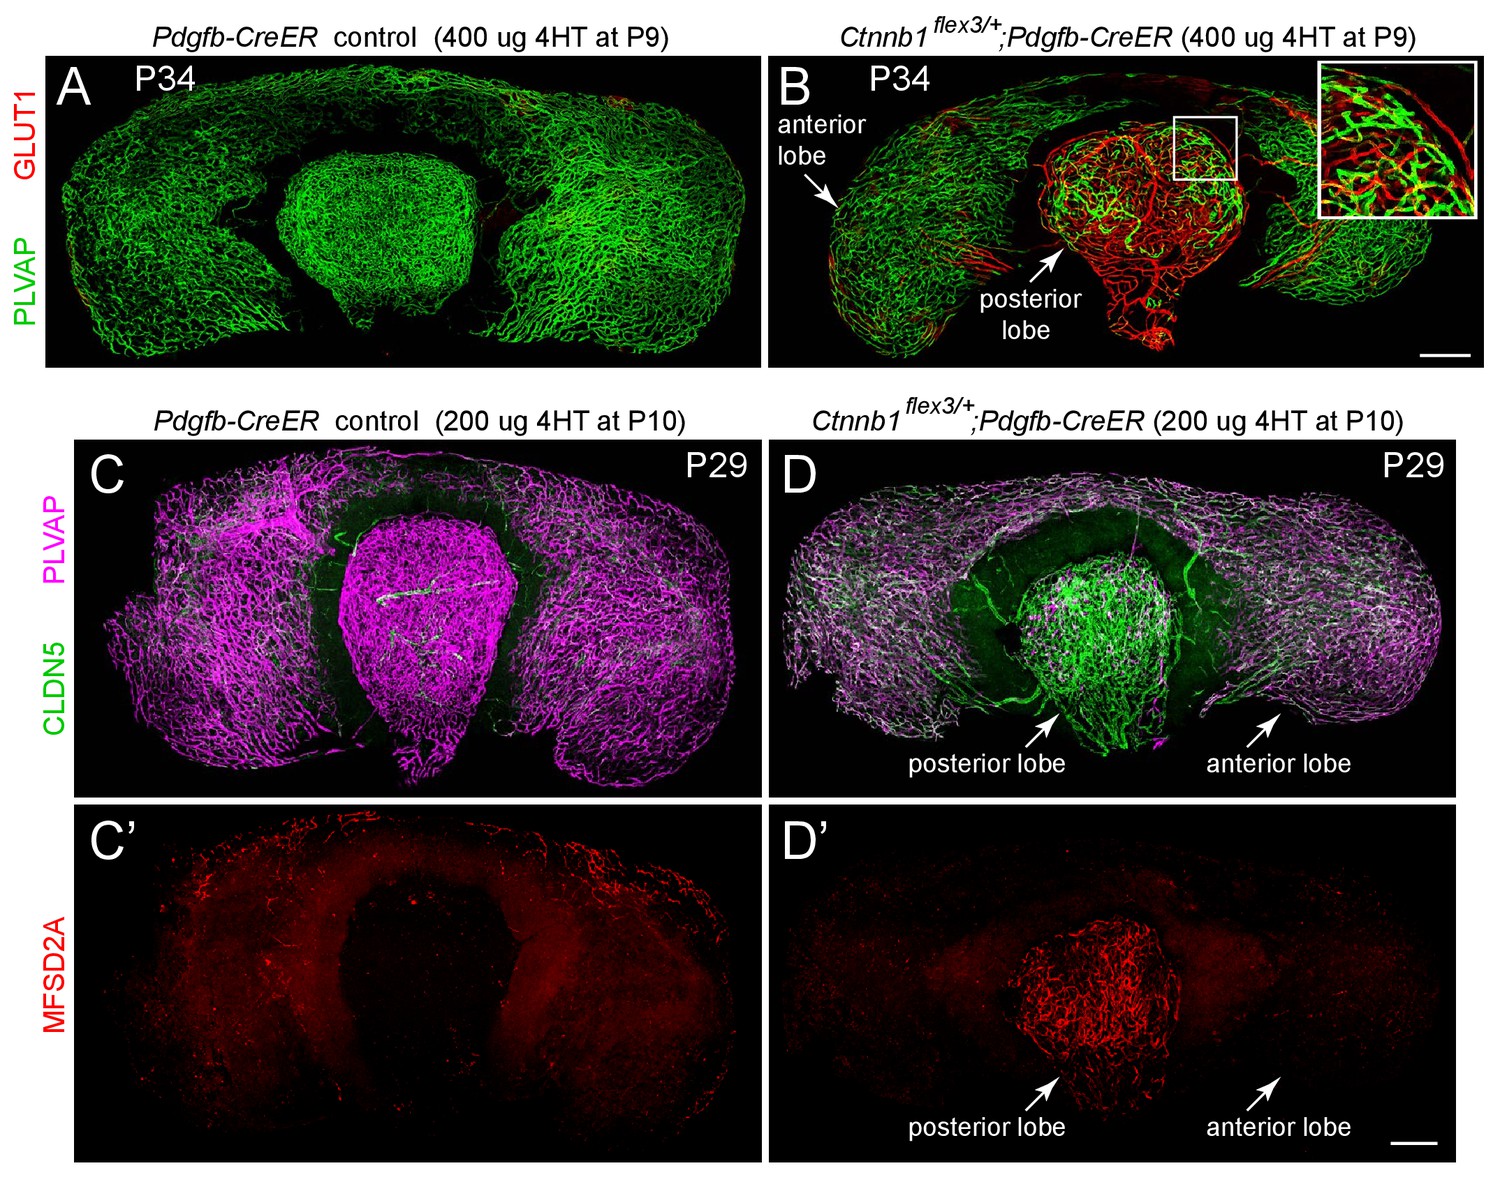
Stabilizing beta-catenin in ECs switches posterior pituitary ECs more than anterior pituitary ECs to a BBB-like state.
(A,B) Whole mount of the intact pituitary from a control mouse (A) and from a mouse with EC-specific deletion of Ctnnb1 exon 3 (B), immunostained for PLVAP and GLUT1. In (B), the boxed region encompassing part of the posterior lobe is enlarged at the upper right. (C–D’) Whole mount of the intact pituitary from a control mouse (C and C’) and from a mouse with EC-specific deletion of Ctnnb1 exon 3 (D and D’), immunostained for CLDN5, MFSD2A, and PLVAP. In the posterior pituitary, CLDN5-/MFSD2A-/PLVAP+ ECs are converted to CLDN5+/MFSD2A+/PLVAP- by EC-specific deletion of Ctnnb1 exon 3. In anterior pituitary ECs with deletion of Ctnnb1 exon 3, PLVAP levels decline less than in the posterior pituitary, CLDN5 levels increase less than in the posterior pituitary, and MFSD2A remains below the limit of detection. In (A–D’), the efficiency of CreER-mediated recombination in ECs is ~60–80%, as judged by the conversion of EC markers. Scale bars for all panels, 200 μm.
Figure 3—figure supplement 3
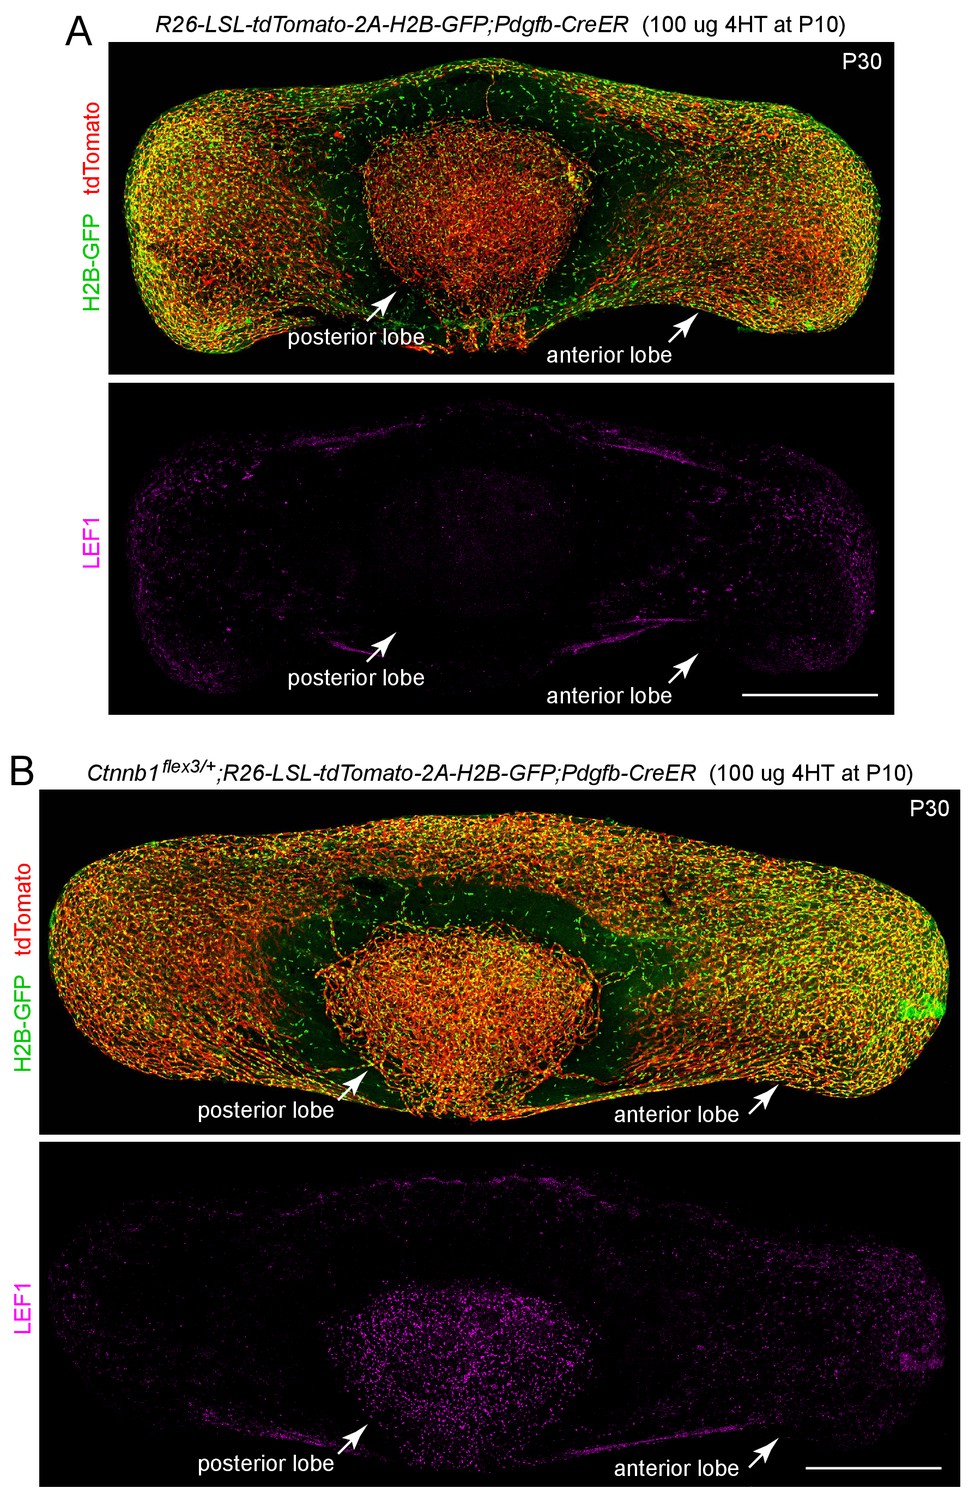
Pdgfb-CreER efficiently recombines a LoxP-stop-LoxP reporter in both anterior and posterior pituitary ECs.
(A,B) The R26-LSL-tdTomato-2A-H2B-GFP reporter is efficiently activated by Pdgfb-CreER-mediated recombination, as seen by the accumulation of membrane-tethered tdTomato and nuclear H2B-GFP in both anterior and posterior pituitary ECs. In (A), the ECs are phenotypically WT. In (B), the mouse carries R26-LSL-tdTomato-2A-H2B-GFP, Ctnnb1flex3, and Pdgfb-CreER, and the resulting stabilization of beta-catenin leads to an accumulation of LEF1 in the nuclei of posterior pituitary ECs more than anterior pituitary ECs. The efficiency of CreER-mediated recombination in ECs is similar in (A) and (B), as judged by the conversion of EC markers. Scale bars, 500 μm.
Figure 4
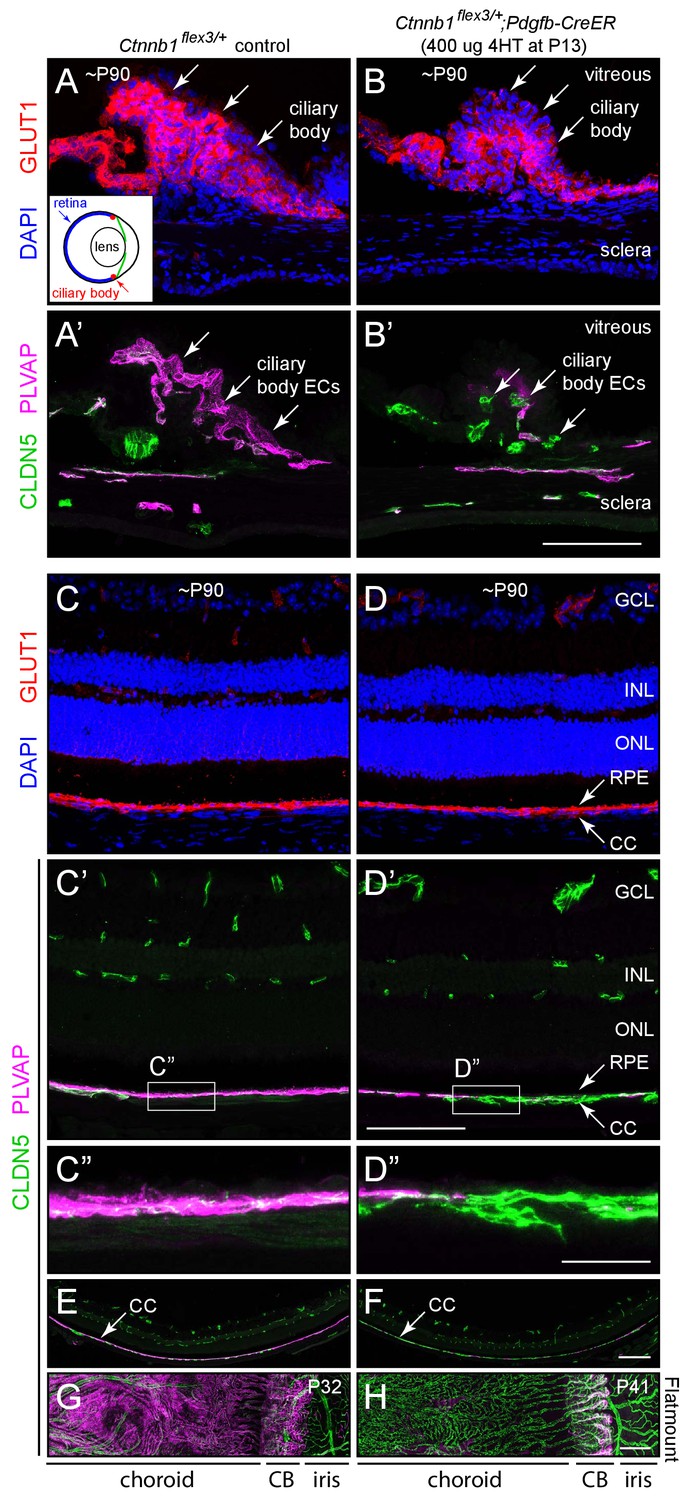
Stabilizing beta-catenin in ECs switches the choriocapillaris and ciliary body vasculatures to a BBB-like state.
(A–B’) Cross-sections of the ciliary body from a control mouse (A, A’) and from a mouse with mosaic EC-specific deletion of Ctnnb1 exon 3 (B, B’), immunostained as indicated. GLUT1 is expressed in epithelial cells surrounding the ciliary body capillaries. ECs in the control ciliary body are CLDN5-/PLVAP +and ECs with deletion of Ctnnb1 exon 3 are CLDN5+/PLVAP- (arrows in A’ and B’). Inset in (A), schematic of the mouse eye showing the locations of the ciliary body, lens, and retina. Scale bar, 100 μm. (C–D”) Cross-sections of retina from a control mouse (C, C’, C”) and from a mouse with mosaic EC-specific deletion of Ctnnb1 exon 3 (D, D, D”), immunostained as indicated. With EC-specific deletion of Ctnnb1 exon 3, choriocapillaris ECs switch from CLDN5-/PLVAP +to CLDN5+/PLVAP-. The adjacent RPE is GLUT1+. Intra-retinal ECs remain CLDN5+/PLVAP-. (C”) and (D”) show higher magnification views of the boxed regions from panels (C’) and (D’). GCL, ganglion cell layer; INL, inner nuclear layer; ONL, outer nuclear layer; RPE, retinal pigment epithelium; CC, choriocapillaris. Scale bar for C-D’, 100 um. Scale bar for C’ and D’, 20 μm. (E,F) Lower magnification images encompassing the regions shown in (C’) and (D’). Scale bar, 200 um. (G,H) Flat mount of the retinal pigment epithelium, choroid, and sclera after the retina was removed, viewed from the anterior of the eye. With EC-specific deletion of Ctnnb1 exon 3, capillary ECs in the choriocapillaris switch from CLDN5-/PLVAP +to CLDN5+/PLVAP-. The ciliary body shows less complete conversion. Scale bar, 200 μm.
Figure 5
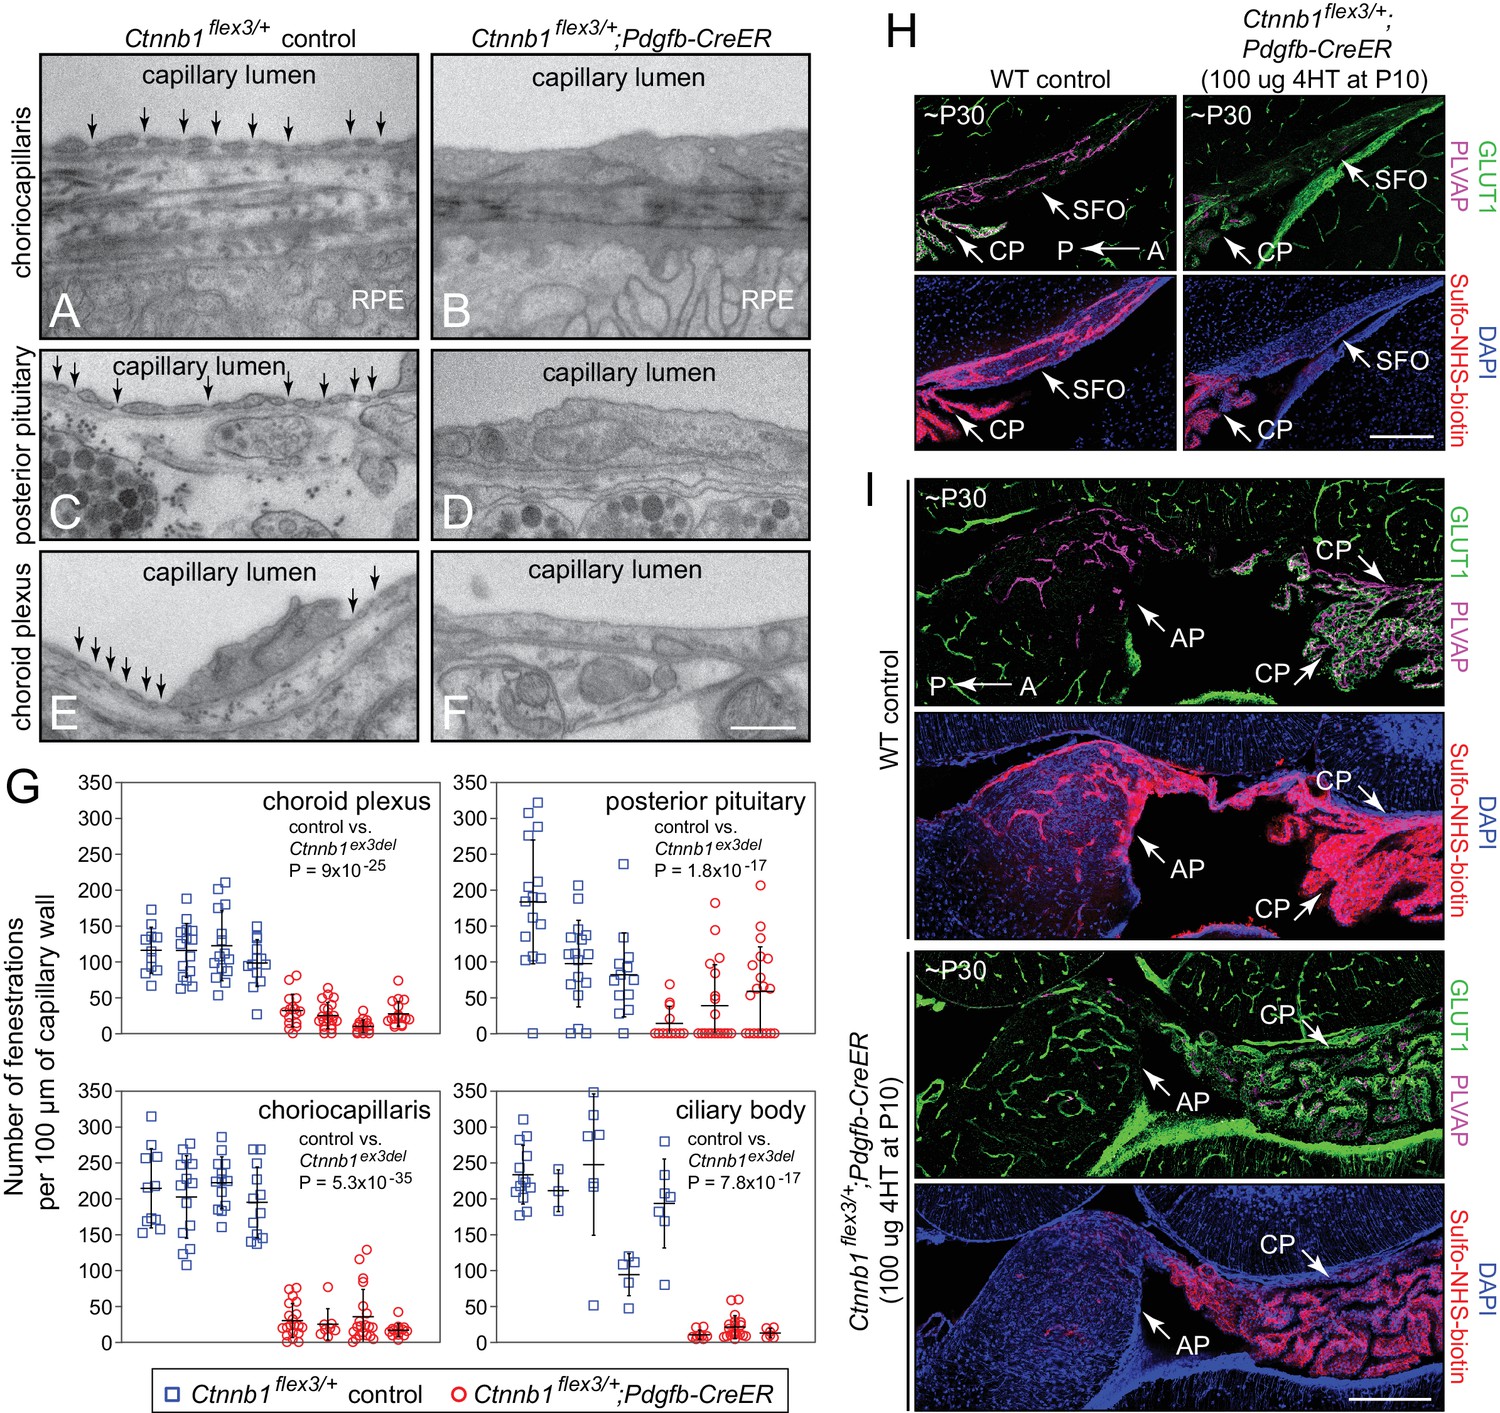
Stabilizing beta-catenin signaling suppresses EC fenestrae and reduces vascular permeability.
(A–F) Transmission electron micrographs from control mice (left) and from age-matched mice with EC-specific deletion of Ctnnb1 exon 3 (right) showing representative sections of choriocapillaris (A,B), posterior pituitary (C,D), and choroid plexus (E,F). RPE, retinal pigment epithelium. Vertical arrows mark fenestrae. Neurohormone secretory granules are seen in the posterior pituitary parenchyma. Scale bar, 500 nm. (G) Quantification of the density of capillary EC fenestrae in age-matched and 4HT-treated control (Ctnnb1flex3/+) vs. Ctnnb1 exon 3 stabilized (Ctnnb1flex3/+;Pdgfb-CreER) mice for the choriocapillaris, posterior pituitary, choroid plexus, and ciliary body. Each data-point represents all of the vascular wall length within a single 10 μm x 10 μm TEM image. Bars show mean ± S.D. Each cluster of data points represents a different mouse. For each location and genotype, 3–5 mice were analyzed. For each of the four anatomic locations, the p-values are calculated for all of the Ctnnb1flex3/+vs. all of the Ctnnb1flex3/+;Pdgfb-CreER data-points. (H,I) Sagittal brain sections show vascular markers GLUT1 and PLVAP and perivascular accumulation of Sulfo-NHS-biotin (following IP injection) in the SFO and adjacent choroid plexus (H) and in the area postrema and adjacent choroid plexus (I) from ~P30 WT vs. Ctnnb1flex3/+;Pdgfb-CreER mice. AP, area postrema; CP, choroid plexus. A, anterior; P, posterior. Scale bars in (H) and (I), 200 μm.
Figure 6 with 3 supplements
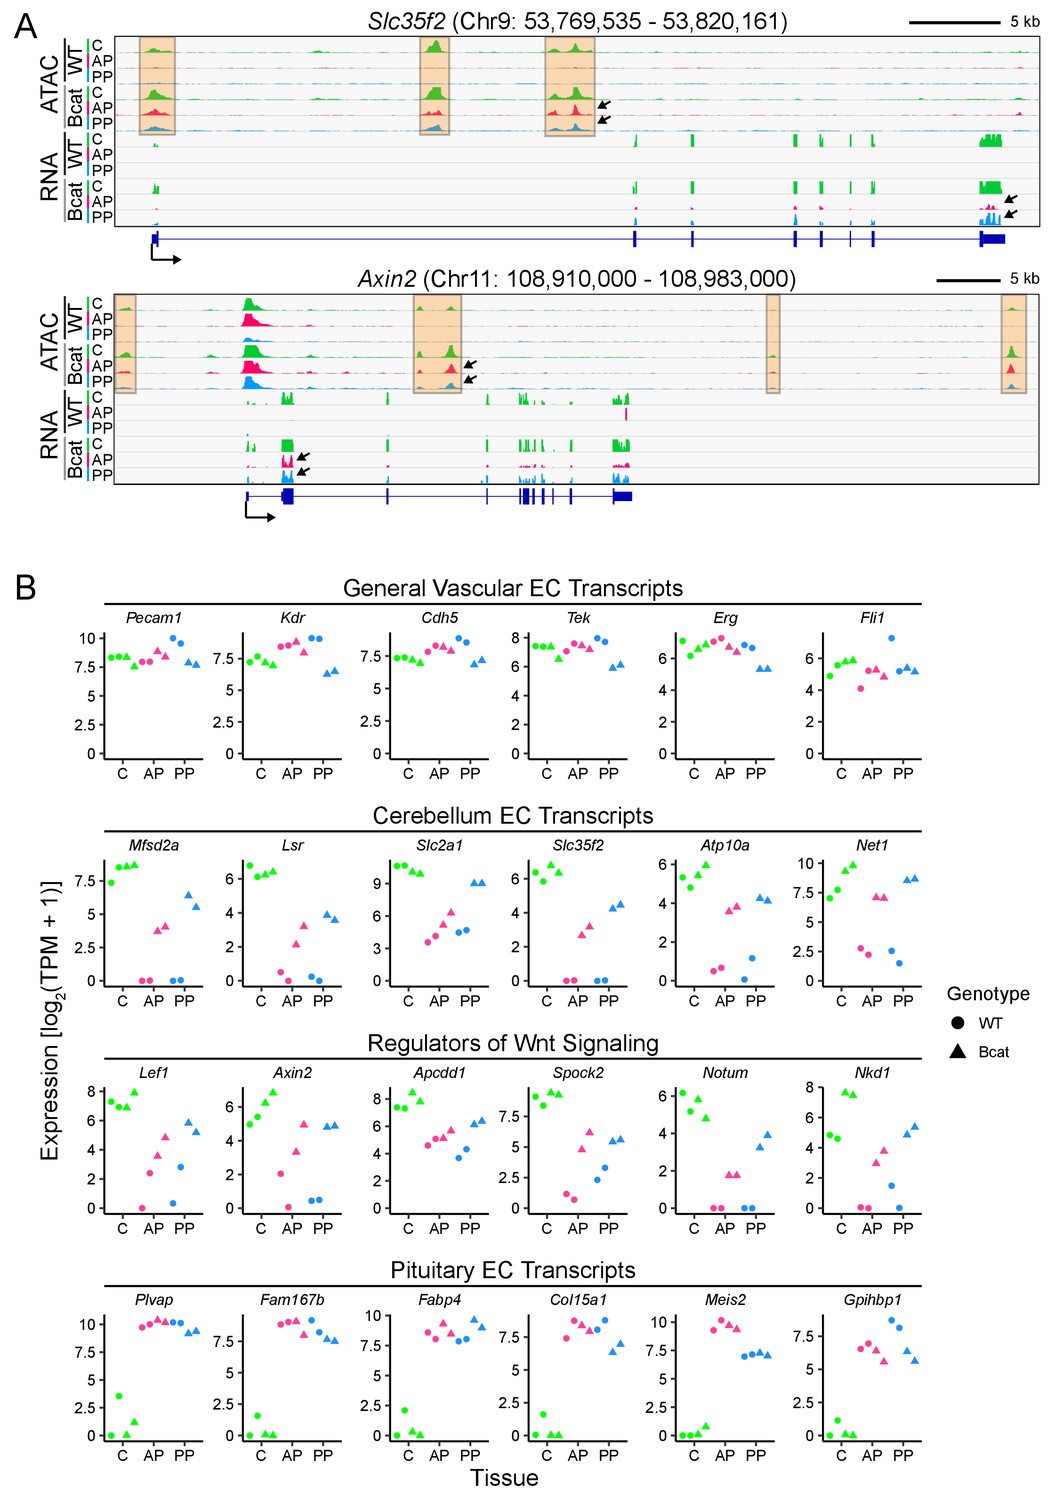
In pituitary ECs, stabilization of beta-catenin promotes a BBB-like state of the transcriptome and of chromatin accessibility.
(A) Genome browser images showing accessible chromatin (ATAC; top) and transcript abundances (RNA; bottom) for two BBB genes: Slc35f2, which codes for a putative nucleoside transporter, and Axin2, a Wnt target gene and a negative regulator of Wnt signaling. Histograms show aligned read counts. C, cerebellum; AP, anterior pituitary; PP, posterior pituitary; WT, wild-type; Bcat, beta-catenin stabilized (i.e. Ctnnb1 exon 3 deleted). Each track represents the average of two independent replicates. The orange regions highlight accessible chromatin that changes with beta-catenin stabilization. For each gene, all six of the ATAC-seq histograms are at the same vertical scale [Slc35f2 ATAC: 0–2000 reads; Axin2 ATAC: 0–3000 reads] and all six of the RNA-seq histograms are at the same vertical scale [Slc35f2 RNA: 0–5251 reads; Axin2 RNA: 0–3379 reads]. For both genes, some of the ATAC-seq and RNA-seq signals extend beyond the vertical range in the images. Bottom, intron-exon structure, with the arrow indicating the promoter and the direction of transcription. Arrows within the browser images point to examples of ATAC-seq or RNA-seq signals that are induced by beta-catenin stabilization. (B) Expression levels (log2 transformed TPM + 1) based on RNA-seq for the indicated categories of EC transcripts. Data for the two independent replicates are shown.
Figure 6—figure supplement 1
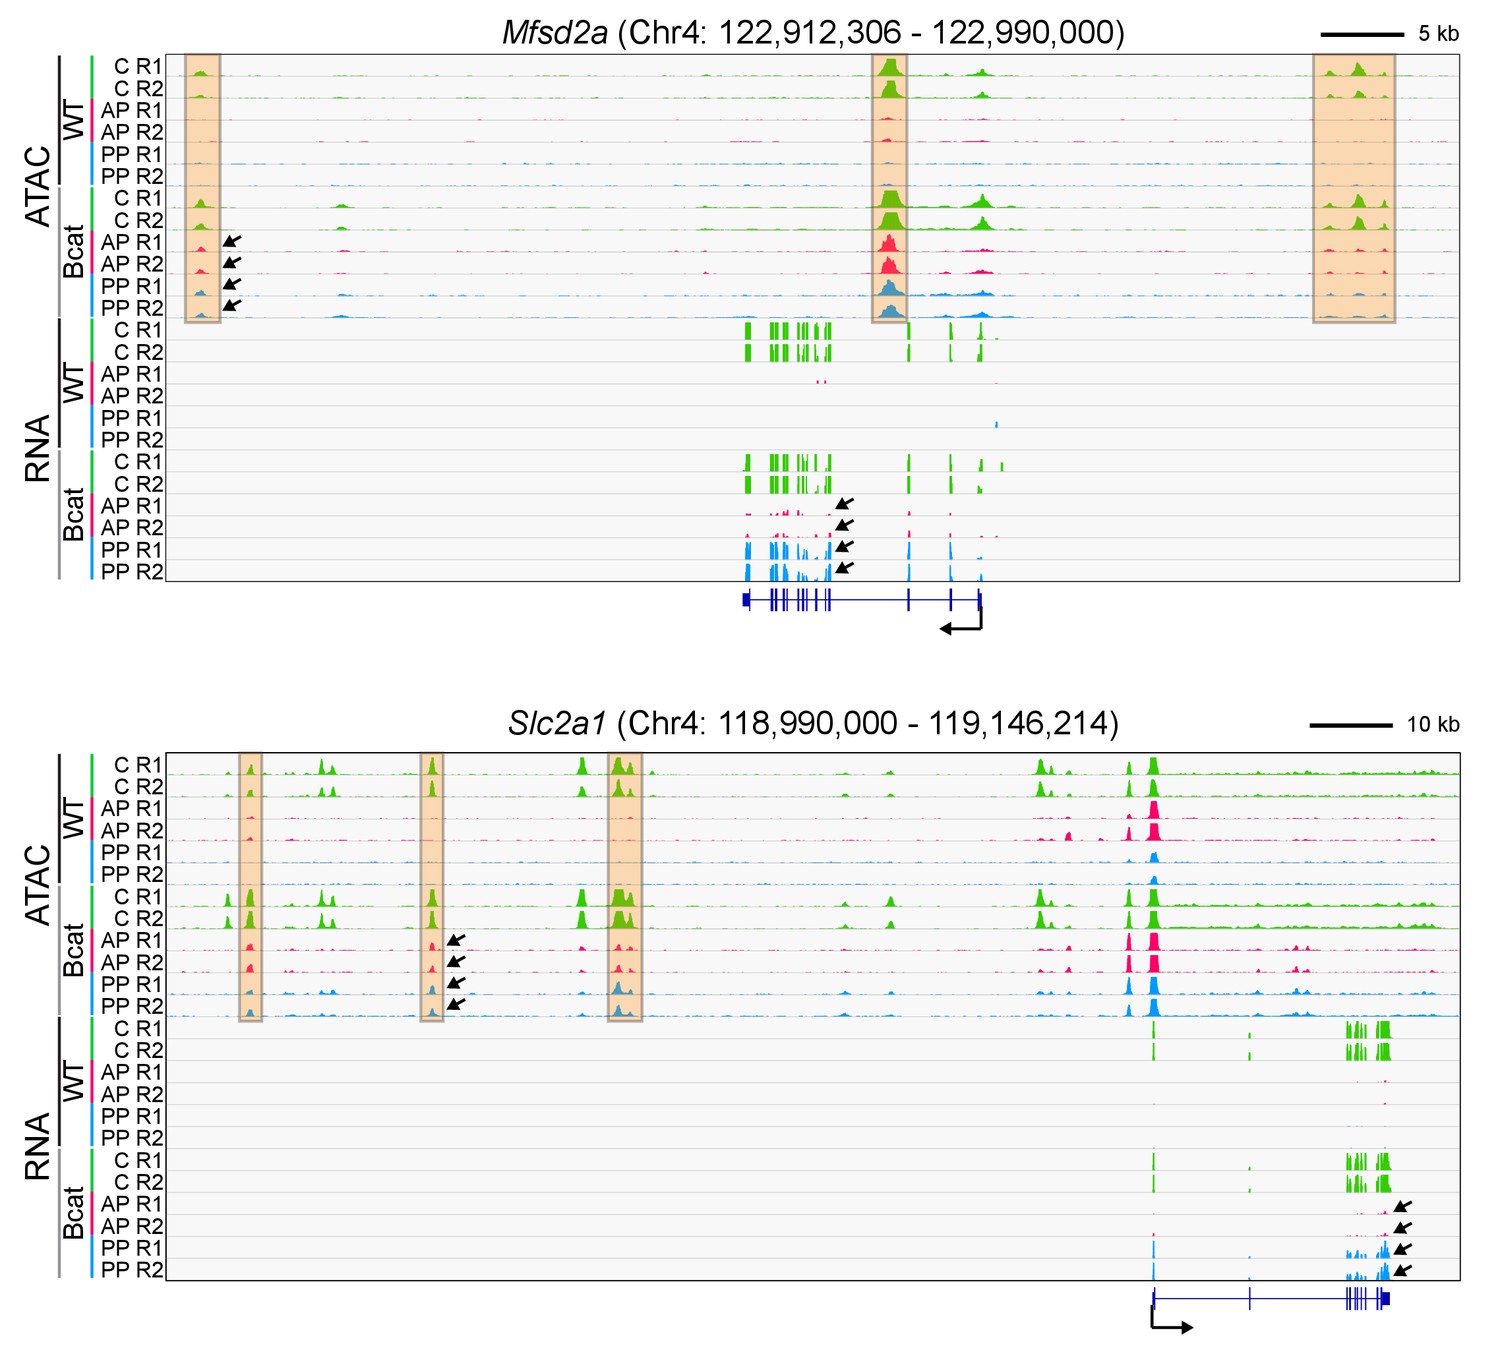
Genome browser images for two genomic loci that are responsive to beta-catenin stabilization in anterior and posterior pituitary ECs.
(A) Genome browser images showing accessible chromatin (top) and RNA expression (bottom) for two BBB genes: Mfsd2a (encoding a docosahexaenoic acid transporter), and Slc2a1 (encoding GLUT1). The genome browser images and abbreviations are as described for Figure 6, except that each track in the present figure represents a single biological replicate, rather than the average of the two replicates. R1, replicate 1; R2, replicate 2. The orange regions highlight accessible chromatin that changes with beta-catenin stabilization. For each gene, all 12 of the ATAC-seq histograms are at the same vertical scale [Mfsd2a ATAC: 0–3000 reads; Slc2a1 ATAC: 0–3000 reads] and all 12 of the RNA-seq histograms are at the same vertical scale [Mfsd2a RNA: 0–7582 reads; Slc2a1 RNA: 0–84913 reads]. For both genes, some of the ATAC-seq and RNA-seq signals extend beyond the vertical range in the images. Arrows within the browser images point to examples of ATAC-seq or RNA signals that are induced by beta-catenin stabilization.
Figure 6—figure supplement 2
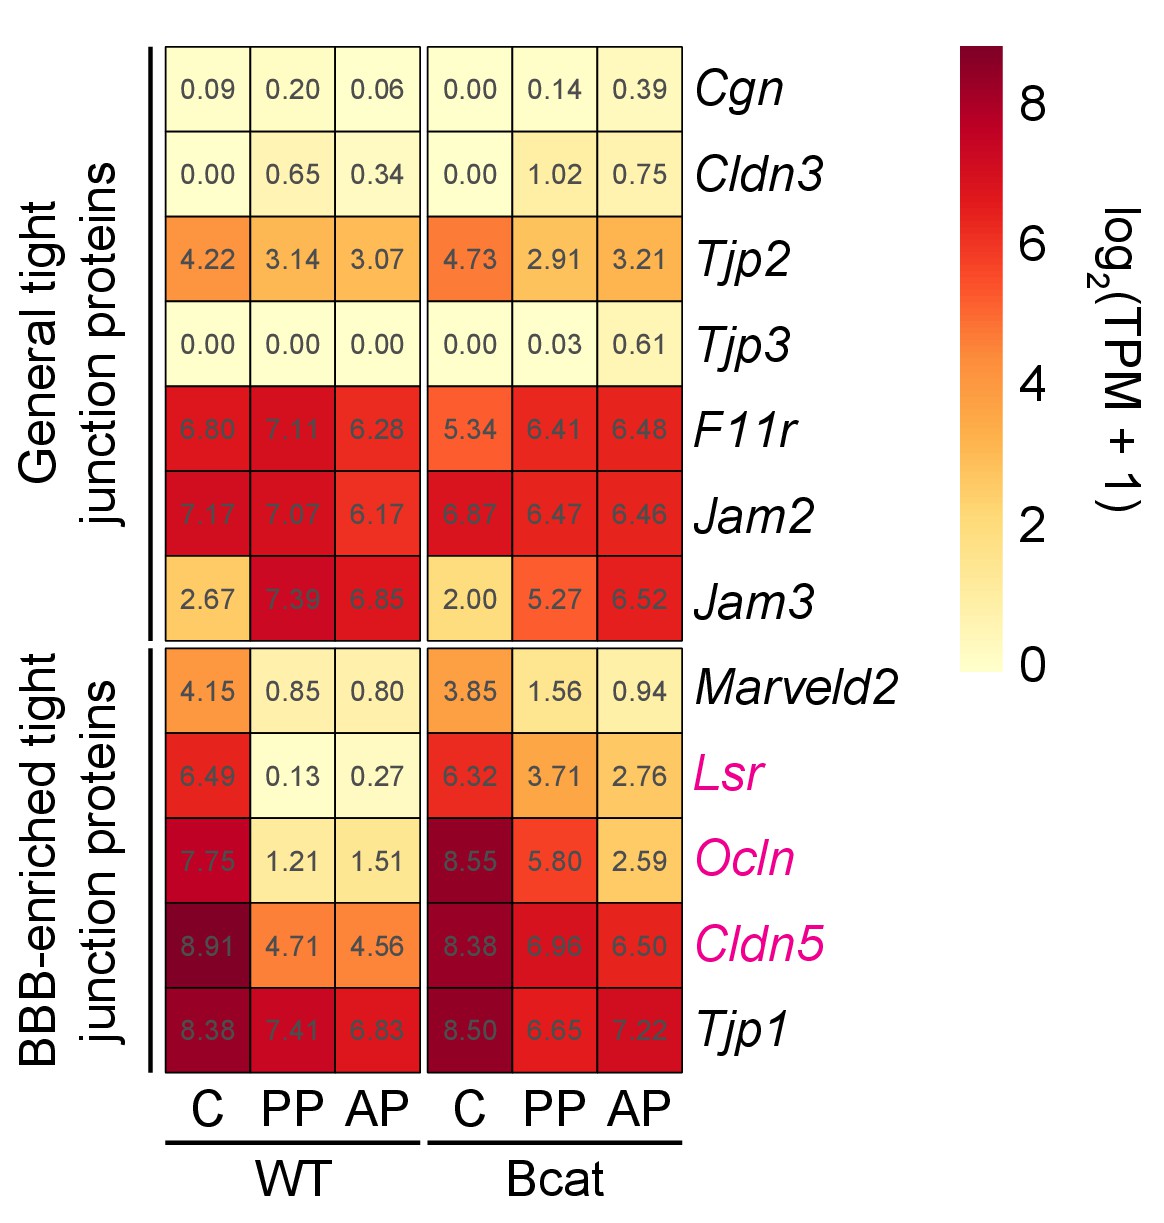
Heatmap showing the abundances of transcripts coding for tight junction proteins in WT vs.beta-catenin stabilized ECs in pituitary and cerebellum.
Tight junction proteins are divided into two groups: general (top) and BBB-enriched (bottom). Lsr, Ocln, and Cldn5 transcripts show the greatest increase in abundance in the posterior pituitary upon beta-catenin stabilization, with more modest levels of induction in the anterior pituitary. Tjp1 transcripts code for ZO1 and their abundance changes minimally, if at all, upon beta-catenin stabilization. Red labels indicate transcripts that are significantly up-regulated in anterior and/or posterior pituitary ECs in response to beta-catenin stabilization. AP, anterior pituitary; PP, posterior pituitary; C, cerebellum.
Figure 6—figure supplement 3
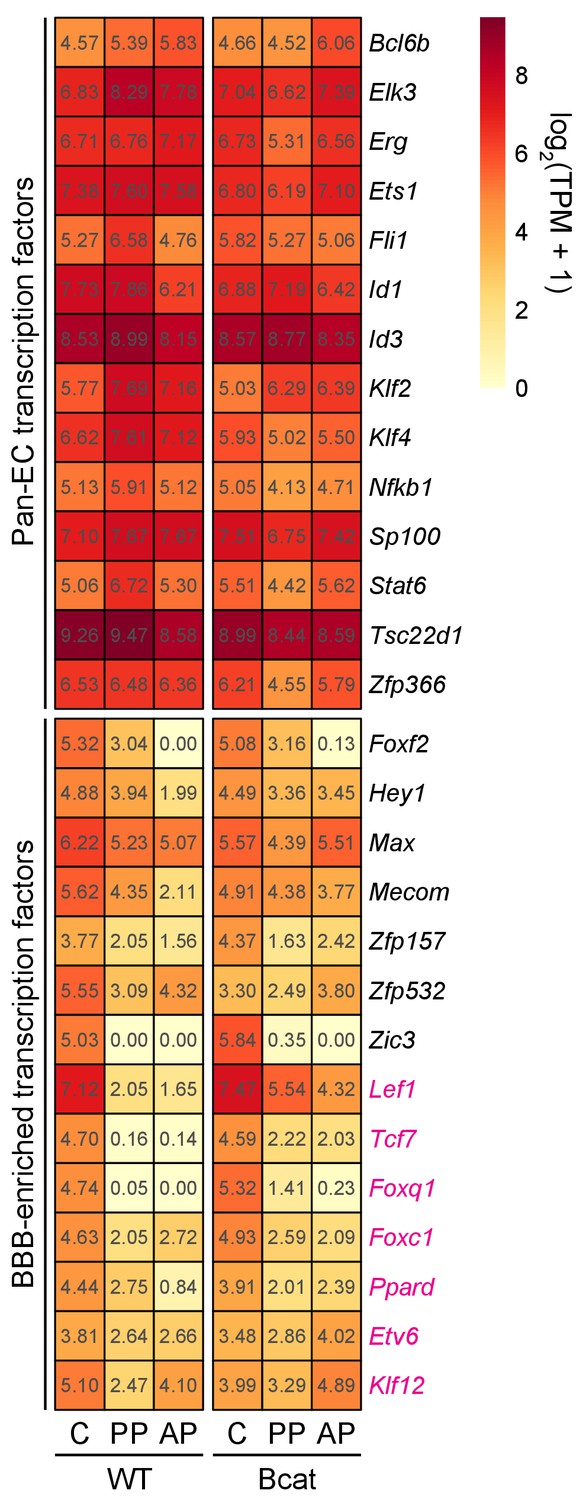
Heatmap showing the abundances of transcripts coding for TFs in WT vs. beta-catenin stabilized ECs in pituitary and cerebellum.
TFs are divided into two groups: pan-EC (top) and BBB-enriched (bottom). Red labels indicate transcripts that are significantly up-regulated in anterior and/or posterior pituitary ECs in response to beta-catenin stabilization. AP, anterior pituitary; PP, posterior pituitary; C, cerebellum.
Figure 7 with 2 supplements
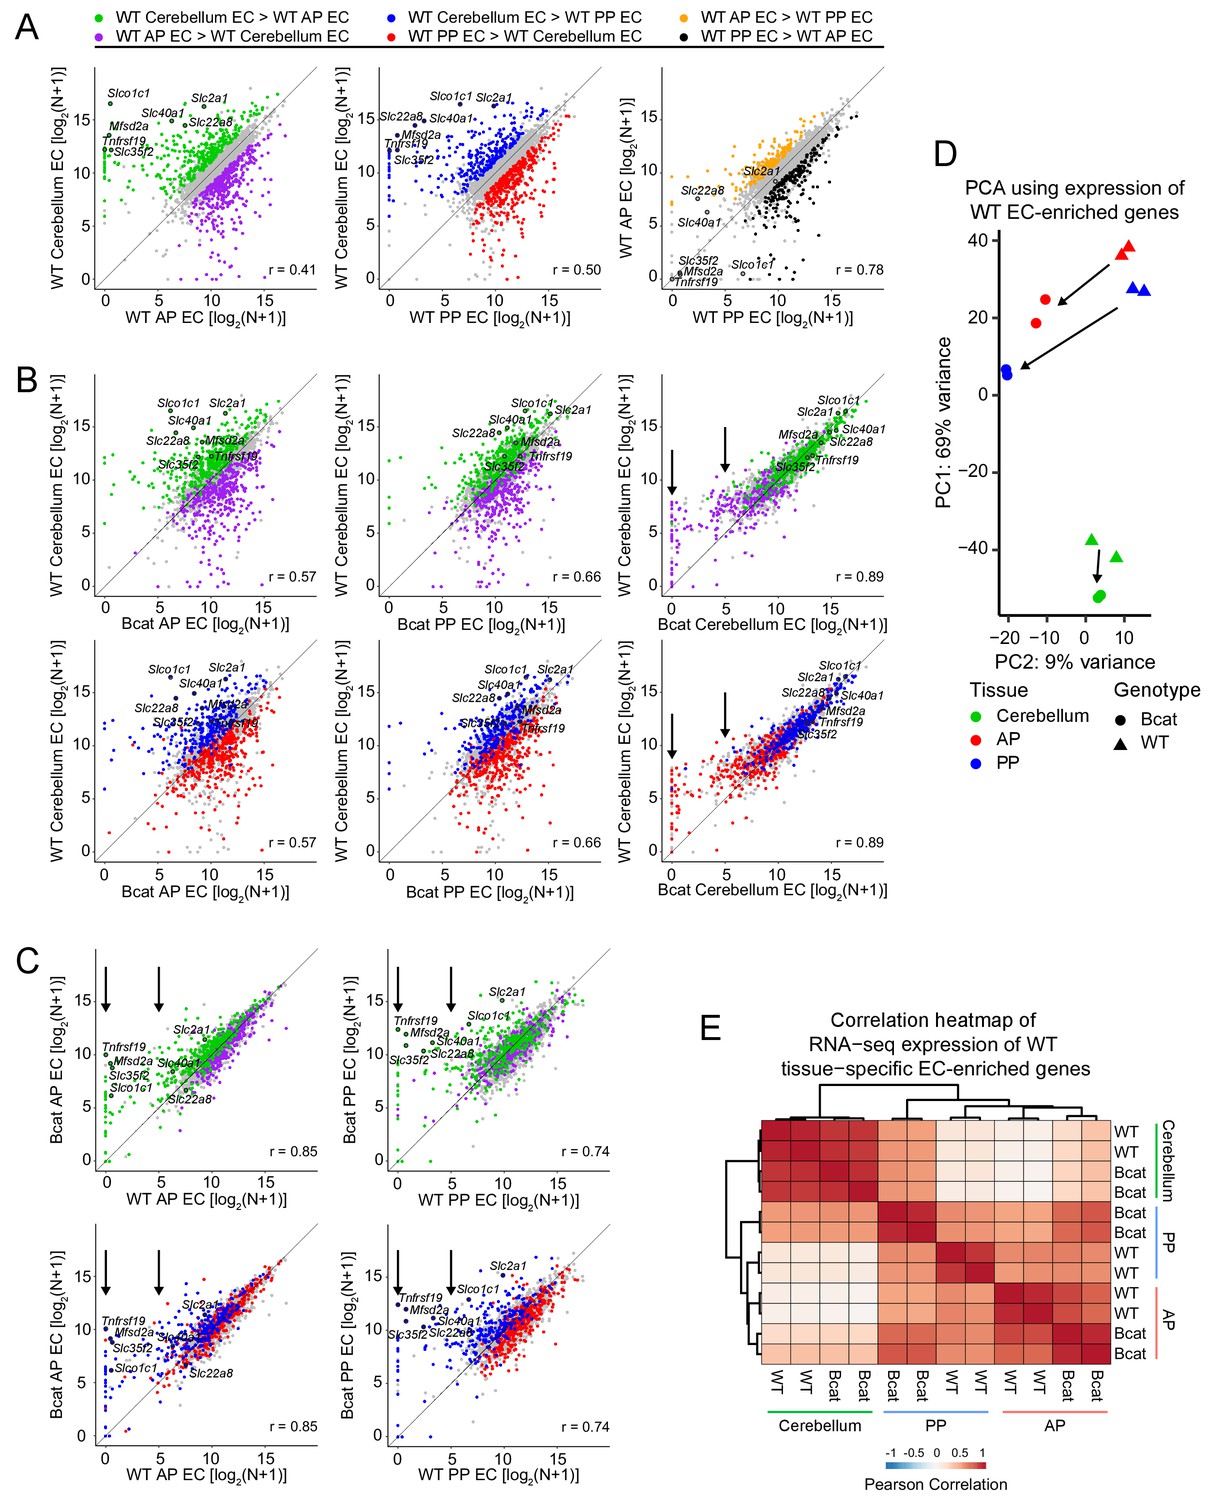
Genome-wide visualization of transcriptome differences in ECs from different tissues for WT vs.beta-catenin stabilized samples.
(A) Scatter plots comparing cross-sample normalized RNA-seq read counts of EC-enriched protein-coding genes from cerebellum ECs vs. anterior pituitary (AP) ECs, cerebellum ECs vs. posterior pituitary (PP) ECs, and anterior pituitary ECs vs. posterior pituitary ECs. Values depicted are the log2 transformation of cross-sample normalized RNA-seq read counts + 1. Colored symbols indicate transcripts with false discovery rate (FDR) < 0.05 and enrichment >2 fold for the indicated comparisons. The same set of seven BBB-associated transcripts are labeled in each scatterplot and their associated datapoints are enclosed by black circles. All data in this figure are averages of two independent samples. (B) Scatter plots comparing cross-sample normalized RNA-seq read counts of EC-enriched protein-coding genes from WT cerebellum ECs vs. beta-catenin stabilized anterior pituitary ECs, posterior pituitary ECs, and cerebellum ECs. Colored symbols are as defined in (A). (C) Scatter plots comparing cross-sample normalized RNA-seq read counts of EC-enriched protein-coding genes between genotypes for anterior pituitary ECs and posterior pituitary ECs. Vertical arrows in (B) and (C) indicate multiple data points that change upon beta-catenin stabilization. (D) Principal component analysis of all WT EC-enriched transcripts from cerebellum ECs, anterior pituitary ECs, and posterior pituitary ECs. The two symbols for each sample represent biological replicates. Most of the variance is explained by PC1 which separates the samples by tissue of origin. Arrows indicate changes upon beta-catenin stabilization. (E) Heatmap indicating pairwise Pearson correlations for RNA-seq TPM among WT and beta-catenin-stabilized ECs for tissue-specific EC protein-coding genes. Data are shown for the individual replicates. AP, anterior pituitary; PP, posterior pituitary.
Figure 7—figure supplement 1
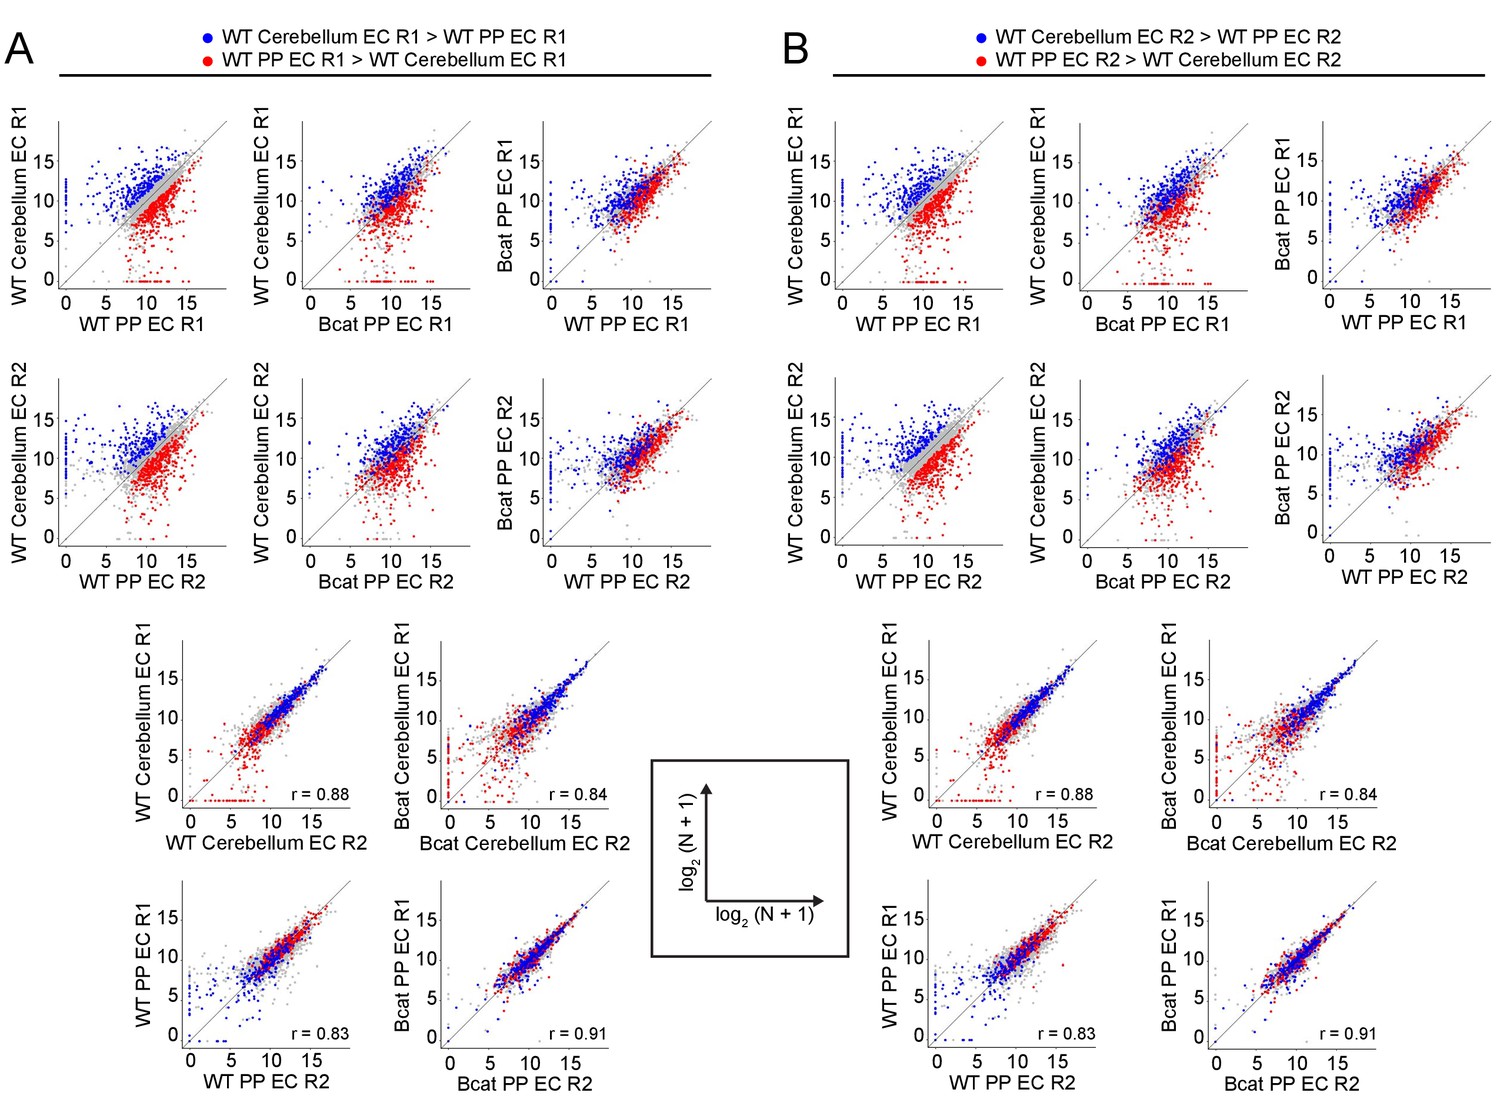
Genome-wide visualization of transcriptome differences in WT vs. beta-catenin stabilized ECs, comparing across independent replicates.
(A,B) Scatter plots comparing cross-sample normalized RNA-seq read counts of EC-enriched protein-coding genes from cortex vs. choroid plexus. Values depicted are the log2 transformation of cross-sample normalized RNA-seq read counts + 1. Colored symbols indicate transcripts with FDR < 0.05 and enrichment >2 fold for the indicated comparisons. All data in this figure are from single replicates. R1, replicate 1, R2, replicate 2. Data points highlighted in (A) are derived from R1 and data points highlighted in (B) are derived from R2, as defined at the top of the figure.
Figure 7—figure supplement 2

Genome-wide visualization of transcriptome differences in choroid plexus ECs vs. cerebral cortex ECs in response to beta-catenin stabilization, as determined by RiboTag enrichment.
(A) Scatter plots comparing cross-sample normalized RNA-seq read counts of EC-enriched protein-coding genes from cerebral cortex ECs vs. choroid plexus ECs. Values depicted are the log2 transformation of cross-sample normalized RNA-seq read counts + 1. Colored symbols indicate transcripts with FDR < 0.05 and enrichment >2 fold for the indicated comparisons. RiboTag data are averages of two independent samples. (B) Scatter plots comparing fold-change (beta-catenin stabilized/WT) for EC-enriched protein-coding genes in posterior pituitary and choroid plexus. Colored symbols indicate transcripts with FDR < 0.05 and enrichment >2 fold for the indicated comparison, and are as defined in panel (A) and in Figure 7A.
Figure 8
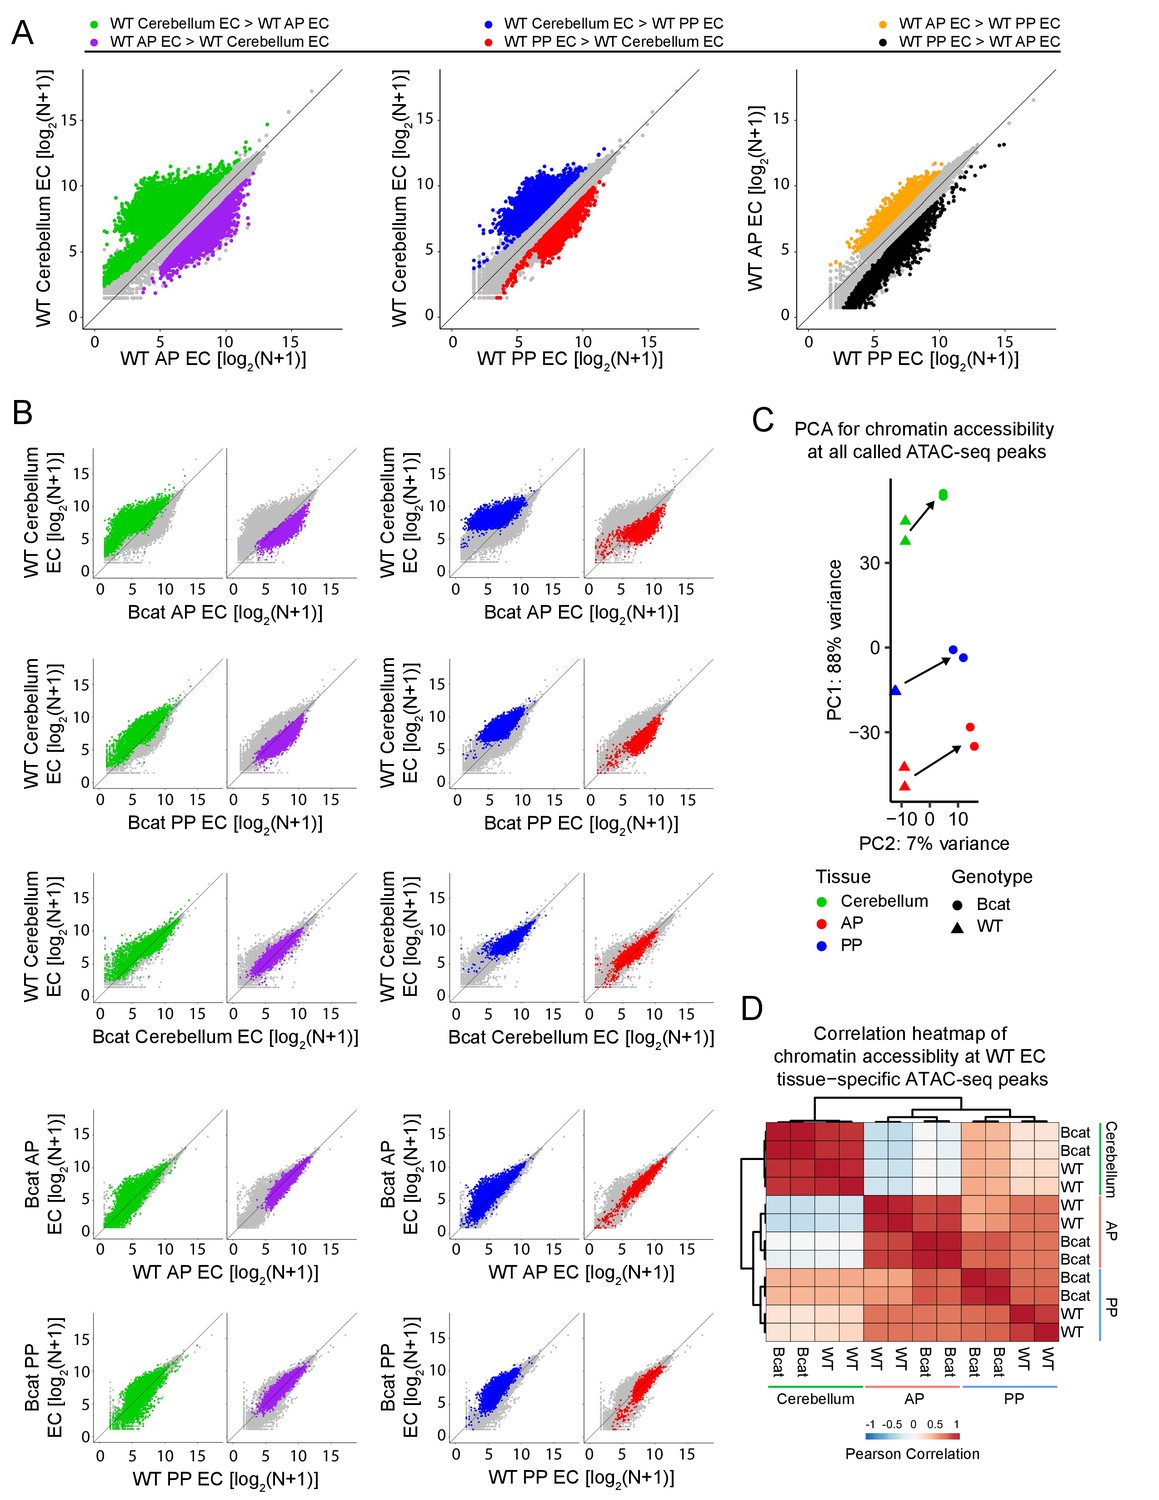
Genome-wide visualization of accessible chromatin differences by EC tissue type in WT vs. beta-catenin stabilized samples.
(A) Scatter plots comparing cross-sample normalized ATAC-seq read counts in ATAC-seq peaks (i.e. peaks above threshold; see Materials and methods) from cerebellum ECs vs. anterior pituitary (AP) ECs, cerebellum ECs vs. posterior pituitary (PP) ECs, and anterior pituitary ECs vs. posterior pituitary ECs. Values depicted are the log2 transformation of cross-sample normalized ATAC-seq read counts + 1. Colored symbols indicate peaks with FDR < 0.05 and differential accessibility >2 fold for the indicated comparisons. (B) Scatter plots of cross-sample normalized ATAC-seq read counts in ATAC-seq peaks for the indicated pairwise comparisons. Colored symbols are as defined in (A). (C) Principal component analysis of chromatin accessibility at all called ATAC-seq peaks from WT and beta-catenin stabilized cerebellum ECs, anterior pituitary ECs, and posterior pituitary ECs. The two symbols for each sample represent biological replicates. Most of the variance is explained by PC1 which separates the samples by tissue of origin. Arrows indicate changes upon beta-catenin stabilization. (D) Heatmap indicating pairwise Pearson correlations for chromatin accessibility at WT and beta-catenin-stabilized tissue-specific EC ATAC-seq peaks. Data are shown for the individual replicates. AP, anterior pituitary; PP, posterior pituitary.
Figure 9
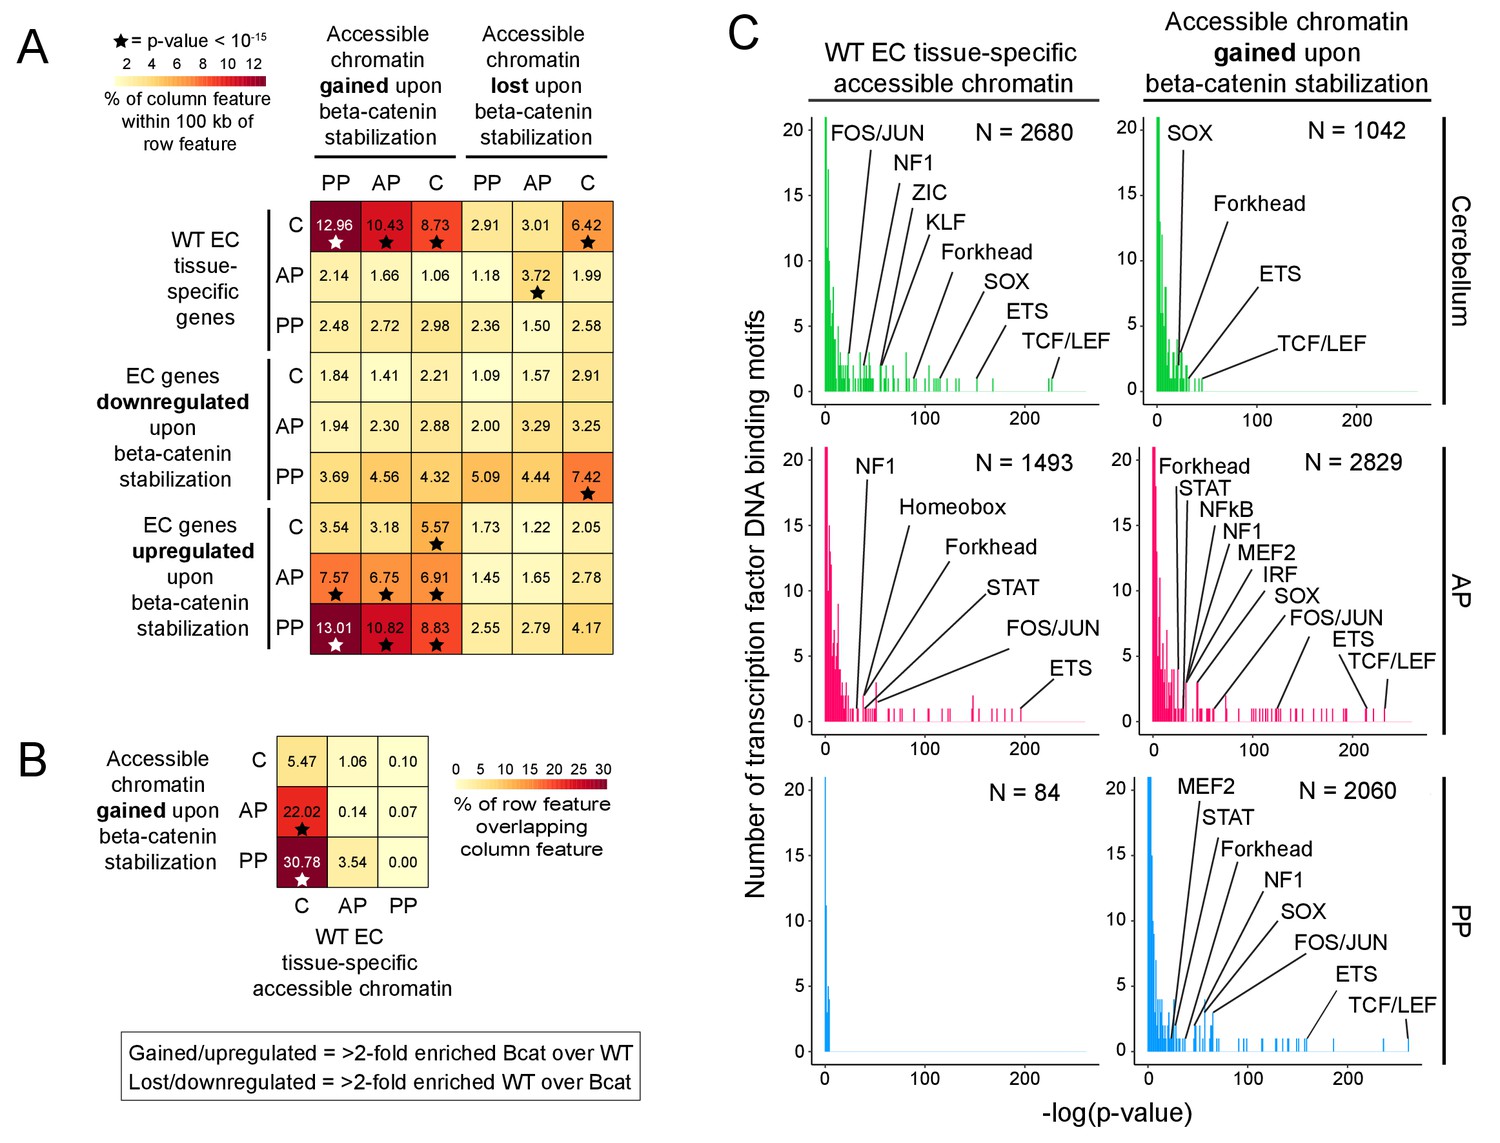
Regions of accessible chromatin that are induced by beta-catenin stabilization correlate with changes in EC gene expression and are highly enriched for TCF/LEF motifs.
(A) Heatmap quantifying the number of accessible chromatin regions (ATAC-seq peaks) in FACS-purified ECs that were either gained or lost (i.e. ATAC-seq read counts changed >2 fold) upon beta-catenin stabilization and that are within 100 kb of (1) tissue-specific EC genes (as determined by comparisons between WT ECs) or (2) genes for which expression in ECs was either gained or lost upon beta-catenin stabilization. Statistical significance was calculated with a binomial test. (B) Heatmap indicating percentage overlap between accessible chromatin (ATAC-seq peaks) gained upon beta-catenin stabilization and accessible chromatin that is unique to each EC type (as determined by comparisons between WT ECs). There is significant overlap between accessible chromatin gained upon beta-catenin stabilization – especially in the two pituitary EC samples - and accessible chromatin unique to WT cerebellum ECs. Statistical significance calculated by Fisher’s exact test. In (A) and (B), stars indicate statistical significance at p-value-<10−15. (C) Transcription factor motif enrichment in accessible chromatin in WT vs. beta-catenin stabilized ECs. Histograms of the -log10(p-value) for 414 transcription factor DNA binding motifs that were tested for enrichment in EC tissue-specific accessible chromatin, based on comparisons of WT ECs (left column) and beta-catenin stabilized ECs (right column). The number of ATAC-seq peaks analyzed (i.e., peaks specific to EC tissue type and genotype) is indicated in each panel. The x-axis bin size is 1. The y-axis has been truncated. The vast majority of tested motifs have high p-values (i.e., low statistical significance) and thus are found in the first few bins. The statistically most significant TF motif families are labeled. Most TF families are represented by multiple closely related motifs, and only the motif with the lowest p-value for each family is labeled. C, cerebellum. AP, anterior pituitary. PP, posterior pituitary.
Figure 10
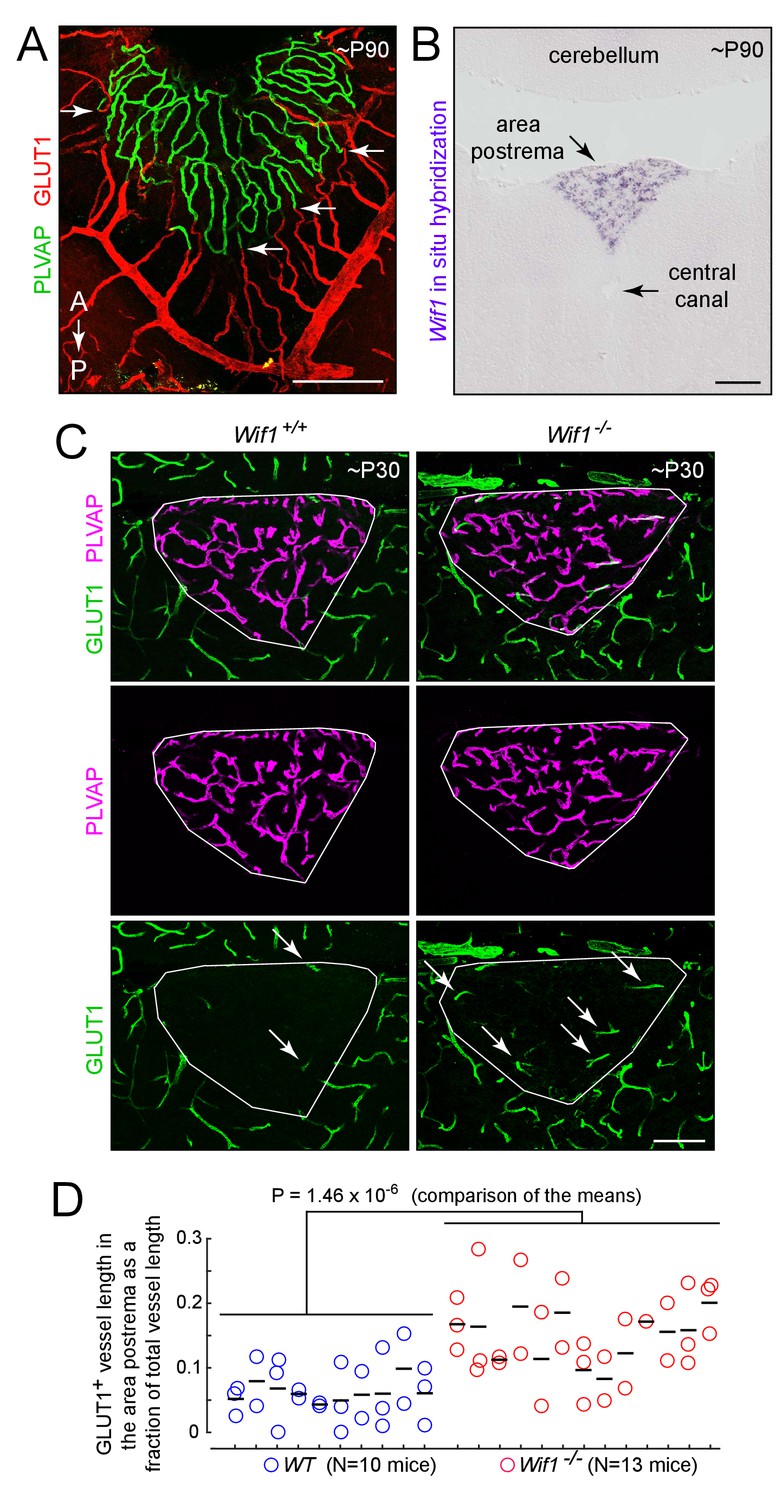
Loss of WIF1 increases the probability that ECs in the area postrema will assume a BBB-like state.
(A) View of the dorsal surface of the area postrema showing a sharp transition at the junction between GLUT1-/PLVAP+ ECs in the area postrema (center) and GLUT1+/PLVAP- ECs in the surrounding CNS tissue. Arrows mark transition points for four capillaries. A, anterior. P, posterior. (B) In situ hybridization with a Wif1 probe to a coronal section through the brainstem (lower 60% of the image) and cerebellum (upper 20% of the image) at the level of the area postrema. Wif1 transcripts (purple signal) are detected only in the area postrema. (C) Representative coronal sections through the area postrema in Wif1+/+(i.e. WT) vs. Wif1-/-littermates showing increased numbers of GLUT1+/PLVAP- ECs in the Wif1-/-sample (arrows). The area postrema is demarcated by the smallest convex polygon that fully encompasses the GLUT1-/PLVAP+ vasculature. (D) Quantification of GLUT1+ blood vessel length as a fraction of the length of all vessels in the area postrema from WT (N = 10 mice) vs Wif1-/-(N = 13 mice) littermates at P30. Vessels were manually traced from images like the ones shown in (C) and the result for each section is shown by a circle. Each vertical set of 1–3 circles represents the data from one mouse. Bars show mean ±S.D. The p-value was calculated from the mean for each mouse (black bars). Scale bars for (A) and (B), 200 μm. Scale bar for (C), 100 μm.
Tables
Table 1
Abbreviations.
https://doi.org/10.7554/eLife.43257.002| A | anterior |
| AP | area postrema or anterior pituitary |
| ATAC | assay for transposase-accessible chromatin |
| BBB | blood-brain barrier |
| BRB | blood-retina barrier |
| CB | ciliary body |
| CC | choriocapillaris |
| CNS | central nervous system |
| CP | choroid plexus |
| CSF | cerebrospinal fluid |
| CVO | circumventricular organ |
| EC | vascular endothelial cell |
| FACS | fluorescent-activated cell sorting |
| IP | intraperitoneal |
| ME | median eminence |
| PLVAP | plasmalemma vesicle associated protein |
| PP | posterior pituitary |
| P | posterior |
| RPE | retinal pigment epithelium |
| SFO | subfornical organ |
| TEM | transmission electron microscopy |
| VOLT | vascular organ of the lamina terminalis |
| WIF1 | Wnt inhibitory factor-1 |
| WT | wild type |
| 4HT | 4-hydroxytamoxifen |
Key resources table
| Reagent type (species) or resource | Designation | Source or reference | Identifiers | Additional information |
|---|---|---|---|---|
| Genetic reagent (Mus musculus) | Ctnnb1flex3 | Harada et al., 1999 | ||
| Genetic reagent (M. musculus) | Ndp- | The Jackson Laboratory | Stock No: 012287; RRID:IMSR_JAX:012287 | |
| Genetic reagent (M. musculus) | Fz4- | The Jackson Laboratory | Stock No: 012823; RRID:IMSR_JAX:012823 | |
| Genetic reagent (M. musculus) | Fz4CKO | The Jackson Laboratory | Stock No: 011078; RRID:IMSR_JAX:011078 | |
| Genetic reagent (M. musculus) | Tie2-Cre | The Jackson Laboratory | Stock No: 008863; RRID:IMSR_JAX:008863 | |
| Genetic reagent (M. musculus) | Tie2-GFP | The Jackson Laboratory | Stock No: 003658; RRID:IMSR_JAX:003658 | |
| Genetic reagent (M. musculus) | Pdgfb-CreER | Claxton et al., 2008 | ||
| Genetic reagent (M. musculus) | Wif1- | Kansara et al., 2009 | ||
| Genetic reagent (M. musculus) | Sostdc1- | Ahn et al., 2010 | ||
| Genetic reagent (M. musculus) | Rpl22ribotag | The Jackson Laboratory | Stock No: 029977; RRID:IMSR_JAX:029977 | |
| Genetic reagent (M. musculus) | R26-LSL-tdTomato-2A-H2B-GFP | The Jackson Laboratory | Stock No: 030867; RRID:IMSR_JAX:030867 | |
| Antibody | anti-GLUT1 (rabbit polyclonal) | Thermo Fisher Scientific | Cat no: RB-9052-P1; RRID:AB_177895 | |
| Antibody | anti-mouse PLVAP/MECA-32 (rat monoclonal) | BD Biosciences | Cat no: 553849; RRID:AB_395086 | |
| Antibody | anti-CLDN5 Alexa Fluor 488 conjugate (mouse monoclonal) | Thermo Fisher Scientific | Cat no: 352588; RRID:AB_2532189 | |
| Antibody | anti-GFP Alexa Fluor 488 conjugate (rabbit polyclonal) | Thermo Fisher Scientific | Cat no: A21311; RRID:AB_221477 | |
| Antibody | anti-LEF1 (rabbit monoclonal) | Cell Signaling Technologies | Cat no: C12A5; RRID:AB_823558 | |
| Antibody | anti-Occludin (rabbit polyclonal) | Invitrogen | Cat no: 406100; RRID:AB_2533473 | |
| Antibody | anti-ZO1 (rabbit polyclonal) | Invitrogen | Cat no: 40–2200; RRID:AB_2533456 | |
| Antibody | anti-MDR1 (rabbit monoclonal) | Cell Signaling Technologies | Cat no: 13978S | |
| Antibody | anti-Vimentin (chicken polyclonal) | EMD Millipore | Cat no: AB5733; RRID:AB_11212377 | |
| Peptide, recombinant protein | Tn5 transposase | Illumina | Cat no: FC-121–1030 | |
| Commercial assay or kit | Worthington Papain Dissociation Kit | Worthington Biochemical Corporation | Cat no: LK003160 | |
| Chemical compound, drug | 4-hydroxytamoxifen | Sigma-Aldrich | Cat no: H7904 | |
| Software, algorithm | Salmon | Patro et al., 2017 | ||
| Software, algorithm | Kallisto | Bray et al., 2016 | RRID:SCR_016582 | |
| Software, algorithm | deepTools | Ramírez et al., 2016 | RRID:SCR_016366 | |
| Software, algorithm | tximport | Soneson et al., 2016 | RRID:SCR_016752 | |
| Software, algorithm | EBSeq | Leng et al., 2015 | RRID:SCR_003526 | |
| software, algorithm | MACS2 | Zhang et al., 2008 | ||
| Software, algorithm | DiffBind | Ross-Innes et al., 2012 | RRID:SCR_012918 | |
| Software, algorithm | Bedtools | Quinlan and Hall, 2010 | RRID:SCR_006646 | |
| Other | Texas Red streptavidin | Vector Laboratories | Cat no: SA-5006; RRID:AB_2336754 | |
| Other | Sulfo-NHS-biotin | Thermo Fisher Scientific | Cat no: 21217 |
Additional files
-
Supplementary file 1
Gene expression data.
(A-B) Transcript abundances in raw counts (A) and TPMs (B). (C-F) Genes differentially enriched in WT cerebellum ECs (C), either anterior or posterior pituitary ECs (D), WT anterior pituitary ECs (E), or WT posterior pituitary ECs (F). (G-H) Genes upregulated by beta-catenin stabilization in either anterior (G) or posterior (H) pituitary ECs that overlap the genes in (C).
- https://doi.org/10.7554/eLife.43257.027
-
Supplementary file 2
Ribotag gene expression data.
(A-B) Transcript abundances in raw counts (A) and TPMs (B). (C-D) Genes differentially enriched in WT cortical ECs (C) or WT choroid plexus ECs (D). (E) Genes upregulated by beta-catenin stabilization in choroid plexus ECs that overlap the genes in (C).
- https://doi.org/10.7554/eLife.43257.028
-
Supplementary file 3
Accessible chromatin peaks in each EC subtype.
(A-F) ATAC-seq peaks for each EC subtype called using the full range of ATAC-seq fragment lengths. (G-I) Differential ATAC-seq peaks for WT cerebellum ECs (G), WT anterior pituitary ECs (H), and WT posterior pituitary ECs (I) in either pairwise comparison. (J-L) Unique differential ATAC-seq peaks for WT cerebellum ECs (J), WT anterior pituitary ECs (K), and WT posterior pituitary ECs (L) in either pairwise comparison. (M-O) ATAC-seq peaks gained upon beta-catenin stabilization in WT cerebellum ECs (M), WT anterior pituitary ECs (N), and WT posterior pituitary ECs (O). (P-R) ATAC-seq peaks lost upon beta-catenin stabilization in WT cerebellum ECs (P), WT anterior pituitary ECs (Q), and WT posterior pituitary ECs (R). (S-T) ATAC-peaks gained upon beta-catenin stabilization in either anterior (S) or posterior (T) pituitary ECs that overlap the peaks in (J).
- https://doi.org/10.7554/eLife.43257.029
-
Transparent reporting form
- https://doi.org/10.7554/eLife.43257.030
Download links
A two-part list of links to download the article, or parts of the article, in various formats.
Downloads (link to download the article as PDF)
Open citations (links to open the citations from this article in various online reference manager services)
Cite this article (links to download the citations from this article in formats compatible with various reference manager tools)
Beta-catenin signaling regulates barrier-specific gene expression in circumventricular organ and ocular vasculatures
eLife 8:e43257.
https://doi.org/10.7554/eLife.43257


