Arabidopsis RCD1 coordinates chloroplast and mitochondrial functions through interaction with ANAC transcription factors
- University of Helsinki, Finland
- Russian Academy of Sciences, Russia
- University of Jyväskylä, Finland
- University of Turku, Finland
- Max-Planck Institute for Molecular Plant Physiology, Germany
- Center of Plant System Biology and Biotechnology, Bulgaria
- Ghent University, Belgium
- VIB Center for Plant Systems Biology, Belgium
- University of Eastern Finland, Finland
- University of Tartu, Estonia
Figures
Figure 1 with 5 supplements
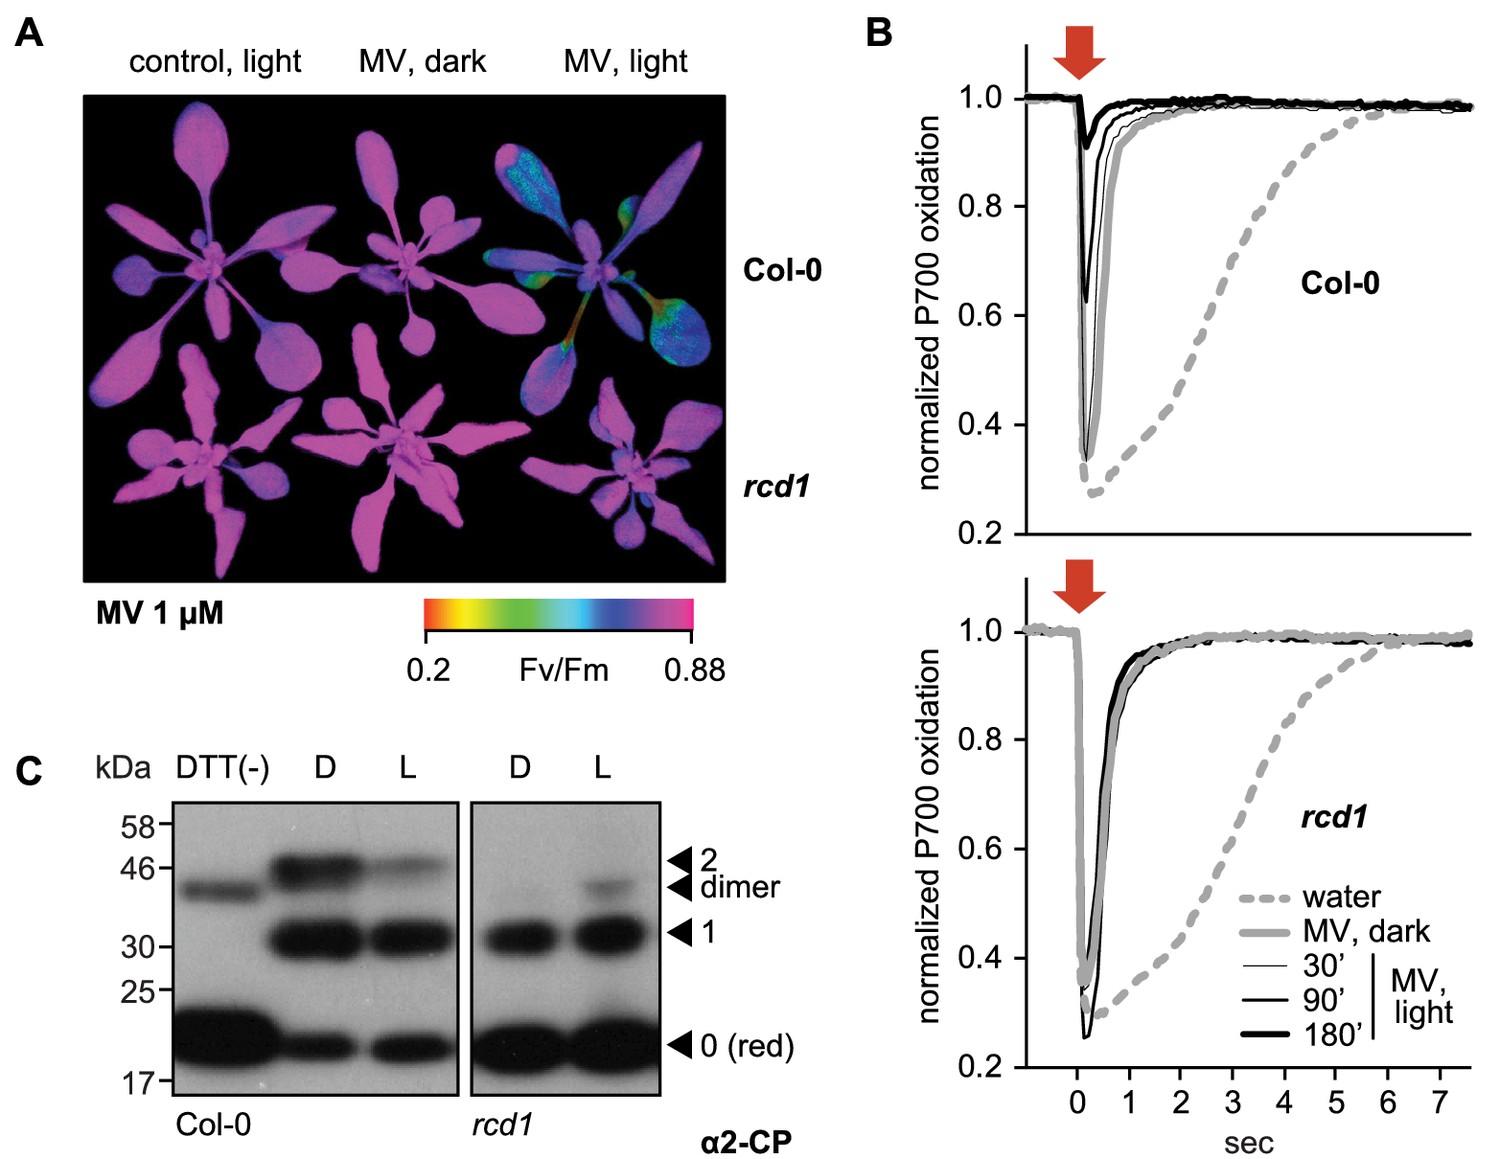
RCD1 controls tolerance of photosynthetic apparatus to ROS.
(A) MV treatment results in PSII inhibition under light, which is suppressed in the rcd1 mutant. PSII photochemical yield (Fv/Fm) was measured in rosettes pre-treated overnight in darkness with 1 μM MV and then exposed to 3 hr of continuous light (80 µmol m−2 s−1). Representative false-color image of Fv/Fm is shown. (B) Access of MV to electron-acceptor side of PSI is unaltered in rcd1. Treatment with MV led to similar changes in kinetics of PSI oxidation in Col-0 and rcd1. Oxidation of PSI reaction center (P700) was measured using DUAL-PAM. Leaves were first adapted to far-red light that is more efficiently used by PSI than PSII. In these conditions PSI is producing electrons at a faster rate than they are supplied by PSII, thus P700 is oxidized. Then a flash of orange light was provided that is efficiently absorbed by PSII (orange arrow). Electrons generated by PSII transiently reduced PSI, after which the kinetics of PSI re-oxidation was followed. Note the progressive decrease in the effect of the orange flash occurring in Col-0 at later time points, which suggests deterioration in PSII function. This was not observed in rcd1. Three leaves from three individual plants were used for each measurement. The experiment was repeated three times with similar results. (C) Redox state of the chloroplast enzyme 2-Cys peroxiredoxin (2-CP) assessed by thiol bond-specific labeling in Col-0 (left) and rcd1 (right). Total protein was isolated from leaves incubated in darkness (D), or under light (L). Free sulfhydryls were blocked with N-ethylmaleimide, then in vivo thiol bridges were reduced with DTT, and finally the newly exposed sulfhydryls were labeled with methoxypolyethylene glycol maleimide of molecular weight 5 kDa. The labeled protein extracts were separated by SDS-PAGE and immunoblotted with α2-CP antibody. DTT (-) control contained predominantly unlabeled form. Unlabeled reduced (red), singly and doubly labeled oxidized forms and the putative dimer were annotated as in Nikkanen et al. (2016). Apparent molecular weight increment after the labeling of one thiol bond appears on SDS-PAGE higher than 10 kDa because of steric hindrance exerted on branched polymers during gel separation (van Leeuwen et al., 2017). The experiment was repeated three times with similar results.
-
Figure 1—source data 1
Source data and statistics.
- https://doi.org/10.7554/eLife.43284.009
Figure 1—figure supplement 1
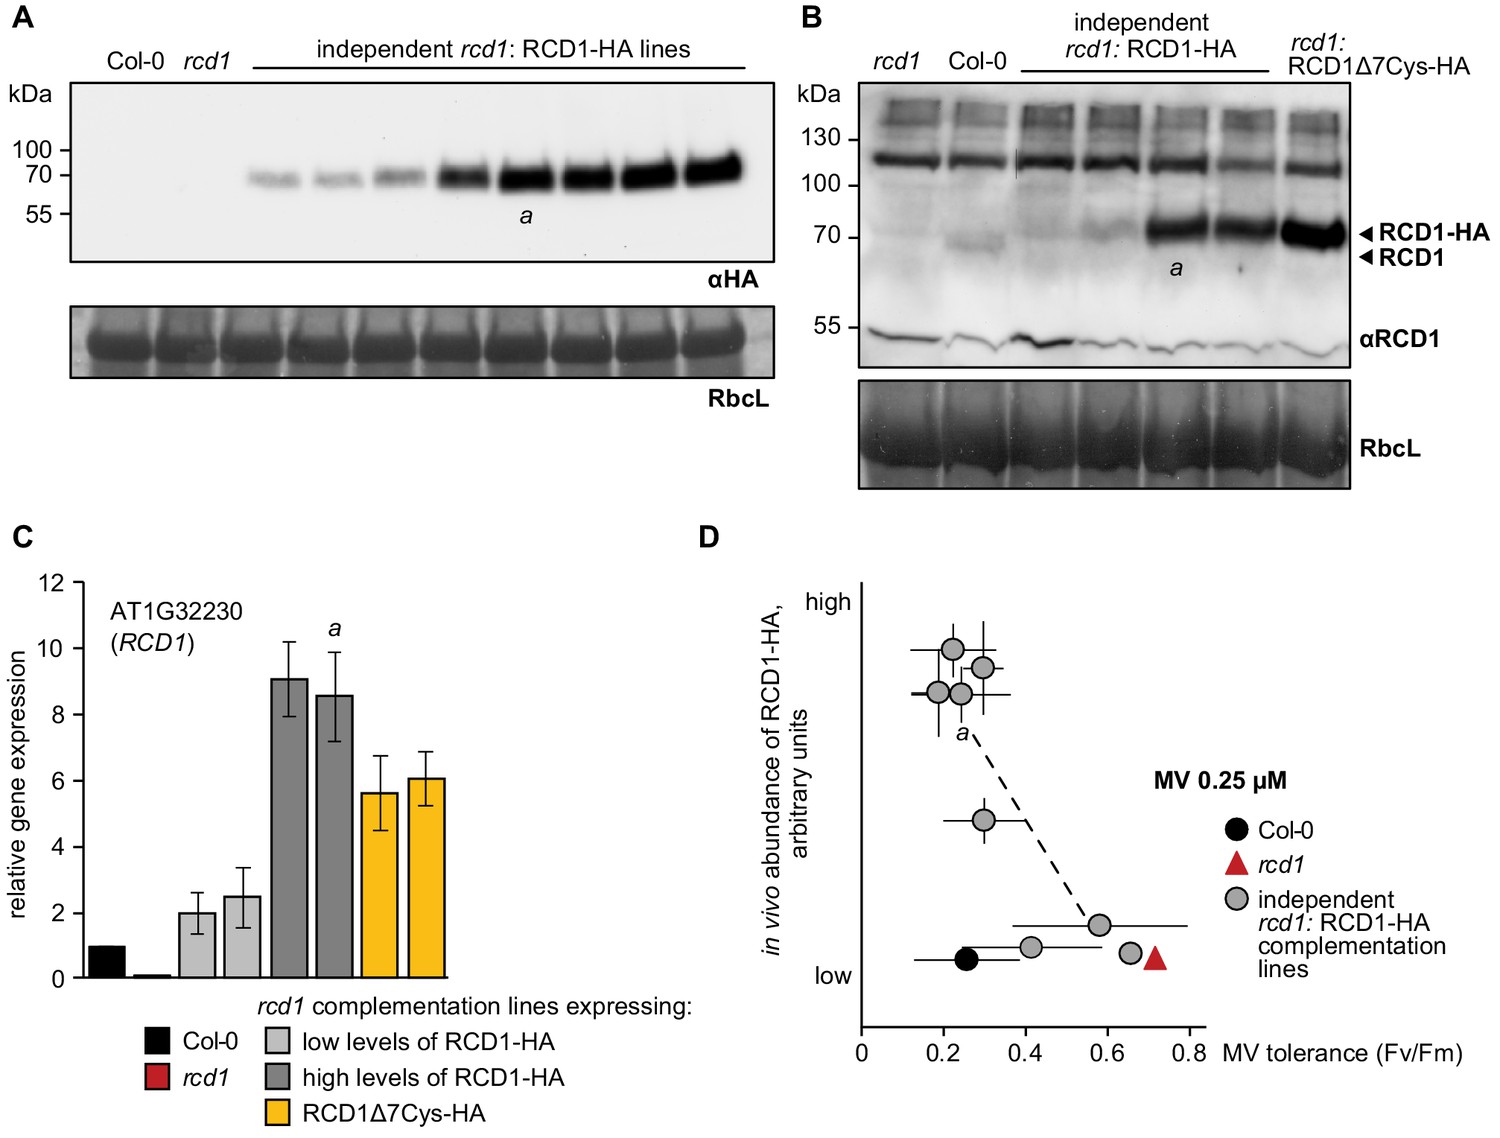
Inverse correlation of RCD1 abundance with tolerance to chloroplastic ROS.
(A) Several independent rcd1 complementation lines were generated in which HA-tagged RCD1 was reintroduced under the RCD1 native promoter. Immunoblotting of protein extracts from these lines with αHA antibody revealed different levels of RCD1-HA under standard light-adapted growth conditions. This was presumably due to different transgene insertion sites in the genome. Line ‘a’ was described in Jaspers et al. (2009). Rubisco large subunit (RbcL) detected by amido black staining is shown as a control for equal protein loading. (B) An antibody was raised against the full-size RCD1 protein. This allowed comparing abundance of RCD1 in independent rcd1: RCD1-HA complementation lines described in the panel (A) versus Col-0 (two rcd1: RCD1-HA lines with the lowest and two with the higher levels of RCD1-HA are shown). In the complementation lines the RCD1 signal was detected at higher molecular weight due to the triple HA tag. The rcd1: RCD1Δ7Cys-HA line will be addressed below. (C) Expression of RCD1 gene was measured by real time quantitative PCR in Col-0 and in four independent complementation lines described in the panel (A), two with the lowest and two with the higher levels of RCD1-HA. Results in panels (B) and (C) demonstrated that the levels of RCD1 protein and mRNA were about 10 times higher in the high-expressing complementation lines than in Col-0. Relative expression was calculated from three biological repeats and the data are scaled relative to Col-0. Source data are presented in Figure 6—source data 1. (D) Sensitivity of PSII to chloroplastic ROS in the rcd1 complementation lines was assessed using time-resolved analysis described in Figure 1—figure supplement 2. For that, leaf discs were pre-treated with 0.25 μM MV overnight in the darkness. PSII photochemical yield after two 1 hr light cycles was plotted against abundance of RCD1-HA in the individual lines as determined in panel (A). Line ‘a’ was described in Jaspers et al. (2009). Five individual plants were taken per each line. The experiment was repeated three times with similar results. Source data and statistics are presented in Figure 1—source data 1.
Figure 1—figure supplement 2
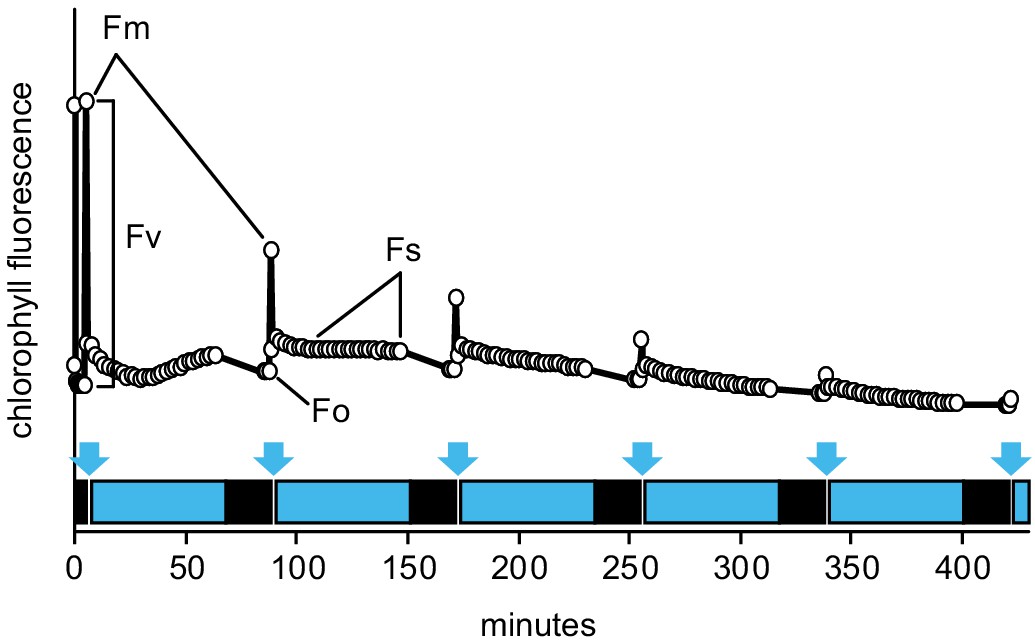
The Imaging PAM protocol developed to monitor kinetics of PSII inhibition by repetitive 1 hr light cycles.
Plants dark-adapted for at least 20 min were first exposed to a saturating light pulse to measure Fm. Then the blue actinic light (450 nm, 80 µmol m−2 s−1) was turned on for 1 hr, over which time chlorophyll fluorescence under light (Fs) was followed by measuring flashes given once in 2 min. Then the actinic light was turned off to allow for 20 min dark adaptation, after which Fo and Fm were measured. Following the Fm measurement, the next light cycle was initiated. Saturating light pulses to measure Fm are depicted by blue arrows, actinic light periods by blue boxes, and dark adaptation by black boxes. PSII photochemical yield was calculated as Fv/Fm = (Fm-Fo)/Fm. To study different levels of MV tolerance, different concentrations of MV were employed throughout the study, as indicated in the figures or figure legends.
Figure 1—figure supplement 3
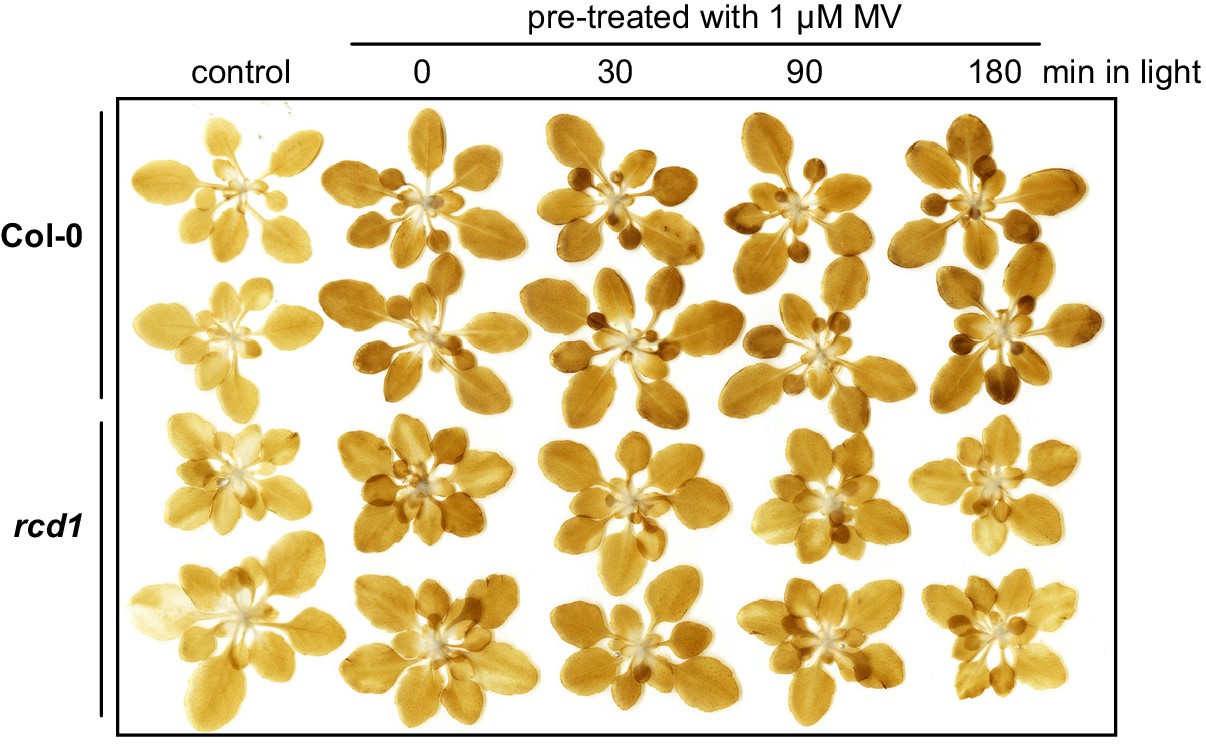
Production rate of hydrogen peroxide in Col-0 and rcd1 during illumination of MV-pre-treated rosettes.
Col-0 and rcd1 rosettes were pre-treated with 1 μM MV overnight in the darkness. Then they were exposed to light for indicated time. After this, the rosettes were infiltrated with DAB staining solution and exposed to 20 min of light (180 µmol m−2 s−1). Similar initial increase in H2O2 production rate was observed in MV-pre-treated dark-adapted Col-0 and rcd1. During longer incubation under light, the production rate of H2O2 further increased in Col-0, but decreased in rcd1. The experiment was performed three times with similar results.
Figure 1—figure supplement 4
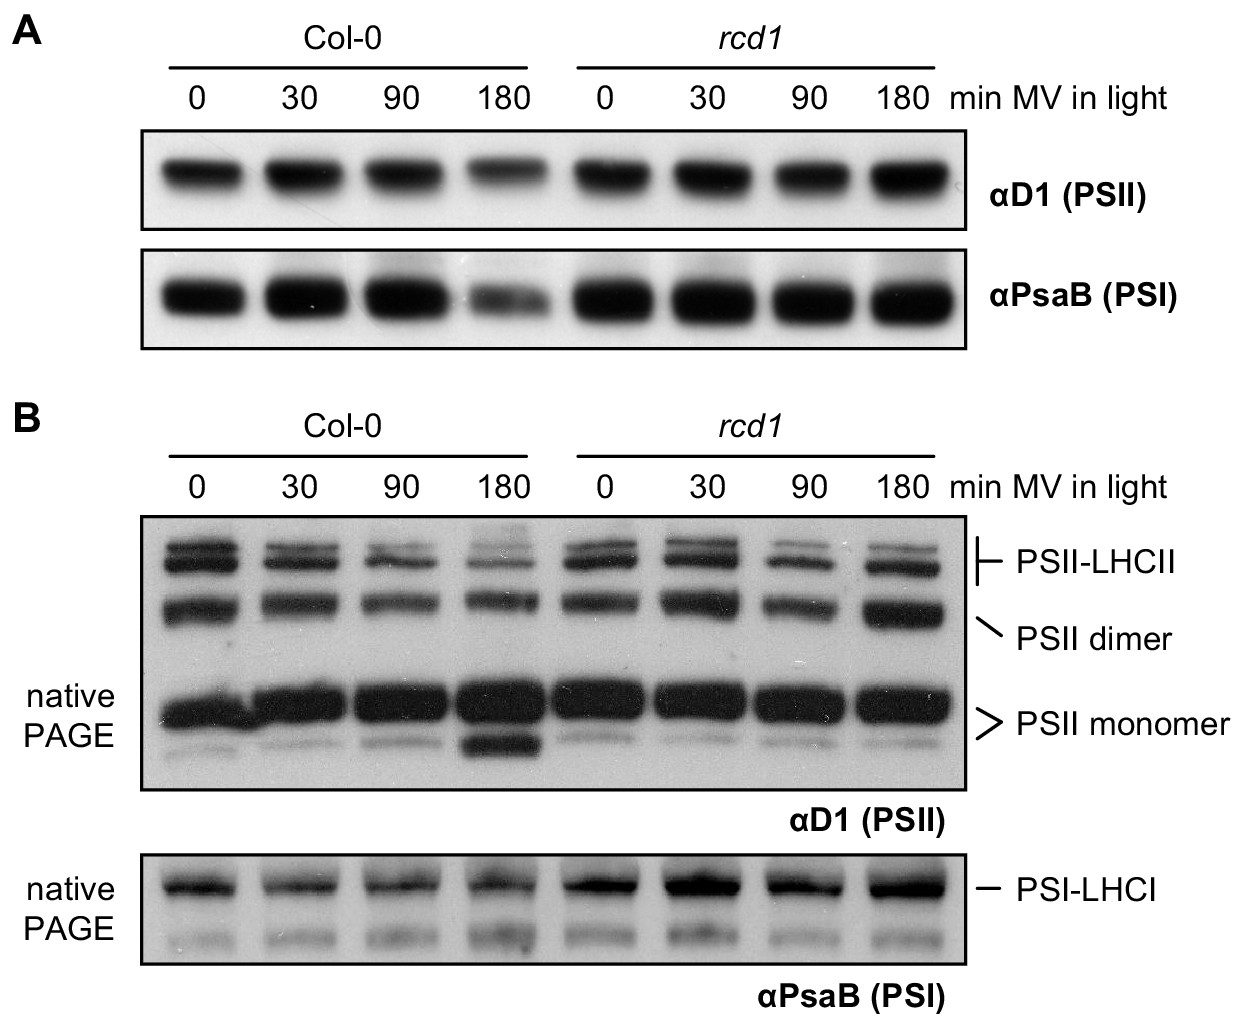
Altered resistance of rcd1 photosynthetic apparatus to chloroplastic ROS.
(A) Protein extracts from Col-0 and rcd1 leaves pre-treated with 1 μM MV and exposed to light for indicated time, were separated by SDS-PAGE followed by immunoblotting with antibodies against the PSII subunit D1 and the PSI subunit PsaB. No significant differences in stoichiometry of photosystems were detected. (B) Thylakoid protein complexes isolated from leaves treated as above were separated by native PAGE. Immunoblotting with αD1 antibody revealed PSII species of diverse molecular weights that were annotated as in Järvi et al. (2011). The largest of the complexes corresponds to PSII associated with its light-harvesting antennae complex (LHCII) while the smallest are the PSII monomers (top panel). Incubation under light in presence of MV led to destabilization of PSII-LHCII complexes in Col-0, but not in rcd1. At the same time, immunoblotting with αPsaB antibody showed no changes in PSI complex (bottom panel).
Figure 1—figure supplement 5
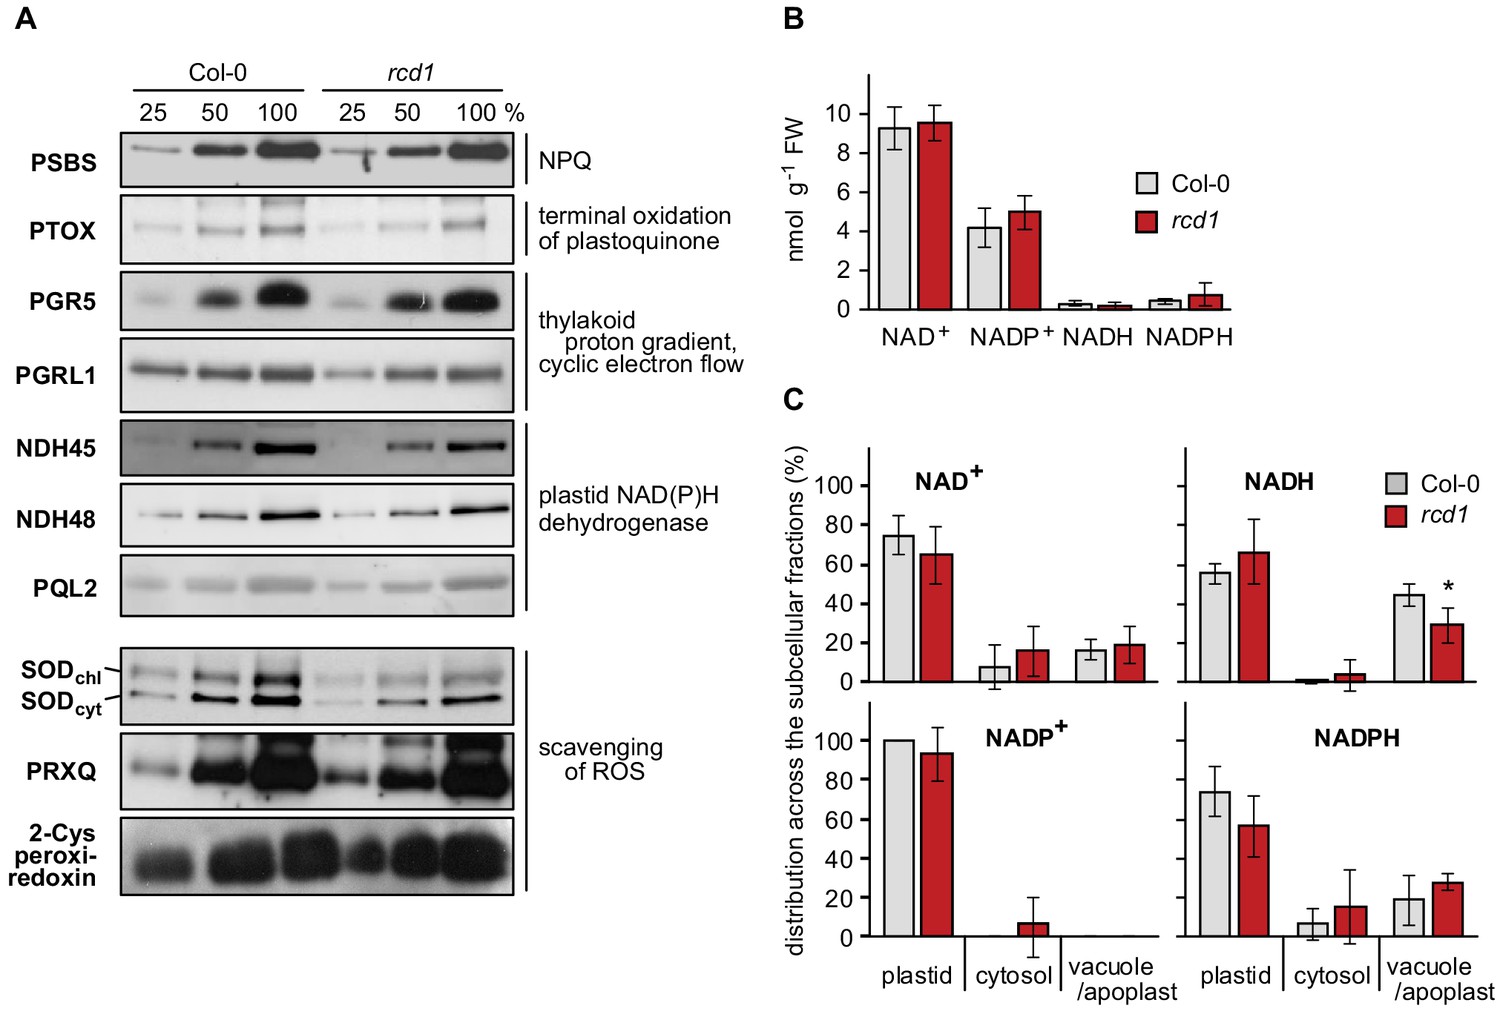
Components of photosynthetic electron transfer and chloroplast ROS scavenging; abundance and distribution of NAD+/NADH and NADP+/NADPH redox couples in Col-0 and rcd1.
(A) Abundance of proteins related to photosynthetic electron transfer or chloroplast ROS scavenging was assessed by separating Col-0 and rcd1 protein extracts (in dilution series) by SDS-PAGE and immunoblotting with specific antibodies, as indicated. 100% corresponds to 20 μg of thylakoid protein. No difference was observed between Col-0 and rcd1. (B) Abundance of nucleotides NAD+, NADP+, NADH and NADPH in total leaf extracts isolated from Col-0 and rcd1 (mean ±SE). No difference was observed between the genotypes. Source data and statistics are presented in Figure 1—source data 1. (C) Distribution of NAD+/NADH and NADP+/NADPH redox couples in various cellular compartments of Col-0 and rcd1 was assessed by non-aqueous fractionation metabolomics (mean ±SE, an asterisk indicates the value significantly different from that in the corresponding wild type, *P value < 0.05, Student’s t-test). In brief, the light-adapted rosettes were harvested in the middle of the light period, freeze-dried, homogenated and separated on non-aqueous density gradient, which allowed for enrichment in specific membrane compartments. No major difference was detected between Col-0 and rcd1. Note that the method does not allow for separation of apoplastic and vacuolar compartments or reliable definition of the mitochondria (Fettke et al., 2005). Source data and statistics are presented in Figure 1—source data 1.
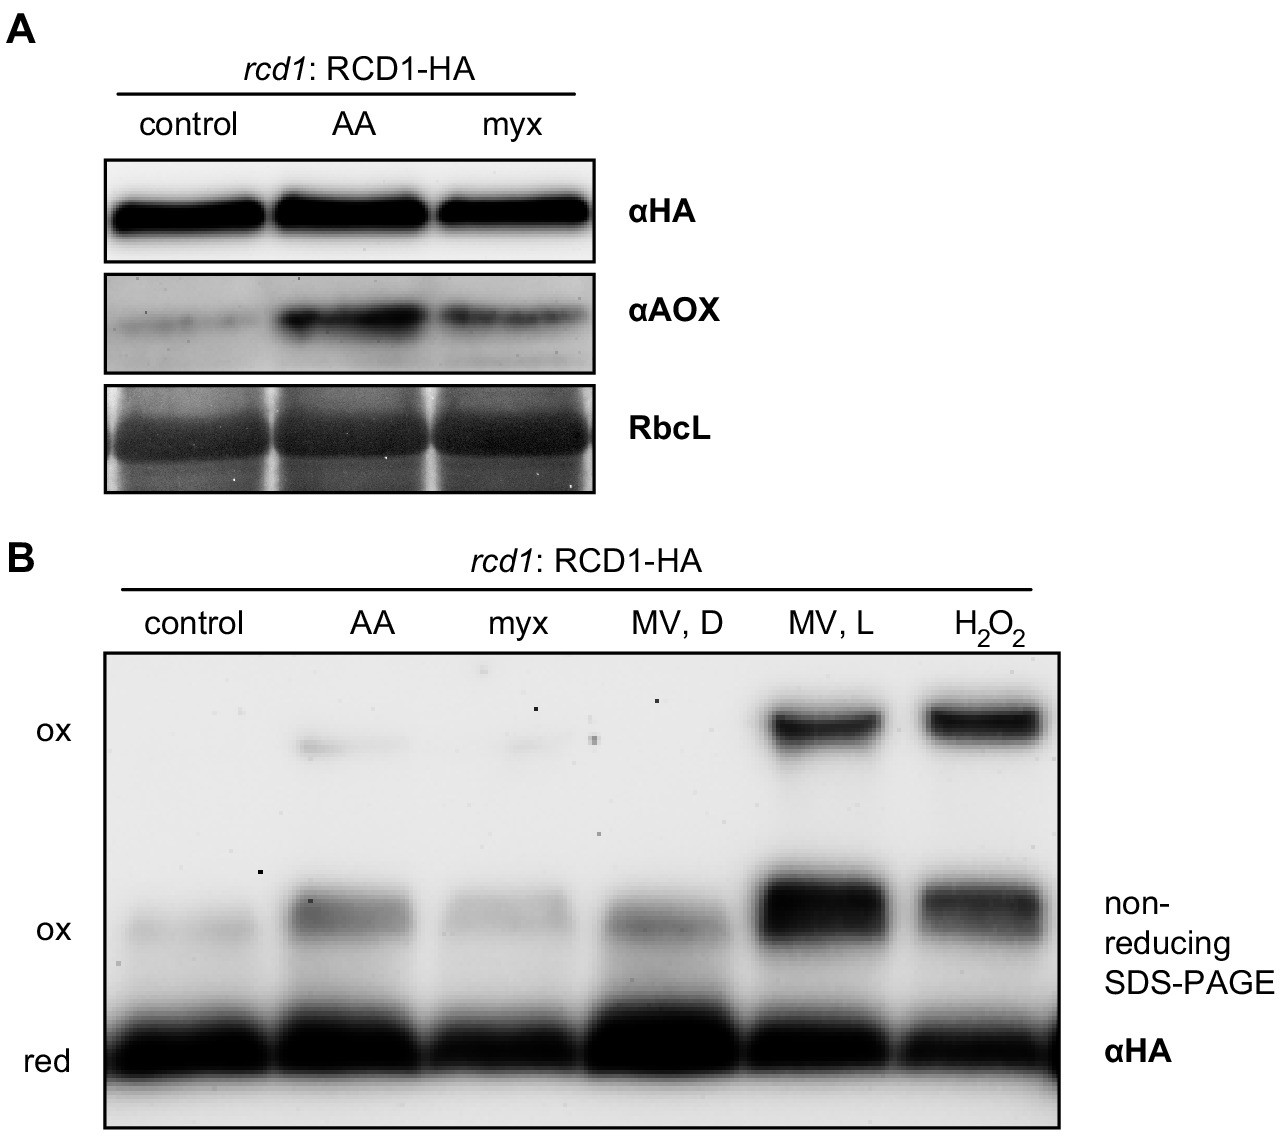
Figure 2 with 1 supplement
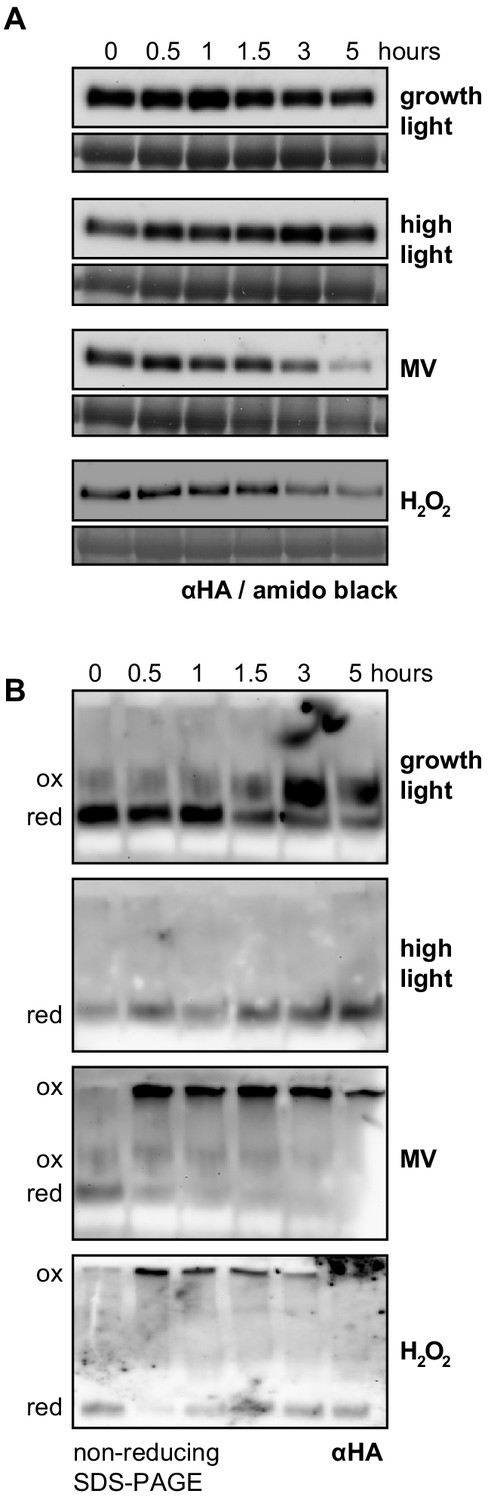
RCD1 protein is sensitive to chloroplastic ROS.
(A) The rcd1: RCD1-HA complementation line was used to assess RCD1-HA abundance. It gradually decreased in response to chloroplastic ROS. Leaf discs from plants expressing HA-tagged RCD1 were treated with 5 hr growth light (150 µmol m−2 s−1), high light (1300 µmol m−2 s−1), MV (1 µM) in light, or H2O2 (100 mM). The levels of RCD1-HA were monitored by immunoblotting with αHA at indicated time points. Rubisco large subunit (RbcL) detected by amido black staining is shown as a control for equal protein loading. The ‘0’ time point of the MV time course represents dark-adapted leaf discs pre-treated with MV overnight. The experiment was performed four times with similar results. (B) Chloroplastic ROS caused oligomerization of RCD1-HA. Total protein extracts from the plants treated as in panel (A) were separated by non-reducing PAGE and immunoblotted with αHA antibody. Reduced (red) and oxidized (ox) forms of the protein are labeled. To ascertain that all HA-tagged protein including that forming high-molecular-weight aggregates has been detected by immunoblotting, the transfer to a membrane was performed using the entire SDS-PAGE gel including the stacking gel and the well pockets. The experiment was performed four times with similar results.
-
Figure 2—source data 1
Source data and statistics.
- https://doi.org/10.7554/eLife.43284.012
Figure 2—figure supplement 1

Characterization of the rcd1: RCD1Δ7Cys-HA lines.
(A) Domain structure of RCD1 with the positions of cysteine residues shown with circles. Interdomain cysteines mutated in the RCD1Δ7Cys-HA lines (RCD1Δ7Cys = RCD1 C14A-C37A-C50A-C175A-C179A-C212A-C243A) are shown in yellow. (B) The rcd1 complementation line expressing the RCD1Δ7Cys-HA variant under the control of the native RCD1 promoter was treated with high light, MV or H2O2 as described in Figure 2. In this line accumulation of high-molecular-weight RCD1 aggregates observed in RCD1-HA line (Figure 2B) was largely abolished. Reduced (red) and oxidized (ox) forms of the protein are labeled. To ascertain that all HA-tagged protein including that forming high-molecular-weight aggregates has been detected by immunoblotting, the transfer to a membrane was performed using the entire SDS-PAGE gel including the stacking gel and the well pockets. The experiment was performed three times with similar results. (C) Independent single-insertion homozygous rcd1 complementation lines expressing RCD1Δ7Cys-HA were compared to those expressing RCD1-HA as described in Figure 1—figure supplement 1D. In all the tested lines, RCD1Δ7Cys-HA accumulated to higher amounts than the wild-type RCD1-HA as revealed by immunoblotting with αHA antibody. MV tolerance of the RCD1Δ7Cys-HA lines was not different from that of the RCD1-HA lines or Col-0. Source data and statistics are presented in Figure 2—source data 1. (D) Expression of RCD1-regulated genes was measured by real time quantitative PCR in Col-0, rcd1, two rcd1: RCD1-HA lines expressing high levels of RCD1-HA and two lines expressing RCD1Δ7Cys-HA. No difference in expression of the selected RCD1-regulated genes AOX1a (AT3G22370), UPOX (AT2G21640), or the stress-induced gene ZAT12 (AT5G59820) was detected in the rcd1: RCD1Δ7Cys-HA line as compared to rcd1: RCD1-HA or Col-0. For MV treatment detached rosettes were soaked in 1 μM MV overnight in the darkness and then exposed to 1 hr of white luminescent light of 220–250 µmol m−2 s−1. Note that inactivation of RCD1 prevented induction of a general stress marker gene ZAT12 in response to MV. Five rosettes were pooled together for each sample. The experiment was repeated twice with similar results. Source data and statistics are presented in Figure 2—source data 1.
Figure 3
Altered energy metabolism of rcd1.
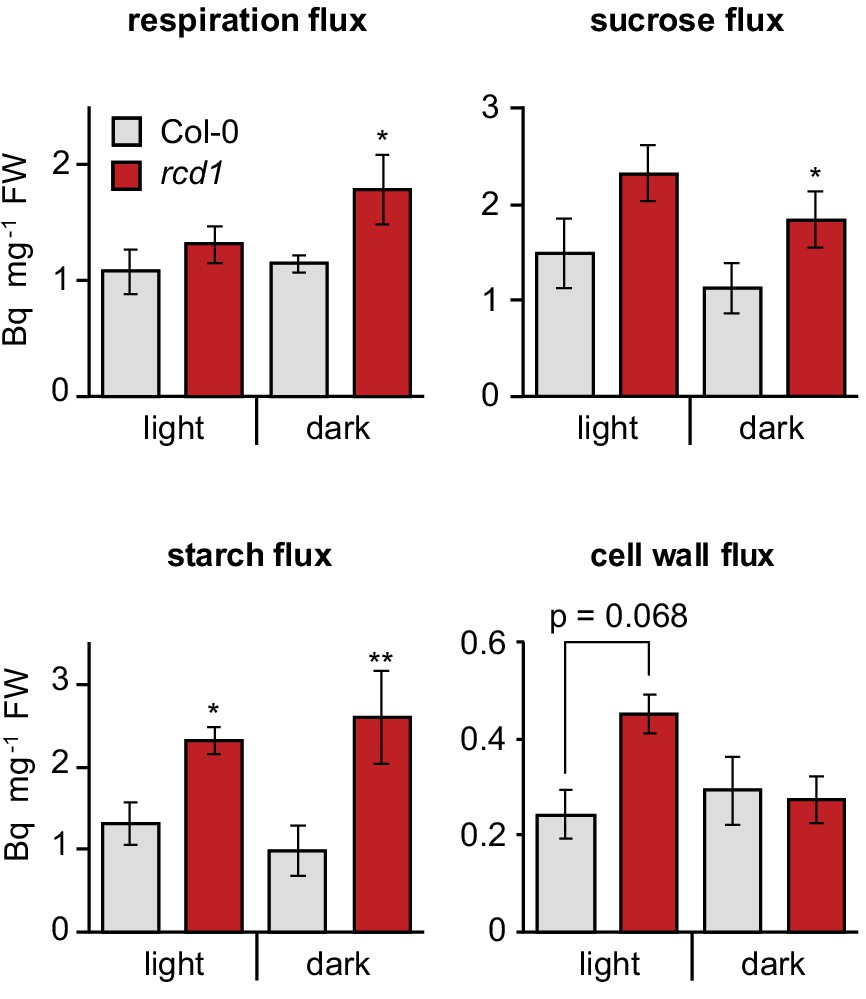
Deduced metabolic fluxes in light- and dark- adapted Col-0 and rcd1 rosettes were assessed by fractionation of the extracts of leaves treated with [U-14C] glucose. Increased respiration flux and higher amount of total metabolized glucose (Figure 3—source data 1) in rcd1 suggest a more active glycolytic pathway. Higher cell wall metabolic flux in rcd1 provided indirect support of increased operation of the oxidative pentose phosphate pathway which is required for generating pentoses used in cell wall biosynthesis (Ap Rees, 1978). Mean ±SE are presented. Asterisks indicate values significantly different from the wild type, **P value < 0.01, *P value < 0.05, Student’s t-test. Source data and statistics are presented in Figure 3—source data 2.
-
Figure 3—source data 1
Metabolic analyses.
Distribution of radioactive label was analyzed after feeding plants with 14C-labeled glucose. Metabolic fluxes in light- and dark-adapted Col-0, rcd1, rcd1 aox1a, and aox1a plants were deduced.
- https://doi.org/10.7554/eLife.43284.014
-
Figure 3—source data 2
Source data and statistics.
- https://doi.org/10.7554/eLife.43284.015
Figure 4 with 4 supplements
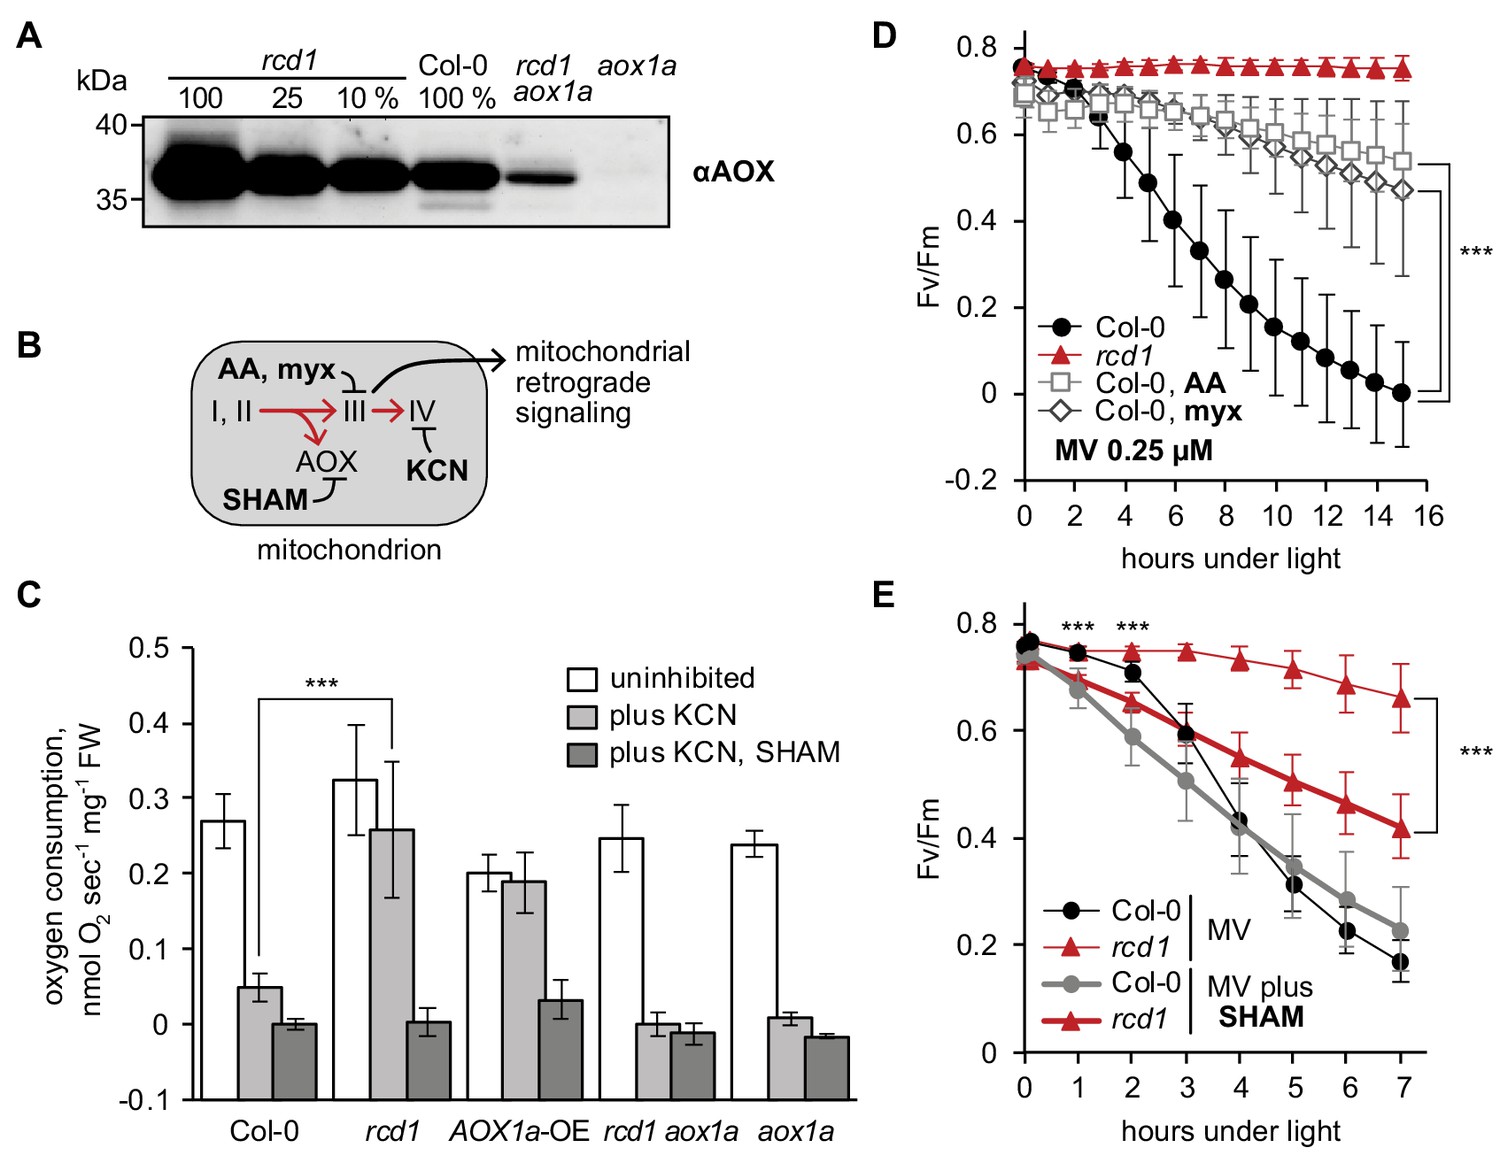
Mitochondrial AOXs affect energy metabolism of rcd1 and alter response to chloroplastic ROS.
Source data and statistics are presented in Figure 4—source data 1. (A) Expression of AOXs is induced in rcd1. Abundance of AOX isoforms in mitochondrial preparations was assessed by immunoblotting with αAOX antibody that recognizes AOX1a, -b, -c, -d, and AOX2 isoforms. 100% corresponds to 15 μg of mitochondrial protein. (B) Two mitochondrial respiratory pathways (red arrows) and sites of action of mitochondrial inhibitors. KCN inhibits complex IV (cytochrome c oxidase). Salicylhydroxamic acid (SHAM) inhibits AOX activity. Antimycin A (AA) and myxothiazol (myx) block electron transfer through complex III (ubiquinol-cytochrome c oxidoreductase), creating ROS-related mitochondrial retrograde signal. (C) AOX capacity is significantly increased in rcd1. Oxygen uptake by seedlings was measured in the darkness in presence of KCN and SHAM. Addition of KCN blocked respiration through complex IV, thus revealing the capacity of the alternative respiratory pathway through AOXs. Data are presented as mean ±SD, asterisks denote selected values that are significantly different (P value < 0.001, one-way ANOVA with Bonferroni post hoc correction). Each measurement was performed on 10–15 pooled seedlings and repeated at least three times. (D) Inhibitors of mitochondrial complex III increase plant tolerance to chloroplastic ROS. Effect of pre-treatment with 2.5 μM AA or 2.5 μM myx on PSII inhibition (Fv/Fm) by MV. For each experiment, leaf discs from at least four individual rosettes were used. The experiment was performed four times with similar results. Mean ±SD are shown. Asterisks indicate selected treatments that are significantly different (P value < 0.001, Bonferroni post hoc correction). AOX abundance in the leaf discs treated in the same way was quantified by immunoblotting (Figure 4—figure supplement 1). (E) AOX inhibitor SHAM decreases plant tolerance to chloroplastic ROS. 1 hr pre-treatment with 2 mM SHAM inhibited tolerance to 1 μM MV both in Col-0 and rcd1 as measured by Fv/Fm. SHAM stock solution was prepared in DMSO, thus pure DMSO was added in the SHAM-minus controls. For each experiment, leaf discs from at least four individual rosettes were used. The experiment was performed four times with similar results. Mean ±SD are shown. Asterisks indicate significant difference in the treatments of the same genotype at the selected time points (P value < 0.001, Bonferroni post hoc correction).
-
Figure 4—source data 1
Source data and statistics.
- https://doi.org/10.7554/eLife.43284.021
Figure 4—figure supplement 1

Effect of mitochondrial complex III inhibitors on expression of AOXs in Col-0 and rcd1.
(A) Changes in AOX abundance after overnight pre-treatment of leaf discs with 2.5 μM AA or 2.5 μM myx (C – control treatment with no inhibitor). Notably, rcd1 aox1a double mutant accumulated AOXs other than AOX1a, including putative AOX1d (Konert et al., 2015) (labeled with asterisk). (B) Quantification of αAOX immunoblotting signal after pre-treatment with 2.5 μM AA or myx. To avoid saturation of αAOX signal in rcd1, a dilution series of protein extracts was made. Quantification was performed using ImageJ. Mean ±SD are shown, asterisks denote selected values that are significantly different (P value < 0.001, Bonferroni post hoc correction, for source data and statistics see Figure 4—source data 1).
Figure 4—figure supplement 2
Effect of mitochondrial complex III inhibitors on abundance and redox state of the RCD1 protein.
(A) Chemical induction of mitochondrial dysfunction signaling did not alter abundance of the RCD1 protein. Leaf discs were treated with 2.5 μM AA or 2.5 μM myx overnight. Then total protein extracts were isolated and separated in SDS-PAGE. Levels of RCD1-HA and of AOXs were assessed by immunoblotting with the specific antibodies as indicated. (B) Redox state of RCD1 protein was only very mildly altered by mitochondrial complex III inhibitors or by MV in the darkness. Treatment with AA or myx was performed as in panel (A). MV, D – leaf discs after overnight pre-treatment with 1 µM MV in the darkness; MV, L – leaf discs after overnight pre-treatment with MV followed by 30 min of illumination; H2O2 – leaf discs after 30 min of incubation in presence of 100 mM H2O2 under light. Reduced (red) and oxidized (ox) forms of the protein are labelled.
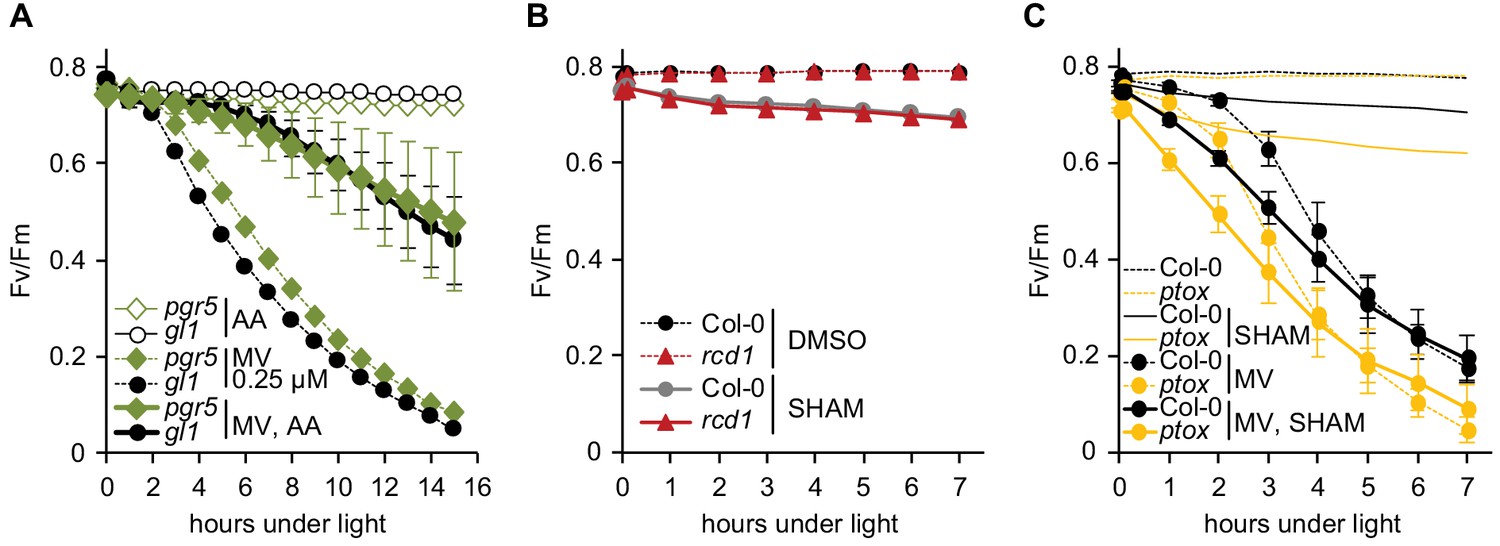
Figure 4—figure supplement 3
Specificity of inhibitor treatments.
All chlorophyll fluorescence analyses are presented as mean ±SD, for source data and statistics see Figure 4—source data 1. (A) Interaction of AA with cyclic electron flow through binding to chloroplastic protein PGR5 (Sugimoto et al., 2013) is not the reason of AA-induced ROS tolerance. Possible off-target effect of AA was assessed by using the pgr5 mutant. Pre-treatment with 2.5 μM AA made both pgr5 and its background wild type gl1 equally more tolerant to chloroplastic ROS. For each experiment leaf discs from at least four individual rosettes were used. The experiment was performed three times with similar results. (B) SHAM treatment results in only slight PSII inhibition both in Col-0 and rcd1. Fv/Fm was monitored under light after 1 hr pre-treatment with 2 mM SHAM. No significant difference was detected between Col-0 and rcd1. SHAM stock solution was prepared in DMSO, thus pure DMSO was added in the SHAM-minus controls. For each experiment leaf discs from at least four individual rosettes were used. The experiment was performed three times with similar results. (C) PTOX, plastid terminal oxidase analogous to AOX, is not involved in the SHAM-induced decrease of ROS tolerance. To exclude possible involvement of PTOX in MV-induced PSII inhibition, green sectors of the ptox mutant leaves were treated with 2 mM SHAM, 1 μM MV, or both chemicals together. ptox mutant was responsive to SHAM treatment similarly to Col-0. For each experiment leaf discs from at least four individual rosettes were used. The experiment was performed twice with similar results.
Figure 4—figure supplement 4
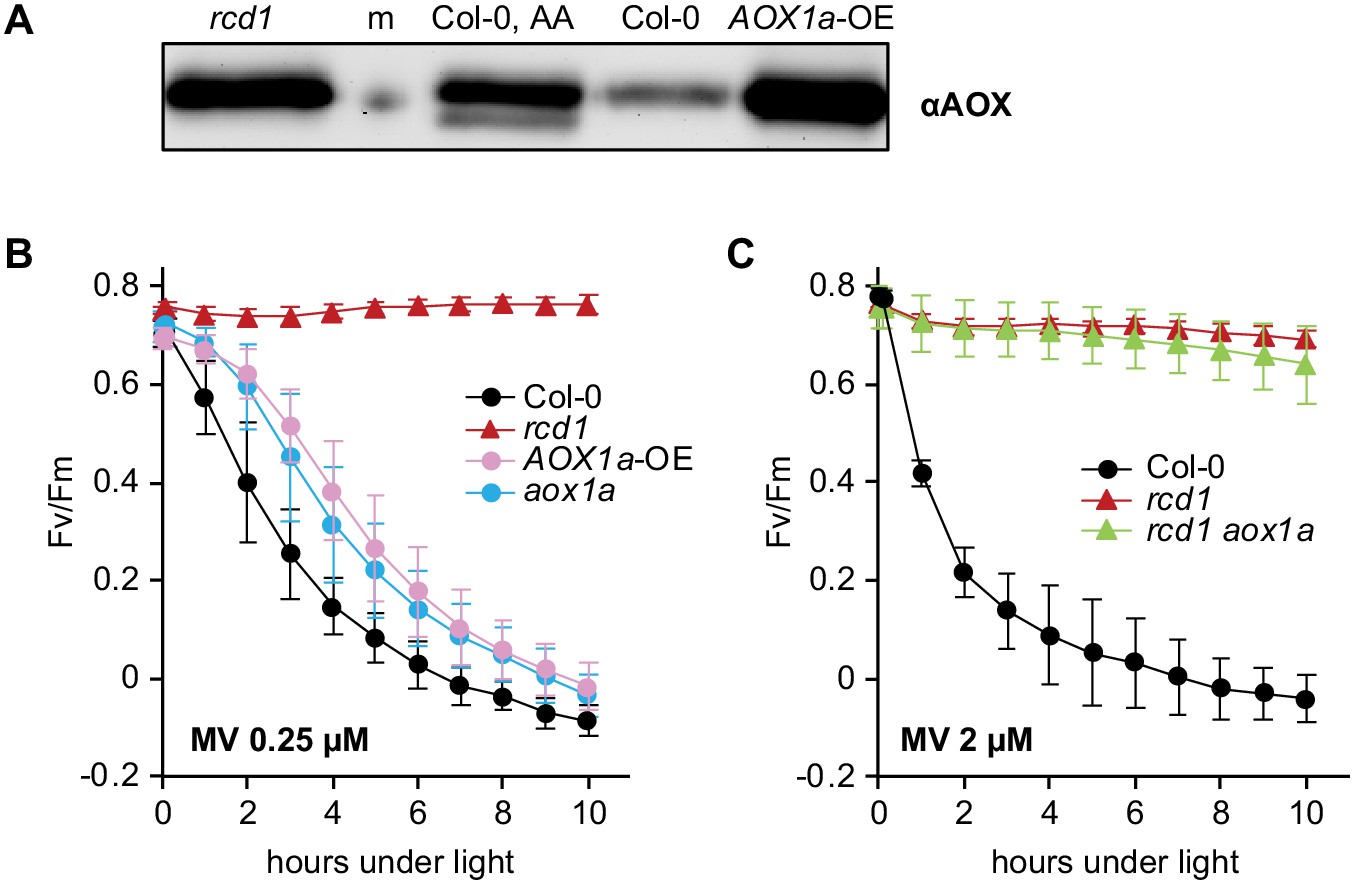
Irrelevance of AOX1a isoform for MV tolerance.
All chlorophyll fluorescence analyses are presented as mean ±SD, for source data and statistics see Figure 4—source data 1. (A) Abundance of total AOX in the AOX1a-overexpressor line (AOX1a-OE) as assessed by immunoblotting was comparable to that in rcd1 (m – molecular weight marker; AA – overnight treatment with 2.5 μM AA). (B) Increased expression of AOX1a isoform is not sufficient to provide ROS tolerance. MV-induced PSII inhibition in the AOX1a-OE and aox1a lines was monitored by Fv/Fm. No significant difference was observed between AOX1a-OE and aox1a at any time point of the experiment. (C) AOX1a isoform is not necessary for chloroplastic ROS tolerance. MV-induced PSII inhibition in rcd1 aox1a double mutant was monitored by Fv/Fm. No significant difference was detected between rcd1 aox1a and rcd1.
Figure 5 with 2 supplements
Altered electron transfer between the organelles in rcd1.
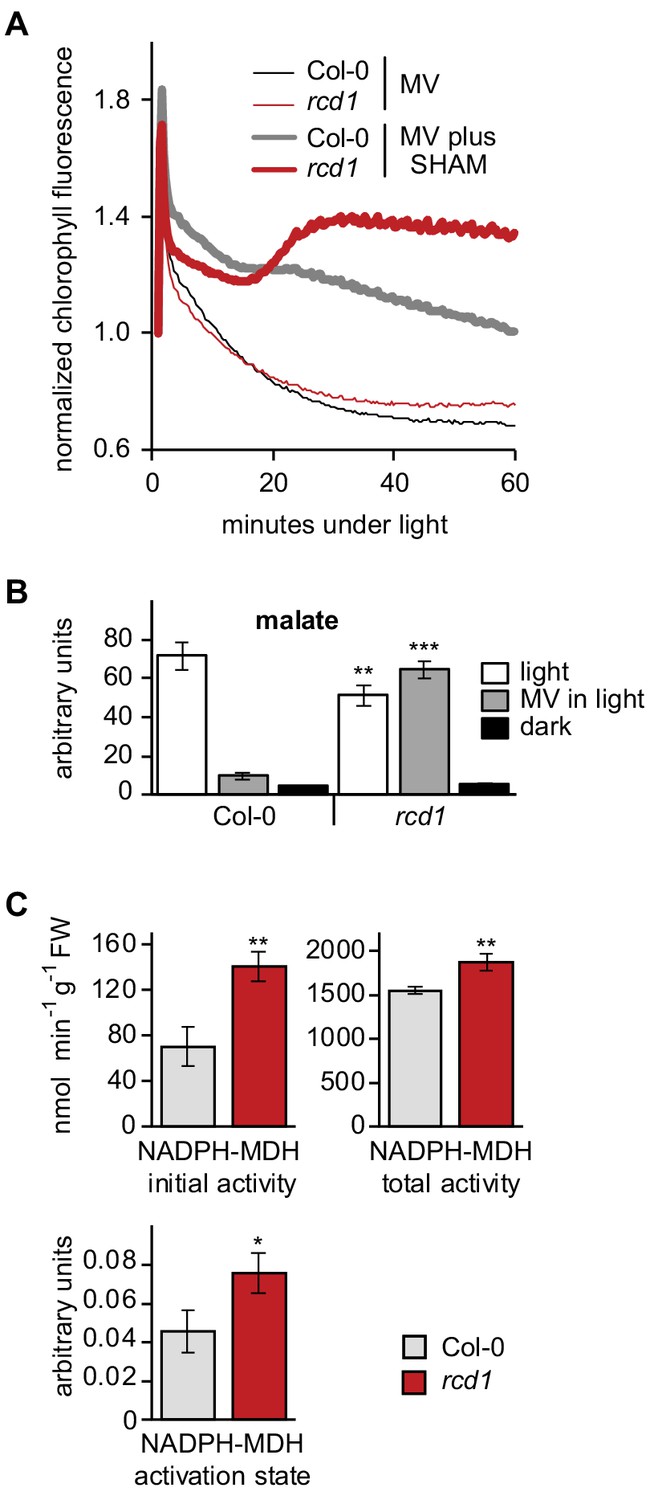
(A) Leaf discs were pre-treated with 1 μM MV or MV plus 2 mM SHAM for 1 hr in the darkness. Then light was turned on (80 µmol m−2 s−1) and chlorophyll fluorescence under light (Fs) was recorded by Imaging PAM. Application of the two chemicals together caused Fs rise in rcd1, but not Col-0, suggesting increase in the reduction state of the chloroplast ETC in rcd1. For analysis of photochemical quenching see Figure 5—figure supplement 1. (B) Malate levels are significantly decreased in Col-0 but not in rcd1 after MV treatment in light. Malate level was measured in extracts from Col-0 and rcd1 seedlings that were pre-treated overnight with 50 μM MV or water control and collected either dark-adapted or after exposure to 4 hr of light. Mean ±SE are shown. Asterisks indicate values significantly different from those in the similarly treated wild type, ***P value < 0.001, **P value < 0.01, Student’s t-test). For statistics, see Figure 5—source data 1. (C) NADPH-MDH activity is increased in rcd1. To measure the activity of chloroplastic NADPH-MDH, plants were grown at 100–120 µmol m−2 s−1 at an 8 hr day photoperiod, leaves were collected in the middle of the day and freeze-dried. The extracts were prepared in the buffer supplemented with 250 μM thiol-reducing agent DTT, and initial activity was measured (top left). The samples were then incubated for 2 hr in the presence of additional 150 mM DTT, and total activity was measured (top right). The activation state of NADPH-MDH (bottom) is presented as the ratio of the initial and the total activity. Mean ±SE are shown. Asterisks indicate values significantly different from the wild type, **P value < 0.01, *P value < 0.05, Student’s t-test. For statistics, see Figure 5—source data 1.
-
Figure 5—source data 1
Source data and statistics.
- https://doi.org/10.7554/eLife.43284.025
Figure 5—figure supplement 1
Alterations in chloroplast electron transfer induced by MV and SHAM.
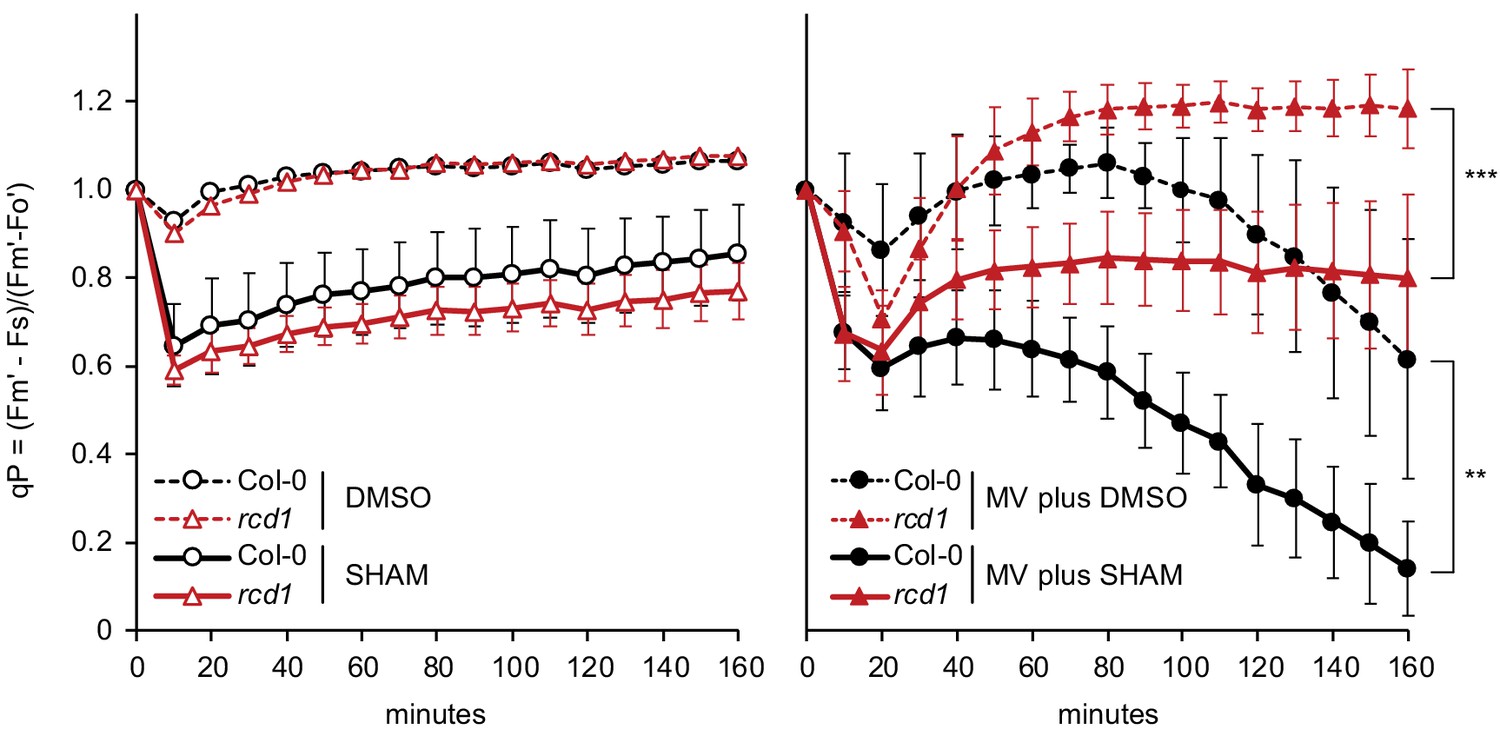
During the first 20 min of light exposure, MV-pre-treated Col-0 and rcd1 experienced transient decrease in PSII photochemical quenching (qP). Within the next hour, photosynthesis recovered in rcd1 to the level observed in the non-treated control, while only very mild recovery was observed in Col-0. In rcd1, the recovery was significantly inhibited by co-application of SHAM together with MV. Leaf discs were pre-treated with MV and SHAM for 1 hr in the darkness. SHAM stock solution was prepared in DMSO, thus pure DMSO was added in the SHAM-minus controls. To calculate qP, Fs was recorded as in Figure 5A; saturating pulses were introduced every 10 min to measure Fm’. Data are presented as mean ±SD, for source data and statistics, see Figure 5—source data 1.
Figure 5—figure supplement 2
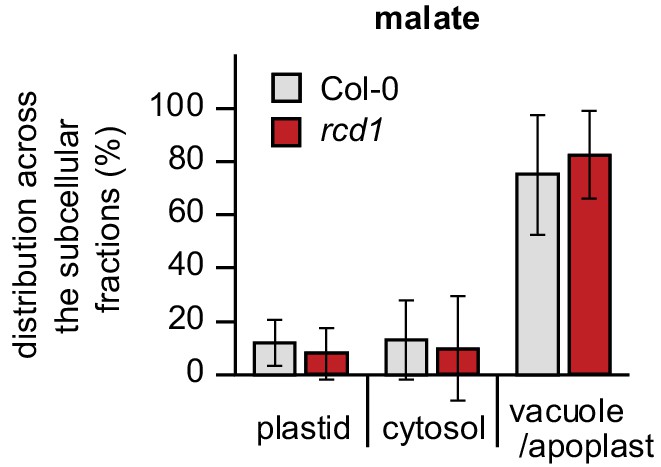
Distribution of malate in subcellular compartments of Col-0 and rcd1.
Distribution of malate was assessed by non-aqueous fractionation metabolomics as described in Figure 1—figure supplement 5C. Mean values ± SE are presented. For source data and statistics, see Figure 5—source data 1.
Figure 6 with 3 supplements
RCD1 is involved in mitochondrial dysfunction, chloroplast ROS and PAP signaling pathways.
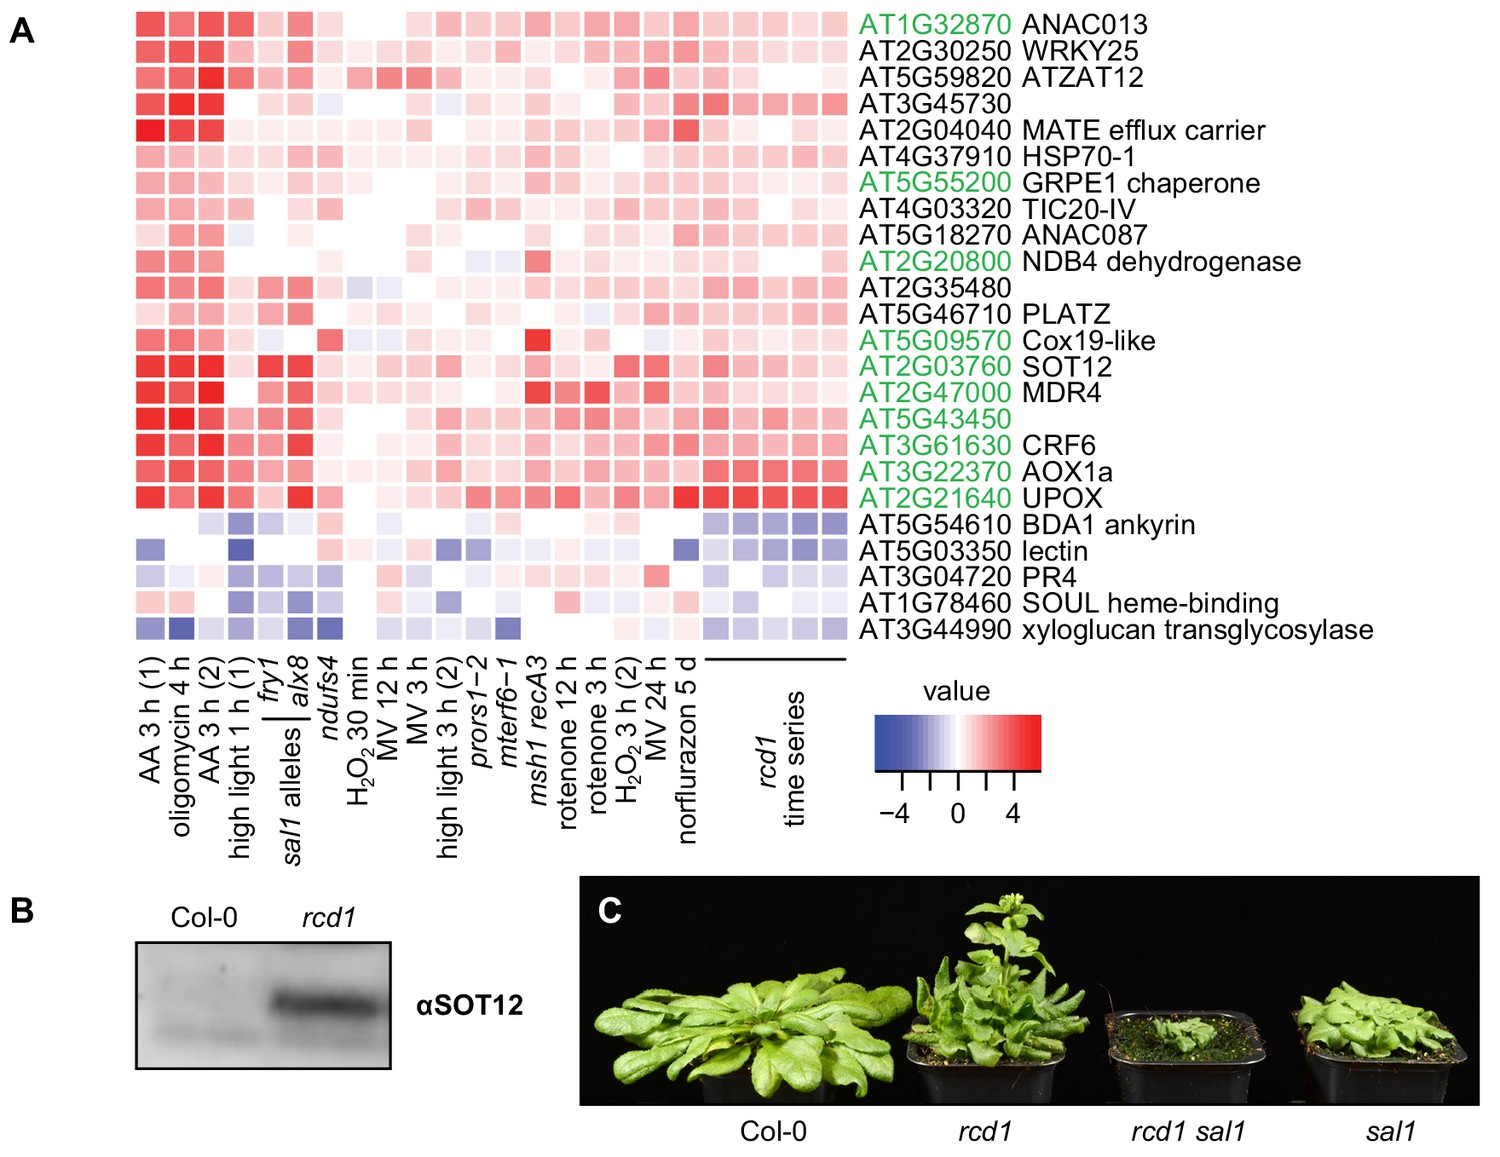
(A) Regulation of rcd1 mis-expressed genes under perturbations of organellar functions in the selected subset of genes. A complete list of rcd1-misexpressed genes is presented in Figure 6—figure supplement 1. Similar transcriptomic changes are observed between the genes differentially regulated in rcd1 and the genes affected by disturbed chloroplastic or mitochondrial functions. Mitochondrial dysfunction stimulon (MDS) genes regulated by ANAC013/ANAC017 transcription factors, are labeled green. (B) Sulfotransferase SOT12 encoded by an MDS gene accumulated in rcd1 under standard growth conditions, as revealed by immunoblotting with the specific antibody. (C) Phenotype of the rcd1 sal1 double mutant under standard growth conditions (12 hr photoperiod with white luminescent light of 220–250 µmol m−2 s−1).
-
Figure 6—source data 1
Source data and statistics.
- https://doi.org/10.7554/eLife.43284.030
Figure 6—figure supplement 1
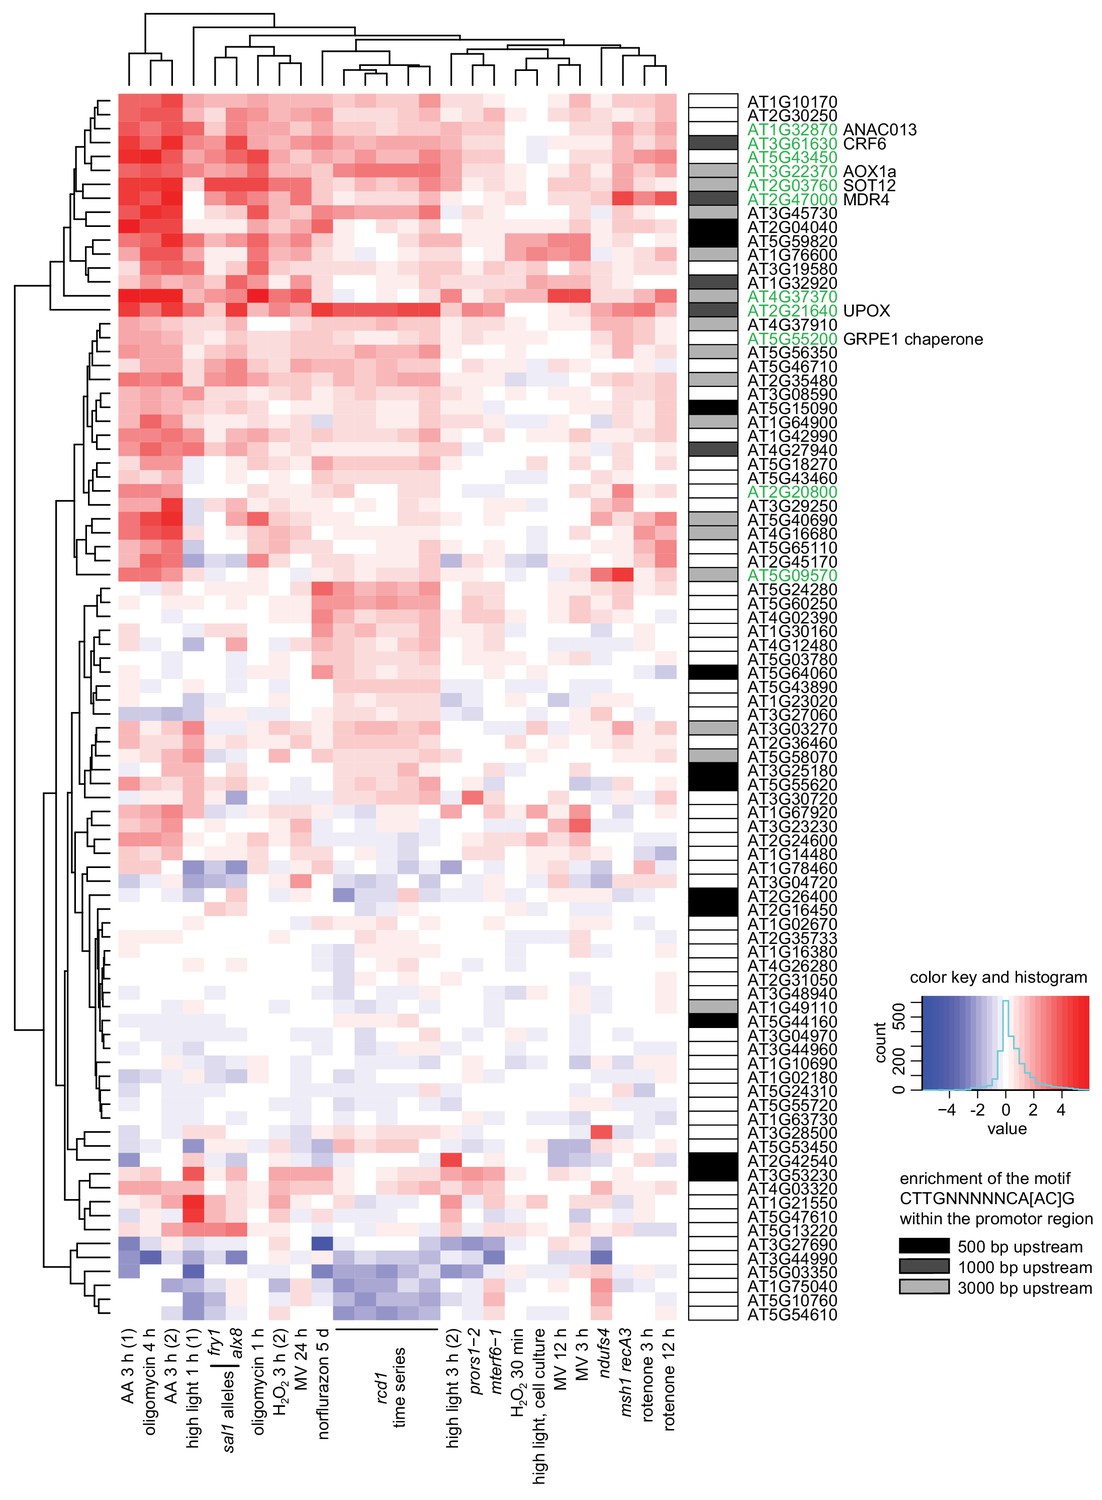
Clustering analysis of genes mis-regulated in rcd1 (with cutoff of logFC <0.5) in published gene expression data sets acquired after perturbations of chloroplasts or mitochondria.
Mitochondrial dysfunction stimulon (MDS) genes are labeled green. Enrichment of the ANAC013/ANAC017 cis-element CTTGNNNNNCA[AC]G (De Clercq et al., 2013) in promoter regions is shown by shaded boxes next to the gene names. Notably, MDS genes represent only a subclass of all genes whose expression is affected by RCD1. For example, a cluster of genes that have lower expression in both rcd1 and sal1 mutants and are mostly associated with defense against pathogens did not have enrichment of ANAC motif in their promoters. This is likely a consequence of interaction of RCD1 with about forty different transcription factors belonging to several families (Jaspers et al., 2009).
Figure 6—figure supplement 2
Induction of MDS genes in rcd1 and rcd1 complementation lines.
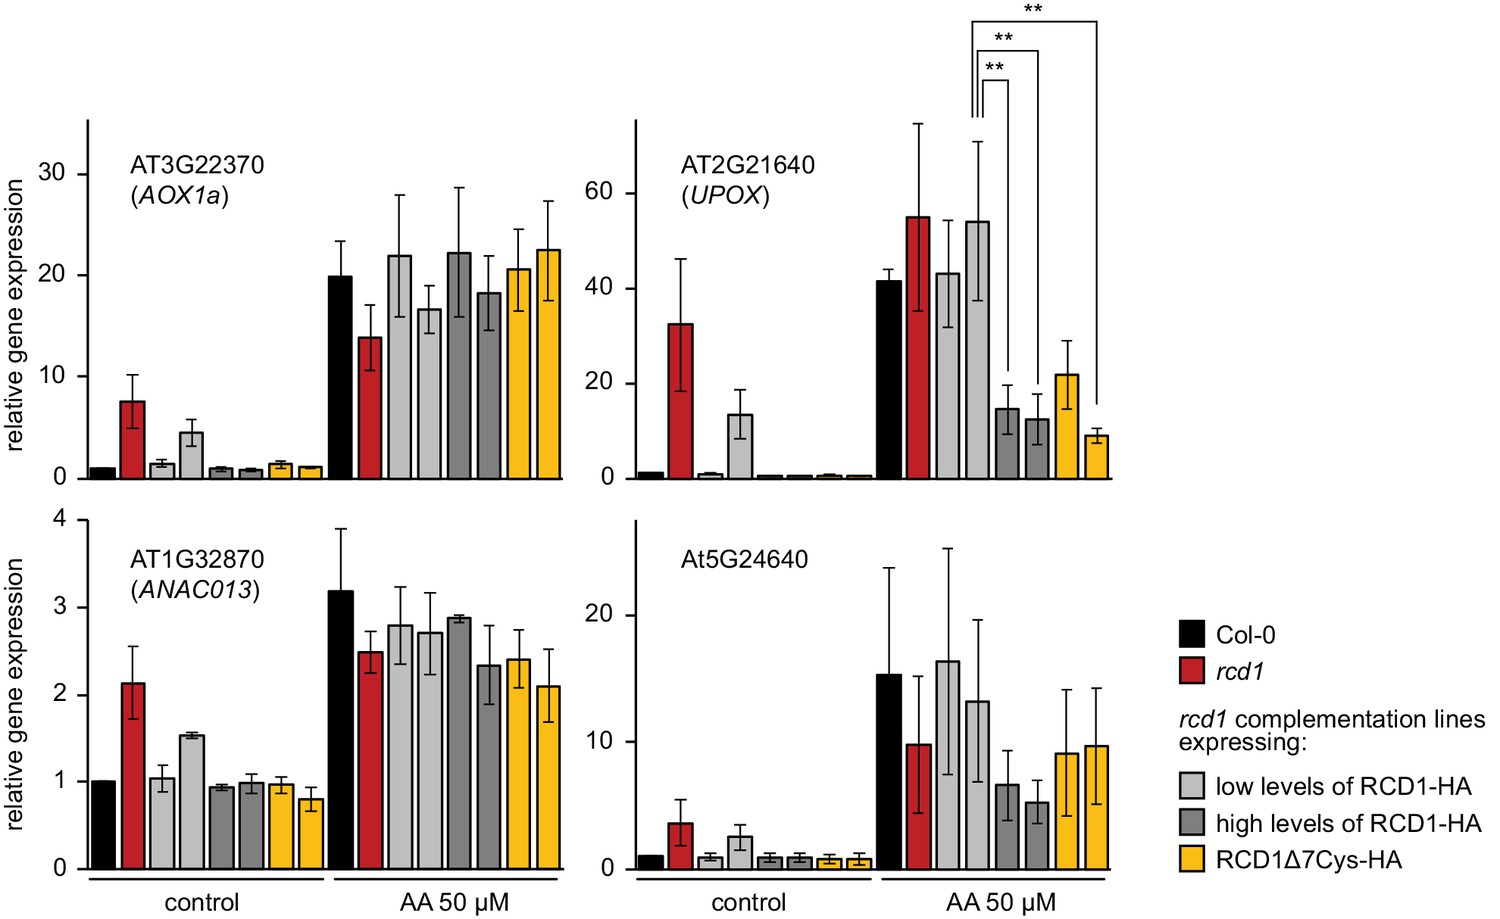
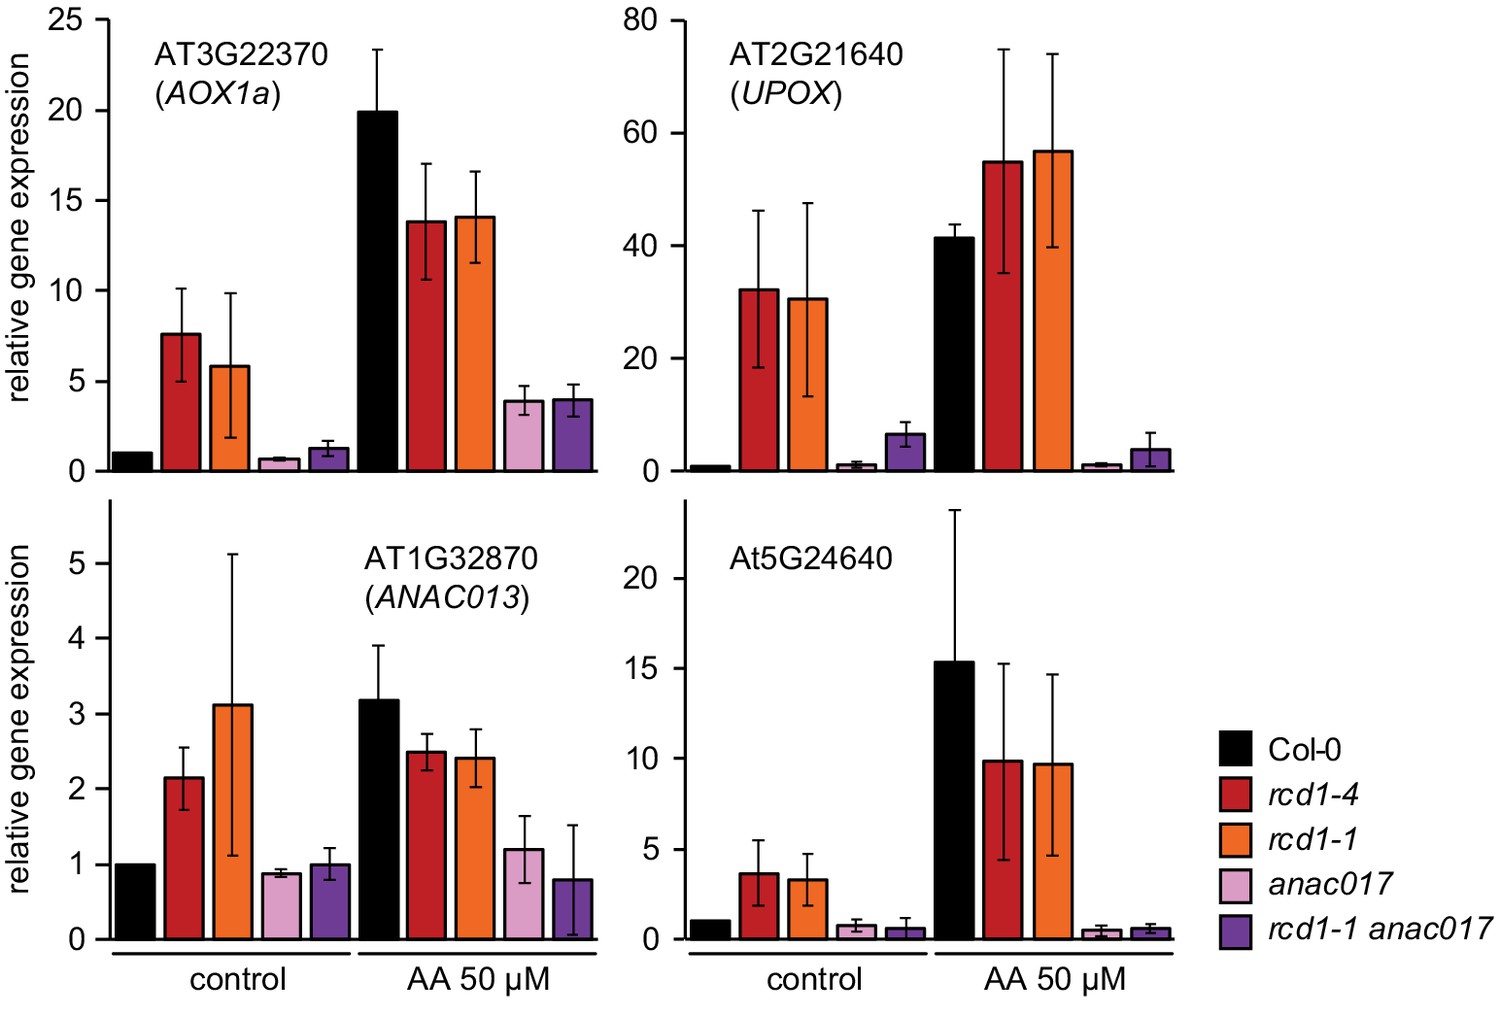
To address the role of RCD1 in transcriptional response to AA, plant rosettes were sprayed with water solution of 50 μM AA (or of DMSO as the control). This concentration of AA has been commonly used in the studies (De Clercq et al., 2013; Ng et al., 2013a; Ng et al., 2013b; Ivanova et al., 2014). However, in addition to mitochondria, AA is known to inhibit chloroplast cyclic electron flow (Labs et al., 2016). In vivo, this side effect is pronounced at a 20 μM, but not at a 2 μM AA concentration (Watanabe et al., 2016). After 3 hr incubation under growth light, relative expression of the selected MDS genes was measured by real time quantitative PCR. Similar induction of AOX1a or ANAC013 was observed in rcd1, Col-0, rcd1: RCD1-HA, and rcd1: RCD1Δ7Cys-HA lines. Interestingly, induction of another tested MDS gene, UPOX, was suppressed in the rcd1: RCD1-HA lines expressing high levels of RCD1 and in the rcd1: RCD1Δ7Cys-HA lines (see Figure 1—figure supplement 1C for the expression of RCD1 in these lines). Analogous effect was observed for the MDS gene At5G24640, although with low statistical power (Figure 6—source data 1. Source data and statistics). Suppressed MDS induction in the lines with high levels of RCD1 was in line with the observation that RCD1 abundance in vivo inversely correlated with different tolerance of plants to MV (Figure 1—figure supplement 1). Four rosettes were pooled together for each sample. Relative expression was calculated from three biological repeats and the data were scaled relative to control Col-0. Asterisks indicate significant difference between the selected genotypes (**P value < 0.01, Bonferroni post hoc correction). Source data and statistics are presented in Figure 6—source data 1.
Figure 6—figure supplement 3
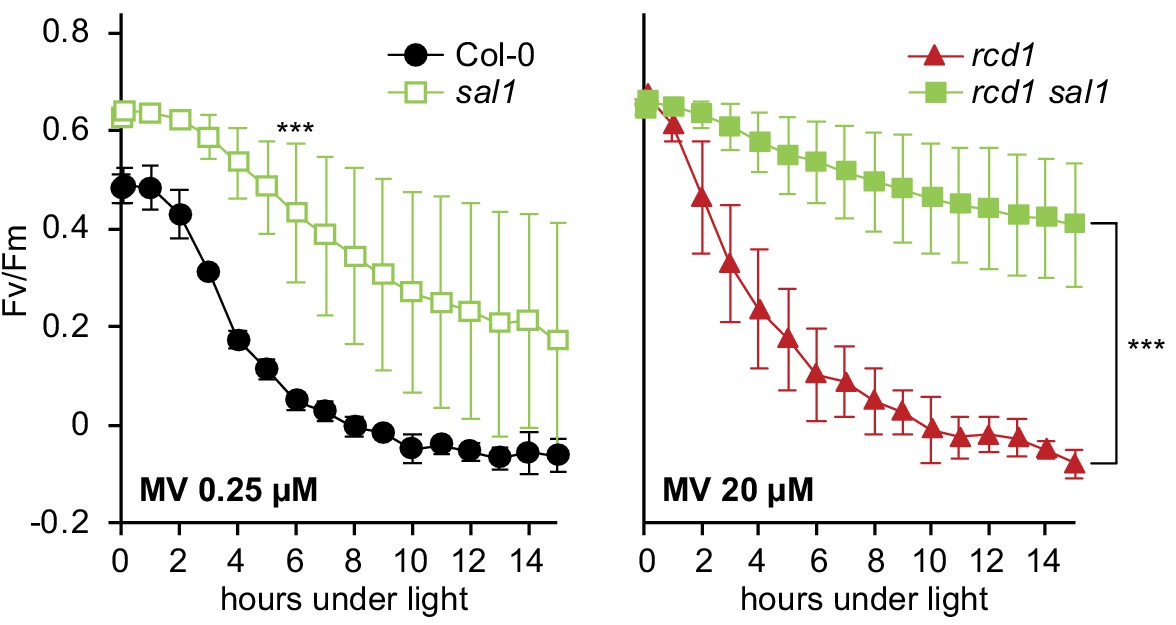
Tolerance of PSII to chloroplastic ROS in sal1 mutants.
MV-induced PSII inhibition was tested in 2.5 week rosettes. The single sal1 mutant was more tolerant to MV than the wild type (left panel). The double rcd1 sal1 mutant was more tolerant to MV than rcd1 (right panel). Note different concentrations of MV used in the two panels. For source data and statistics, see Figure 6—source data 1.
Figure 7 with 3 supplements
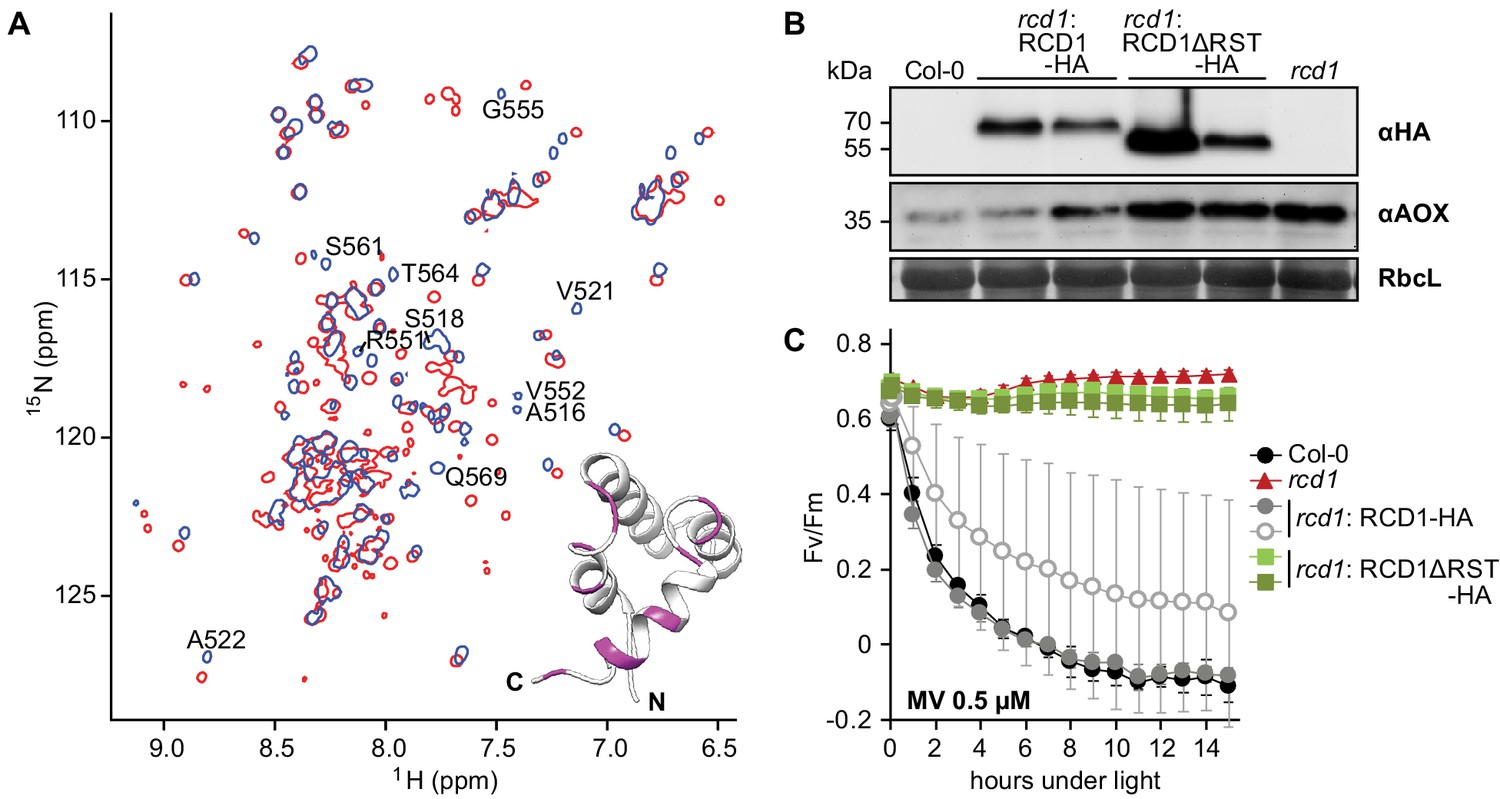
RST domain of RCD1 binds to ANAC transcription factors and is necessary for RCD1 function in vivo.
Source data and statistics are presented in Figure 7—source data 4. (A) Biochemical interaction of ANAC013 with the RST domain of RCD1 in vitro. Superimposed 1H, 15N HSQC spectra of the C-terminal domain of RCD1 acquired in absence (blue) and presence (red) of approximately two-fold excess of the ANAC013235-284 peptide. Interaction of RCD1468-589 with ANAC013235-284 caused peptide-induced chemical shift changes in the 1H, 15N correlation spectrum of RCD1, which were mapped on the structure of the RST domain (inset). Inset: RSTRCD1 structure with highlighted residues demonstrating the largest chemical shift perturbations (Δδ ≥ 0.10 ppm) between the free and bound forms (details in Figure 7—figure supplement 3C), which probably corresponds to ANAC013-interaction site. (B) Stable expression in rcd1 of the HA-tagged RCD1 variant lacking its C-terminus under the control of the native RCD1 promoter does not complement rcd1 phenotypes. In the independent complementation lines RCD1ΔRST-HA was expressed at the levels comparable to those in the RCD1-HA lines (upper panel). However, in rcd1: RCD1ΔRST-HA lines abundance of AOXs (middle panel) was similar to that in rcd1. (C) Tolerance of PSII to chloroplastic ROS was similar in the rcd1: RCD1ΔRST-HA lines and rcd1. For each PSII inhibition experiment, leaf discs from at least four individual rosettes were used. The experiment was performed three times with similar results. Mean ±SD are shown.
-
Figure 7—source data 1
In vivo interaction partners of ANAC013.
From Arabidopsis line expressing ANAC013-GFP, ANAC013-GFP and associated proteins were purified with αGFP antibody and identified by mass spectrometry. Identified proteins (Perseus analysis, ANAC013) and mapped peptides (peptide IDs) are shown.
- https://doi.org/10.7554/eLife.43284.036
-
Figure 7—source data 2
In vivo interaction partners of RCD1.
From Arabidopsis line expressing RCD1-3xVenus, RCD1-3xVenus and associated proteins were purified with αGFP antibody and identified by mass spectrometry. Identified proteins (Perseus analysis, RCD1) and mapped peptides (peptide IDs) are shown.
- https://doi.org/10.7554/eLife.43284.037
-
Figure 7—source data 3
NMR constraints and structural statistics for the ensemble of the 15 lowest-energy structures of RCD1 RST.
- https://doi.org/10.7554/eLife.43284.038
-
Figure 7—source data 4
Source data and statistics.
- https://doi.org/10.7554/eLife.43284.039
Figure 7—figure supplement 1
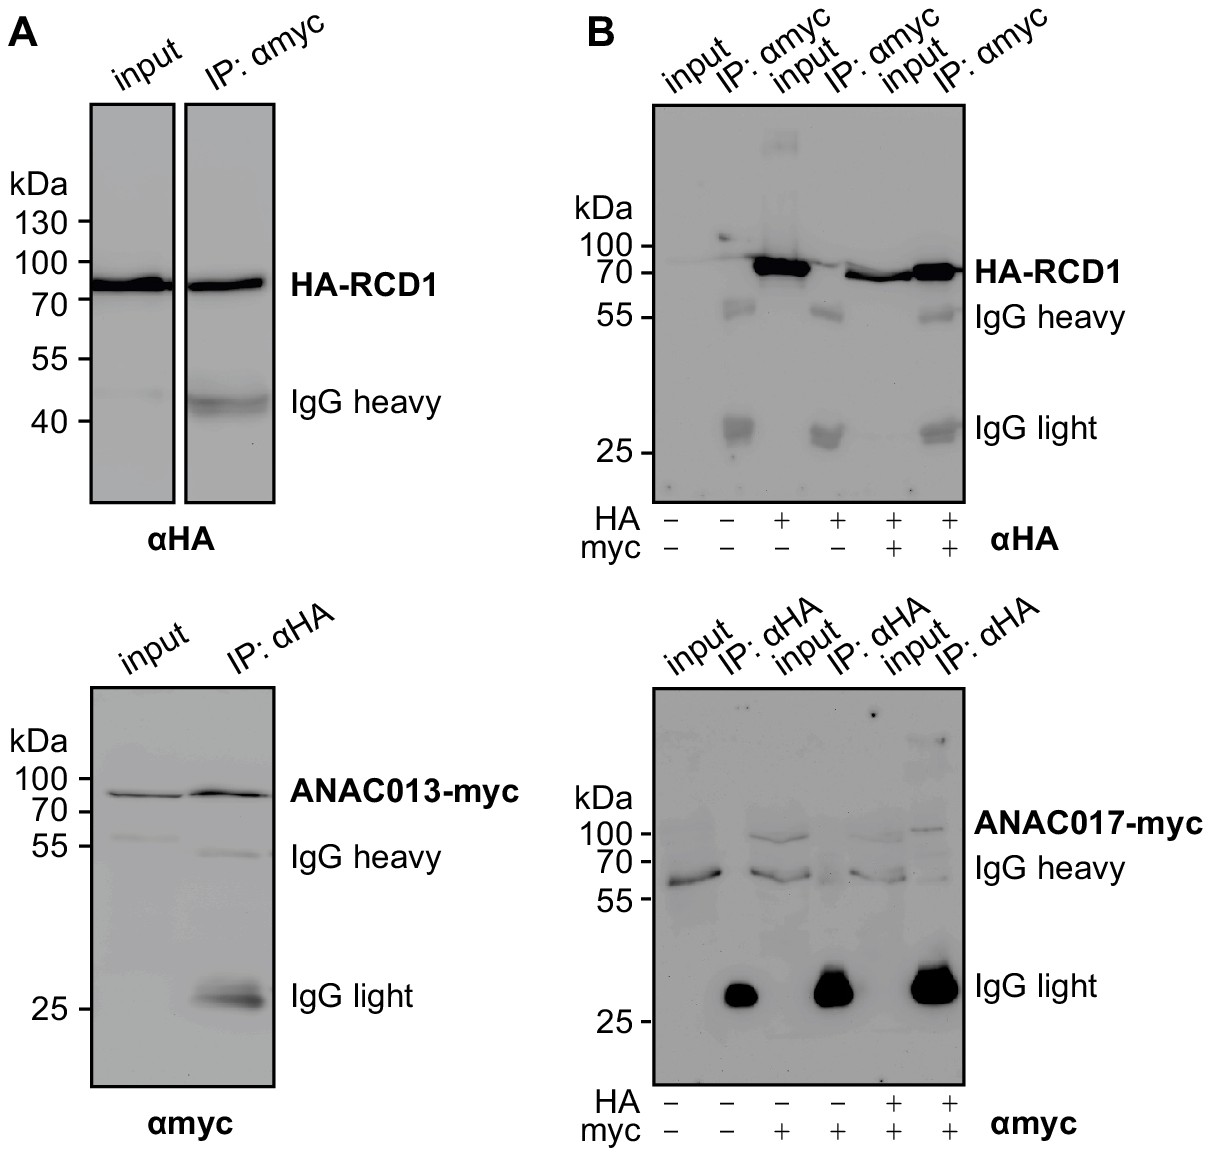
Biochemical interaction of RCD1 with ANAC013/ANAC017 transcription factors in human embryonic kidney (HEK293) cells.
HA-RCD1 was co-expressed with ANAC013-myc (A) or ANAC017-myc (B) (IP – eluate after immunoprecipitation). (A) Co-immunoprecipitation of HA-RCD1 with αmyc antibody (top) and of ANAC013-myc with αHA antibody (bottom) indicated complex formation between HA-RCD1 and ANAC013-myc. (B) Co-immunoprecipitation of HA-RCD1 with αmyc antibody (top) and of ANAC017-myc with αHA antibody (bottom) indicated complex formation between HA-RCD1 and ANAC017-myc.
Figure 7—figure supplement 2
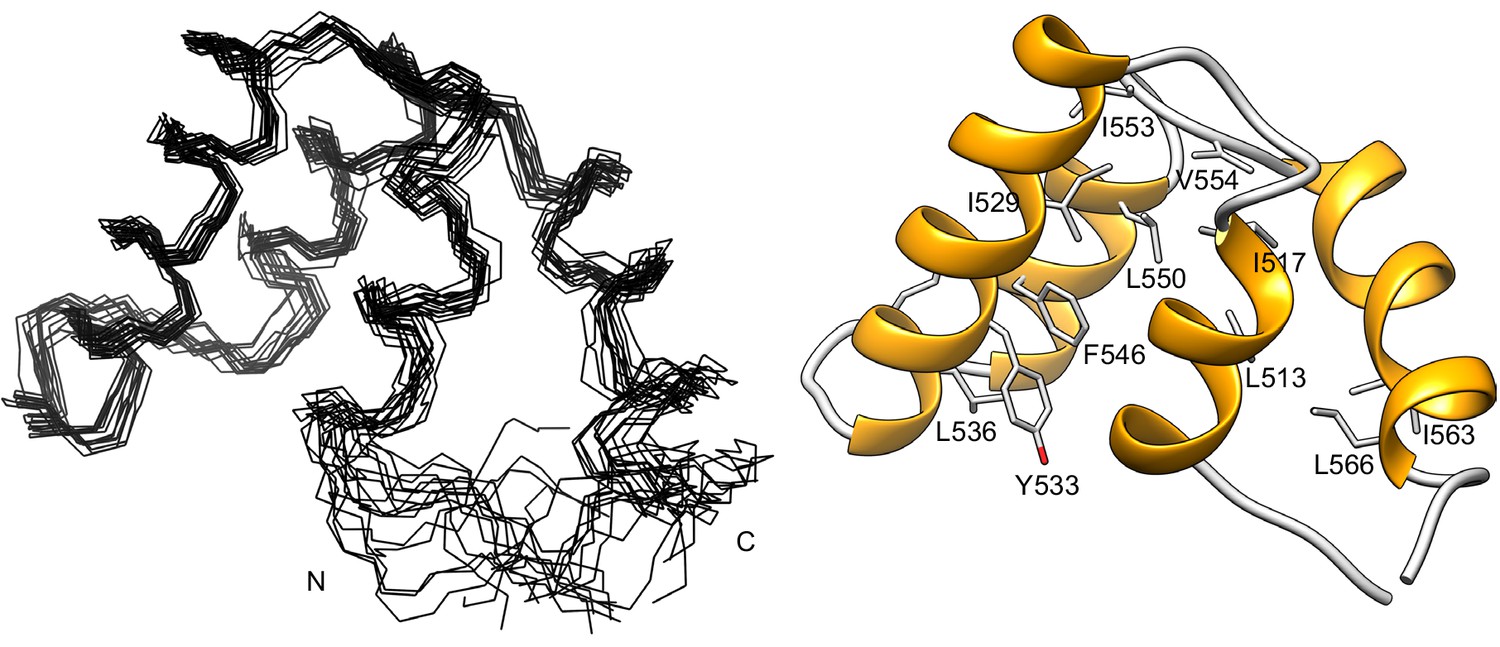
Structure of the RST domain of RCD1.
Structure of the C-terminal domain of RCD1 (residues G468-L589) was determined by NMR spectroscopy. The first 38 N-terminal and the last 20 C-terminal residues are devoid of any persistent structure, hence only the structure of the folded part (residues P506-P570) is shown. The ensemble of 15 lowest-energy structures is on the left and a ribbon representation of the lowest-energy structure is on the right. The folded part represented by the RST domain is entirely α-helical and consists of four α-helices, F510-I517, E523-R537, R543-V554 and D556-L566. The structured region ends at position N568, which corresponds to the necessary C-terminal part for the interaction with transcription factors (Jaspers et al., 2010b). The structure of the beginning of the first helix is dispersed in the ensemble due to sparseness of distance restraints. This arises from several missing amide chemical shift assignments (Tossavainen et al., 2017) as well as the presence of four proline residues in this region (P503, P506, P509 and P511), which severely hindered distance restraint generation. The many conserved hydrophobic residues (Jaspers et al., 2010a), shown in stick representation, form the domain’s hydrophobic core. Mutagenesis experiments identified hydrophobic residues L528/I529 and I563 as critical for RCD1 interaction with DREB2A (Vainonen et al., 2012). I529 and I563 are constituents of the hydrophobic core, and substitution of these residues probably disrupts the core of the RST domain thus abolishing the interaction. The atomic coordinates and structural restraints for the C-terminal domain of RCD1468-589 have been deposited in the Protein Data Bank with the accession code 5N9Q.
Figure 7—figure supplement 3
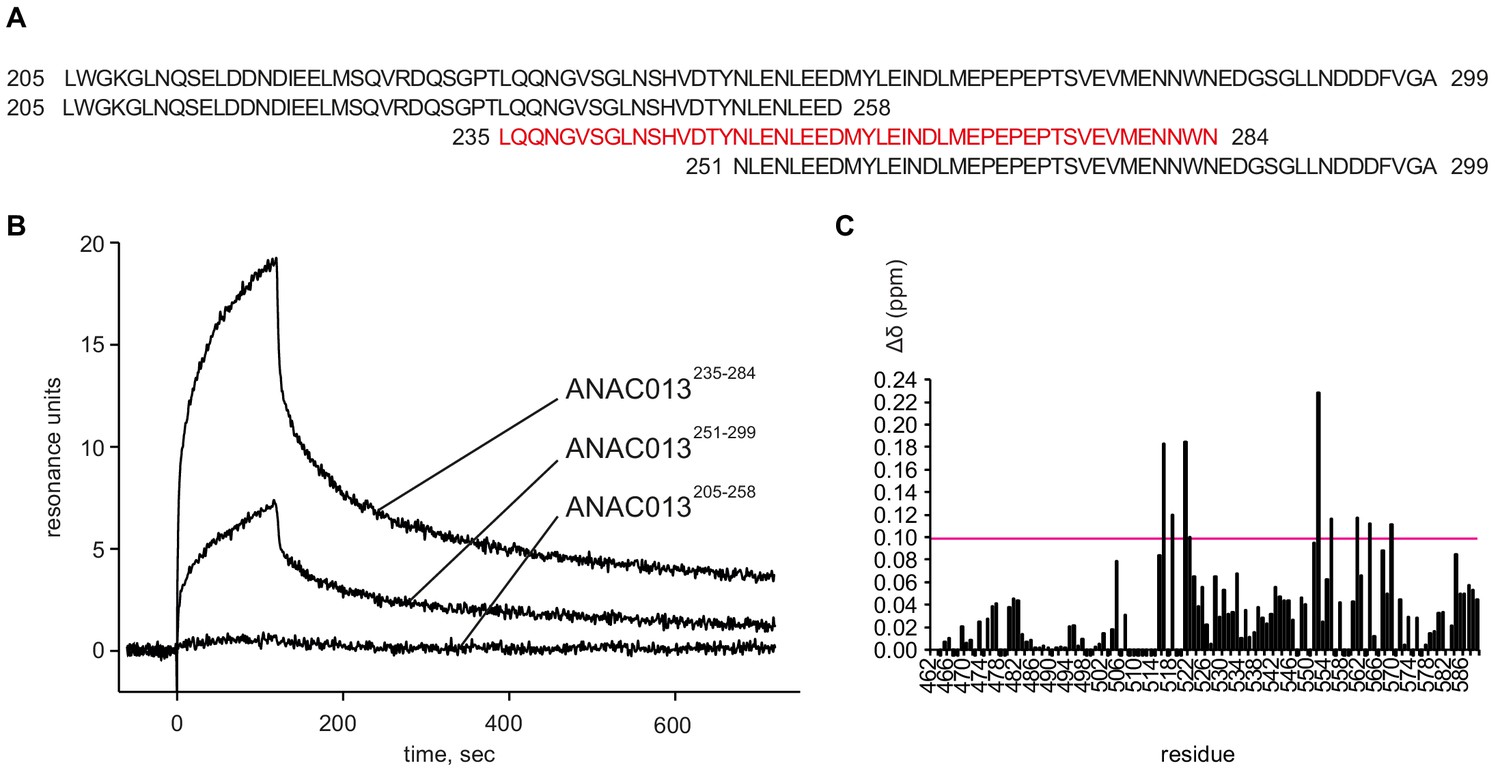
Analysis of interaction of the ANAC013-derived peptides with the RST domain of RCD1.
(A) According to yeast two-hybrid data (O'Shea et al., 2017), ANAC013 residues 205–299 are responsible for interaction with RCD1. To narrow down the RCD1-interacting domain, three overlapping peptides ANAC013205-258, ANAC013235-284, ANAC013251-299 were designed and tested for their binding to RCD1 by surface plasmon resonance. (B) Surface plasmon resonance interaction analysis of three ANAC013-derived peptides with the C-terminal domain of RCD1. The strongest binding was detected for ANAC013 peptide 235–284 (red in panel A), which was further used for the NMR titration experiment with the purified C-terminal domain of RCD1 (RCD1468-589). (C) Histogram depicting the changes in 1H and 15N chemical shifts in RCD1468-589 upon addition of the ANAC013235-284 peptide. Changes were quantified according to the ‘minimum chemical shift procedure’. That is, each peak in the free form spectrum was linked to the nearest peak in the bound form spectrum. An arbitrary value −0.005 ppm was assigned to residues for which no data could be retrieved. The largest changes (Δδ ≥ 0.10 ppm) were found for residues located on one face of the domain, formed by the first and last helices and loops between the first and the second, and the third and the fourth helices. These residues probably representing the peptide interaction site are highlighted on the RSTRCD1 structure in Figure 7A inset. In addition, relatively large perturbations were observed throughout the RST domain, and notably, in the unstructured C-terminal tail, which might originate from a conformational rearrangement in the domain induced by ligand binding.
Figure 8 with 1 supplement
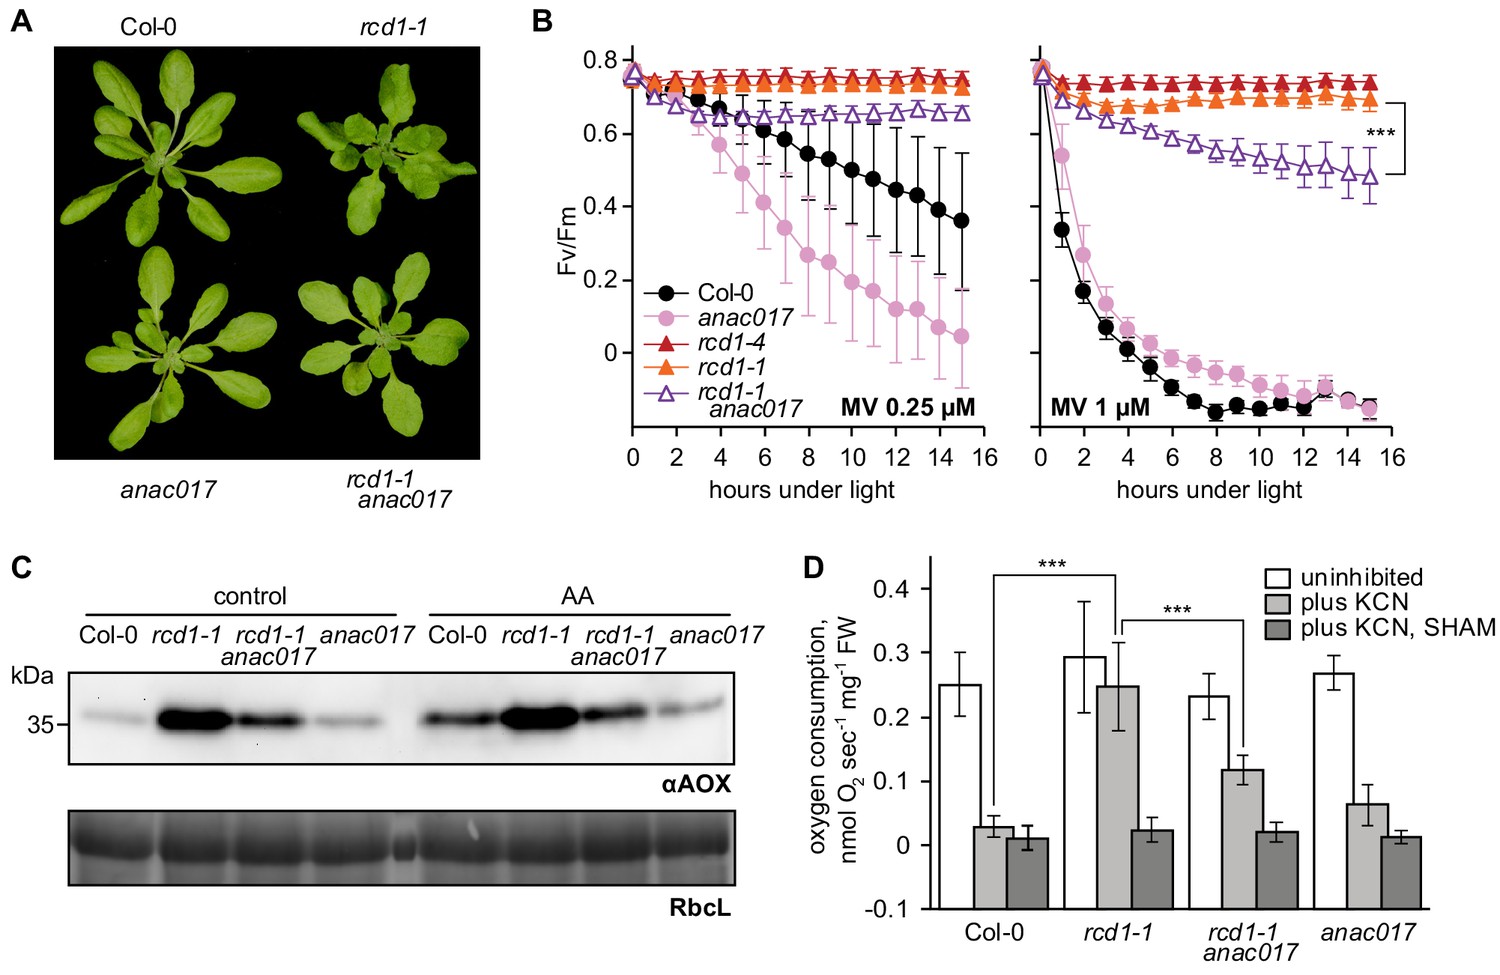
Developmental, chloroplast- and mitochondria-related phenotypes of rcd1 are partially mediated by ANAC017.
Source data and statistics are presented in Figure 8—source data 1. (A) Introducing anac017 mutation in the rcd1 background partially suppressed the curly leaf phenotype of rcd1. (B) The anac017 mutation partially suppressed tolerance of rcd1 to chloroplastic ROS. PSII inhibition by ROS was measured in rcd1 anac017 double mutant by using 0.25 μM or 1 μM MV (left and right panel, accordingly). For each experiment, leaf discs from at least four individual rosettes were used. The experiment was performed three times with similar results. Mean ±SD are shown. Asterisks denote selected values that are significantly different (P value < 0.001, two-way ANOVA with Bonferroni post hoc correction). (C) The anac017 mutation partially suppressed mitochondrial phenotypes of rcd1. Total AOX protein levels were lowered in rcd1 anac017 double mutant as compared to rcd1 both after the overnight treatment with 2.5 μM AA and in the untreated control. (D) Oxygen uptake by rcd1 anac017 seedlings was measured in the darkness in presence of mitochondrial respiration inhibitors as described in Figure 4C. The rcd1 anac017 mutant demonstrated lower KCN-insensitive AOX respiration capacity than rcd1. Each measurement was performed on 10–15 pooled seedlings and repeated at least three times. Mean ±SD are shown. Asterisks denote selected values that are significantly different (P value < 0.001, one-way ANOVA with Bonferroni post hoc correction).
-
Figure 8—source data 1
Source data and statistics.
- https://doi.org/10.7554/eLife.43284.042
Figure 8—figure supplement 1
Induction of MDS genes in anac017 and rcd1 anac017 mutants.
Expression of the selected MDS genes was assessed in rosettes 3 hr after spraying them with 50 μM AA, as described in Figure 6—figure supplement 2. The anac017 mutation strongly suppressed induction of MDS genes in rcd1 both under control conditions and after AA treatment. Relative expression was calculated from three biological repeats and the data were scaled relative to control Col-0. Source data are presented in Figure 6—source data 1.
Figure 9
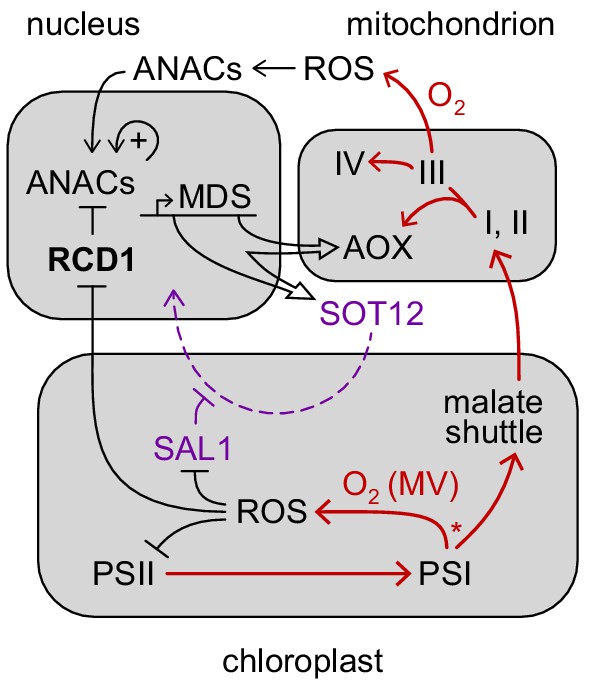
Hypothetical role of RCD1 in organelle signaling and energy metabolism.
RCD1 is the direct suppressor of ANAC transcription factors that is itself subject to redox regulation. Chloroplastic ROS likely affect RCD1 protein redox state and abundance. Inactivation of RCD1 leads to induction of ANAC-controlled MDS regulon. Expression of MDS genes is possibly feedback-regulated via the PAP retrograde signaling (purple). Resulting activation of mitochondrial AOXs and other MDS components is likely to affect electron flows (red) and ROS signaling in mitochondria and in chloroplasts. Putative competition of AOX-directed electron transfer with the formation of ROS at PSI is labeled with an asterisk.
Tables
Table 1
Overview of the immunoprecipitation results.
Selected proteins identified in ANAC013-GFP and RCD1-3xVenus pull-down assays. Ratio vs. Col-0 and the P-value were obtained by Perseus statistical analysis from the three repeats for each genotype used. Bold text indicates baits. The peptide coverage for selected proteins as well as full lists of identified proteins are presented in Figure 7—source datas 1 and 2.
| Ratio vs. Col-0 | P-value | Unique peptides | Gene | Name | Stickiness |
|---|---|---|---|---|---|
| ANAC013-GFP pull-down | |||||
| 50966 | 7.09 × 10⁻⁷ | 29 | AT1G32870 | ANAC013 | |
| 22149 | 3.41 × 10⁻⁸ | 25 | GFP | ||
| 10097 | 3.67 × 10⁻⁶ | 37 | AT1G32230 | RCD1 | 1.00% |
| 110 | 1.67 × 10⁻⁶ | 8 | AT2G35510 | SRO1 | 1.00% |
| 74 | 1.09 × 10⁻⁹ | 4 | AT1G34190 | ANAC017 | 1.00% |
| RCD1-3xVenus pull-down | |||||
| 7593 | 0.000454 | 35 | AT1G32230 | RCD1 | |
| 1292 | 0.006746 | 10 | YFP | ||
| 108 | 5.48 × 10⁻⁸ | 2 | AT1G34190 | ANAC017 | 1.00% |
Key resources table
| Reagent type (species) or resource | Designation | Source or reference | Identifiers | Additional information |
|---|---|---|---|---|
| Genetic reagent(Arabidopsis thaliana, Col-0) | rcd1-4 | NASC stock center | GK-229D11 | homozygous mutant plant line |
| Genetic reagent(Arabidopsis thaliana, Col-0) | rcd1-1 | PMID: 11041881 | homozygous mutant plant line | |
| Genetic reagent(Arabidopsis thaliana, Col-0) | aox1a | PMID: 16299171 | homozygous mutant plant line | |
| Genetic reagent(Arabidopsis thaliana, Col-0) | AOX1a-OE | PMID: 16299171 | homozygous mutant plant line | |
| Genetic reagent(Arabidopsis thaliana, Col-0) | ptox | PMID: 7920709 | homozygous mutant plant line | |
| Genetic reagent (Arabidopsis thaliana, Col-0) | anac017 | NASC stock center | SALK_022174 | homozygous mutant plant line |
| Genetic reagent(Arabidopsis thaliana, Col-0) | sal1-8 | PMID: 19170934 | homozygous mutant plant line | |
| Genetic reagent(Arabidopsis thaliana, Col-0) | rcd1 aox1a | PMID: 24550736 | homozygous mutant plant line | |
| Genetic reagent(Arabidopsis thaliana, Col-0) | rcd1-1 anac017 | this paper | homozygous mutant plant line | |
| Genetic reagent(Arabidopsis thaliana, Col-0) | rcd1-4 sal1-8 | this paper | homozygous mutant plant line | |
| Genetic reagent(Arabidopsis thaliana, Col-0) | rcd1-4: RCD1-HA | this paper | set of complementation plant lines | |
| Genetic reagent(Arabidopsis thaliana, Col-0) | rcd1-4: RCD1-3xVenus | this paper | set of complementation plant lines | |
| Genetic reagent(Arabidopsis thaliana, Col-0) | rcd1-4: RCD1Δ7Cys-HA | this paper | set of complementation plant lines | |
| Genetic reagent(Arabidopsis thaliana, Col-0) | rcd1-4: RCD1ΔRST-HA | this paper | set of complementation plant lines | |
| Genetic reagent(Arabidopsis thaliana, Col-0) | ANAC013-GFP | PMID: 24045019 | transgenic plant line | |
| Genetic reagent(Arabidopsis thaliana, gl1) | pgr5 | PMID: 12176323 | homozygous mutant plant line | |
| Cell line (Homo sapiens) | HEK293T | ATCC | ATCC CRL-3216 | human embryonic kidney cell line |
| Gene (Homo sapiens) | HA-RCD1 | this paper | construct for expression in HEK293T cells | |
| Gene (Homo sapiens) | ANAC013-myc | this paper | construct for expression in HEK293T cells | |
| Gene (Homo sapiens) | ANAC017-myc | this paper | construct for expression in HEK293T cells | |
| Antibody | αHA | Roche | Roche 1 867 423 001 | 1: 2 000 for immunoblotting |
| Antibody | αGFP | Milteny Biotech | ||
| Antibody | αRCD1 | this paper | 1: 500 for immunoblotting | |
| Antibody | αSOT12 | Dr. Saijaliisa Kangasjärvi | Agrisera AS16 3943 | 1: 500 for immunoblotting |
| Peptide, recombinant protein | ANAC013 peptides | Genecust | Synthetic peptides |
Additional files
-
Supplementary file 1
Primers used in the study.
- https://doi.org/10.7554/eLife.43284.044
-
Transparent reporting form
- https://doi.org/10.7554/eLife.43284.045
Download links
A two-part list of links to download the article, or parts of the article, in various formats.
Downloads (link to download the article as PDF)
Open citations (links to open the citations from this article in various online reference manager services)
Cite this article (links to download the citations from this article in formats compatible with various reference manager tools)
Arabidopsis RCD1 coordinates chloroplast and mitochondrial functions through interaction with ANAC transcription factors
eLife 8:e43284.
https://doi.org/10.7554/eLife.43284


