The Plasmodium liver-specific protein 2 (LISP2) is an early marker of liver stage development
- Novartis Institute for Tropical Diseases, United States
- Novartis Institute for Tropical Diseases, Singapore
- Université des Sciences, des Techniques et des Technologies de Bamako (USTTB), MRTC – DEAP, Mali
- Biomedical Primate Research Centre, Netherlands
- Novartis Institutes for BioMedical Research, Switzerland
- Center for Infectious Disease Research, United States
- Mahidol University, Thailand
- Ehime University, Japan
- Mahidol Vivax Research Center, Thailand
- Singapore Immunology Network (SIgN), Singapore
- National University of Singapore, Singapore
Figures
Figure 1 with 5 supplements
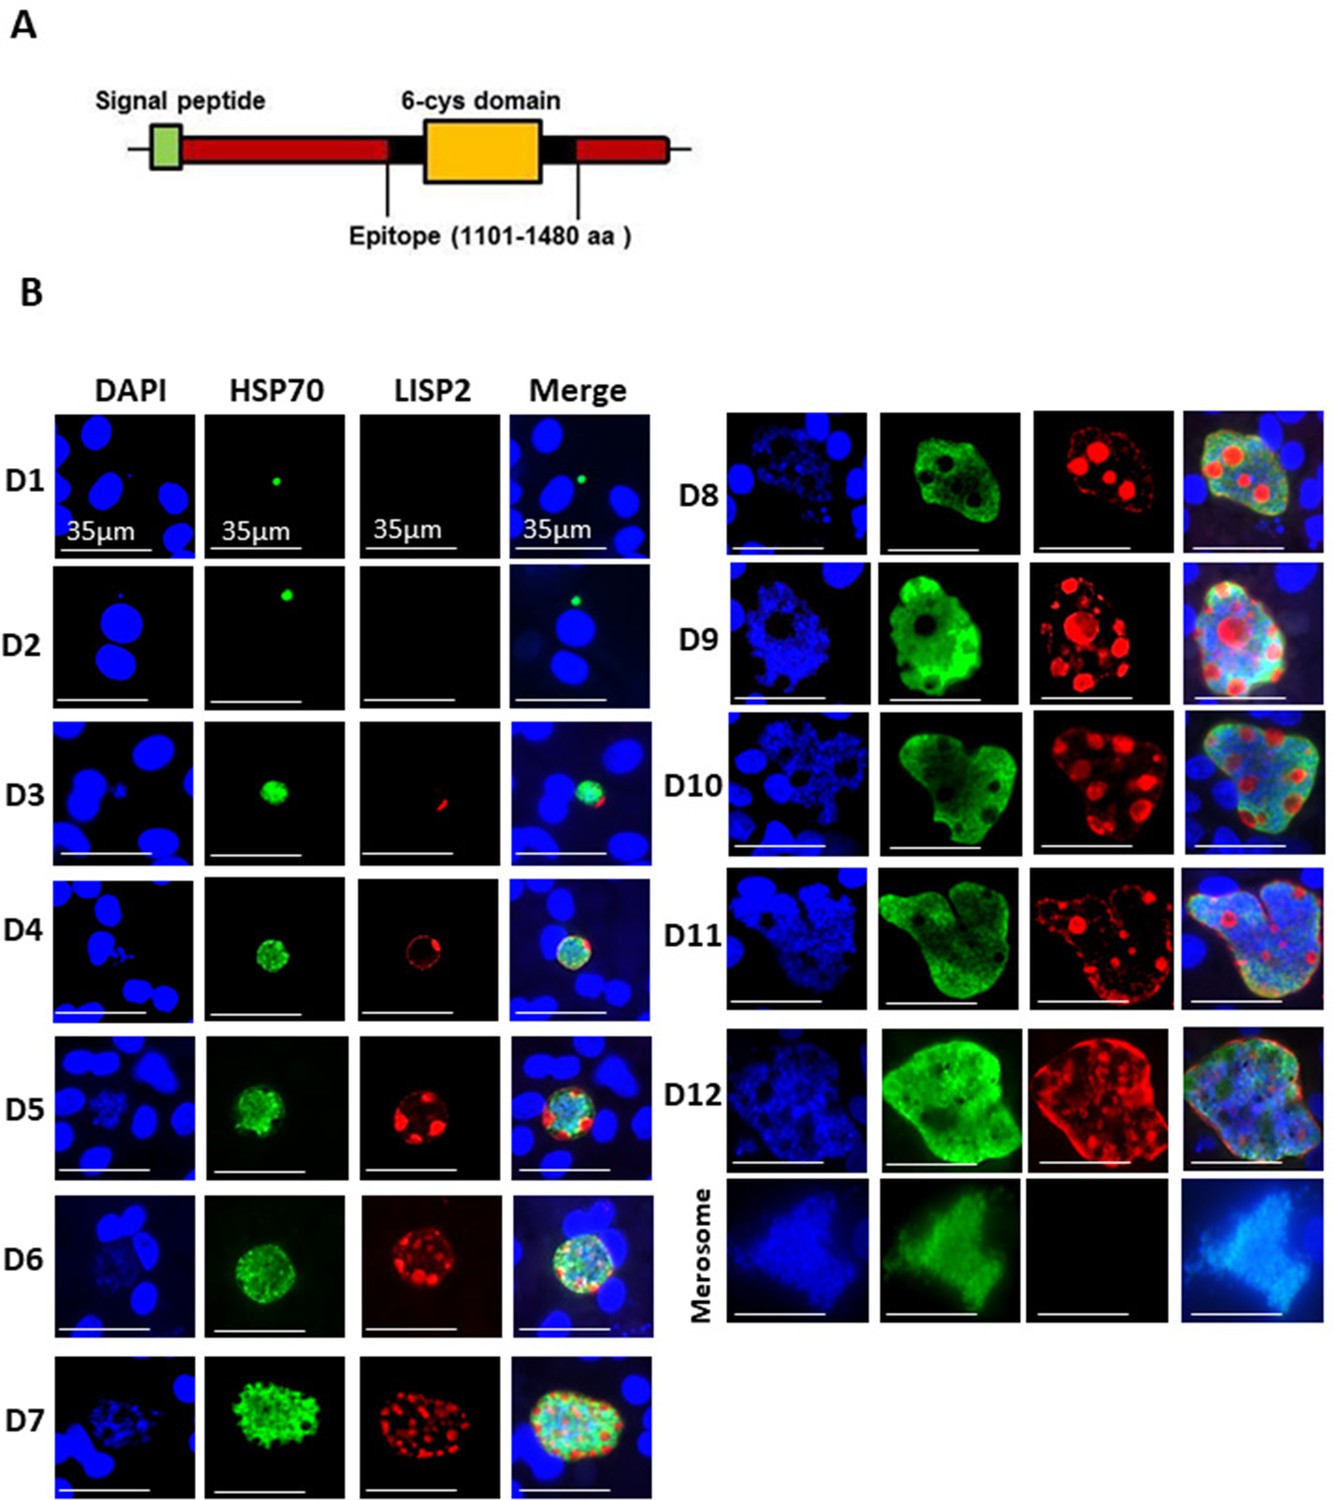
LISP2 marks the beginning of hepatic stage development.
(A) Schematic structure of the LISP2 gene showing the N-terminal signal peptide, 6-cys domain and epitope (highlighted in black) used as immunogen to raise antibodies against P. cynomolgi and P. vivax LISP2 protein (B) Immunofluorescence assay, IFA of P. cynomolgi liver stage parasites in infected simian primary hepatocytes showing liver stage development from day 1 to day 12 post-infection visualized with DAPI for DNA content (blue), a polyclonal antibody specific for P. cynomolgi HSP70 protein (green) and a monoclonal antibody specific for P. cynomolgi LISP2 protein (red); Scale bar, 35 µm. From day 3 onwards, LISP2 staining observed in a crescent shape asymmetrically located on one side of earliest developing parasites (LISP2+). By day 5, LISP2 accumulates in peripheral vacuolar membrane structures in multinucleate schizonts and does not co-localize with DAPI or HSP70 (LISP2++).
Figure 1—figure supplement 1
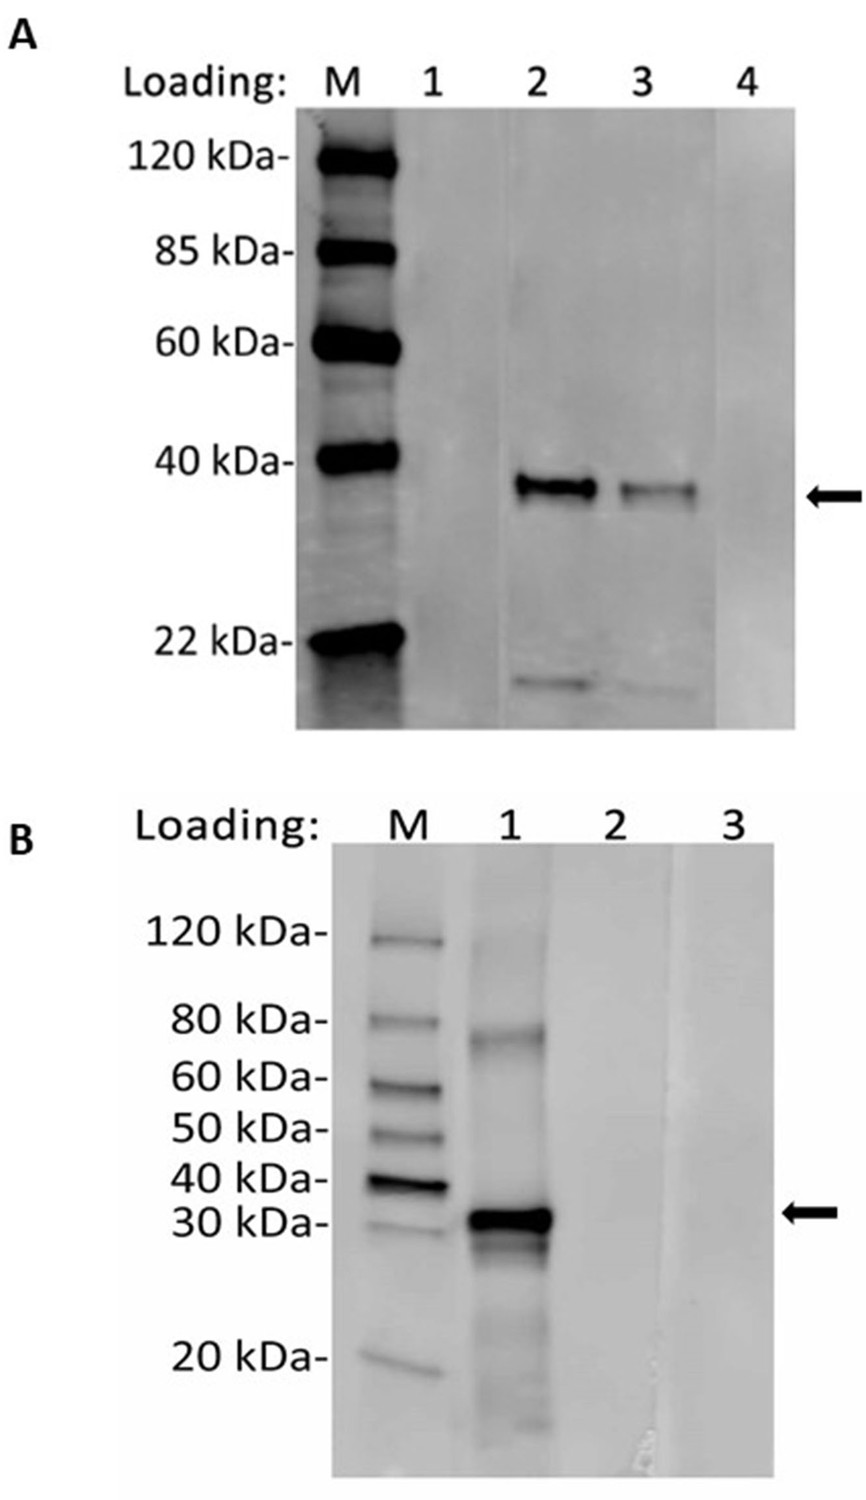
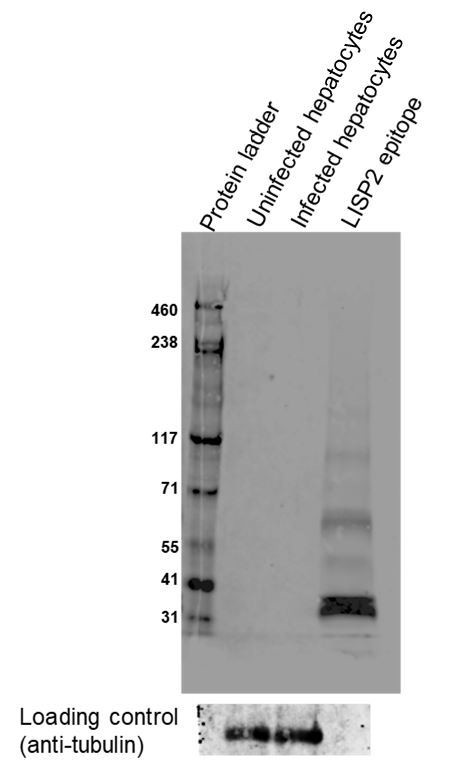
Recognition of recombinant LISP2 antigen with purified anti-LISP2 monoclonal antibody by western blot.
(A) Lane 1, 2 and 4 were loaded with 100 ng of LISP2 antigen, whereas lane 3 with 50 ng of antigen. Lane 2 and lane 3 were probed with anti- PcyM_0307500 (1 µg/ml) and show correct protein band (molecular weight 37 kilodalton), whereas lane 1 was probed with pre-serum and lane 4 represents blank. (B) Lane 1, 2 and 3 were loaded with 100 ng of LISP2 antigen. Lane 1 was probed with anti- PVP01_0304700 (1 µg/ml) show correct protein band (molecular weight 36.3 kilodalton), whereas lane 2 probed with pre-serum and lane 3 represents blank.
Figure 1—figure supplement 2
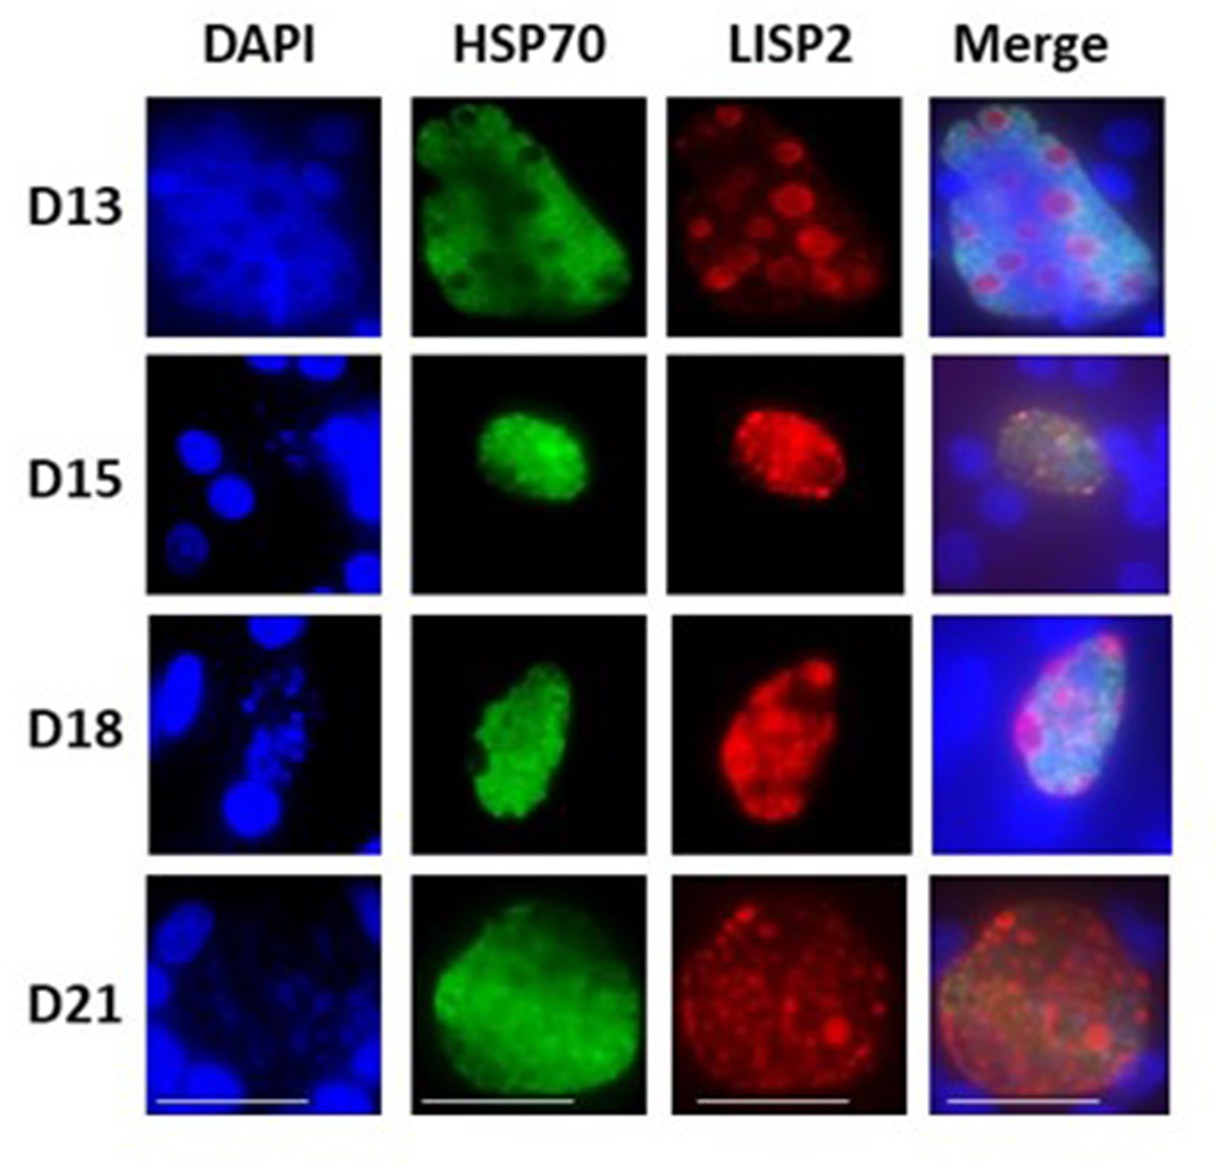
LISP2 expression in liver stages beyond 13 days post-sporozoite infection.
IFA of liver stage parasites in infected simian primary hepatocytes showing liver stage progression at day 13, day 15, day 18 and day 21 post-infection visualized with DAPI for DNA content (blue), a polyclonal antibody specific for P. cynomolgi HSP70 protein (green) and a monoclonal antibody specific for P. cynomolgi LISP2 protein.
Figure 1—figure supplement 3
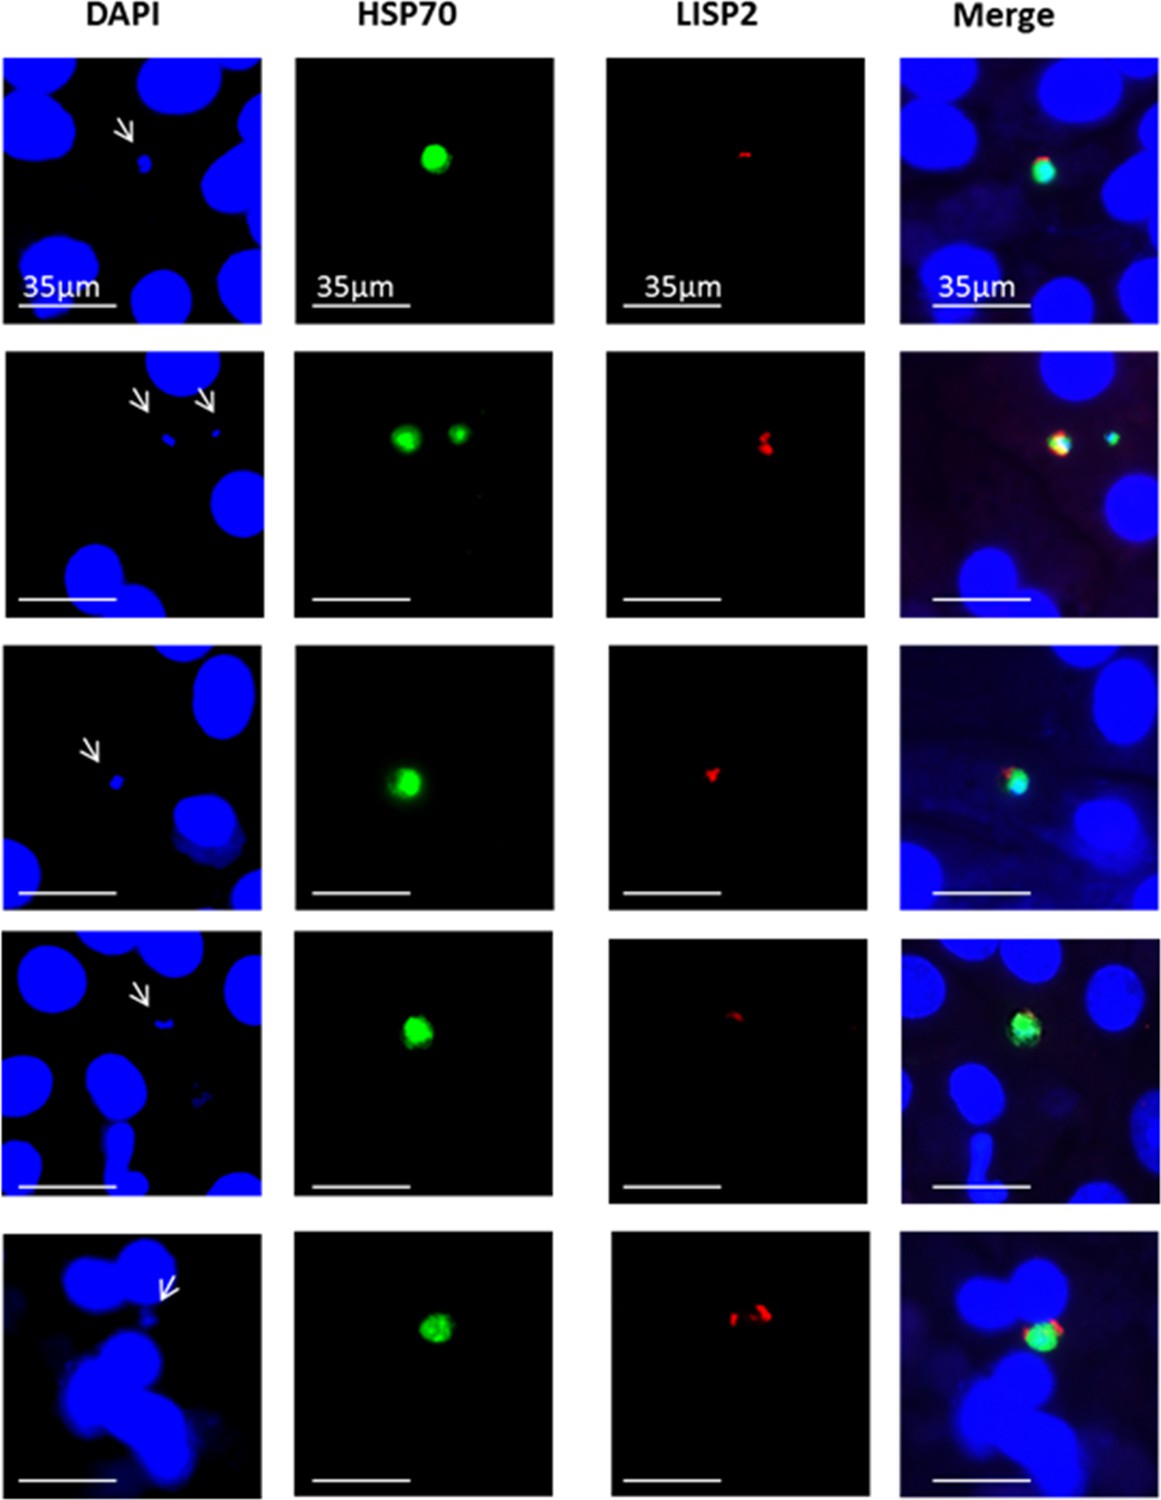
LISP2+ parasites on Day 3 post-infection.
IFA representative images of P. cynomolgi LISP2+ parasites (trophozoite) stained with LISP2 monoclonal antibody (red color) and HSP70 antibody (green color).
Figure 1—figure supplement 4
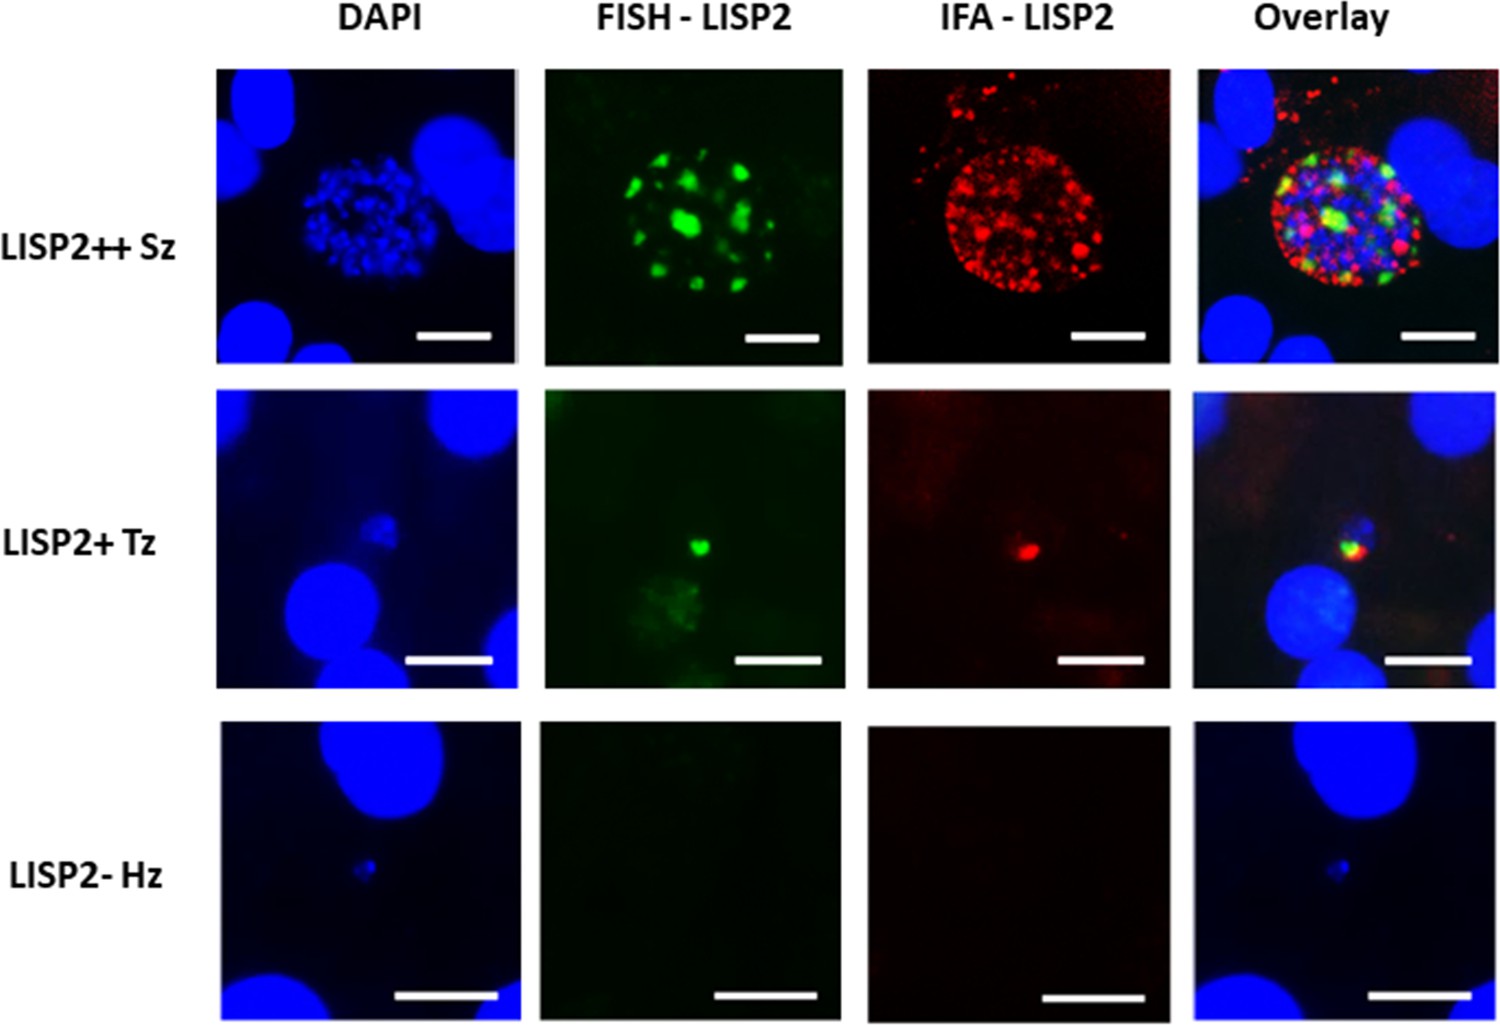
LISP2 fluorescent in situ hybridization (FISH) staining of P. cynomolgi liver stages parasites.
P. cynomolgi day 6 liver stage schizont (LISP2++), early developing trophozoite (LISP2+) and hypnozoite (LISP2-) stained by LISP2 FISH probe (green) and anti-LISP2 monoclonal antibody (red). Scale bar, 10 µm.
Figure 1—figure supplement 5
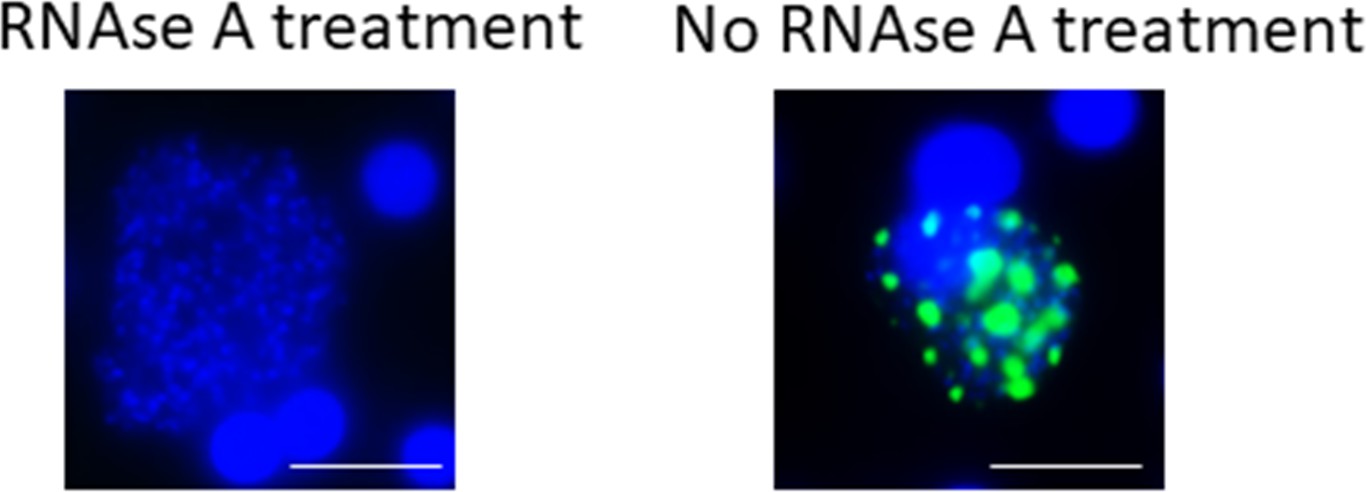
Validation of specific LISP2 RNA-FISH signal.
Images shown are RNA-FISH images of day 6 P. cynomolgi EEF after 30 min RNAse A treatment (@ 5 mg/ml; 30 min at 40°C). RNAse A treatment before hybridization resulted in total disappearance of signal (left image) and revealed the specificity of LISP2 probes (green). (See Materials and methods).
Figure 2 with 1 supplement
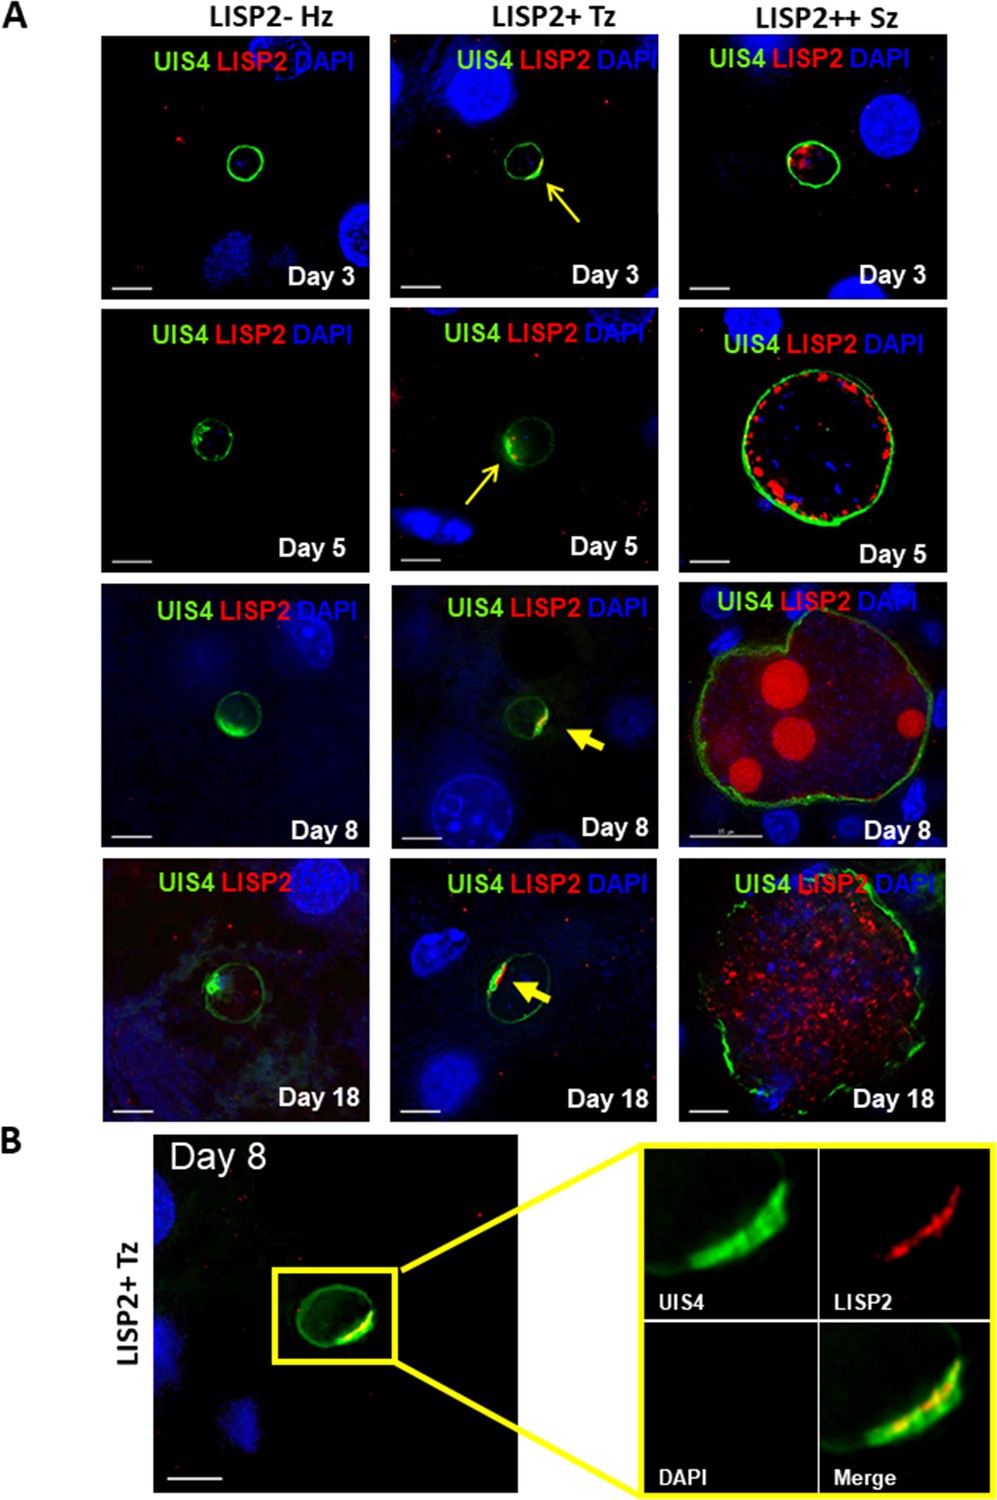
Evaluation of LISP2 expression in P. vivax infected huHep mice.
(A) Hepatic stages of P. vivax infected huHep mice were stained with DAPI (blue), a monoclonal antibody specific for P. vivax LISP2 protein (red) and a monoclonal antibody specific for P. vivax UIS4 protein (green). Representative images of LISP2-, LISP2+ and LISP2++ parasites at days 3, 5, 8 and 18 post-sporozoite infection are shown. (B) Day 8 LISP2+ trophozoite visualized for LISP2 (red) and UIS4 (green). The area in the yellow box is highlighted to show partial overlap of LISP2 and UIS4 localization at or near PVM prominence. Scale bar, 25 µm.
Figure 2—figure supplement 1
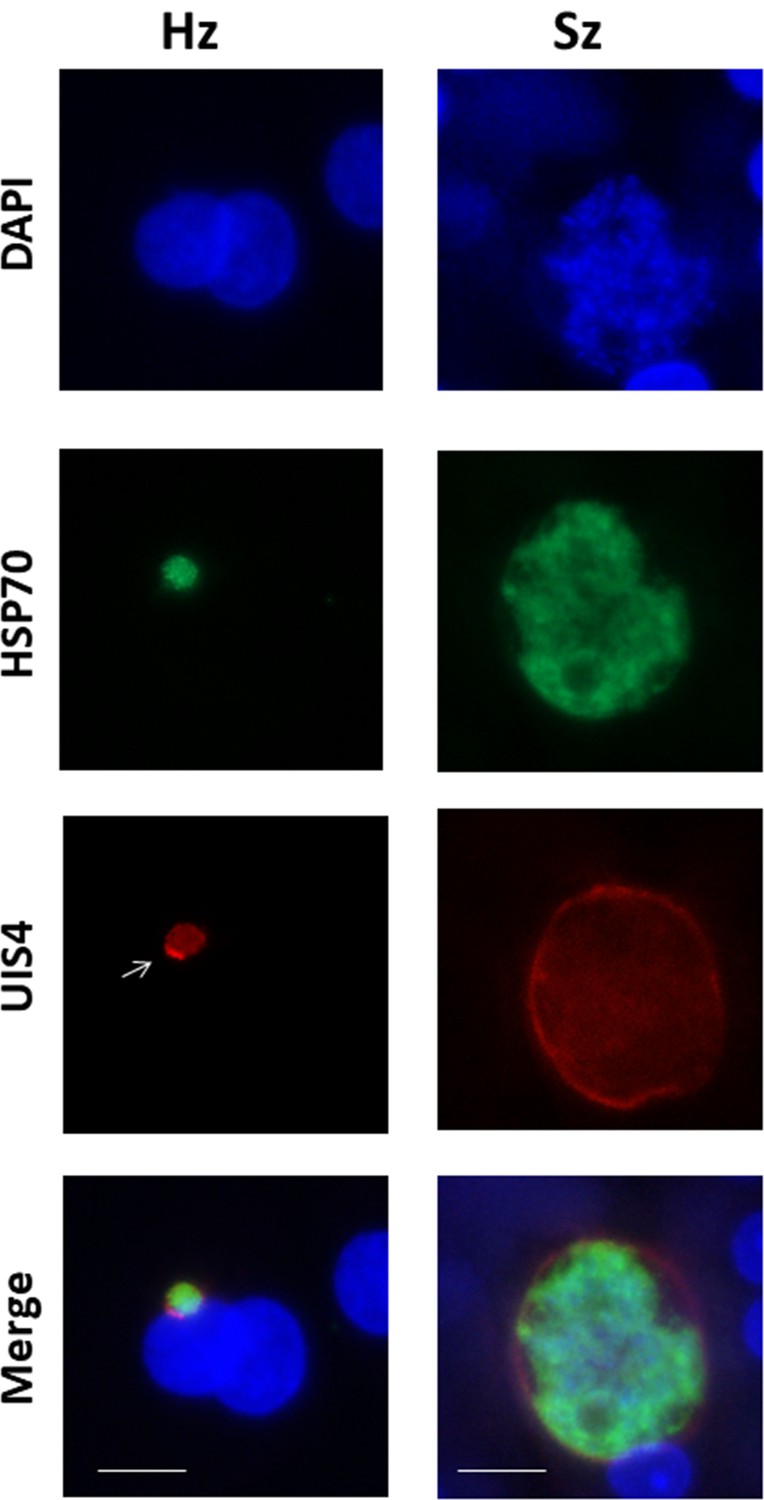
UIS4 (up-regulated in infective sporozoites gene 4) protein localized at the PVM (Parasitophorous vacuole membrane) in P. cynomolgi liver stages.
Liver stages infected with P. cynomolgi sporozoites were visualized at day 6 post-infection with anti-UIS4 polyclonal antibody and anti-HSP70 polyclonal antibody. White arrow indicates the characteristic UIS4 bright staining at one side of PVM, known as UIS4 prominence. UIS4 protein stains the parasite in a circumferential pattern surrounding the parasite in both hypnozoites and schizonts. Scale bar, 10 µm.
Figure 3 with 3 supplements
LISP2 expression distinguishes hypnozoites population from early developing liver stages.
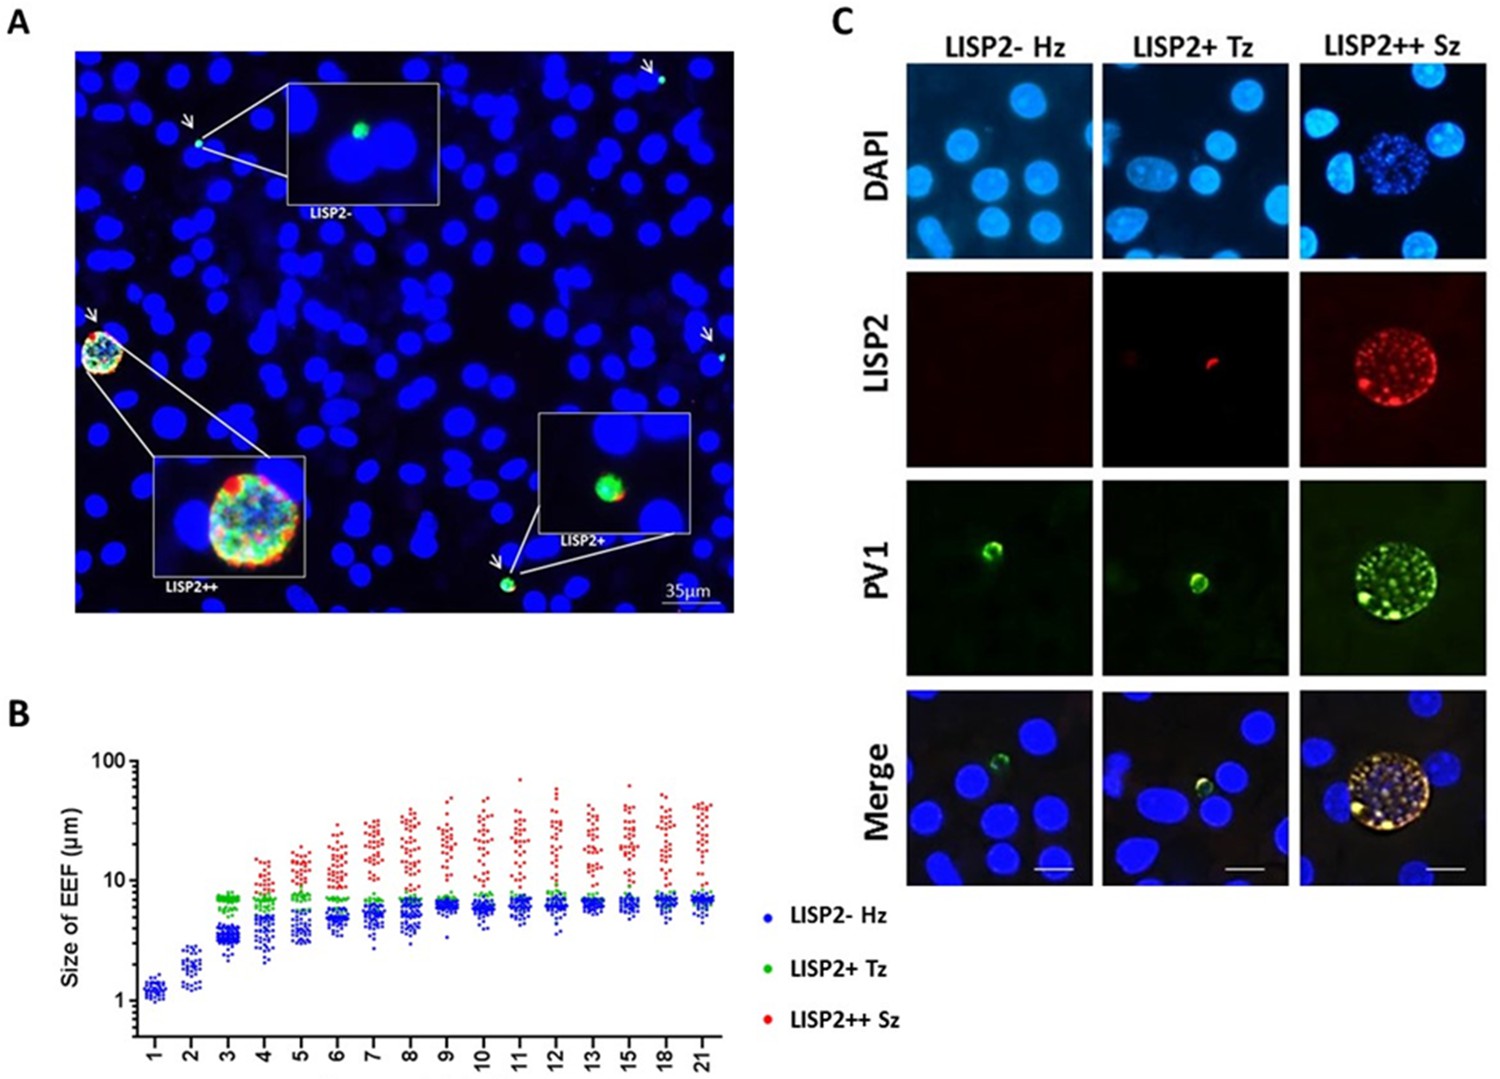
(A) Immunofluorescence assay (IFA) of P. cynomolgi liver stage parasites in simian primary hepatocytes 6 days after sporozoite inoculation visualized with DAPI for DNA content (blue), a polyclonal antibody specific for P. cynomolgi HSP70 protein (green), a monoclonal antibody specific for P. cynomolgi LISP2 protein (red). Scale bar, 35 µm. Merged IFA image showing P. cynomolgi three distinct hepatic parasite populations at day 6 post-infection: LISP2- (green), LISP2+ (weak red crescent staining) and LISP2++ (strong red peripheral and vacuolar staining). (B) Growth kinetic of three distinct P. cynomolgi parasite populations, dormant hypnozoites (LISP2-), early developing trophozoite (LISP2+) and growing schizonts (LISP2++). Data for size (the diameter of the parasite) are from three independent experiments. The cumulative number of cells measured in three biological experiments for each time point from day 1 to day 21 was ≥90. (C) P. cynomolgi hepatic stages stained with LISP2 and PV1 (parasitophorous vacuole 1), a marker of PV at day 6 post-sporozoite infection. LISP2+ trophozoite and LISP2++ schizonts showed co-localization of LISP2 and PV1. In contrast, hypnozoites were devoid of any signal from anti-Pc LISP2 and were stained only by anti-Pc PV1. Scale bar, 25 µm. The source data is available for Figure 3B (see source data file Figure 3).
-
Figure 3—source data 1
Growth kinetics data of different liver populations for 21 days post-infection.
- https://doi.org/10.7554/eLife.43362.015
Figure 3—figure supplement 1
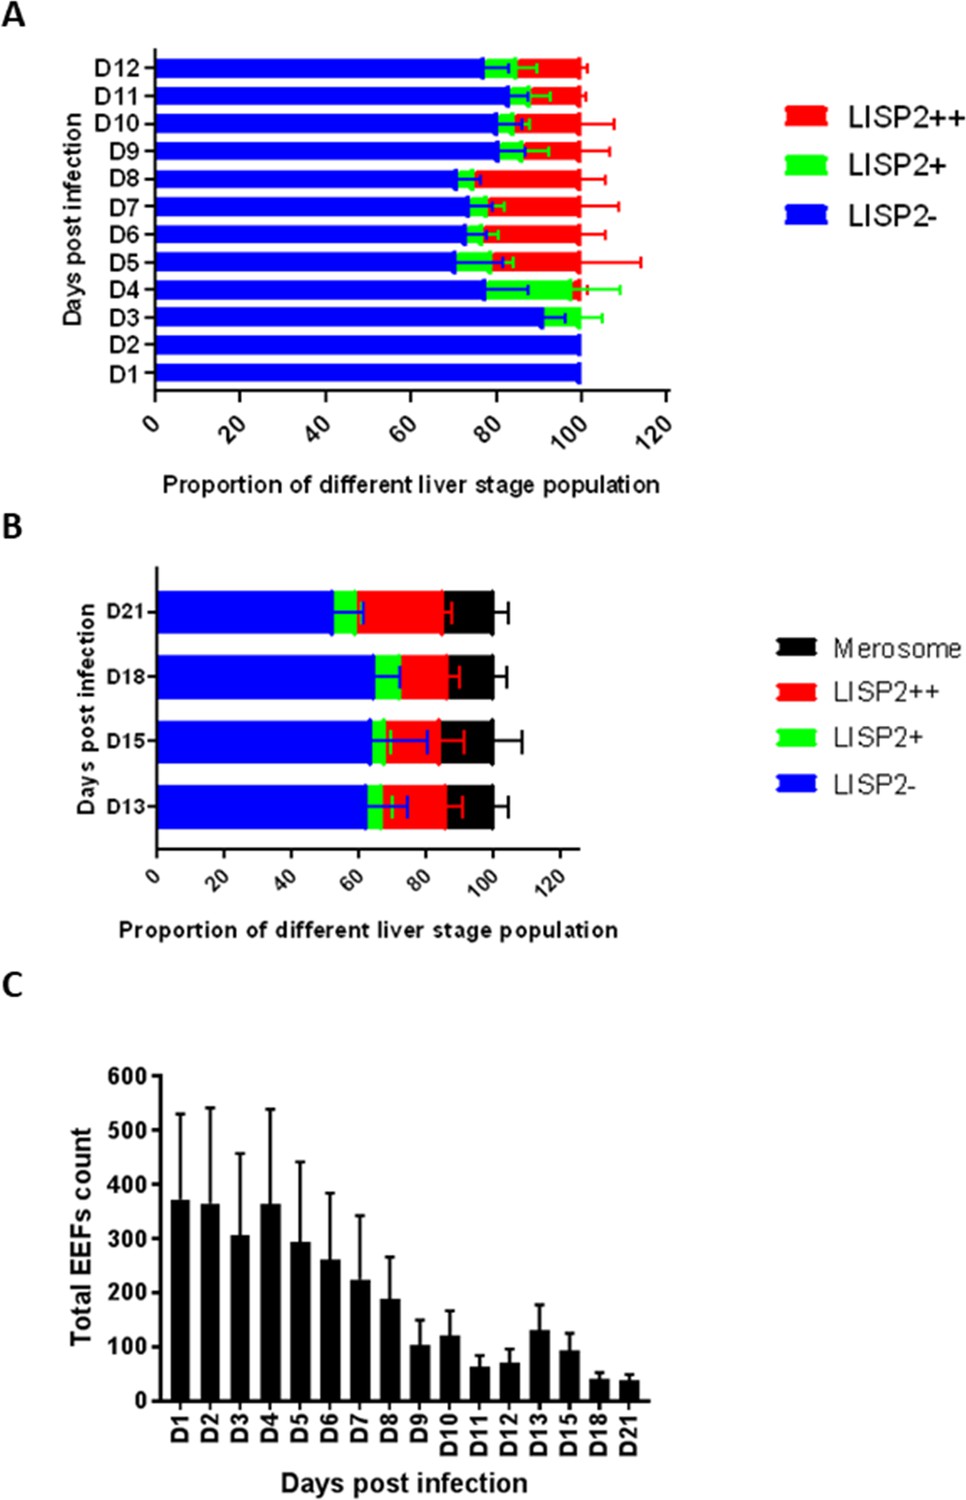
Relative quantitative analysis of LISP2 expressing parasites.
(A) From day 1 to day 12 post-infection, the relative proportion of all three LISP2 parasites populations in monolayer infection are shown in panel A. (B) Panel B show the relative proportion of all three LISP2 parasites populations and merosomes in matrigel overlay system from day 13 to day 21 post-infection. Blue bars represent dormant hypnozoites (LISP2-), green bars are activated hypnozoites (LISP2+), red bars correspond to schizonts (LISP2++) and black bars represent merosomes. (C) Panel C show the total count of parasites at each time points from day 1 to day 21 post-sporozoite infection. The data shown in the graph (A–C) represents mean with s.d from three independent batches of hepatocytes and sporozoites (N = 3). For each independent experiment, total number of parasites at each time point was deduced from three technical replicate wells (n = 3).
-
Figure 3—figure supplement 1—source data 1
Relative proportion of LISP2 expressing parasites and total number of parasites assayed for 21 days post-infection.
- https://doi.org/10.7554/eLife.43362.012
Figure 3—figure supplement 2
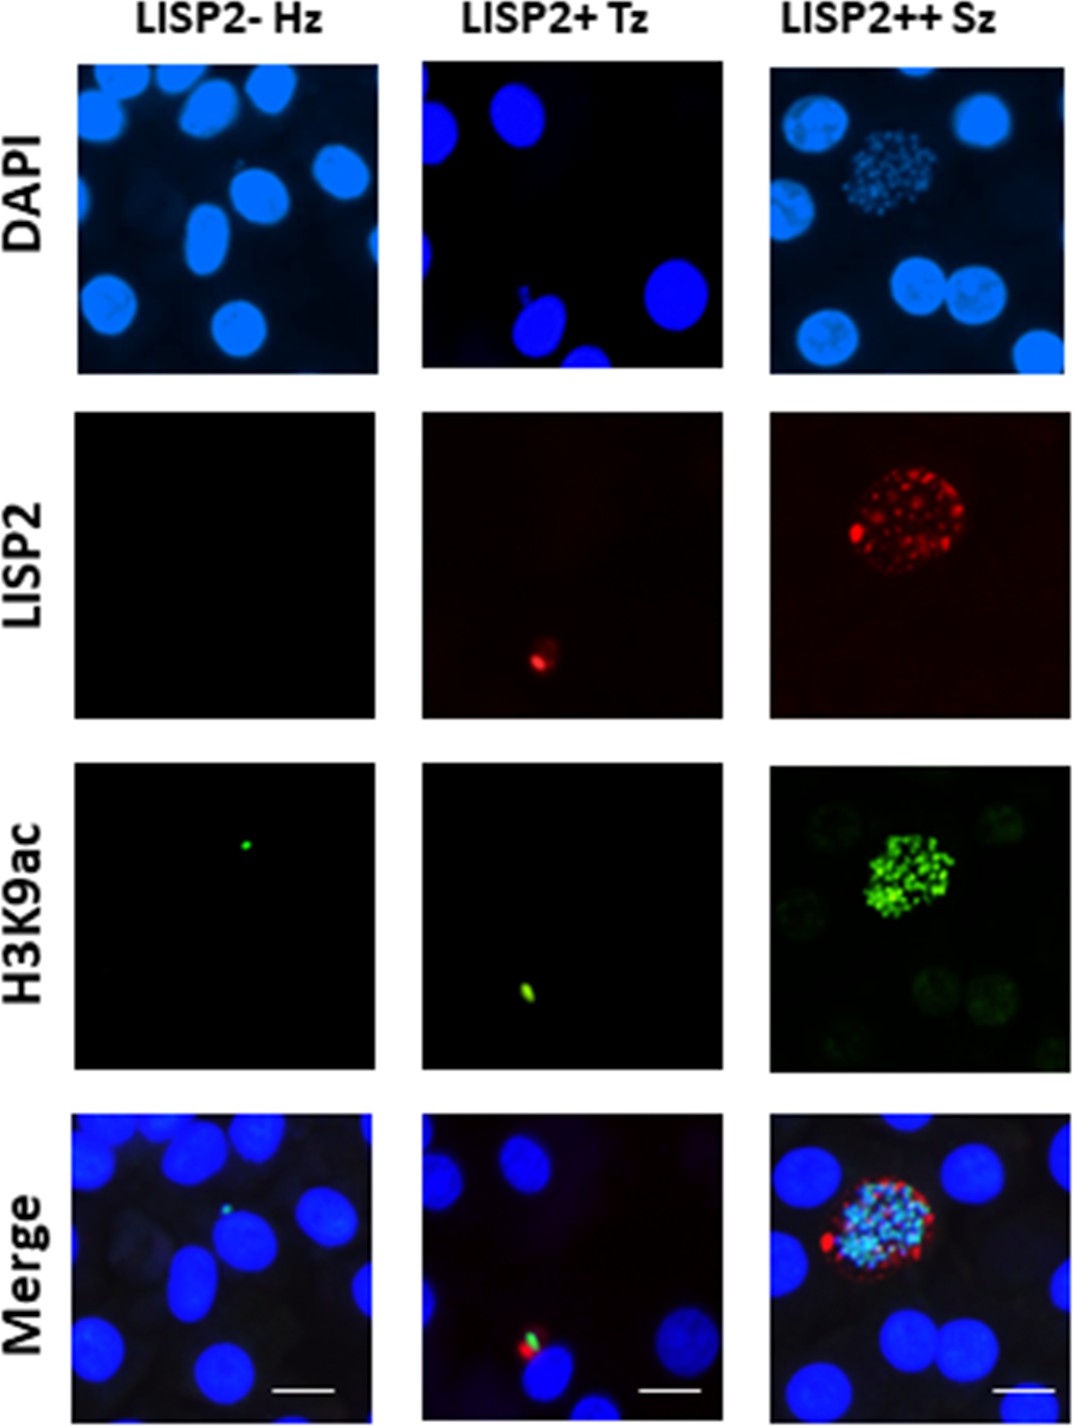
Assessment of viability of P. cynomolgi liver stages.
Day 6 P. cynomolgi infected hepatocytes probed with anti-H3K9ac antibody, a well-known transcriptionally active marker in malaria parasite. IFA images of co-localization of H3K9ac and LISP2 in transcriptionally active hypnozoites, trophozoites and schizont are shown here. Scale bar, 20 µm.
Figure 3—figure supplement 3
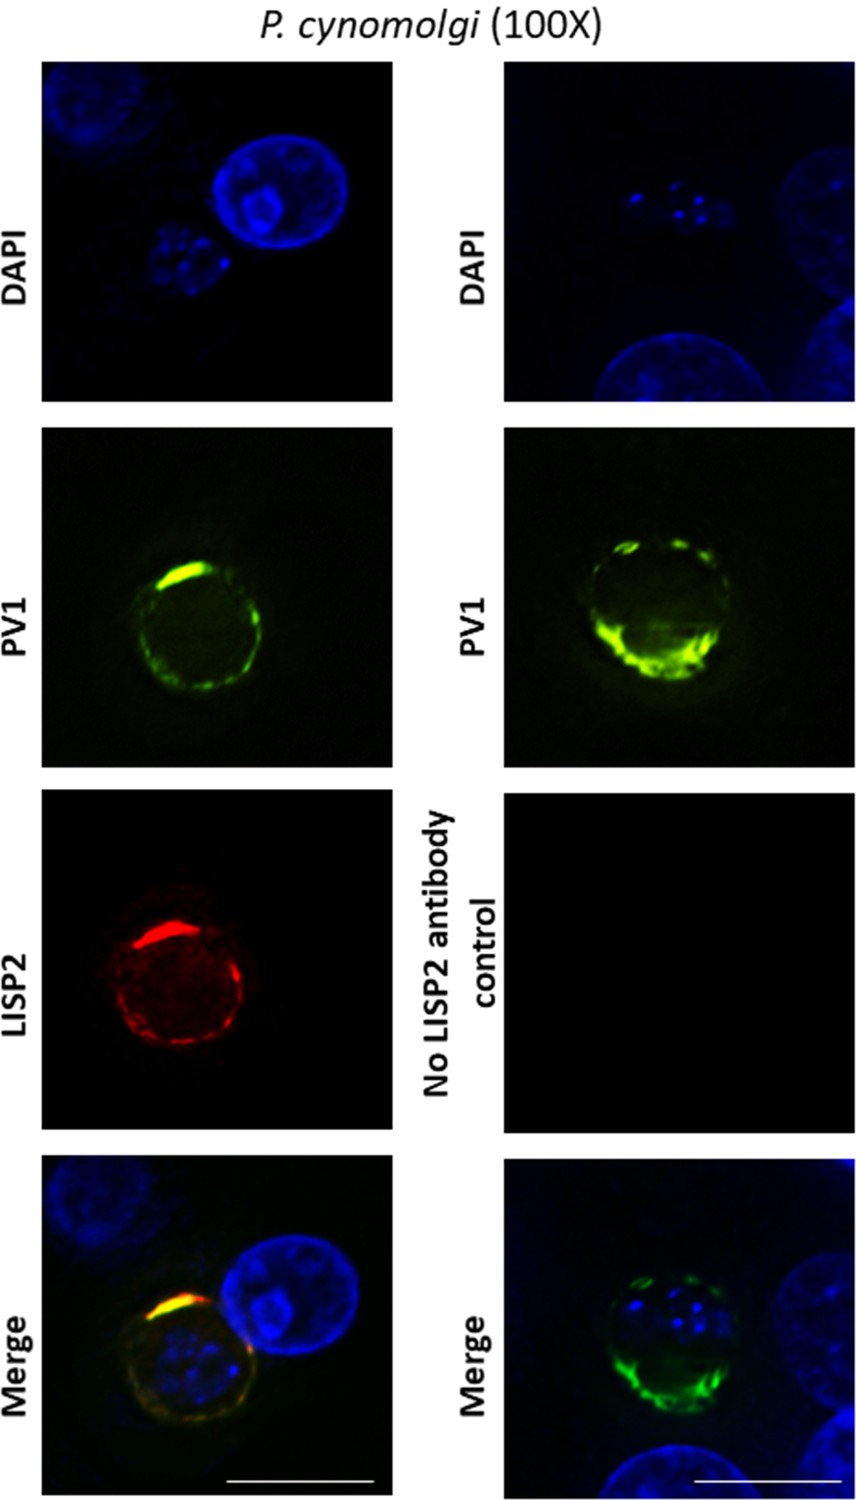
Co-localization of PV1 and LISP2 at parasitophorous vacuole.
Deconvoluted high-resolution IFA images of day 5 hepatic stages co-stained with PV1 and LISP2 with 100X magnification (oil) are shown. Here scale bar represents 25 µm.
Figure 4 with 1 supplement
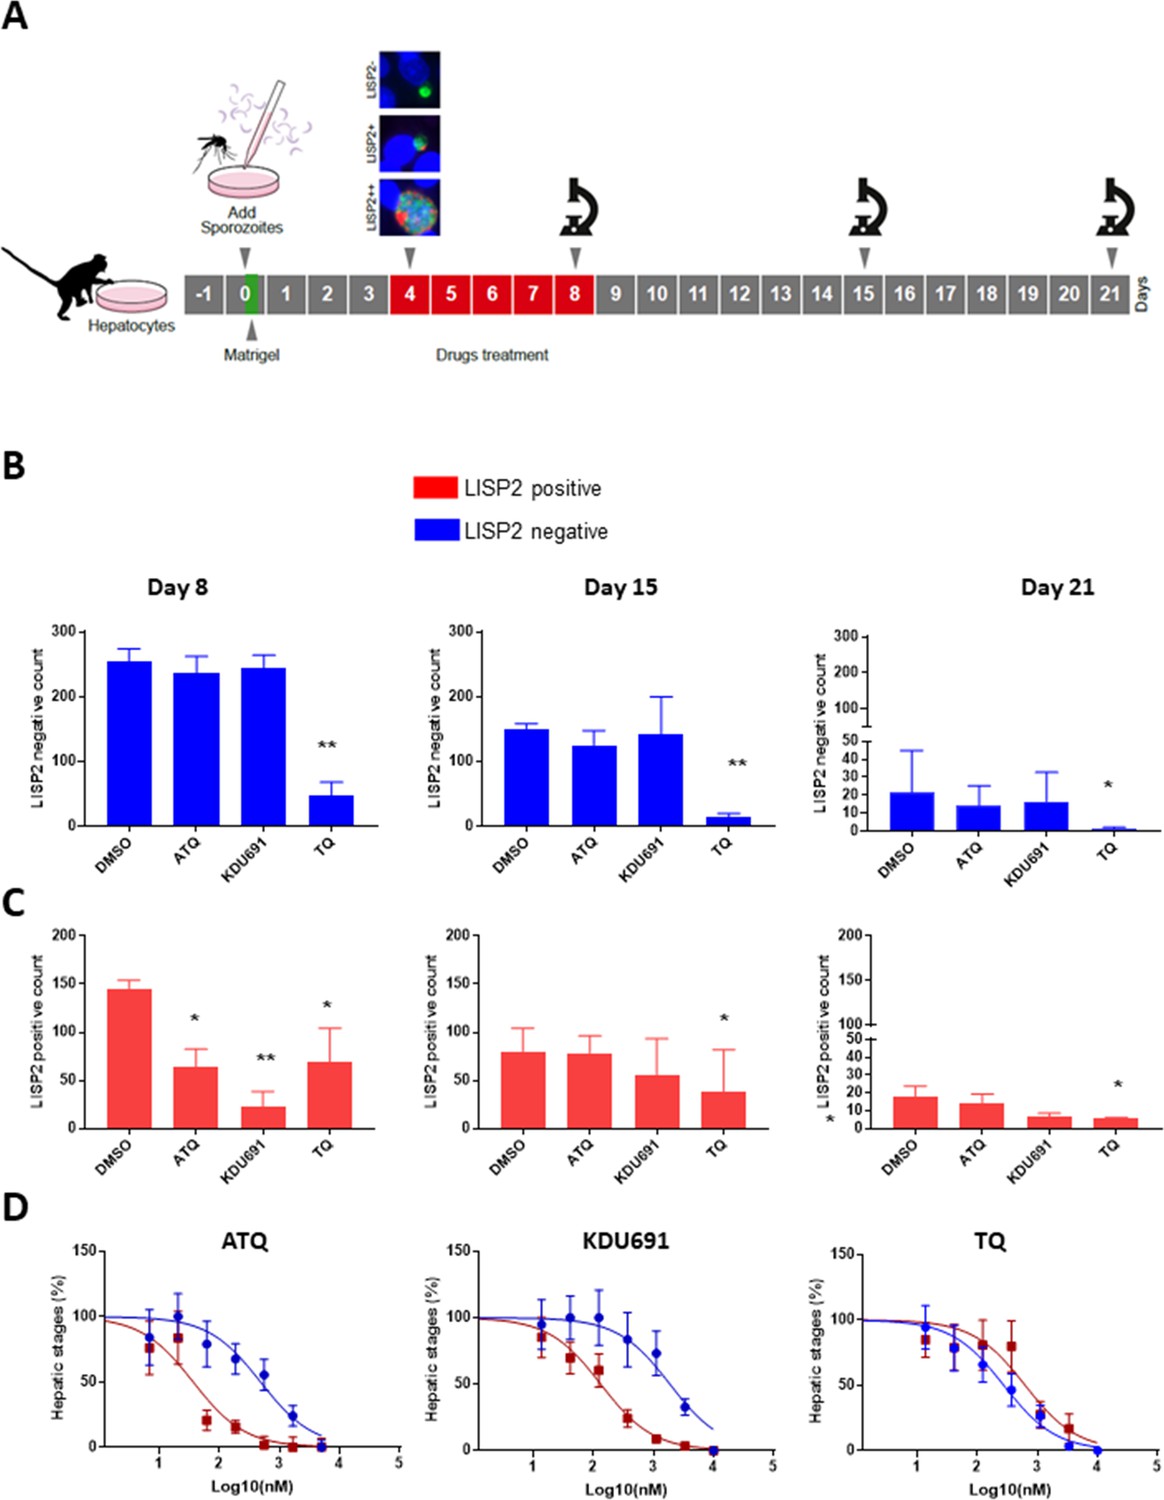
LISP2 negative parasites are refractory to PI4K inhibition but sensitive to 8-aminoquinoline drugs.
(A) Simian primary hepatocytes infected with P. cynomolgi parasites were exposed to ATQ (0.25 µM), KDU691 (0.5 µM) and TQ (1 µM) from day 4 to day 8 post-infection. The effects of drug treatments were compared to untreated control (DMSO) at day 8, day 15 and day 21 post-infection; p value is assessed by statistical one–tailed t test with *p<0.05 and**0.01, respectively. (B) Blue bars show drug effects on persistent LISP2- hypnozoites. (C) Red bars represent drug effects on LISP2-positive parasites. (D) Dose response curve for ATQ, KDU691 and TQ are shown. The blue curves represent drug activity against hypnozoite (LISP2-) and red curves show activity against LISP2 positive parasites. The IC50 (inhibitory concentration) of KDU691 against LISP2- hypnozoites and LISP2 expressing parasites were 1.8 µM and 0.13 µM. The IC50 of ATQ for LISP2- and LISP2 expressing parasites were 0.48 µM and 0.036 µM, respectively. The graph bar in Figure 4B and C represent mean with standard deviation (s.d) from five technical replicates in two independent biological assays, whereas in Figure 4D from three independent biological assays. The source data is available for Figure 4 (see source data file Figure 4).
-
Figure 4—source data 1
In vitro radical cure mode assay for liver stage.
- https://doi.org/10.7554/eLife.43362.024
Figure 4—figure supplement 1
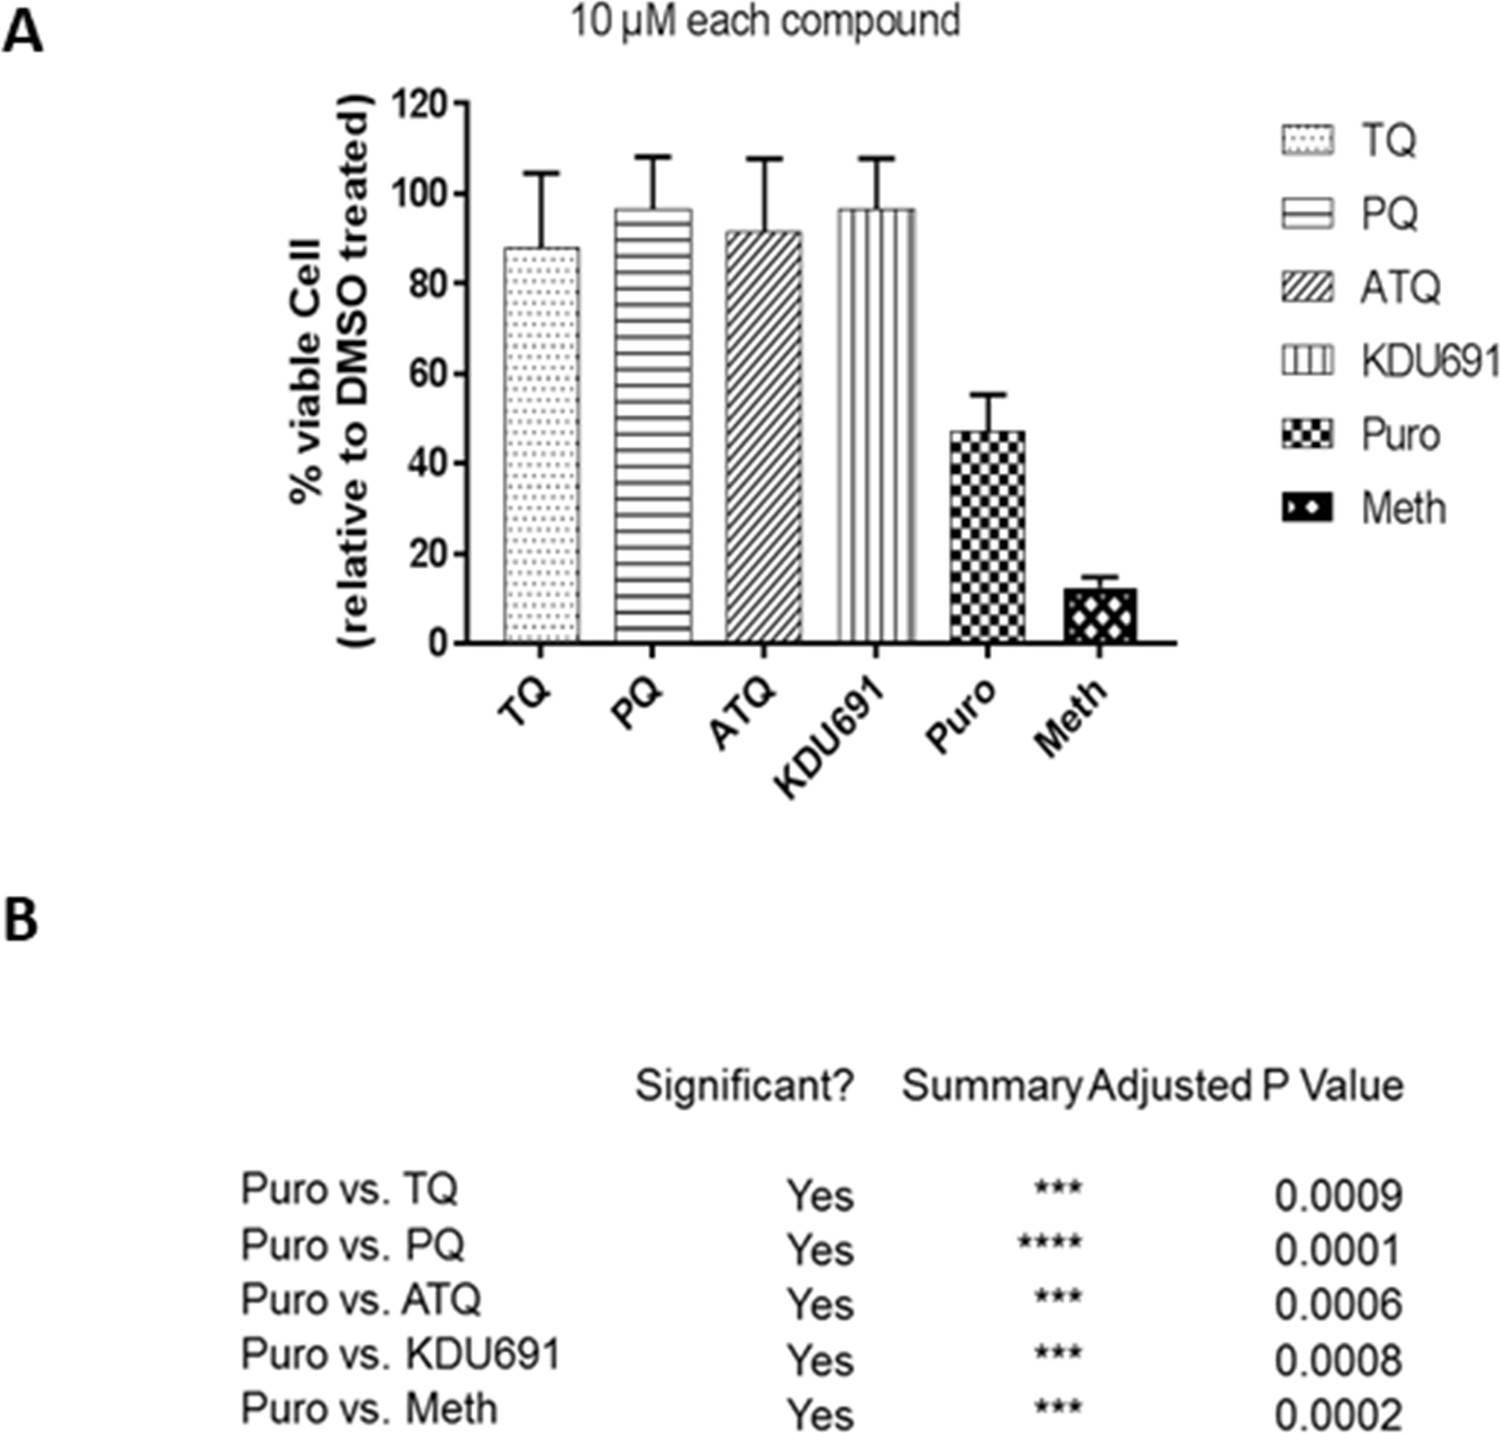
Cytotoxic cell survival assay.
(A) Uninfected simian primary hepatocytes were treated from day 4 to day 8 with tafenoquine (TQ), KDU691, atovaquone (ATQ) and primaquine (PQ) at 10 µM. Cell viability relative to untreated (DMSO) was determined and is reported in %; (B) The known cytotoxic compound puromycin (Puro) and short methanol (Meth) treatment to stop cell metabolism were used as positive control and the table shows the statistical significance level of the relative drugs effects through ANOVA analysis for each of the compounds tested.
-
Figure 4—figure supplement 1—source data 1
Cell cytotoxicity assay data.
- https://doi.org/10.7554/eLife.43362.023
Figure 5
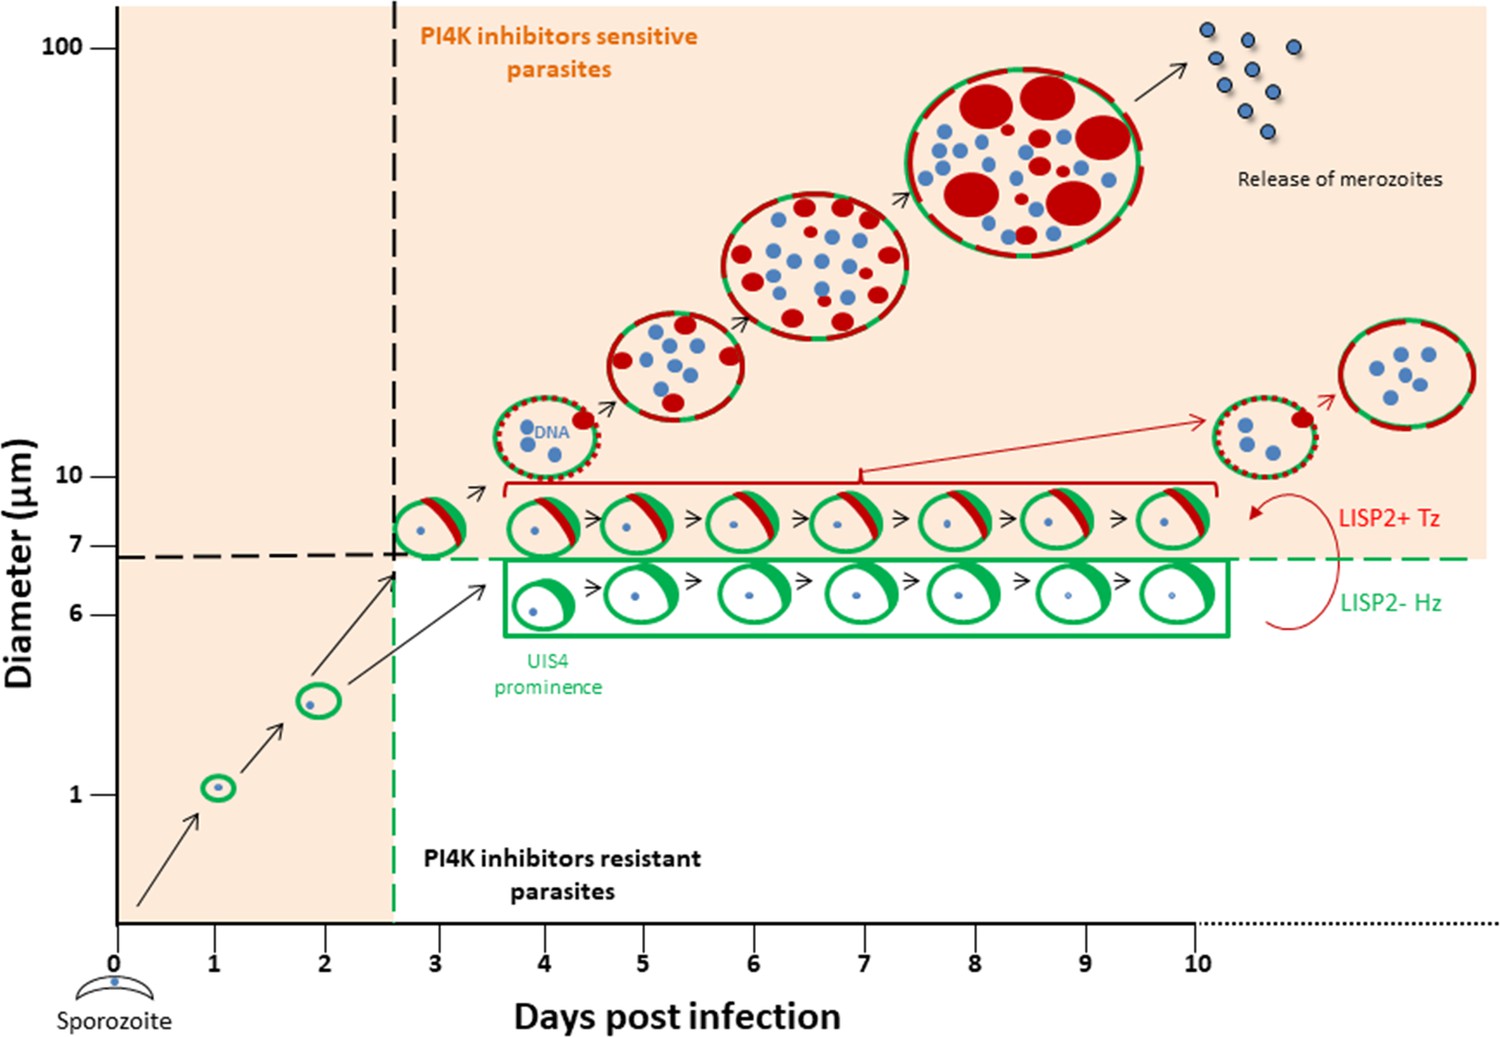
Schematic model to distinguish hypnozoites from other liver stages based on PI4K drug susceptibility.
Malaria liver stage infection begins when infective sporozoites injected by mosquitoes invade host hepatocytes. Within hepatocytes, sporozoites transform into hepatic schizonts for 7–9 days and subsequently, mature schizonts burst and release pathogenic merozoites into blood circulation (Prudêncio et al., 2011). Sporozoite transformation into early liver stage development coincides with LISP2 expression. LISP2 expression marks the beginning of liver stage development at day 3 and its expression increases as liver stage progresses into complete maturation. Sporozoites of relapsing malaria species such as P. vivax and P. cynomolgi can generate dormant hypnozoites (Wells et al., 2010). LISP2- Hz exhibits UIS4 prominence on PVM (shown in green) and grows till day 5 and remains persistent and unchanged from day 5 onwards. LISP2 +Tz display crescent staining pattern (shown in red) which colocalizes with UIS4 protein on PVM. Beyond day 6 post-sporozoite infection, both LISP2- Hz and LISP2+ Tz have identical size and can only be discriminated on the basis of susceptibility to PI4K inhibitor. The shaded areas (in orange) represent the parasite that can be eliminated by both PI4K inhibitors and 8-aminoquinoline drugs. The non-shaded area in the model represents only LISP2- Hz which is resistant to PI4K and can be eliminated only by 8-aminoquinoline drugs. List of supplemental tables.
Author response image 1
Videos
Video 1
Co-localization of H3K9ac and LISP2.
Reconstructed 3-D movie of schizonts using de-convoluted Z stack images co-stained with DAPI (blue color), H3K9ac (green color) and LISP2 (red color).
Video 2
Co-localization of PV1 and LISP2 at parasitophorous vacuole.
Day 6 infected hepatocytes co-stained with DAPI (blue; see Video 3), PV1 (green; see Video 4) and LISP2 (red; see Video 5). 30–40 stacks of images were acquired with 100X objective lens with Z-step size of 0.3 μm. Three-Dimensional movies of the merged channel (in yellow color) and individual channels reconstructed using deconvoluted z-stack images are shown.
Video 3
Three-dimensional movie of the day 6 infected hepatocytes stained with DAPI (blue).
Each movie is made from 30 to 40 stacks of images acquired with 100X objective lens with Z-step size of 0.3 μm.
Video 4
Three-dimensional movie of the day 6 infected hepatocytes stained with PV1 (green).
Each movie is made from 30 to 40 stacks of images acquired with 100X objective lens with Z-step size of 0.3 μm.
Video 5
Three-dimensional movie of the day 6 infected hepatocytes stained with LISP2 (red).
Each movie is made from 30 to 40 stacks of images acquired with 100X objective lens with Z-step size of 0.3 μm.
Tables
Key resources table
| Reagent type (species) or resource | Designation | Source or reference | Identifiers | Additional information |
|---|---|---|---|---|
| Biological sample (Macaca mulatta) | Primary simian hepatocytes | Biomedical Primate Research Centre, Netherlands | Freshly isolated from Macaca mulatta, | |
| Biological sample (Macaca fascicularis) | Primary simian hepatocytes | SingHealth, Singapore | Freshly isolated from Macaca fascicularis | |
| Biological sample (P. cynomolgi) | sporozoites | Armed forces research institute of medical sciences (AFRIMS) Bangkok | Anopheles dirus mosquito infected with P. cynomolgi | |
| Biological sample (P. cynomolgi) | sporozoites | Biomedical Primate Research Centre, Netherlands | Anopheles stephensi mosquito infected with P. cynomolgi | |
| Biological sample (P. vivax) | sporozoites | Mahidol University | Anopheles dirus mosquito infected with P. vivax | |
| Antibody | Mouse anti-LISP2 antibody (monoclonal) | this paper | synthesized by genscript; IFA (1:500) | |
| Antibody | Rabbit anti-PV1 antibody (polyclonal) | this paper | synthesized by genscript; IFA (1:500) | |
| Antibody | Rabbit anti-HSP70 antibody (polyclonal) | this paper | synthesized by genscript; IFA (1:2000) | |
| Antibody | Rabbit anti-H3K9ac antibody (monoclonal) | Abcam, | ab177177 | IFA (1:1000) |
| Antibody | Alexa 488-conjugated goat anti-rabbit immunoglobulin (polyclonal) | Invitrogen | 11034 | IFA (1:4000) |
| Antibody | Alexa 594-conjugated goat anti-mouse immunoglobulin (polyclonal) | Invitrogen | 11032 | IFA (1:5000) |
| Sequence- based reagent | RNA FISH probes | this paper | Synthesized by Advanced Cell Diagnostics | |
| Commercial assay or kit | CCK-8 kit | Sigma | 96992 100TESTS-F | |
| Chemical compound, drug | KDU691 | Novartis internal chemical library | Synthesized by Novartis | |
| Chemical compound, drug | Atovaquone (ATQ) | Novartis internal chemical library | Synthesized by Novartis | |
| Chemical compound, drug | Tafenoquine (TQ) | Novartis internal chemical library | Synthesized by Novartis | |
| Chemical compound, drug | DMSO | Sigma | D8418 |
Additional files
-
Supplementary file 1
List of genes that were detected above >10 FPKM (Fragments Per Kilobase per Million) in hypnozoite (727 genes) and that were in the top 5% genes expressed in schizonts (134 genes).
The data listed in the table derived from Voorberg et al, 2017. (Sz is schizont; three replicates and Hz is hypnozoite; four replicates)
- https://doi.org/10.7554/eLife.43362.026
-
Transparent reporting form
- https://doi.org/10.7554/eLife.43362.027
Download links
A two-part list of links to download the article, or parts of the article, in various formats.
Downloads (link to download the article as PDF)
Open citations (links to open the citations from this article in various online reference manager services)
Cite this article (links to download the citations from this article in formats compatible with various reference manager tools)
The Plasmodium liver-specific protein 2 (LISP2) is an early marker of liver stage development
eLife 8:e43362.
https://doi.org/10.7554/eLife.43362


