Disordered breathing in a mouse model of Dravet syndrome
- University of Connecticut, United States
Figures
Figure 1 with 1 supplement
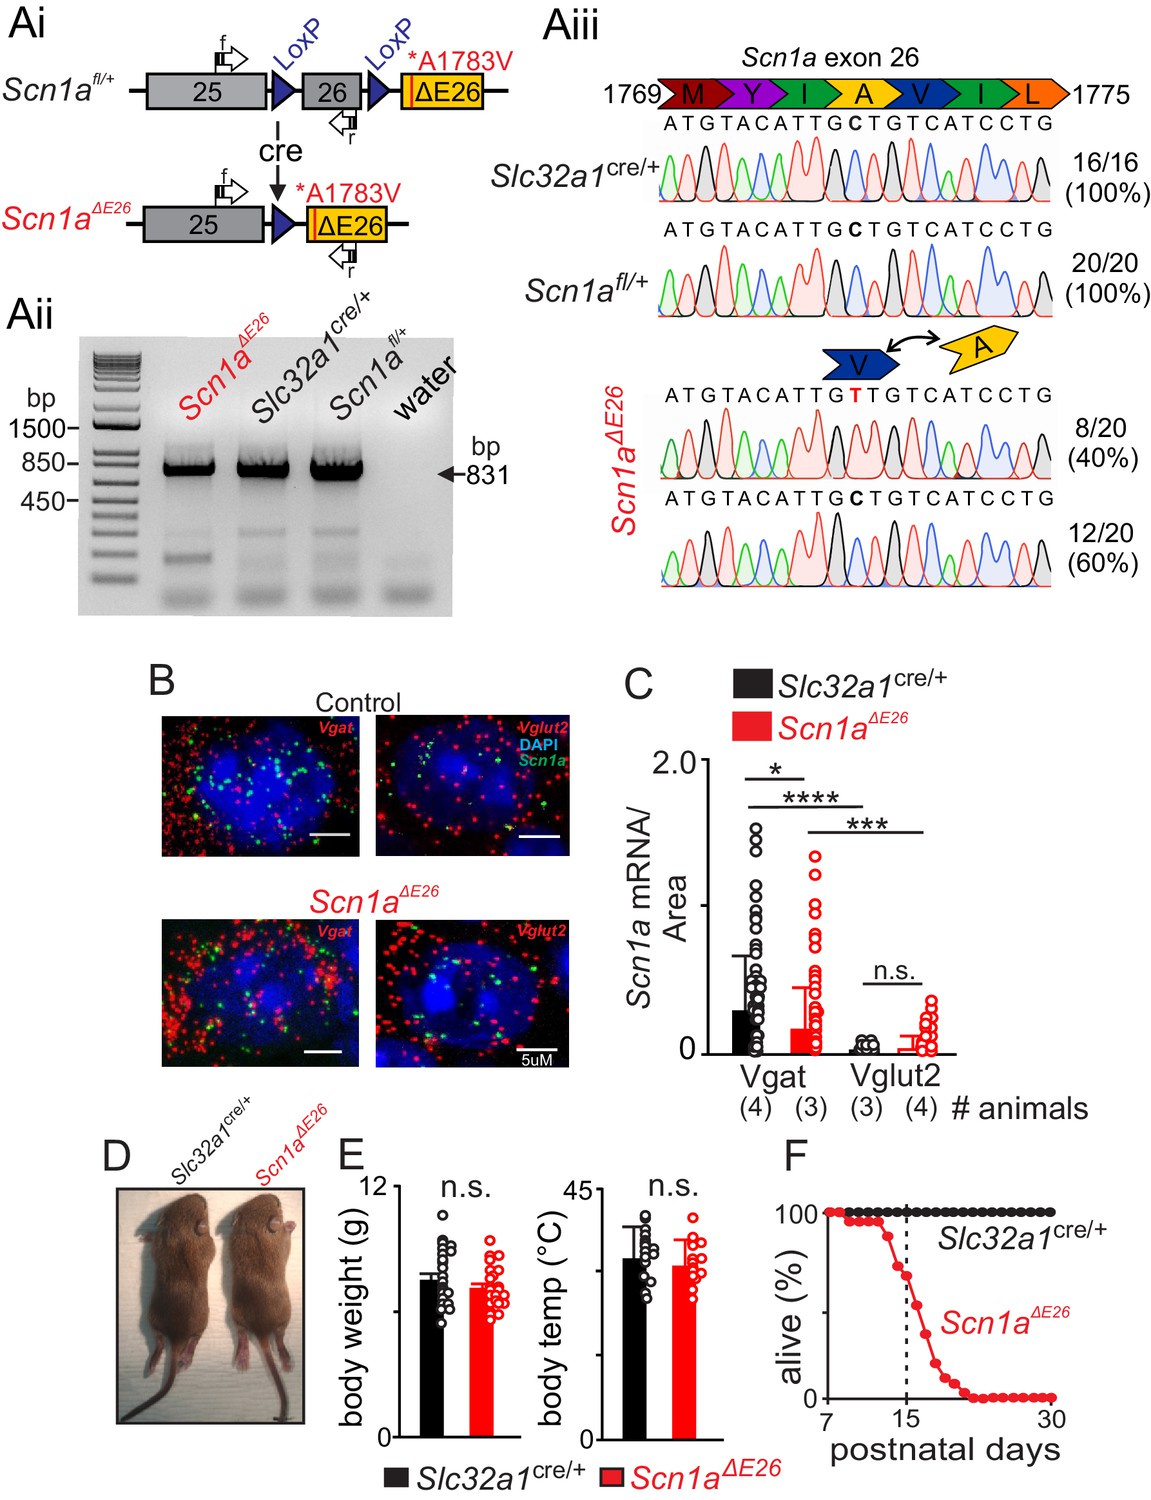
Conditional expression of Scn1a A1783V in inhibitory neurons results in premature death.
(A) Construct design and validation of A1783V variant transcript expression. Note that this line was developed by Ana Mingorance (Chief Development Officer of the Loulou Foundation) and is available at JAX (sock # 026133). Ai, schematic shows loxP sites flanking wild type exon 26 followed by an edited version of exon 26 that contains the human A1783V pathological variant (ΔE26). When Cre recombinase is expressed, wild type exon 26 is removed, thus allowing transcription of ΔE26. Aii, Agarose gel shows detectable levels of Scn1a transcript (expected size of 831 bp) in brainstem tissue isolated from each genotype (primers span between exon 25 and 26, including residue 1783 of exon 26). Water was used as a no template negative control. Aiii, PCR products were sequenced to confirm that transcript containing A1783V is detectable in 40% of samples from Scn1aΔE26 tissue but was not detectable in samples from Slc32a1cre/+ and Scn1afl/+ control tissue. (B–C), fluorescent in situ hybridization (RNAScope) was performed to characterize expression of Scn1a transcript in inhibitory (Slc32a1+, Slc32a1) and glutamatergic (Vglut2+, Slc17a6) neurons in the RTN region in brainstem sections from control and Scn1aΔE26mice. (B) brainstem sections from Slc32a1cre/+ and Scn1aΔE26 mice containing the RTN show Scn1a labeling (green puncta) of both Vgat+ and Vglut2 +neurons. (C), summary data show Scn1a transcript expression (normalized to cell size) in Vgat+ and Vglut2 +RTN neurons from each genotype; channel transcript was reduced in Vgat+ cells from Scn1aΔE26 mice (0.43 ± 0.7 mRNA/area, n = 94 cells) compared to control (0.73 ± 0.9 mRNA/area, n = 82 cells) (p<0.05), whereas Vglut2 +cells showed low channel transcript across both genotypes. (D–E) Scn1aΔE26 mice did not show any obvious differences gross morphology (A) body weight (D) or temperature (E) compared to age-matched litter mate control mice. (F) (Figure 1—source data 1), survival curve shows that control mice (n = 57) survive to adulthood (30 days postnatal) while Scn1aΔE26 mice (n = 41) die prematurely starting at 9 days postnatal and reaching 100% lethality by 25 days (χ2 = 63.9, p<0.0001). These results were compared using a two-way ANOVA and Sidak multiple comparison test. *, p<0.05; ***p<0.001; ****p<0.0001.
-
Figure 1—source data 1
Survival curves for Slc32a1cre/+ and Scn1aΔE26 mice.
- https://doi.org/10.7554/eLife.43387.004
Figure 1—figure supplement 1
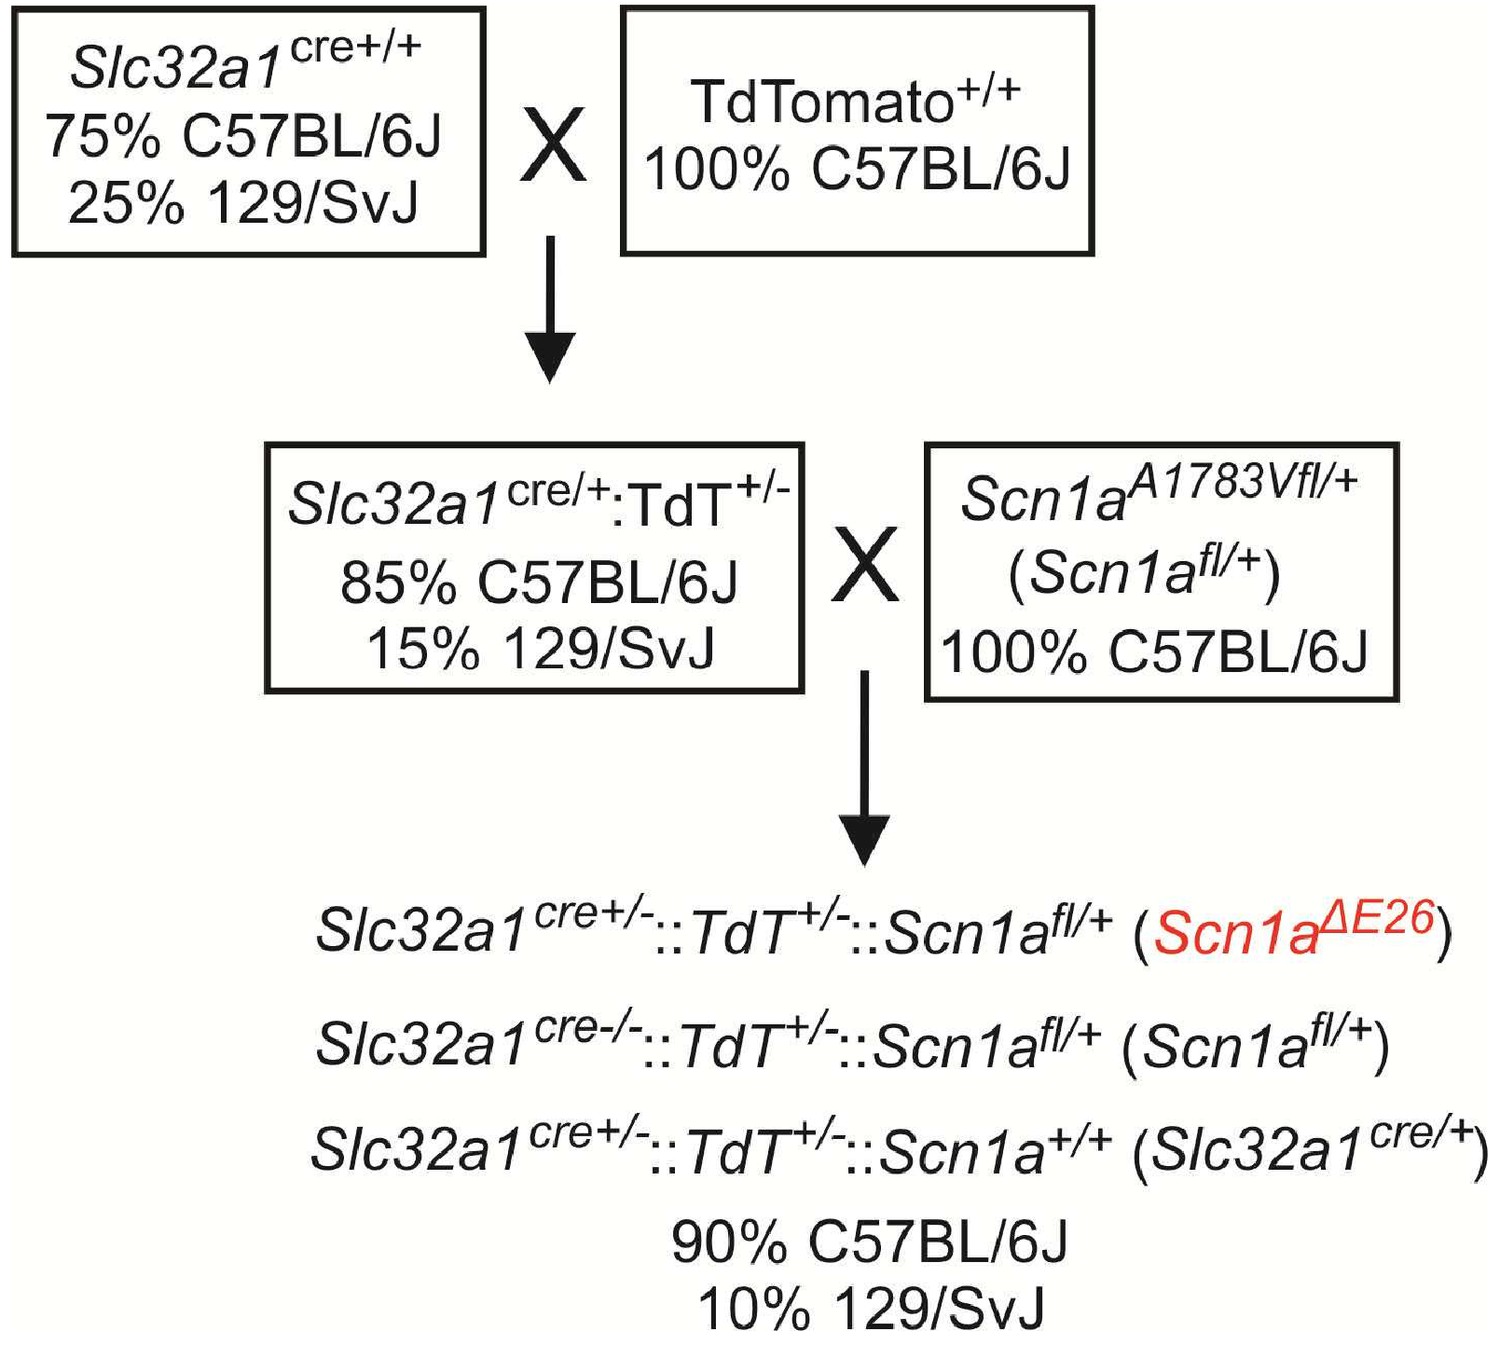
Breeding strategy to generate mice that heterologously express the Scn1a A1783V pathological variant conditionally in inhibitory neurons (Scn1aΔE26 mice).
Homozygous Gt(ROSA)26Sortm14(CAG-tdTomato)Hze/J reporter mice (Ai14; JAX no. 007914) on a 100% C57BL/6J background are bred with mice that express Cre recombinase targeted to Slc32a1, the gene encoding Vgat (Slc32a1Cre mice, JAX no. 016962), on a mixed background of 75%::25% C57BL/6J::129/SvJ to produce Slc32a1Cre:: TdT double-heterozygous mice with a 85% C57BL6/J: : 15% 129/SvJ background. These mice are then bred with Scn1aA1783Vfl/+ (JAX no. 026133) maintained on a 100% C57BL/6J background to produce experimental animals with a genotype of Slc32a1cre+/-::TdT+/-::Scn1afl/+ (Scn1aΔE26) and control animals of the following genotypes Slc32a1cre-/-::TdT+/-::Scn1afl/+ (Scn1afl/+) and Slc32a1cre+/-::TdT+/-::Scn1a+/+ (Slc32a1cre/+). Experimental and control mice had a common background of 90% C57BL6/J: : 10% 129/SvJ. The proportion of each background stain was determined by Genome scan analysis (JAX).
Figure 2
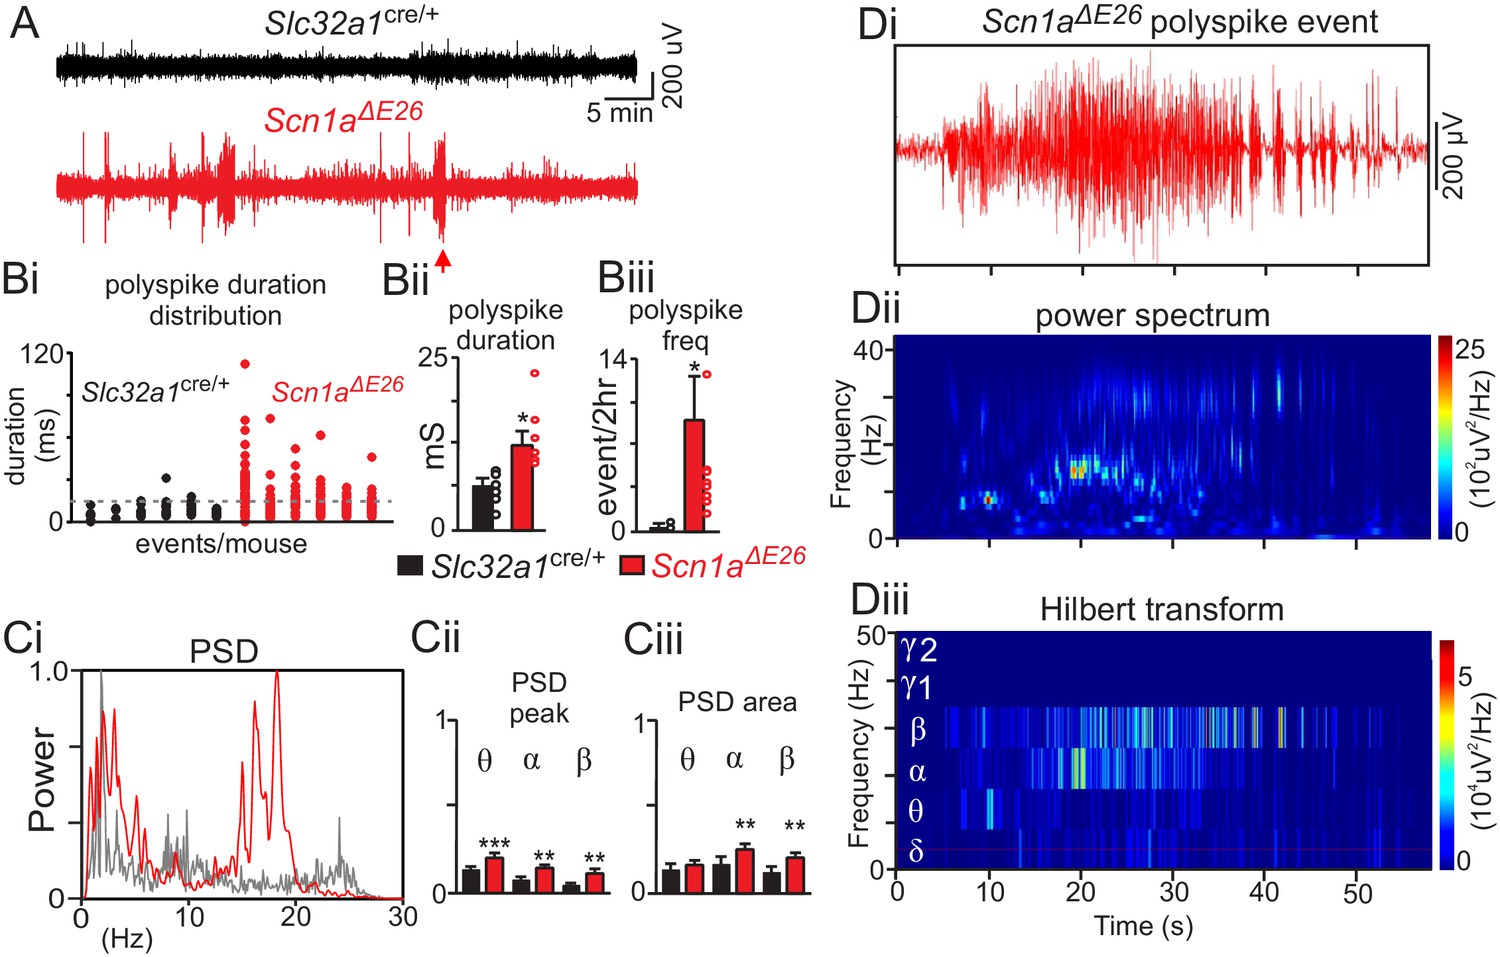
Scn1aΔE26 exhibit frequent spontaneous seizures.
(A) traces of raw EcoG activity show that Scn1aΔE26 mice but not Slc32a1cre/+ mice exhibit frequent spontaneous burst of high amplitude poly-spike activity. The arrow identifies a typical seizure-like poly-spike event that was analyzed further by power spectral analysis in panel D. Polyspike events with a minimum duration of 14 ms were accompanied by seizure-like behavior and so were considered epileptic activity. (B), Scn1aΔE26 mice showed more frequent epileptic poly-spike bursts of activity (Bi, dotted line designates duration threshold for epileptic activity); poly-spike bursts (>14 ms) occurred more frequently in Scn1aΔE26 mice (Bi-Bii) (control 0.13 ± 0.1 events/2 hr, n = 6; Scn1aΔE26 0.37 ± 0.05 events/2 hr, n = 6; T10 = 3.009, p<0.01) and lasted for a longer duration (Biii) (control 7.6 ± 0.6 ms, n = 6; Scn1aΔE26 15.6 ± 0.8 ms, n = 6, T10 = 2.268, p<0.05) compared to control animals. Ci, representative power spectrum density (PSD) plots of spontaneous poly-spike burst events show typical strong activity in the theta-, alpha and beta frequency range in Scn1aΔE26 but not control mice. Cii-Ciii (Figure 2—source data 1), summary data (normalized to the maximum value at each event) show PSD peak (Cii) and PSD area under the curve (Ciii) of each frequency range for each genotype. Note that poly-spike burst events measured in Scn1aΔE26 mice show increased activity in the theta, alpha and beta range. Di-iii, poly-spike burst events recorded from a Scn1aΔE26 mouse (arrow in panel A) plotted on an expanded time scale (Di) and corresponding time frequency distribution (Dii) and deconstructed spectrum into its various frequency domains (Diii). These results were compared using a two-way ANOVA and the Sidak multiple comparison test. *, p<0.05; **, p<0.01; ***p<0.001.
-
Figure 2—source data 1
Plots of PSD peak and PSD area of poly-spike burst events measured in Slc32a1cre/+ and Scn1aΔE26 mice.
- https://doi.org/10.7554/eLife.43387.009
Figure 3
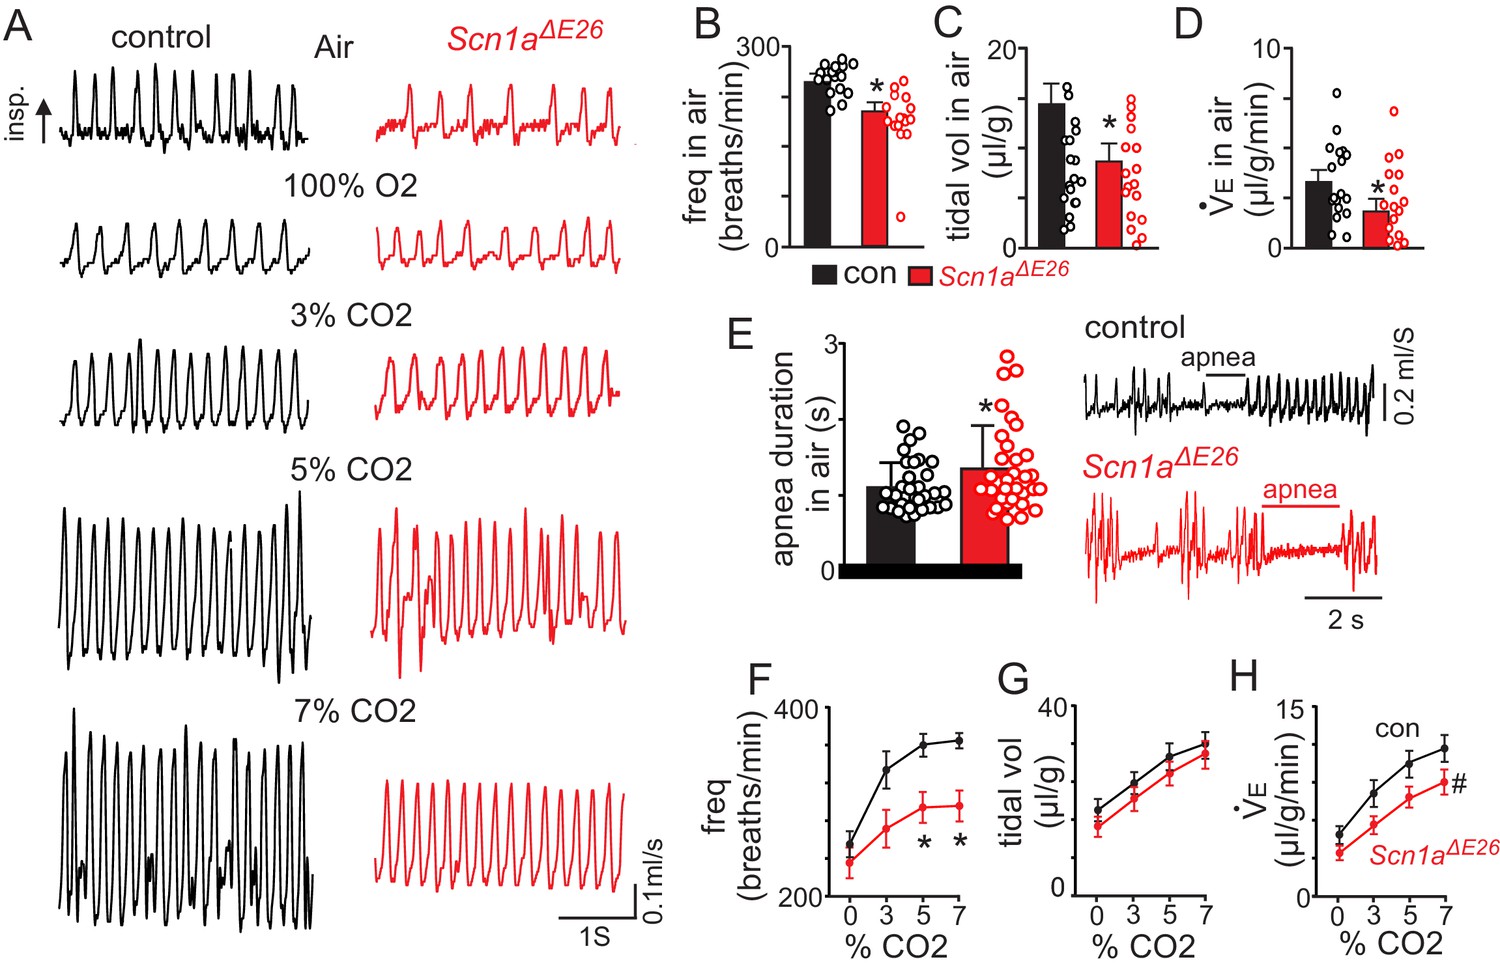
Scn1aΔE26 mice show reduced respiratory output under control conditions and during exposure to high CO2.
For these experiments Scn1afl/+ and Slc32a1cre/+ were used as control. (A) traces of respiratory activity from a control and Scn1aΔE26 mouse during exposure to room air, 100% O2 and 3–7% CO2 (balance O2). (B–D), summary data (n = 22 control; n = 17 Scn1aΔE26) show respiratory frequency (B), tidal volume (C) and minute ventilation (D) are reduced in Scn1aΔE26 mice compared to control under room air conditions. (E), traces of respiratory activity (left) and summary data (right) show that under room air conditions both control and Scn1aΔE26 mice exhibit periods of apnea; the frequency of these events were similar between genotypes, however, they lasted for a longer duration in Scn1aΔE26 mice compared to control. F-H (Figure 3—source data 1), summary data shows the respiratory frequency (F), tidal volume (G) and minute ventilation response of control and Scn1aΔE26 mice to graded increases in CO2 (balance O2). Scn1aΔE26 mice showed a blunted respiratory frequency to 5% and 7% CO2 which resulted in a diminished CO2/H+-dependent increase in minute ventilation. These results were compared using either unpaired t test (panels B-E) or two-way ANOVA followed by the Holm-Sidak multiple comparison test (panels F-H). *, difference between means p<0.05, #, different interaction factor, p<0.05.
-
Figure 3—source data 1
Summary data showing respiratory frequency, tidal volume and minute ventilatory responses to CO2 in control and Scn1aΔE26 mice.
- https://doi.org/10.7554/eLife.43387.011
Figure 4
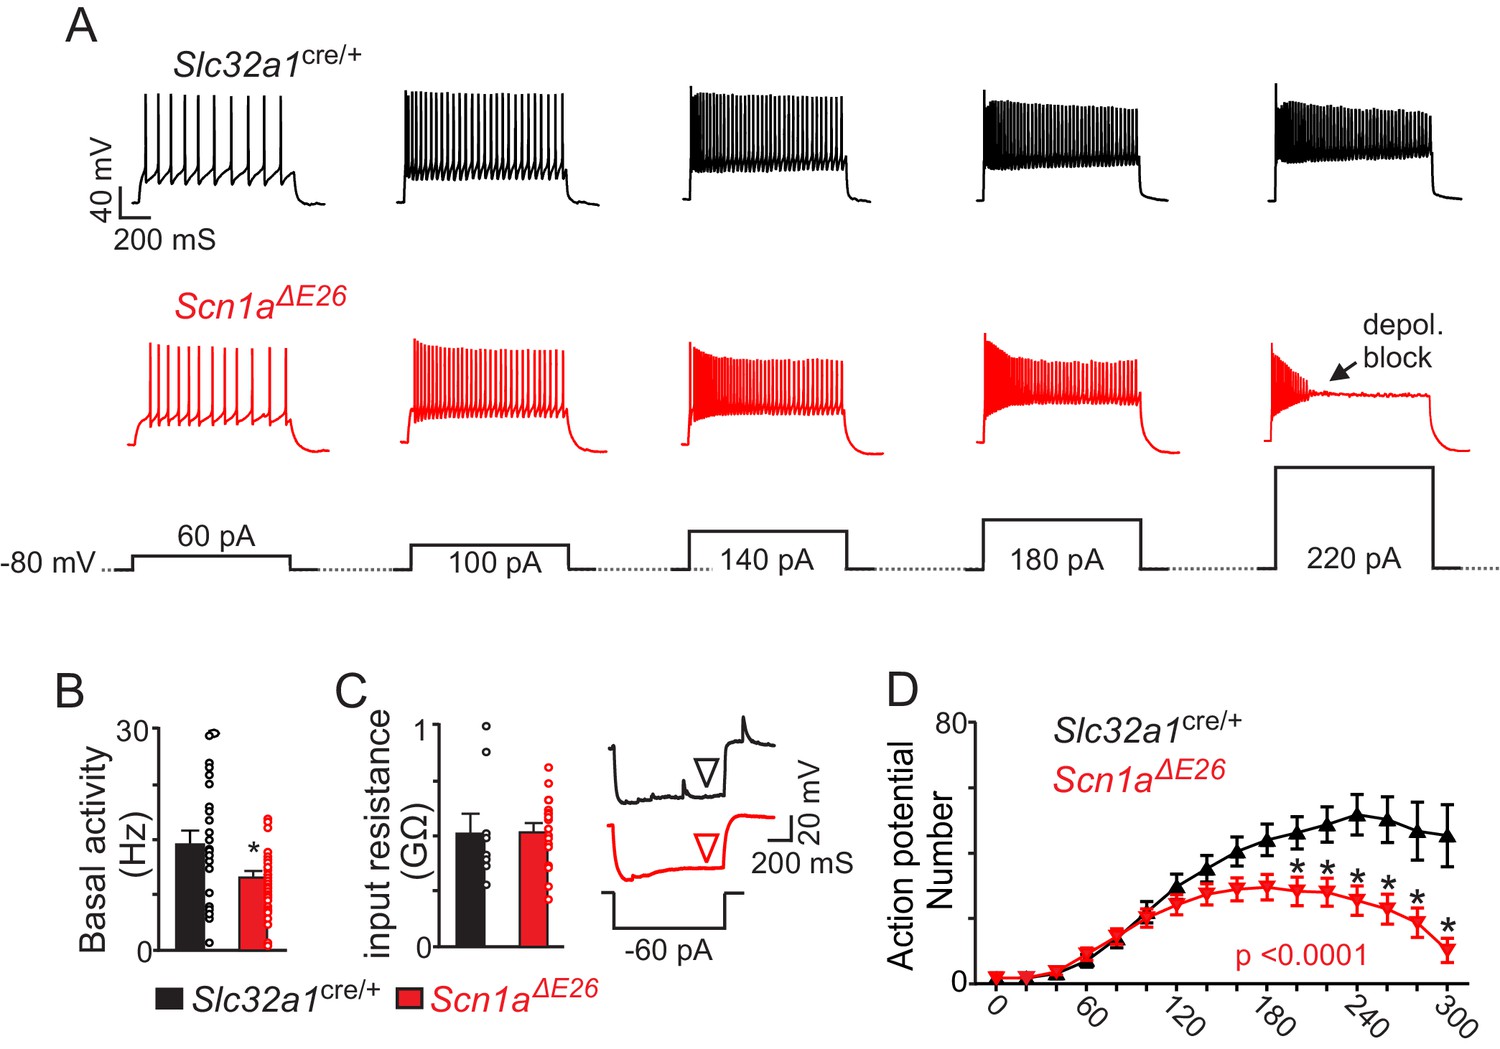
Brainstem inhibitory neurons in slices from Scn1aΔE26 show diminished basal activity and repetitive firing behavior during sustained depolarization.
(A) segments of membrane potential from inhibitory neurons in the RTN region in slices from control and Scn1aΔE26 mice during depolarizing current injections (40 to 220 pA; 1 s duration) from a membrane potential of –80 mV. (B) summary data shows inhibitory neurons in slices from Scn1aΔE26 mice (n = 36) are less active under resting conditions (0 pA holding current) compared to inhibitory neurons in slices form Slc32a1cre/+ control mice (n = 26 cells). (C), summary data and representative voltage responses to a −60 pA current injection show that inhibitory neurons from each genotype had similar input resistance. (D) (Figure 4—source data 1), input-output relationship show that inhibitory neurons from Scn1aΔE26 mice generate fewer action potentials in response to moderate depolarizing current injections (1 s duration) and at more positive steps go into depolarizing block. Results were compared using t-test (B–C) and two-way ANOVA and Sidak multiple comparison test (D). *, p<0.05; **, p<0.01; ***, p<0.001.
-
Figure 4—source data 1
Evoked firing responses of inhibitory neurons in slices from Slc32a1cre/+ and Scn1aΔE26 mice.
- https://doi.org/10.7554/eLife.43387.013
Figure 5
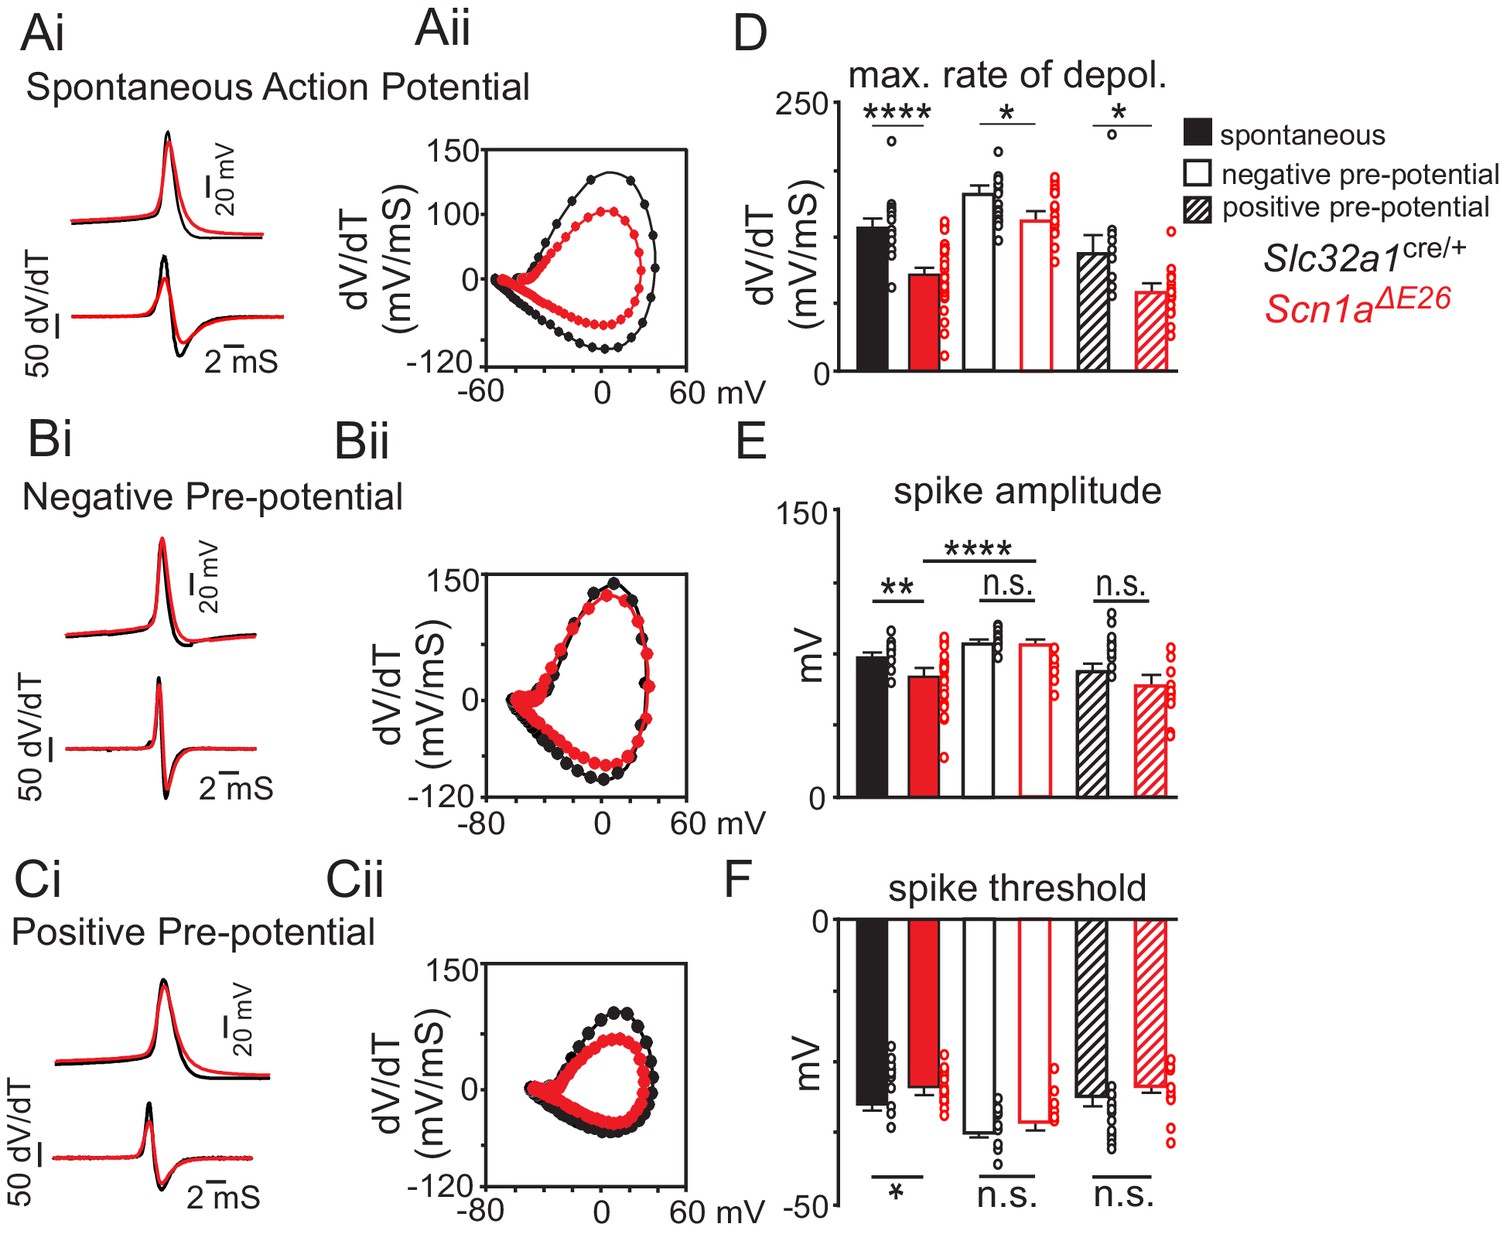
The Scn1a A1783V pathological variant may result in loss of channel function by increased voltage-dependent inactivation.
(A) average spontaneous action (Slc32a1cre/+ control n = 24 spikes, Scn1aΔE26 n = 29 spikes (top) and first time derivative of average action potentials (bottom) recorded from inhibitory neurons in slices from control and Scn1aΔE26 mice (Ai) and corresponding phase plot (Aii) (dV/dt; Y-axis vs mV; X-axis) of the traces in panel Ai show that cells expressing Scn1a A1783V depolarize slower compared to control cells (Figure 5—source data 1). (B), average first action potential following a hyperpolarizing pre-potential (−100 pA; 1 s) (Slc32a1cre/+ control n = 13 spikes, Scn1aΔE26 n = 16 spikes) (top) and first time derivative of average action potentials (bottom) recorded from inhibitory neurons in slices from control and Scn1aΔE26 mice (Bi) and corresponding phase plot (Bii) of traces in panel Bi show that holding cells at a negative pre-potential to remove sodium channel inactivation improved the depolarization kinetics of subsequent spikes (Figure 5—source data 1). (C), average first action potential following a depolarizing pre-potential (+180 pA; 1 s) (control n = 9 spikes, Scn1aΔE26 n = 11 spikes (top) and first time derivative of average action potentials (bottom) recorded from inhibitory neurons in slices from control and Scn1aΔE26 mice (Ci) and corresponding phase plot (Cii) of traces in panel Ci show that holding cells at a depolarized pre-potential to increase sodium channel inactivation diminished genotype differences in action potential kinetics (Figure 5—source data 1). (D–F), summary data showing the maximum rate of depolarization (D), action potential amplitude (E) and action potential threshold (F) of spontaneous action potentials and first spikes following positive or negative pre-potentials recorded in slices from control and Scn1aΔE26 mice. Results were compared by two-way ANOVA and the Sidak multiple comparison test.. *, p<0.05; **, p<0.01; ***, p<0.001; ****, p<0.0001.
-
Figure 5—source data 1
Phase plots of spontaneous action potentials and the first spike elicited following positive or negative pre-potentials in slices from Slc32a1cre/+ and Scn1aΔE26 mice.
- https://doi.org/10.7554/eLife.43387.015
Figure 6
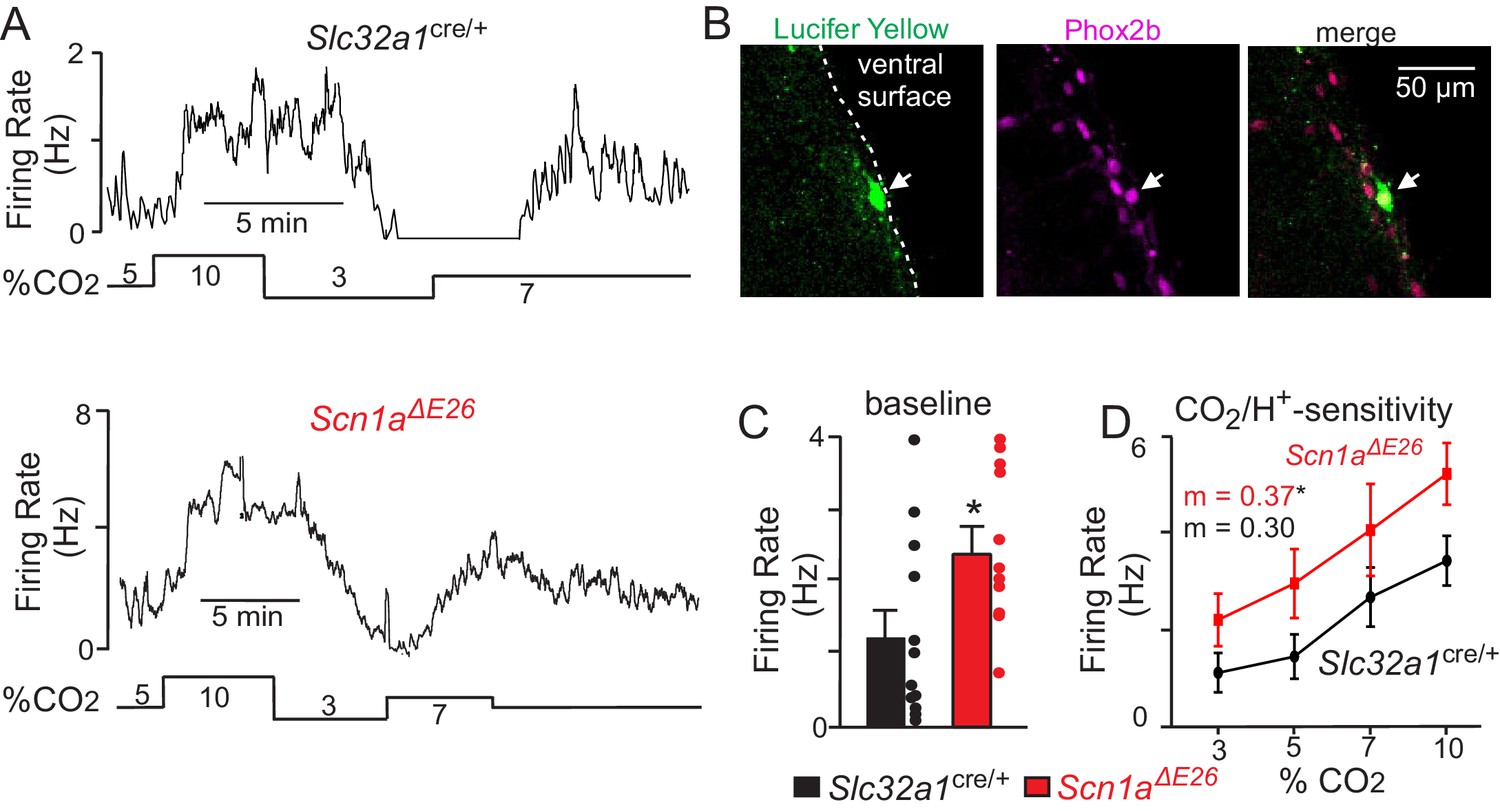
Chemosensitive RTN neurons in slices from Scn1aΔE26 mice are hyper-excitable.
(A) firing rate traces from chemosensitive neurons in slices from control (top) and Scn1aΔE26 mice (bottom) show that neurons from both genotypes respond to changes in CO2/H+; RTN neurons are spontaneously active under control conditions (5% CO2; pHo 7.3) and respond to 7% CO2 (pHo 7.2) and 10% CO2 (pHo 7.0) with a linear increase in activity, whereas exposure to 3% CO2 (pHo 7.6) decreases neural activity. However, basal activity and CO2/H+-dependent output of RTN chemoreceptors from Scn1aΔE26 tissue is enhanced compared to RTN neurons in slices from Slc32a1cre/+control mice. (B) double-immunolabeling shows that a Lucifer Yellow-filled CO2/H+-sensitive RTN neuron (green) is immunoreactive for phox2b (magenta), the merged image is shown to the right. We confirmed that all CO2/H+-sensitive neurons (Slc32a1cre/+ control n = 12; Scn1aΔE26 n = 11) included in this study were phox2b-positive. (C–D) (Figure 6—source data 1), summary data shows that RTN chemoreceptors in slices from Scn1aΔE26 mice have higher basal activity (C) and enhanced CO2/H+-dependent output between 3–10% CO2 (D). Results were compared by t-test (C) or ANCOVA test (D). *, p<0.05.
-
Figure 6—source data 1
CO2/H+-evoked activity in chemosensitive RTN neurons in slices from Slc32a1cre/+ and Scn1aΔE26 mice.
- https://doi.org/10.7554/eLife.43387.017
Tables
Table 1
Behavioral Assessment of Seizure activity.
https://doi.org/10.7554/eLife.43387.005| Racine score | N | 0 | 1 | 2 | 3 | 4 | 5 | Behavioral arrest |
|---|---|---|---|---|---|---|---|---|
| Slc32a1cre/+ | 22 | 17 | 5 | 0 | 0 | 0 | 0 | 0 |
| Scn1aΔE26 | 22 | 0 | 3 | 3 | 6 | 2 | 3 | 5 |
Table 2
Febrile seizure propensity.
https://doi.org/10.7554/eLife.43387.006| Genotype | N | Weight | Induced seizure (%) |
|---|---|---|---|
| Slc32a1cre/+ | 10 | 6.65 ± 0.3 | 0 |
| Scn1aΔE26 | 9 | 6.71 ± 0.3 | 100**** |
-
****Fisher’s exact test p<0.000
-
Table 2—source data 1
Febrile seizure propensity.
- https://doi.org/10.7554/eLife.43387.007
Key resources table
| Reagent type | Designation | Source or reference | Identifiers | Adtl. info |
|---|---|---|---|---|
| Strain, strain background (M. musculus, Scn1a A1783V, C57BL6/J background) | B6(Cg)-Scn1atm1.1Dsf/J | Jackson Laboratories | RRID:IMSR_JAX:026133 | unpublished model |
| Strain, strain background (M. musculus, Vgat-iris-Cre, mixed 129/SvJ and C57BL6/J background) | Slc32a1tm2(cre)Lowl/J | PMID: 21745644 | RRID:IMSR_JAX:016962 | |
| Strain, strain background (M. musculus, tdTomato reporter Ai14, C57BL6/J background) | B6.Cg-Gt(ROSA)26Sortm14(CAG-tdTomato)Hze/J | PMID: 20023653 | RRID:IMSR_JAX:007914 | |
| Genetic reagent (M-MLV Reverse Transcriptase (200 U/µL)) | MMLV RT first-strand reagent | ThermoFisher Scientific | 28025013 | |
| Genetic reagent (GoTaq Flexi DNA Polymerase) | Taq polymerase | Promega | M8291 | |
| Antibody | goat anti-Phox2b antibody | R and D Systems | AF4940; RRID:AB_10889846 | used on fixed tissue, 1:500 dilution |
| Antibody | rabbit anti-Lucifer Yellow antibody | Invitrogen | A-5750; RRID:AB_2536190 | used on fixed tissue, 1:2000 dilution |
| Sequence based reagent | RNAscope Probe- Mm-Scn1a | ACDBio | 434181 | 1:50 |
| Sequence based reagent | RNAscope Probe- Mm-Slc32a1-C2 | ACDBio | 319191-C2 | 1:50 |
| Sequence based reagent | RNAscope Probe- Mm-Slc17a6-C2 | ACDBio | 319171-C2 | 1:50 |
| Commercial assay or kit | RNAscope Fresh Frozen Multiplex Fluorescent Kit | ACDBio | 320851 | |
| Commercial assay or kit | NEB PCR Cloning Kit | New England BioLabs | E1202S | |
| Commercial assay or kit | QIAprep Gel Extraction Kit | Qiagen | 28704 | |
| Commercial assay or kit | QIAprep Spin Miniprep Kit | Qiagen | 27104 | |
| Commercial assay or kit | Direct-zol RNA MicroPrep | Zymo Research | R2061 | |
| Chemical compound, drug | Lucifer Yellow | Sigma | B4261 | 0.10% |
| Software, algorithm | SnapGene Viewer | SnapGene | RRID:SCR_015053 | |
| Software, algorithm | Ponemah | DSI | RRID:SCR_017107 | Version 5.20 |
| Software, algorithm | Spike | Cambridge Electronic Design | RRID:SCR_000903 | Version 5.0 |
| Software, algorithm | Sirenia | Pinnacile Technology | RRID:SCR_016183 | |
| Software, algorithm | Matlab | Mathworks | RRID:SCR_001622 | Version R2018 |
| Software, algorithm | Brainstorm | Tadel et al., 2011 | RRID:SCR_001761 | Version 3.0 |
| Software, algorithm | Prism 7 | GraphPad | RRID:SCR_002798 | Version 7.03 |
| Software, algorithm | pCLAMP 10 | Molecular Devices | RRID:SCR_011323 | Version 10 |
| Software, algorithm | ImageJ | NIH | RRID:SCR_003070 | Version 2.0.0 |
Table 3
Probes used for FISH.
https://doi.org/10.7554/eLife.43387.018| Gene name | Probe cat no. | Target region |
|---|---|---|
| Scn1a | 434181 | 1624–2967 |
| Slc32a1 | 319191-C2 | 894–2037 |
| Slc17a6 | 319171-C2 | 1986–2998 |
Additional files
-
Transparent reporting form
- https://doi.org/10.7554/eLife.43387.019
Download links
A two-part list of links to download the article, or parts of the article, in various formats.
Downloads (link to download the article as PDF)
Open citations (links to open the citations from this article in various online reference manager services)
Cite this article (links to download the citations from this article in formats compatible with various reference manager tools)
Disordered breathing in a mouse model of Dravet syndrome
eLife 8:e43387.
https://doi.org/10.7554/eLife.43387


