Confidence predicts speed-accuracy tradeoff for subsequent decisions
- University Medical Center, Germany
- Ghent University, Belgium
- University College London, United Kingdom
Figures
Figure 1
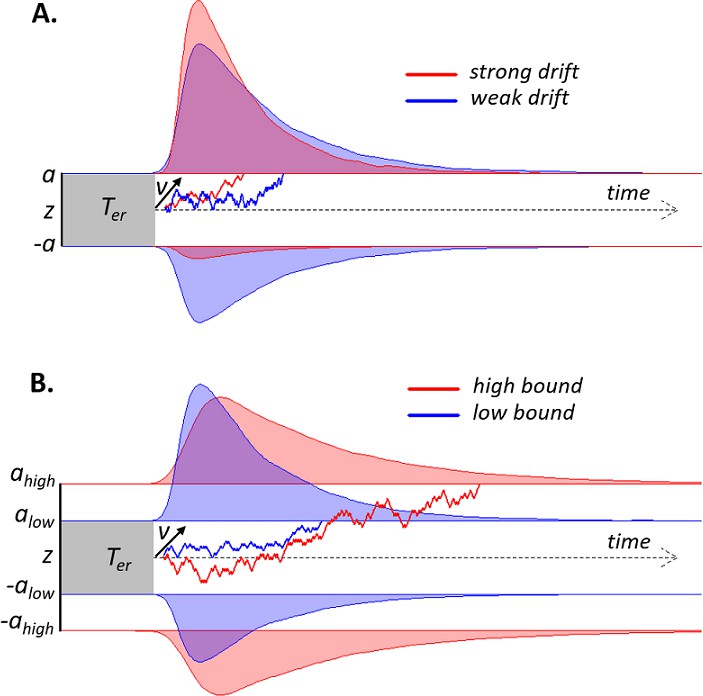
Schematic of drift diffusion model (DDM) with varying drift rates.
(A) and varying decision bounds (B). Noisy sensory evidence is accumulated over time, until the decision variable reaches one of two bounds (a or -a), corresponding to correct and incorrect choices. The efficiency of information accumulation is given by v (mean drift rate). The time for sensory encoding and response execution is given by Ter. By increasing the separation between decision bounds, the probability of being correct increases, at the expense of prolonged reaction times. RT distributions (upper bounds) and error distributions (lower bounds) are depicted for different levels of drift rate (A) and decision bound (B).
Figure 2 with 1 supplement
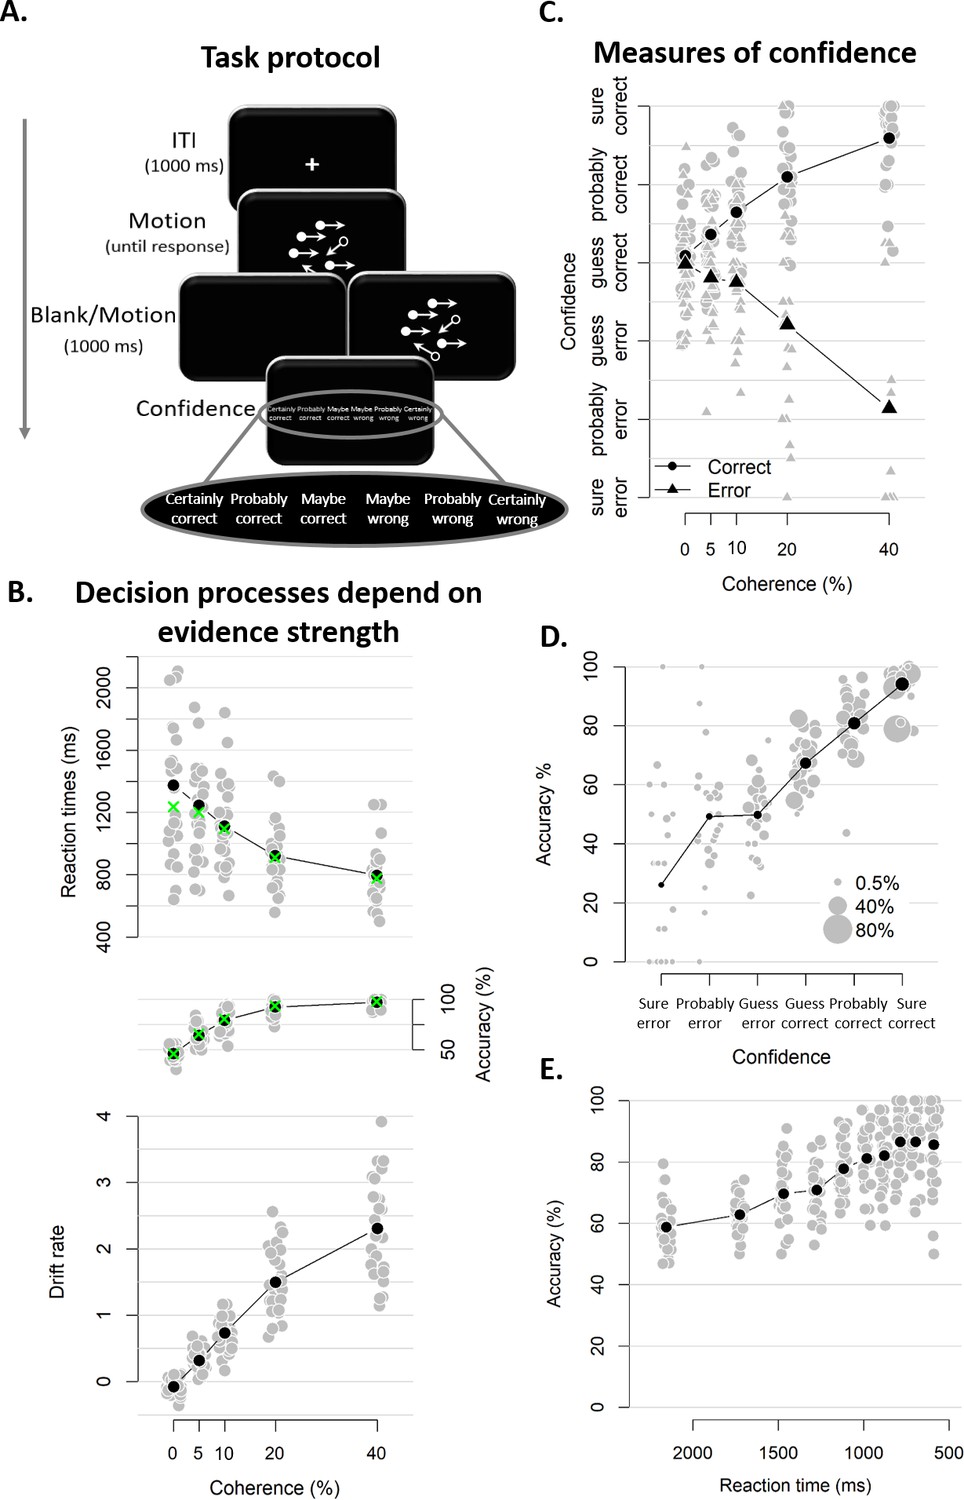
Experimental task and results from Experiment 1.
(A) Sequence of events in a trial from Experiment 1. Participants decided, as fast and accurately as possible, whether the majority of dots were moving left or right. After their response and a 1 s blank or 1 s of continued motion, they indicated the degree of confidence in their decision using a six-point confidence scale (ranging from certainly correct to certainly wrong). (B) Mean reaction time on correct trials (top), accuracy (middle) and estimated mean drift rate (bottom) as a function of coherence. Green crosses show fits from the DDM. (C) Confidence as a function of coherence level, separately for corrects and errors. (D) Accuracy as a function of decision confidence (dot size reflects percentage of trials per confidence label, separately for each participant). (E) Accuracy as a function of reaction time. Data are pooled across the blank and the continued motion condition. Gray dots: individual participants; black dots: group averages.
Figure 2—figure supplement 1
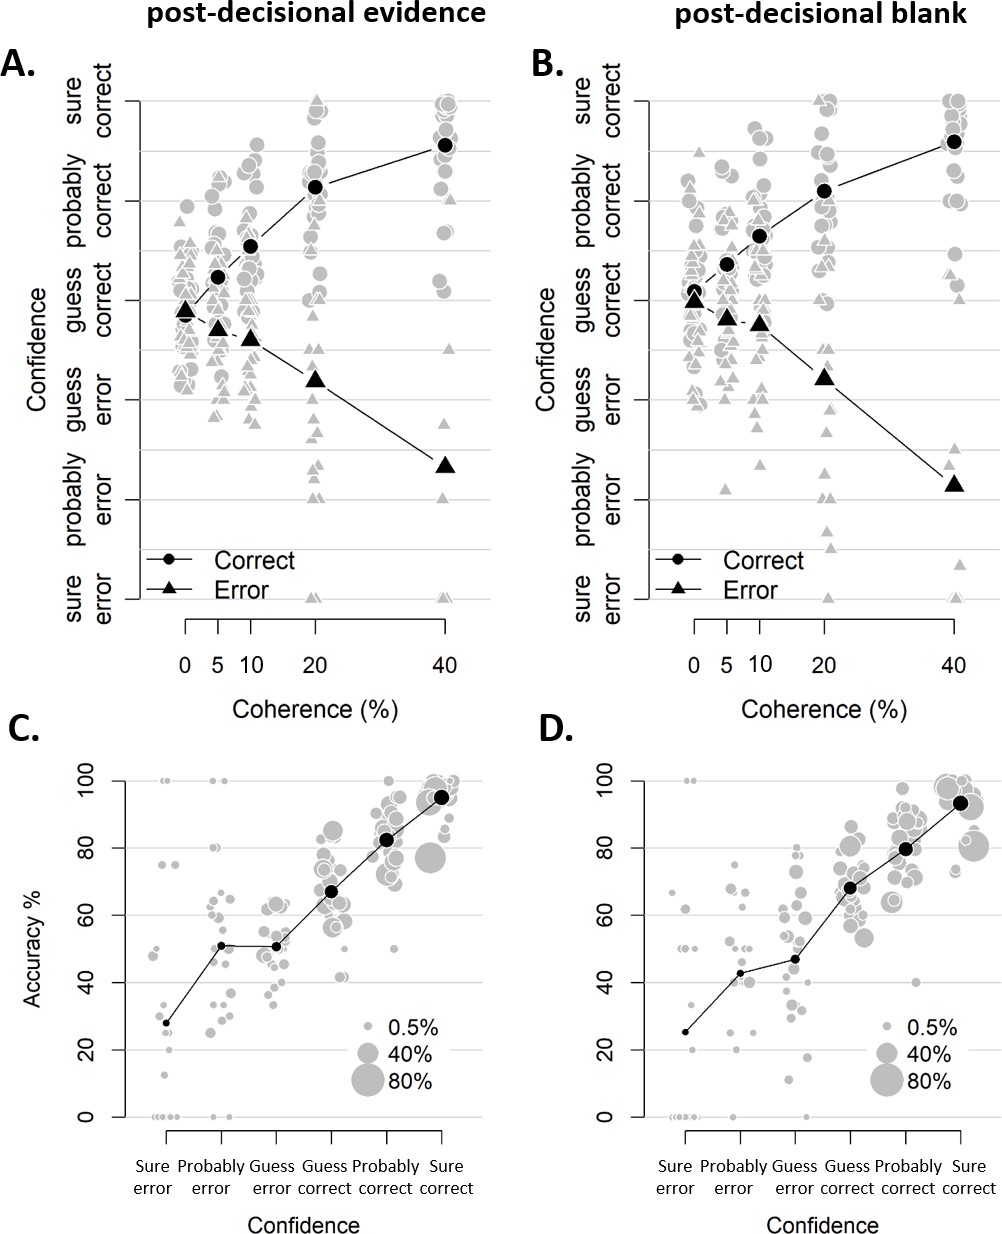
Similar confidence judgments for blocks with and without post-decisional evidence.
(A-B) Confidence as a function of coherence level, separately for blocks with and without post-decisional evidence (A and B, respectively). The interaction between coherence level and choice accuracy in predicting confidence was highly similar and significant in both (post-decisional evidence: F(4,3387.2) = 88.32, p<0.001; post-decisional blank: F(4,3450.0) = 71.36, p<0.001) (C–D) Accuracy as a function of decision confidence, separately for blocks with and without post-decisional evidence (C and D, respectively). Pairwise comparisons did not reveal any differences between the mean accuracy at any of the confidence levels, all |ts| < 1.959, all ps > 0.060. Dot size reflects the percentage of trials per confidence label, separately for each participant.
Figure 3 with 4 supplements

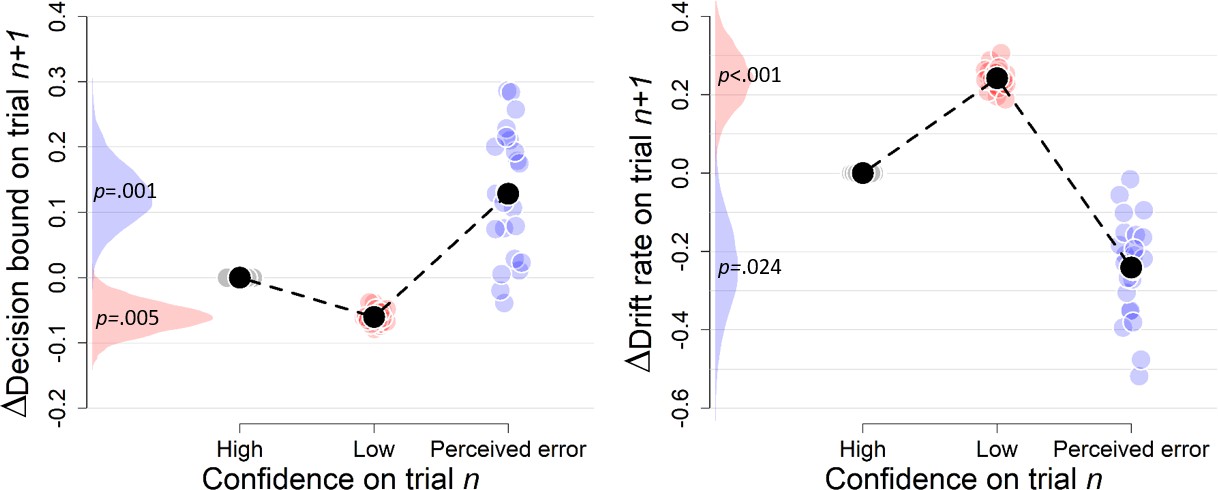
The influence of decision confidence on subsequent decision bound.
(A) Model-free measures of response caution on trial n+one as function of confidence on trial n: mean RT, accuracy, and their product. Inset, distribution of empirical and fitted RTs. (B) Model-based estimate of decision bound and drift rates on trial n+one as function of confidence on trial n. Distributions show the group posteriors over parameter estimates. In all panels, as well as in all subsequent figures, ‘delta’ on y-axis refers to deviation of dependent variable from its value in the high-confidence condition (i.e., centered on zero for high-confidence). For model fits, trials from the high-confidence condition served as reference so that parameter estimates reflected deviations from their value on high-confidence. Statistical significance is reflected in overlap between posterior distributions over parameter estimates (Materials and methods).
Figure 3—figure supplement 1
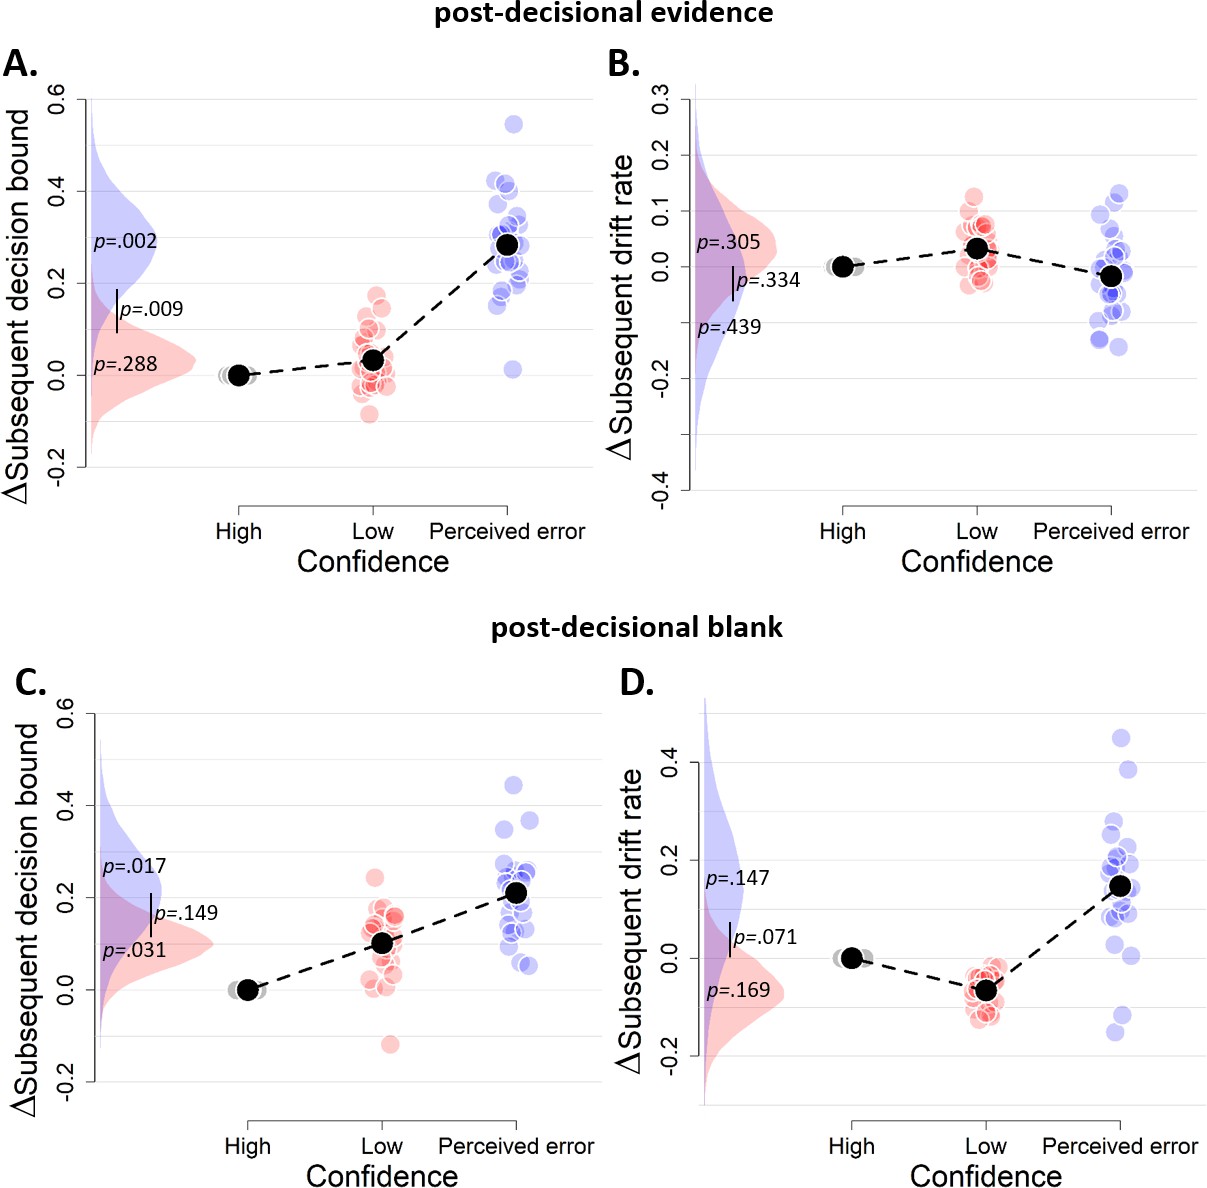
The influence of decision confidence on subsequent decision bounds and drift rates, separately for blocks with post-decisional evidence presentation (A–B) and a post-decisional blank (C–D).
Due to a lack of data in one of the cells, these analyses were performed on the data of 27 and 24 participants, respectively. Same conventions as in Figure 3.
Figure 3—figure supplement 2
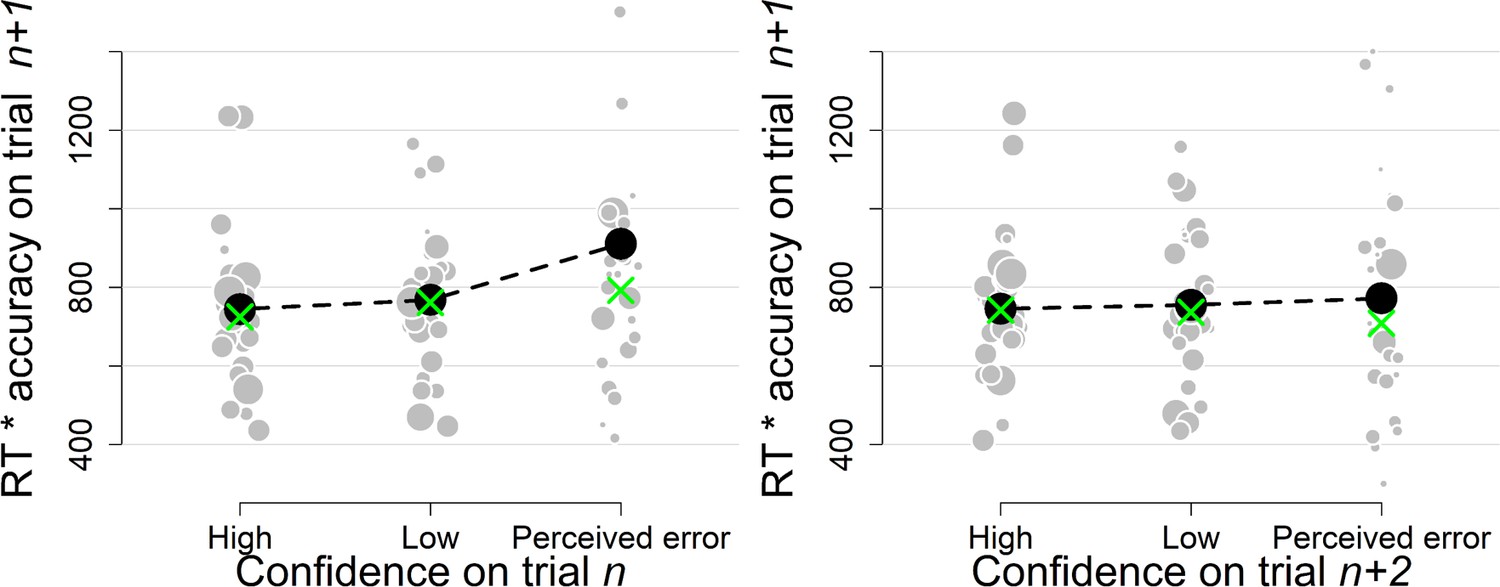
Simple effects of confidence on trialn and confidence on trialn+2 on the product of subsequent RTs and accuracy as a model-free measure of decision bound (Experiment 1).
Same conventions as in Figure 3.
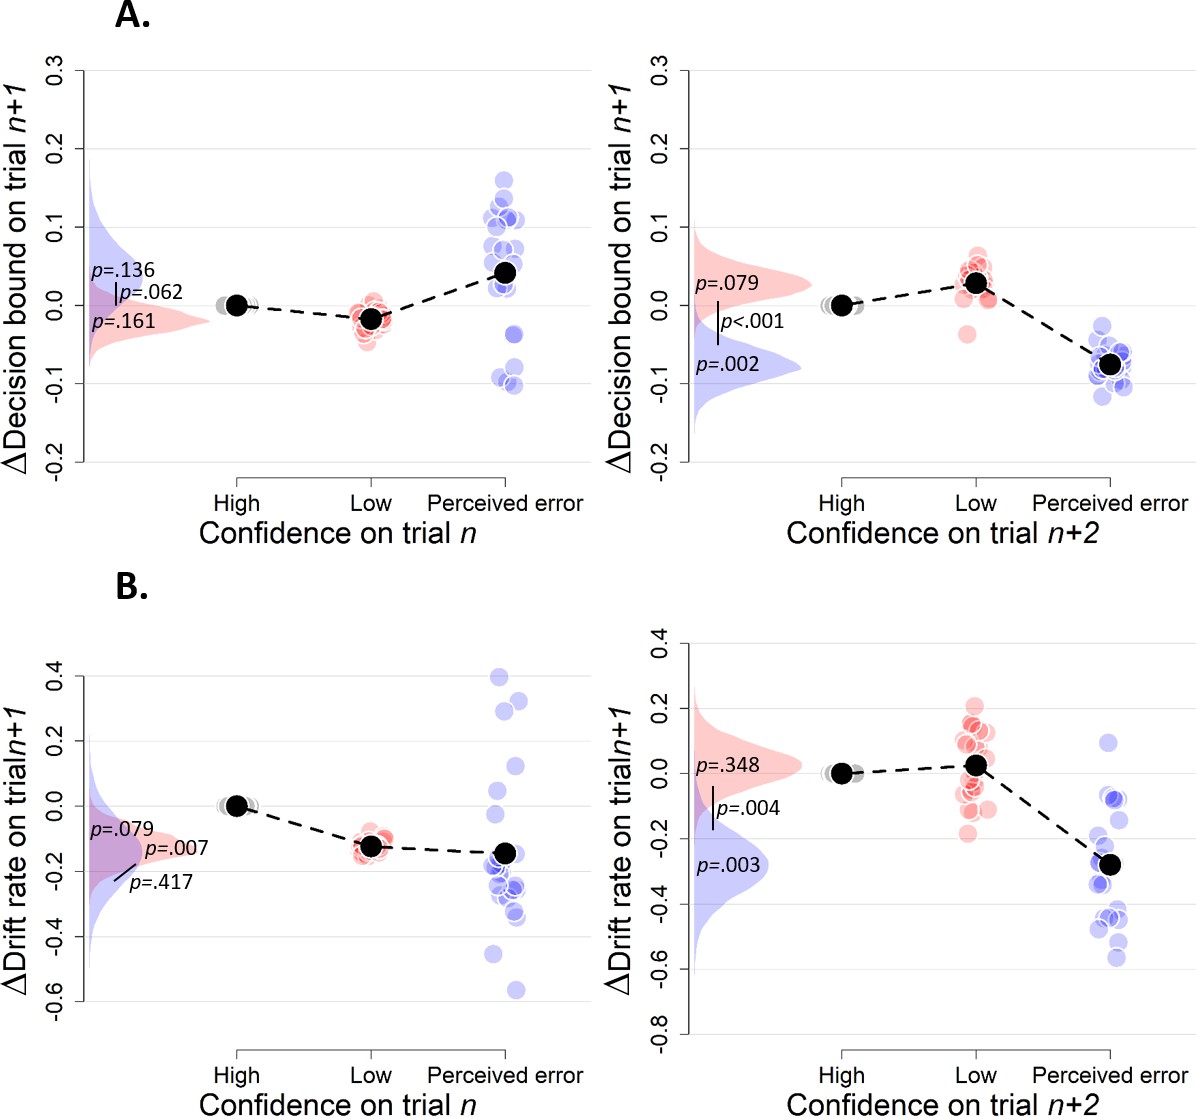
Figure 3—figure supplement 3
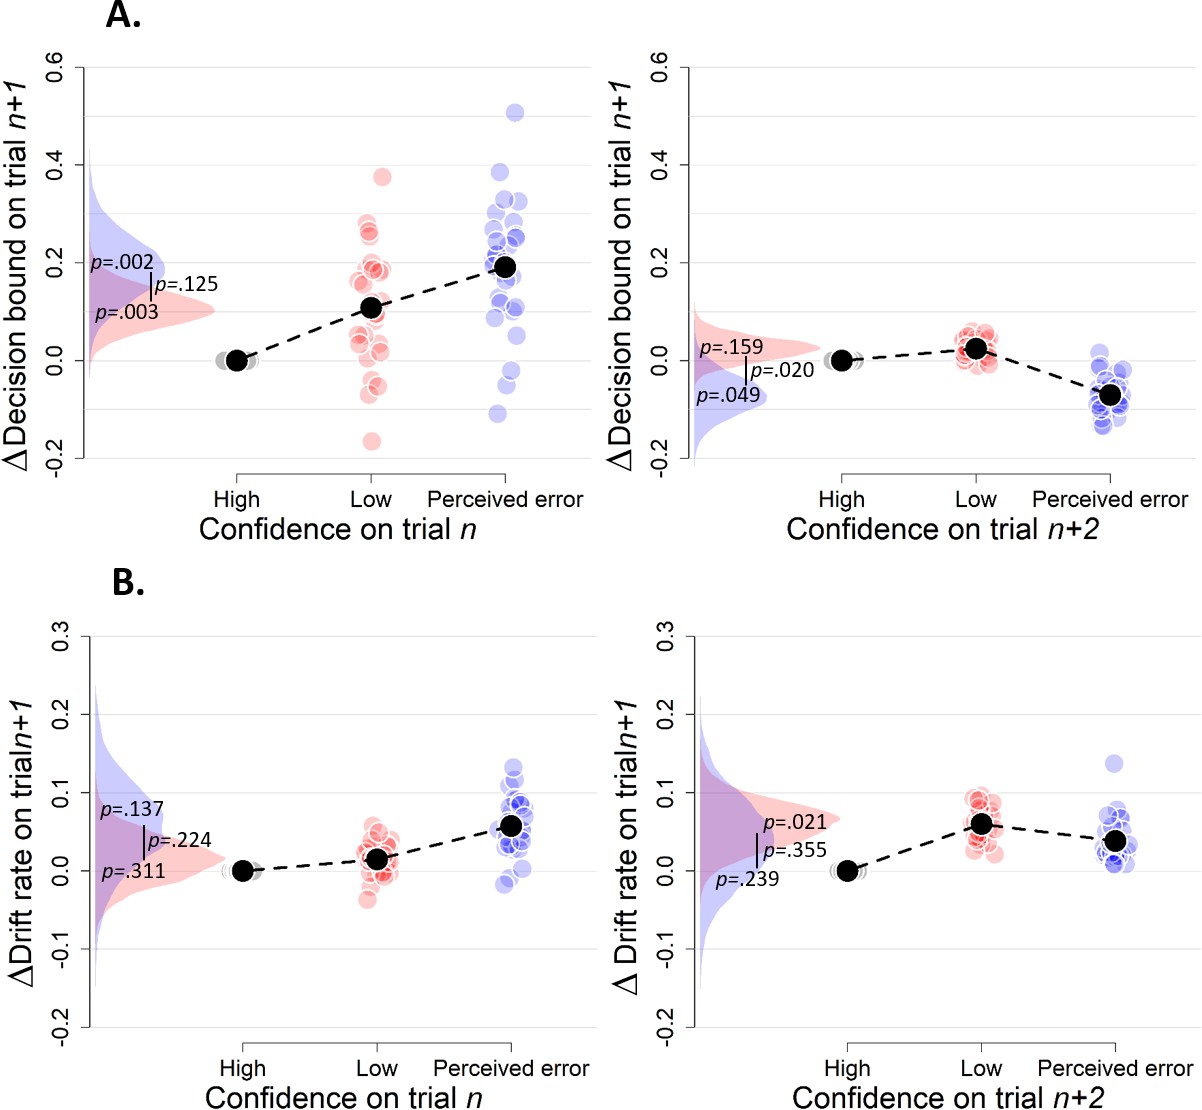
Simple effects of confidence on trialn and confidence on trialn+2 on decision bound (A) and drift rate (B) on trialn+1 (Experiment 1).
Same conventions as in Figure 3.
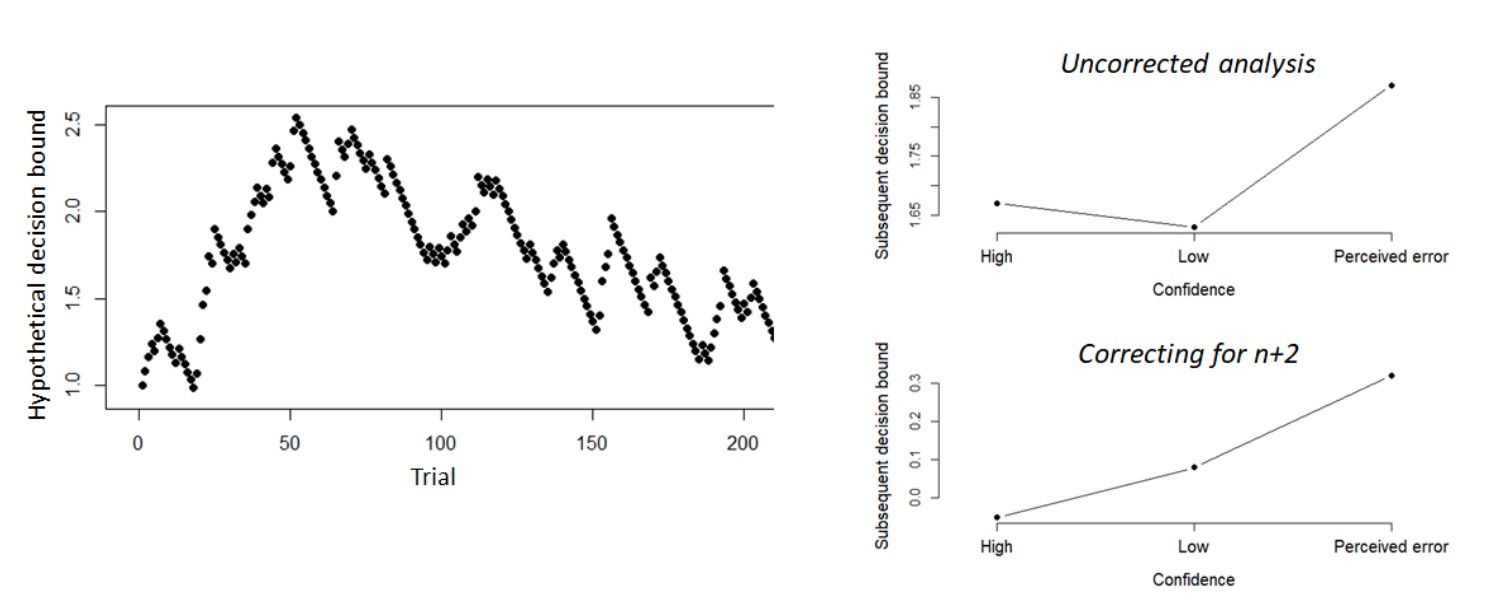
Figure 3—figure supplement 4
Complementary approach controlling for slow drifts in performance (Experiment 1).
Separate models were fitted estimating the decision bound and drift on trialn and i) we compared low confidence on trialn to high confidence on trialn for which trialn+2 was a low confidence trial, and ii) we compared perceived errors on trialn to high confidence trials on trialn for which trialn+2 was a perceived error. Note that low confidence and perceived errors cannot be compared directly because they stem from different models. These results remained unchanged when only including correct trials (there were not enough trials when only including errors).
Figure 4

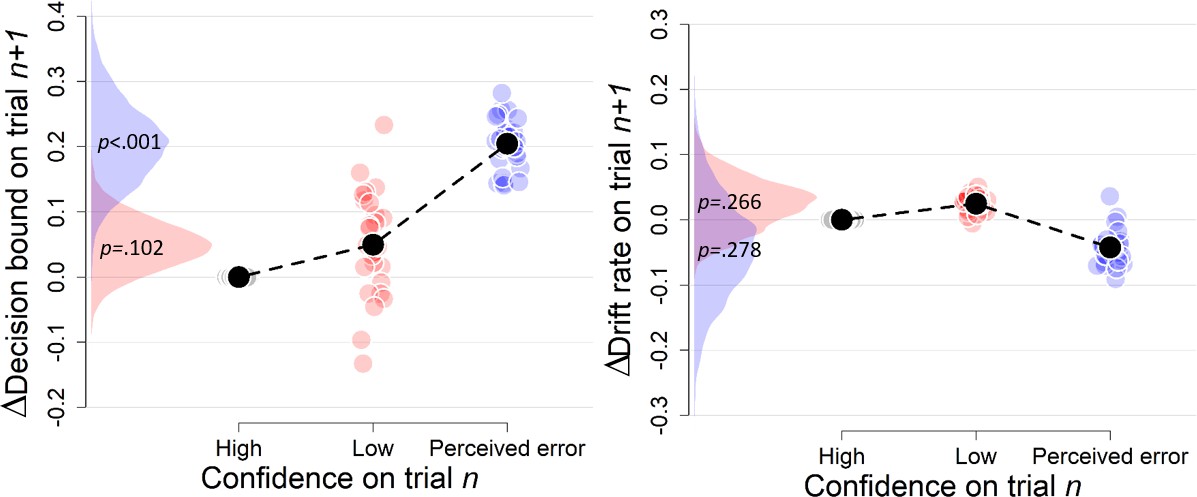
Confidence-dependent modulation of decision bound remains qualitatively similar when modeling only correct (A) or only error trials (B).
Same conventions as in Figure 3. Note that, due to a lack of trials in one of the cells, results are based on 25 (A) and 24 (B) participants.
Figure 5 with 7 supplements

Confidence-dependent modulation of decision bounds generalizes to different experimental tasks.
(A) In Experiment 2, participants need to decide as quickly as possible which of two boxes has more dots. In Experiment 3, participants needed to decide, as fast and accurately as possible, whether the average color of the eight elements was more red or blue. (B) Subsequent RT, accuracy and their product as a model-free measure of decision bound as a function of confidence. Green crosses show fits from the DDM. (C) Subsequent decision bounds and subsequent drift rates as a function of confidence. Inset in B shows the distribution of empirical and fitted RTs.
Figure 5—figure supplement 1
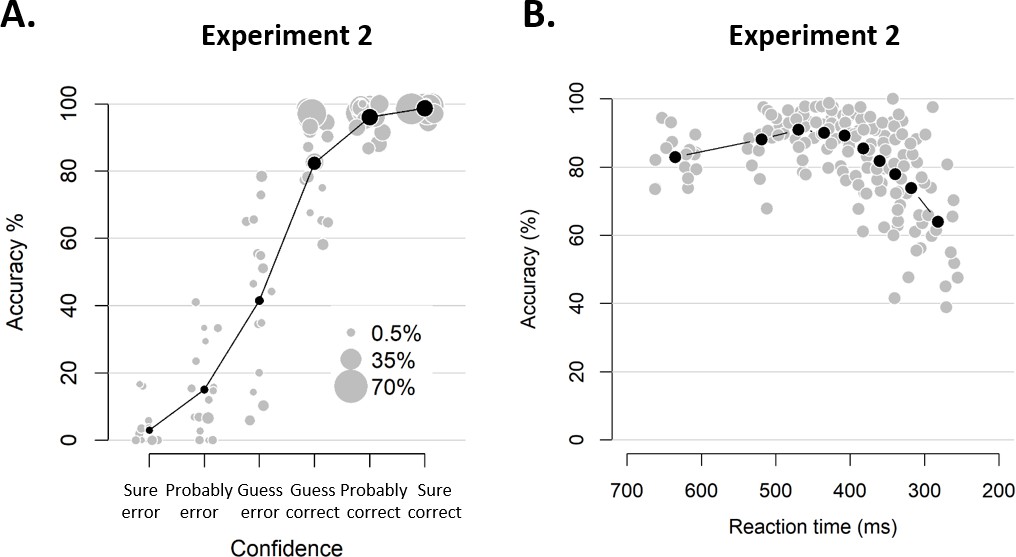
Behavioral results of Experiment 2.
(A) Accuracy as a function of decision confidence. Confidence ratings were closely linked to choice accuracy, even on a trial-by-trial basis (logistic regression of confidence on accuracy: significant positive slopes for all 16 observers, with all ps < 0.001). Dot size reflects the percentage of trials per confidence label, separately for each participant. (B) Accuracy as a function of reaction time. Although there was a significant linear relationship between RTs and accuracy, b = 0.022, t(15) = 4.19, p<0.001, a polynomial regression confirmed the apparent inverted U-shape seen in the data, t(15) = −7.52, p<0.001.
Figure 5—figure supplement 2
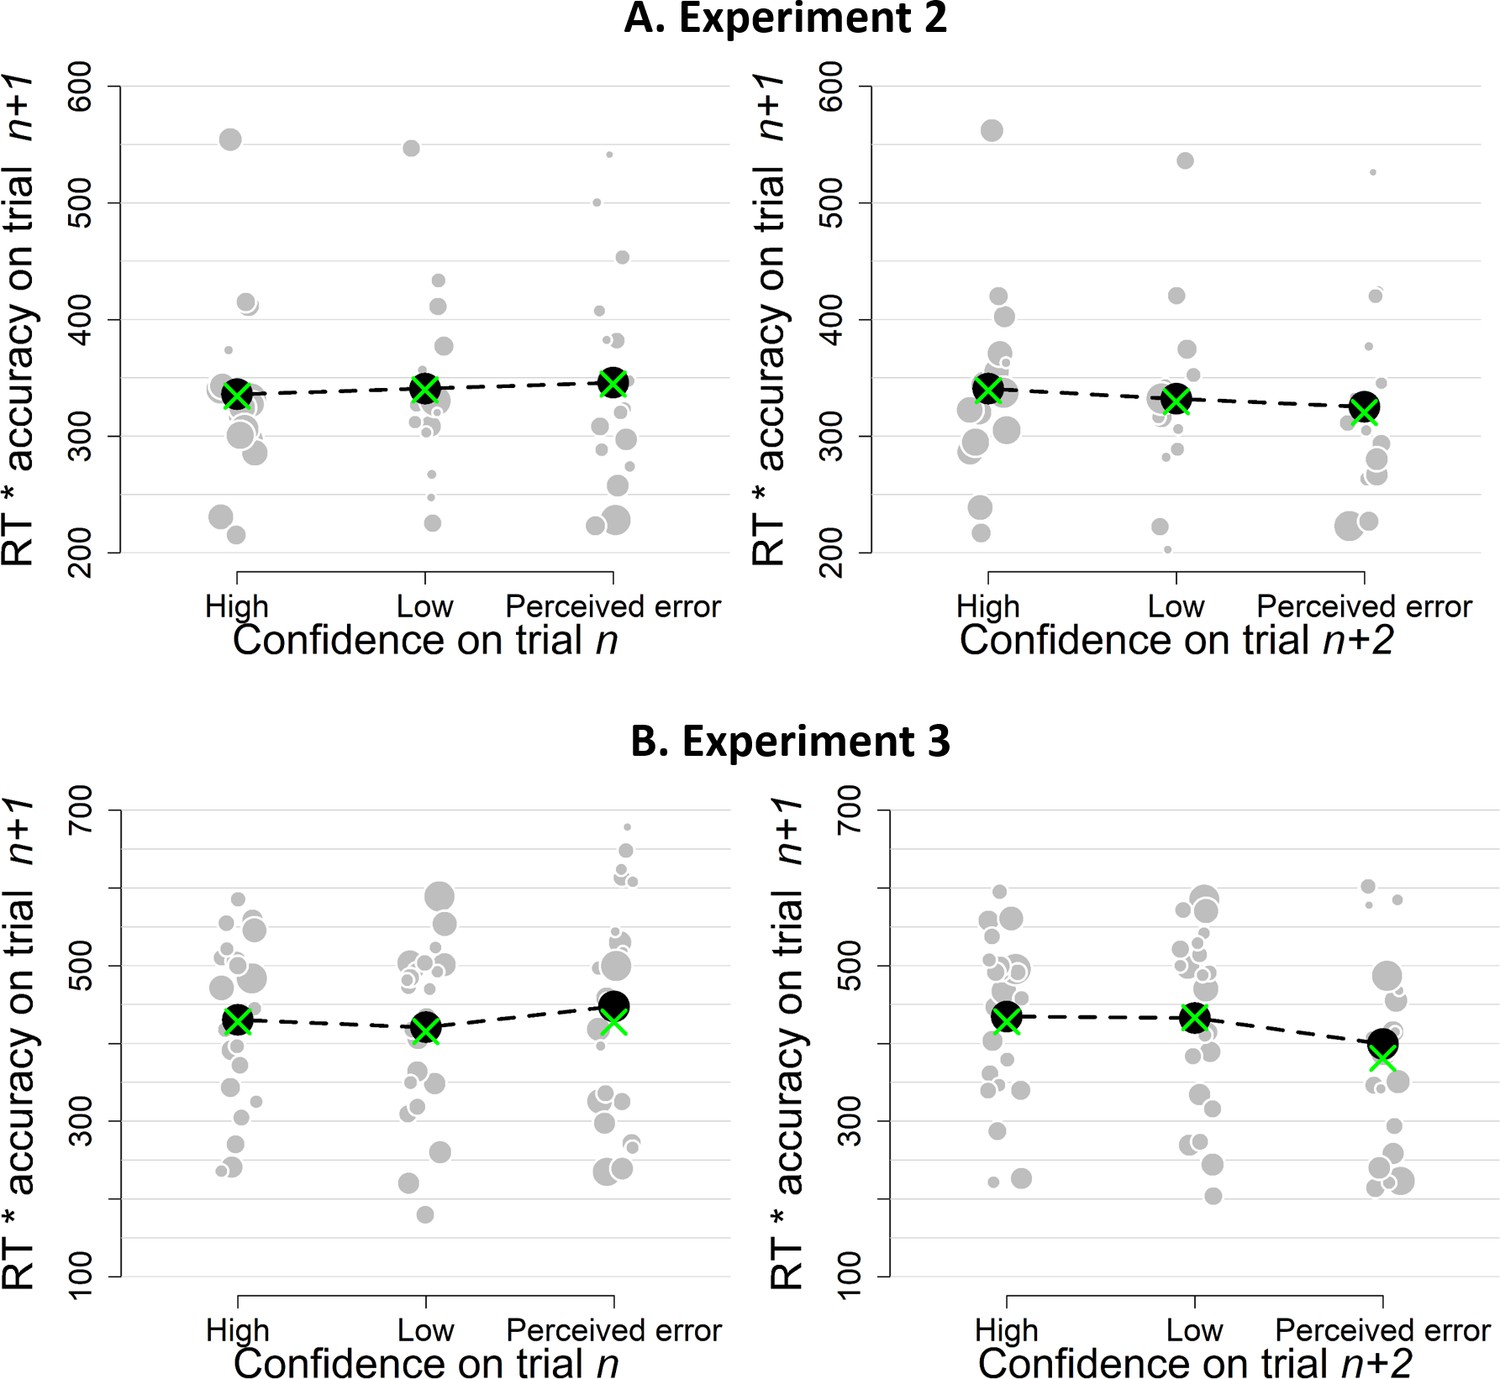
Simple effects of confidence on trialn and confidence on trialn+2 on the product of subsequent RTs and accuracy as a model-free measure of decision bound for Experiment 1 (A) and Experiment 2 (B).
Same conventions as in Figure 3.
Figure 5—figure supplement 3
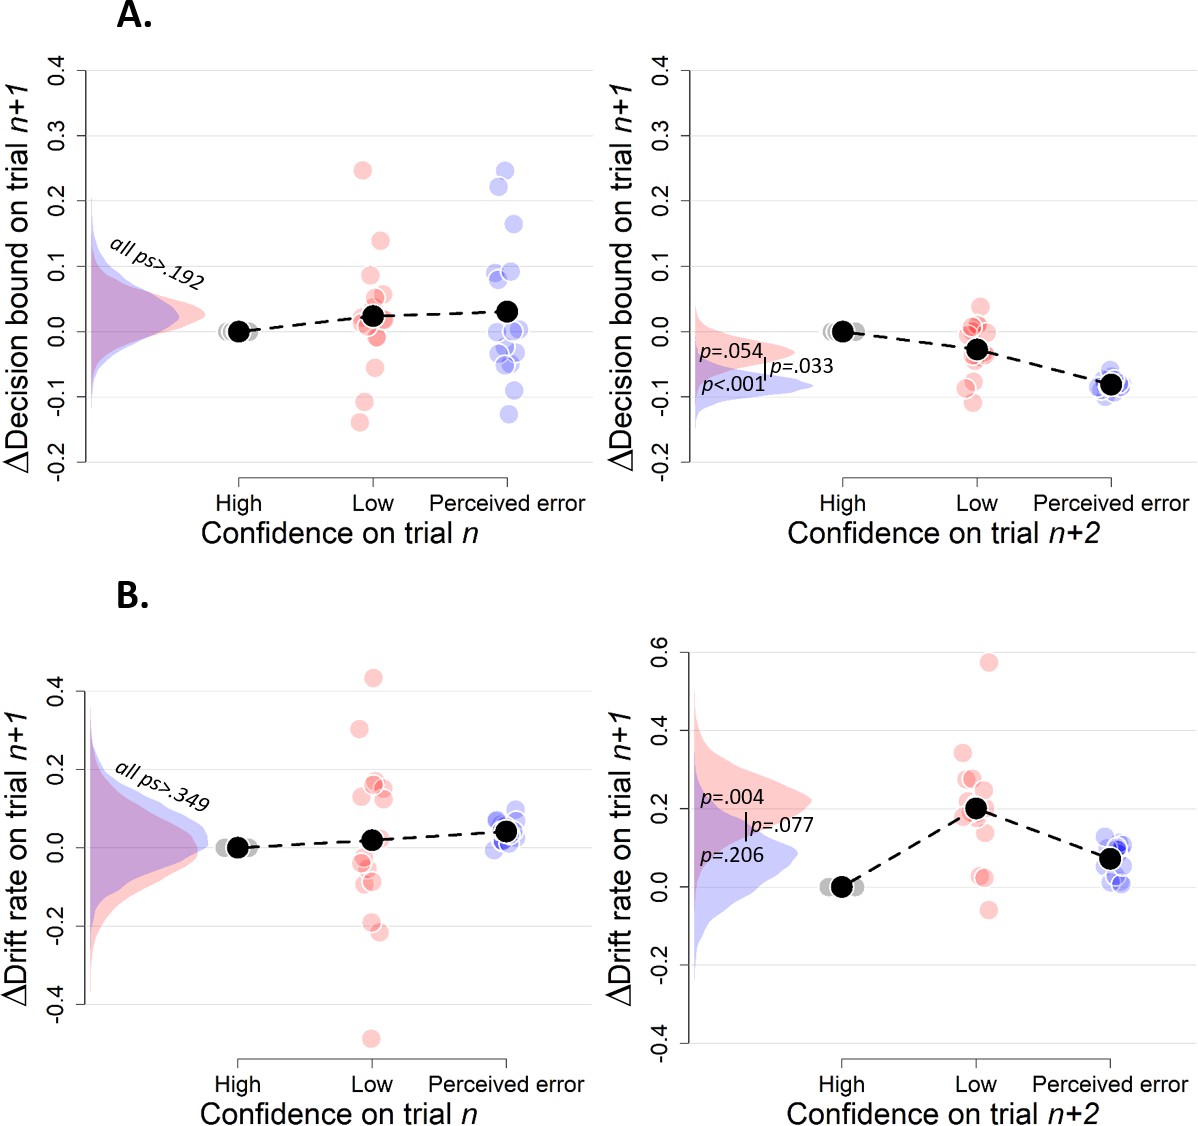
Simple effects of confidence on trialn and confidence on trialn+2 on decision bound (A) and drift rate (B) on trialn+1 (Experiment 2).
Trials with high confidence are treated as reference category.
Figure 5—figure supplement 4
Complementary approach controlling for slow fluctuations (Experiment 2).
Same procedure as in Figure 3—figure supplement 3. These results remained unchanged when only including correct trials (there were not enough trials when only including errors).
Figure 5—figure supplement 5
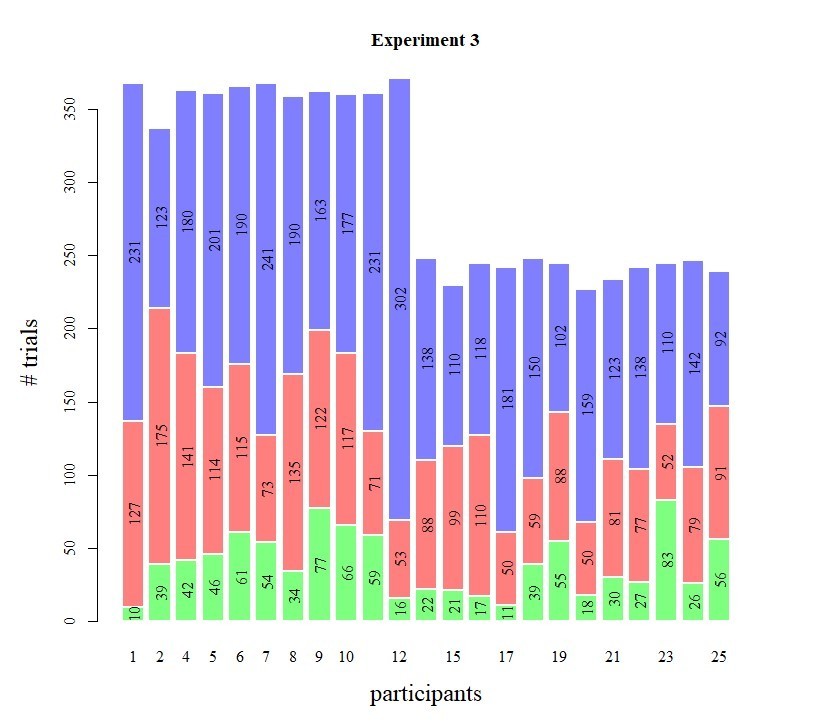
Behavioral results of Experiment 3.
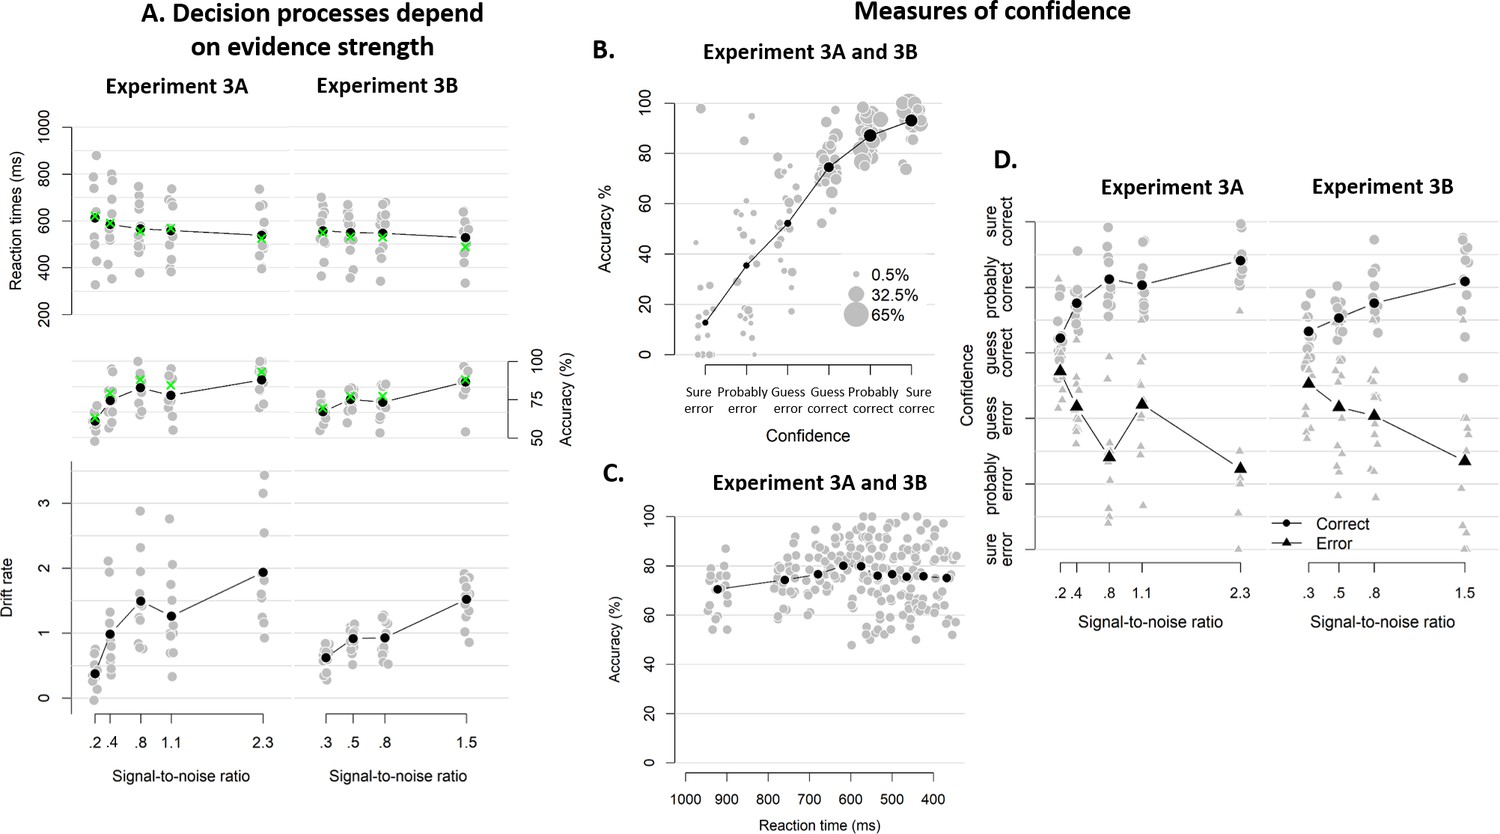
(A) Mean reaction time on correct trials (top), accuracy (upper middle) estimated mean drift rate (lower middle), and confidence (bottom) as a function of coherence level. RTs on correct trials and choice accuracy scaled with SNR In both experiments (Exp 3A: RT, F(4, 3012.3)=21.60, p<0.001, error rates, X²(4)=170.74, p<0.001; Exp 3B: RT, F(3, 2173.1)=3.07, p=0.027, error rates, X²(3)=83.311, p<0.001). Correspondingly, drift rates estimated from fits of a hierarchical drift diffusion model also increased monotonically with SNR in both experiments (Exp 3A: Friedman χ2(4)=41.02, p<0.001; Exp 2B: Friedman χ2(3)=31.61, p<0.001). In these model fits, decision bound was not allowed to vary as a function of SNR, and its average was 1.33 (SD = 0.17) and 1.33 (SD = 0.20) in Experiment 3A and 3b, respectively. Similarly, non-decision time was estimated independently from SNR, and its average was 0.28 (SD = 0.08) and. 022 (SD = 0.05). Green crosses show the fits from the DDM. (B) Accuracy as a function of decision confidence. Confidence ratings were closely linked to choice accuracy, even on a trial-by-trial basis while including SNR as a covariate (logistic regression of confidence on accuracy: significant positive slopes for 21 observers, with all ps < 0.001, and non-significant positive slopes for two observers, with both ps > 0.354), showing that confidence predicts accuracy over and above SNR. Dot size reflects the percentage of trials per confidence label, separately for each participant. (C) Accuracy as a function of reaction time. There was no linear relationship between RTs and accuracy, b = −0.001, p>0.545. A polynomial regression did, however, confirm the inverted U-shape seen in the data, t(29.2) = −3.19, p=0.003. (D) Confidence as a function of coherence level, separately for corrects and errors. Confidence judgments only scaled with SNR in Experiment 3A (Exp 3A: F(4,3953.9) = 37.34, p<0.001; Exp 3B: F(3,2867.1) < 1, p=0.141), but there was a highly significant interaction between SNR and accuracy in both versions of the experiment (Exp 3A: F(4,3955.1) = 87.59, p<0.001; Exp 3B: F(3,2867.8) = 48.16, p<0.001): confidence increased with SNR for corrects (linear contrast: Exp 3A: p<0.001; Exp 3B: p<0.001) and decreased with SNR for errors (linear contrast: Exp 3A: p<0.001; Exp 3B: p<0.001).
Figure 5—figure supplement 6
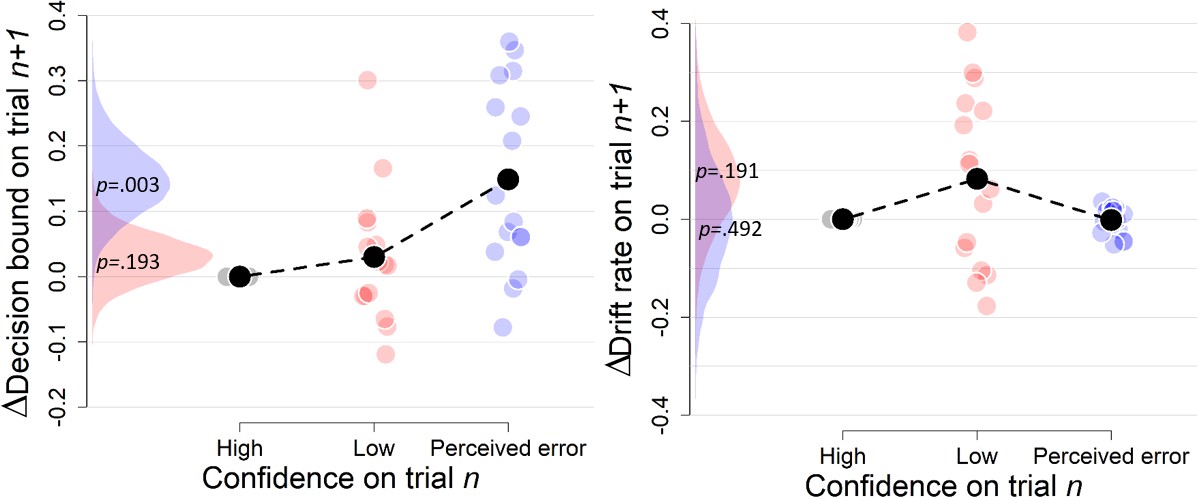
Simple effects of confidence on trialn and confidence on trialn+2 on decision bound (A) and drift rate (B) on trialn+1 (Experiment 3).
Trials with high confidence are treated as reference category.
Figure 5—figure supplement 7
Complementary approach controlling for slow drifts in performance (Experiment 3).
Same procedure as in Figure 3—figure supplement 3. When only including correct trials, the effect of perceived errors on drift rate turned non-significant, p=0.250, apart from that the results remained unchanged (there were not enough trials when only including errors).
Figure 6
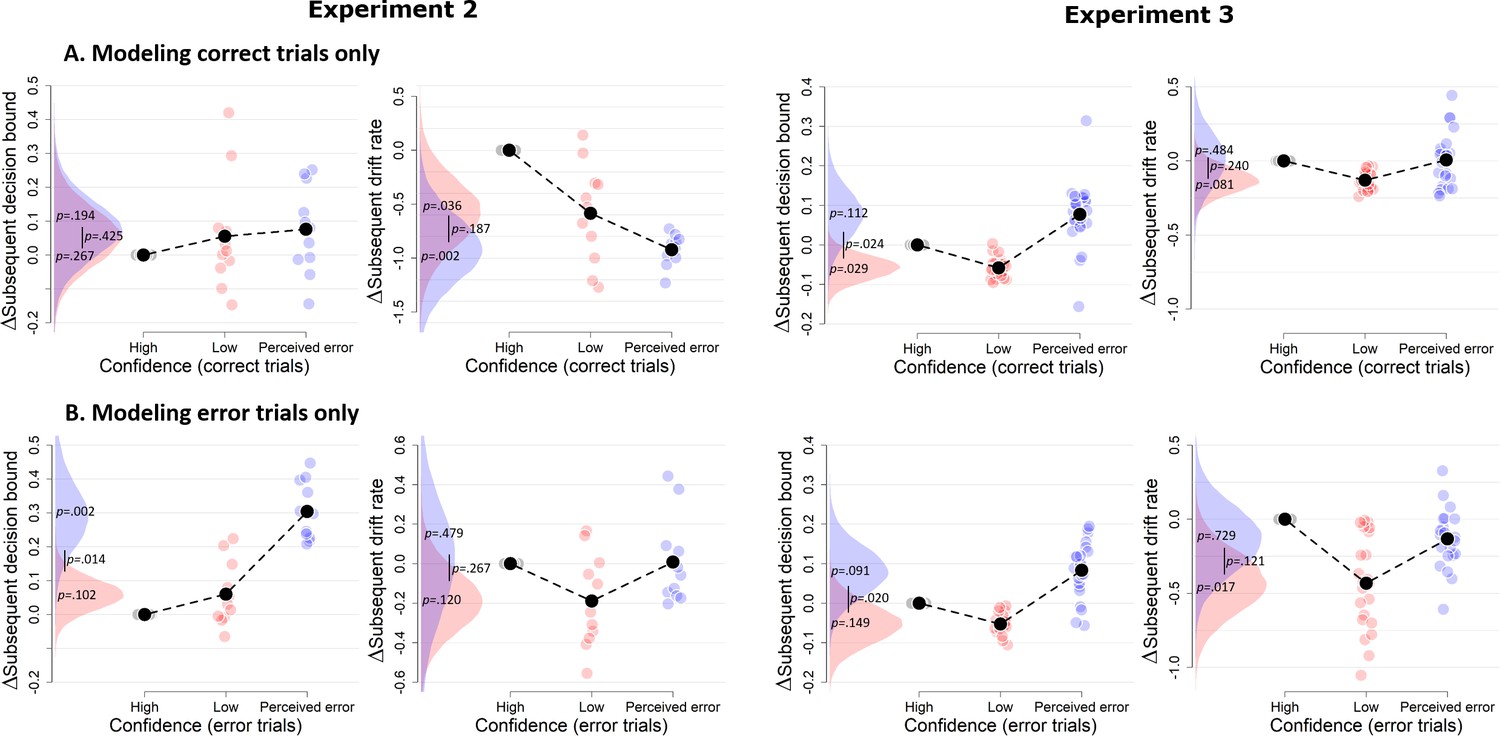
Confidence-dependent modulation of decision bound remains qualitatively similar when modeling only correct (A) or only error trials (B).
Due to a lack of trials in one of the cells, the results shown in A and B are based on 11 participants for Experiment 2, and respectively 22 and 23 participants for Experiment 3.
Figure 7
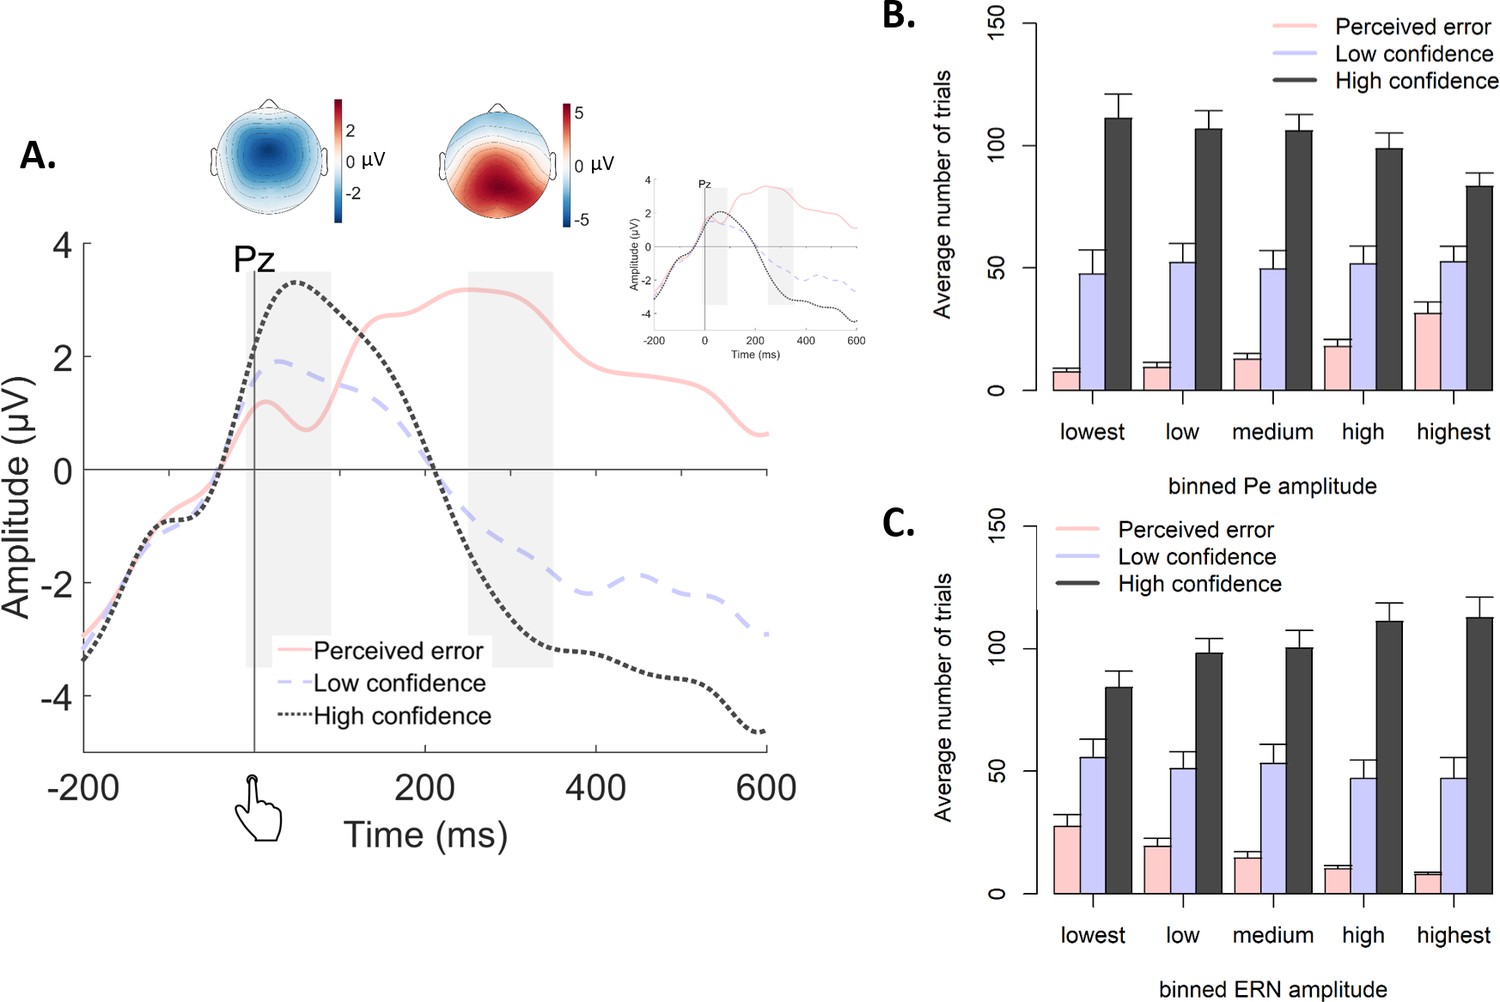
Post-decisional ERPs in Experiment 2.
(A) Response-locked grand-average ERPs at electrode Pz, separately for the three levels of confidence. Gray bars represent the ERN (−10 ms to 90 ms) and the Pe (250 ms to 350 ms). Inset shows the same ERPs after regressing out the ERN. Topographic plots display amplitude differences between high confidence and perceived errors. (B–C) Average number of trials in each bin of the Pe (C) and the ERN (D), separately for the levels of confidence.
Figure 8 with 4 supplements
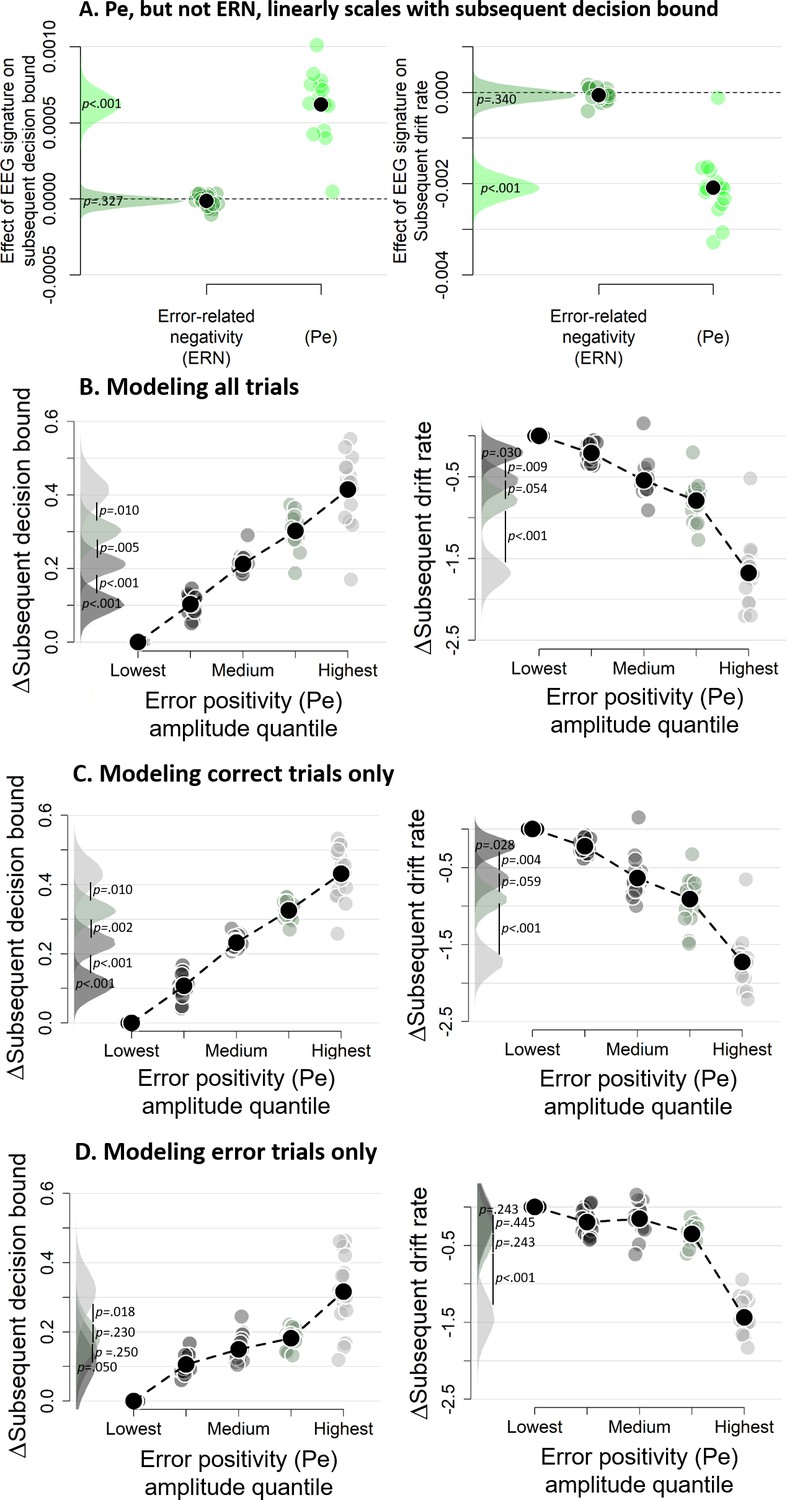
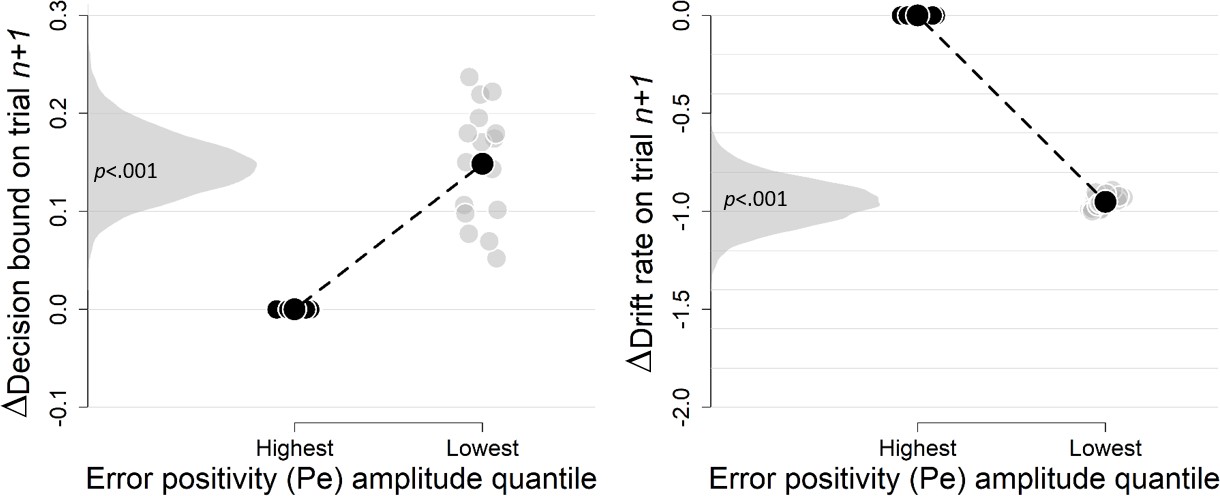
Subsequent decision bounds and drift rates (A) as a function of Pe and ERN.
(B) Pe-dependent variations in subsequent decision computation. (C-D) Modeling results remain qualitatively similar when modeling only correct (B) or only error trials (C). The bin with the lowest Pe amplitude quantile was always treated as reference category (i.e., fixed to zero). Data were fit using the regression approach, so values reflect coefficients.
Figure 8—figure supplement 1
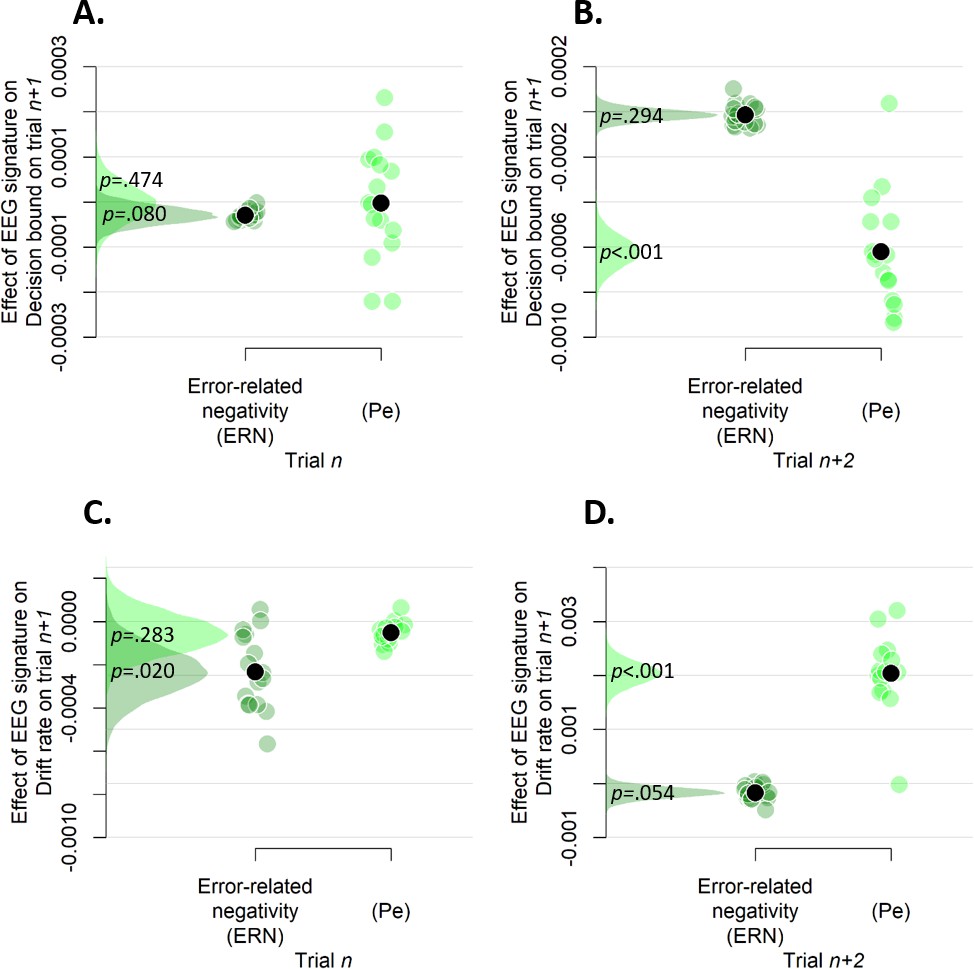
Simple effects of rank-ordered Pe and ERN amplitude on trialn (A and C) and trialn+2 (B and D) on decision bound (A and B) and drift rate (C and D) on trialn+1.
https://doi.org/10.7554/eLife.43499.022
Figure 8—figure supplement 2
Pe effects without regressing out the ERN.
(A-B) Pe-dependent variations in subsequent decision computation without regressing out the ERN. Subsequent decision bounds (C) and drift rates (D). The bin with the lowest Pe amplitude was always treated as reference category (i.e., fixed to zero).
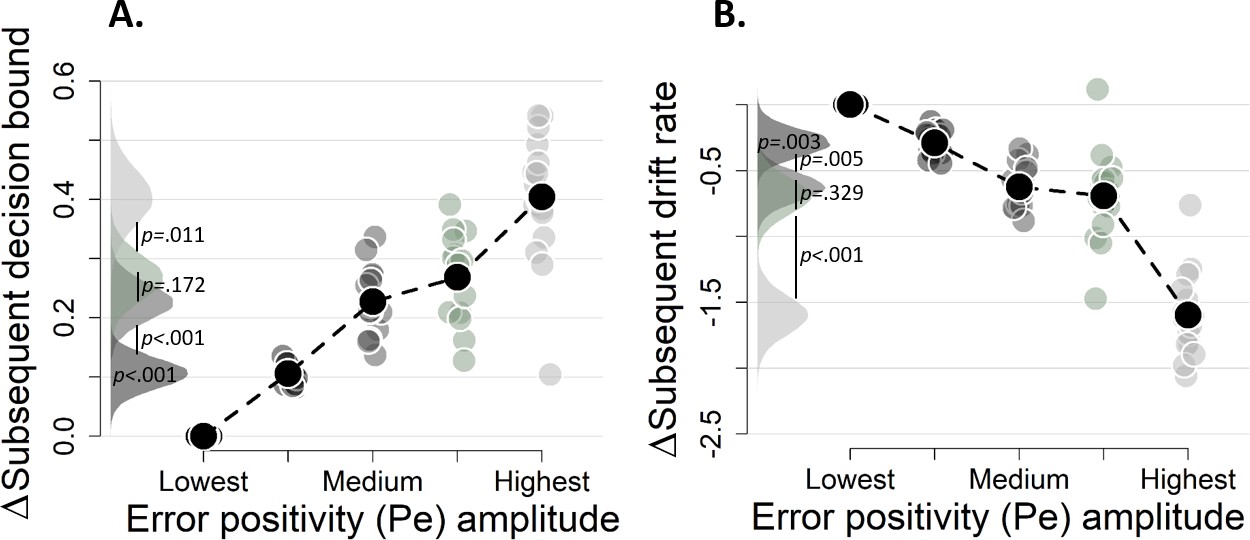
Figure 8—figure supplement 3
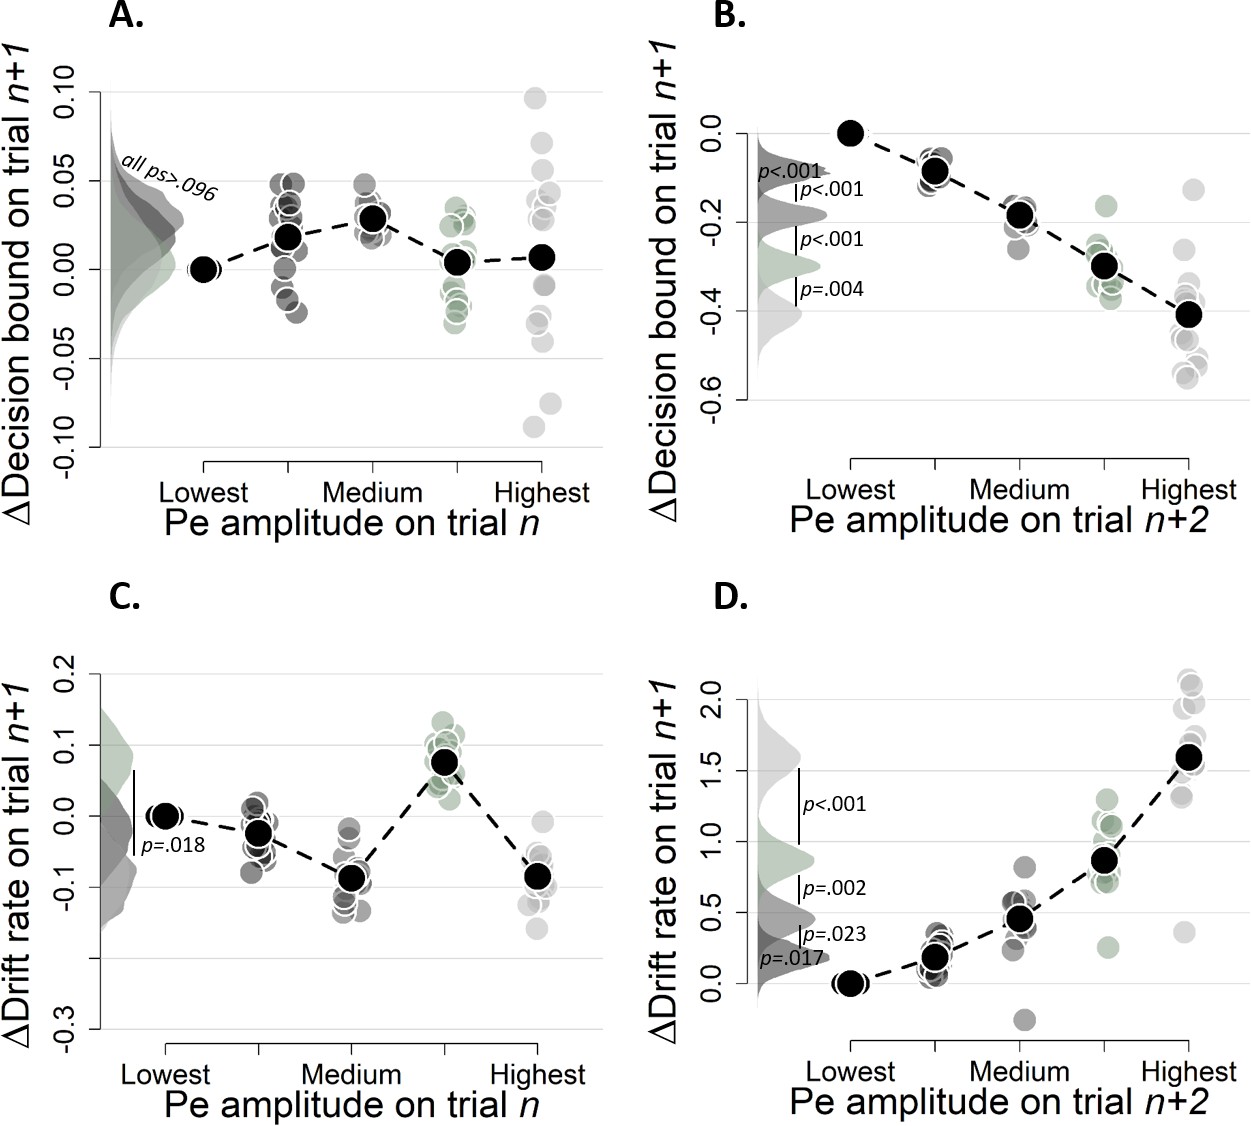
Simple effects of binned Pe amplitude on trial n (A and C) and binned Pe amplitude trialn+2 (B and D) on decision bound (A and B) and drift rate (C and D) on trialn+1 (Experiment 2).
Same conventions as in Figure 8, the bin with the lowest mean amplitude is treated as reference category. Bins were created after first regressing out the ERN from the raw signal.
Figure 8—figure supplement 4
Complementary approach controlling for slow drifts in performance (EEG data).
Same procedure as in Figure 3—figure supplement 3. The results remained unchanged when only including correct trials (there were not enough trials when only including errors).
Author response image 1
Author response image 2
Author response image 3
Author response image 4
Author response image 5
Author response image 6
Additional files
-
Transparent reporting form
- https://doi.org/10.7554/eLife.43499.026
Download links
A two-part list of links to download the article, or parts of the article, in various formats.
Downloads (link to download the article as PDF)
Open citations (links to open the citations from this article in various online reference manager services)
Cite this article (links to download the citations from this article in formats compatible with various reference manager tools)
Confidence predicts speed-accuracy tradeoff for subsequent decisions
eLife 8:e43499.
https://doi.org/10.7554/eLife.43499


