Heparin-induced tau filaments are polymorphic and differ from those in Alzheimer’s and Pick’s diseases
- MRC Laboratory of Molecular Biology, United Kingdom
Figures
Figure 1 with 2 supplements
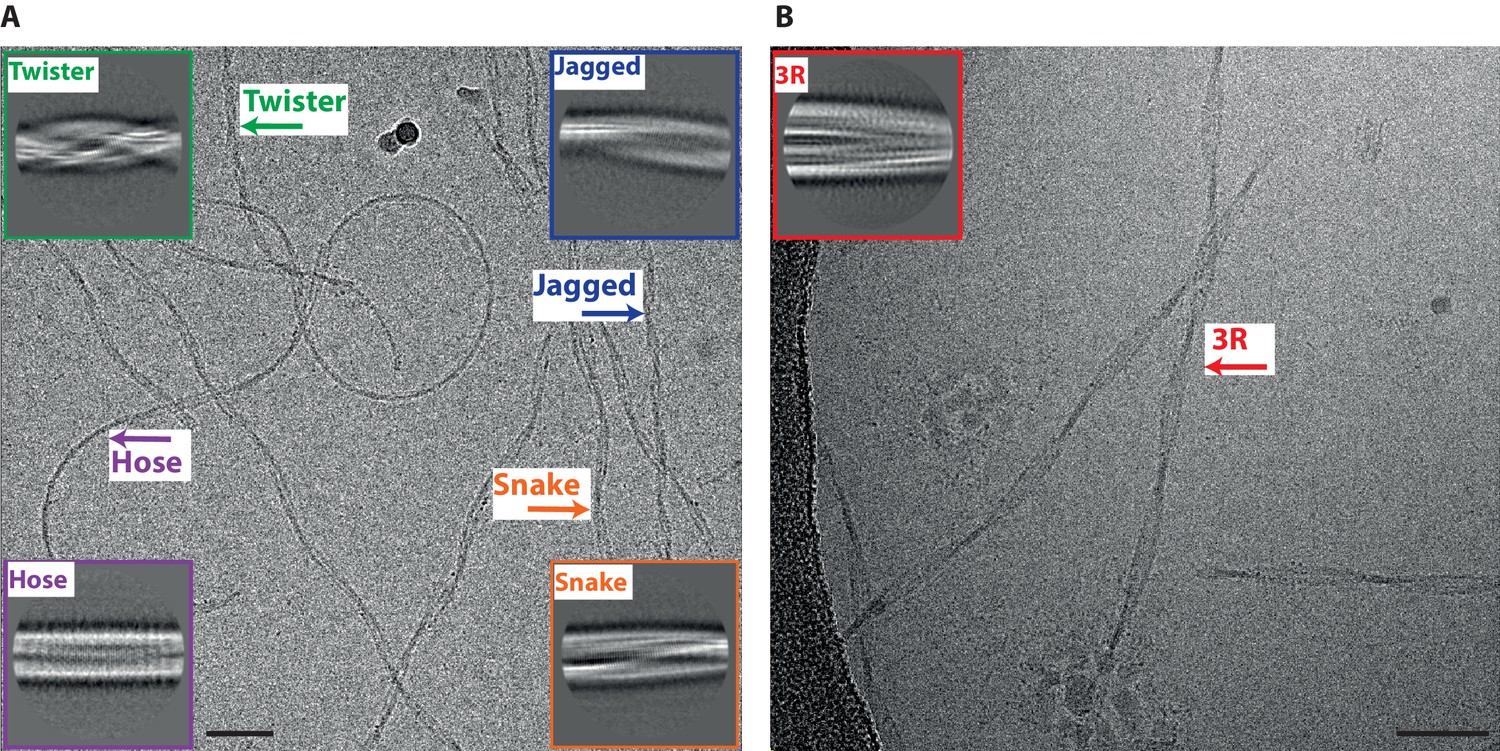
Different types of heparin-induced tau filaments.
(A) Cryo-EM image of heparin-induced 2N4R tau filaments. (B) Cryo-EM image of heparin-induced 2N3R tau filaments. 2D class averages of each filament type are shown as insets. Scale bars, 50 nm.
Figure 1—figure supplement 1

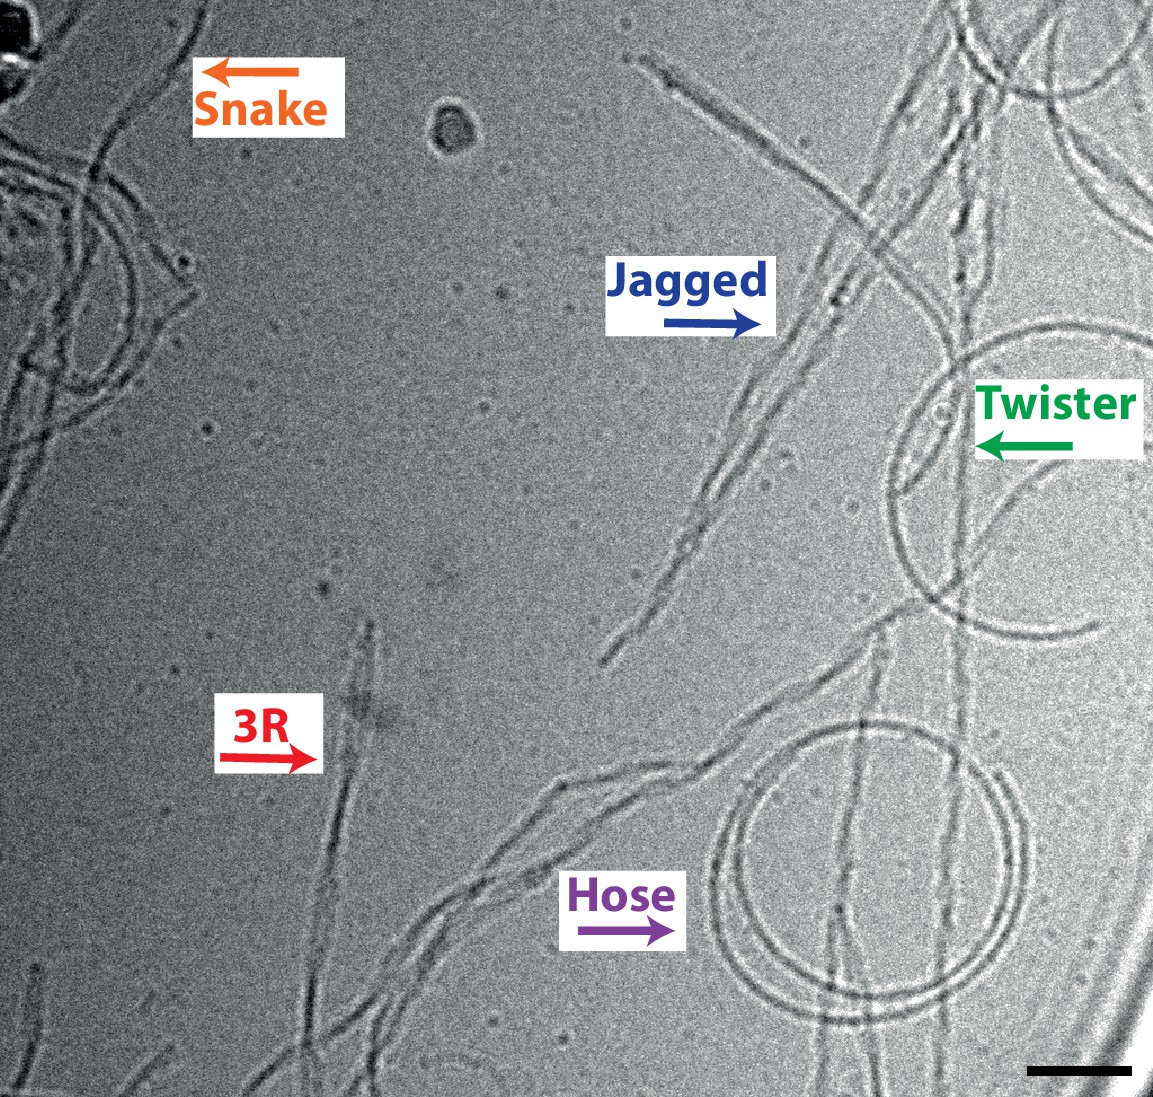
Heparin-induced tau filaments can change from one type into another.
Scale bars, 50 nm.
Figure 1—figure supplement 2
Cryo-EM image of heparin-induced filaments assembled from a mixture of 2N4R and 2N3R tau.
Scale bars, 50 nm.
Figure 2 with 1 supplement
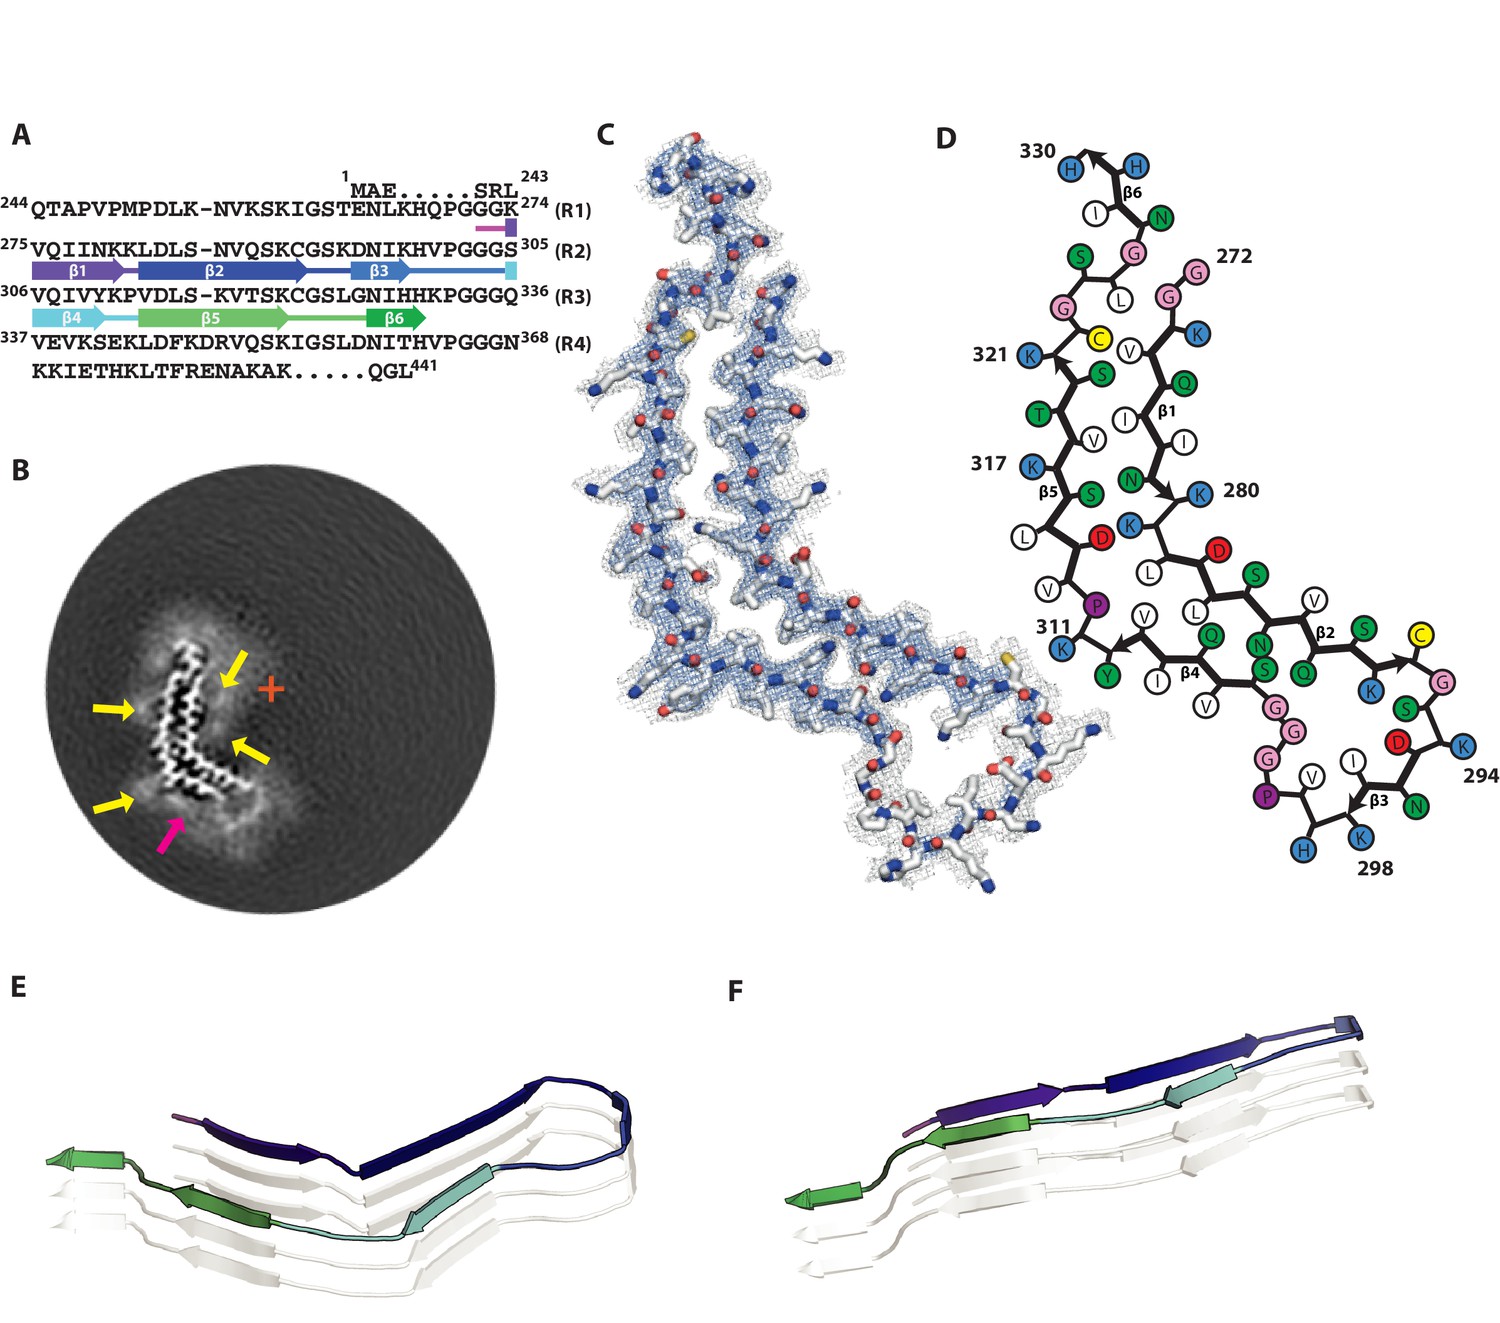
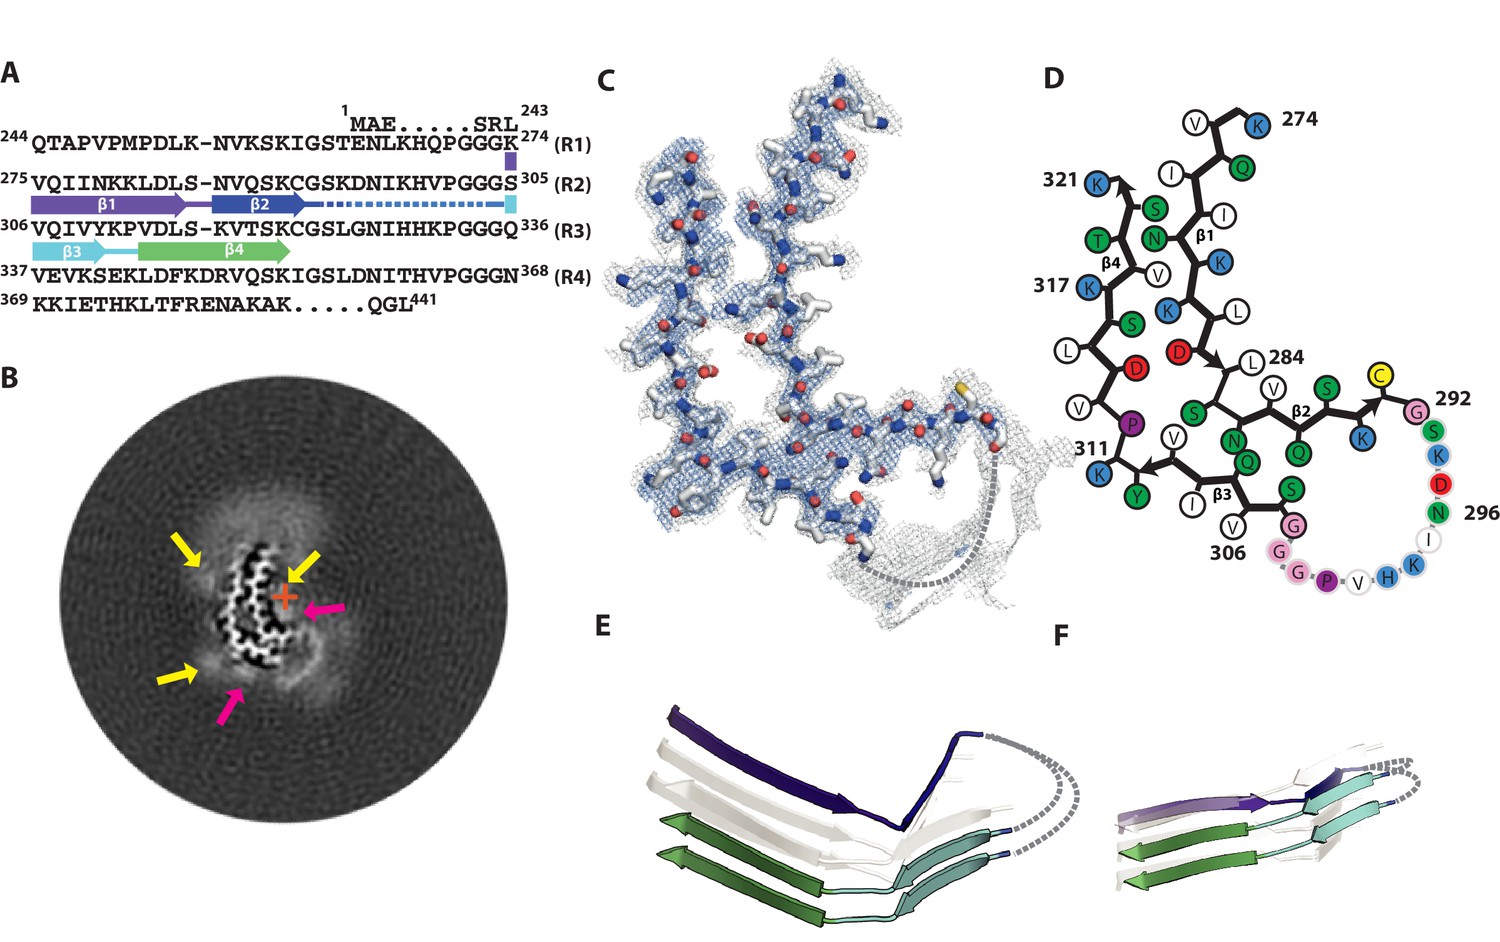
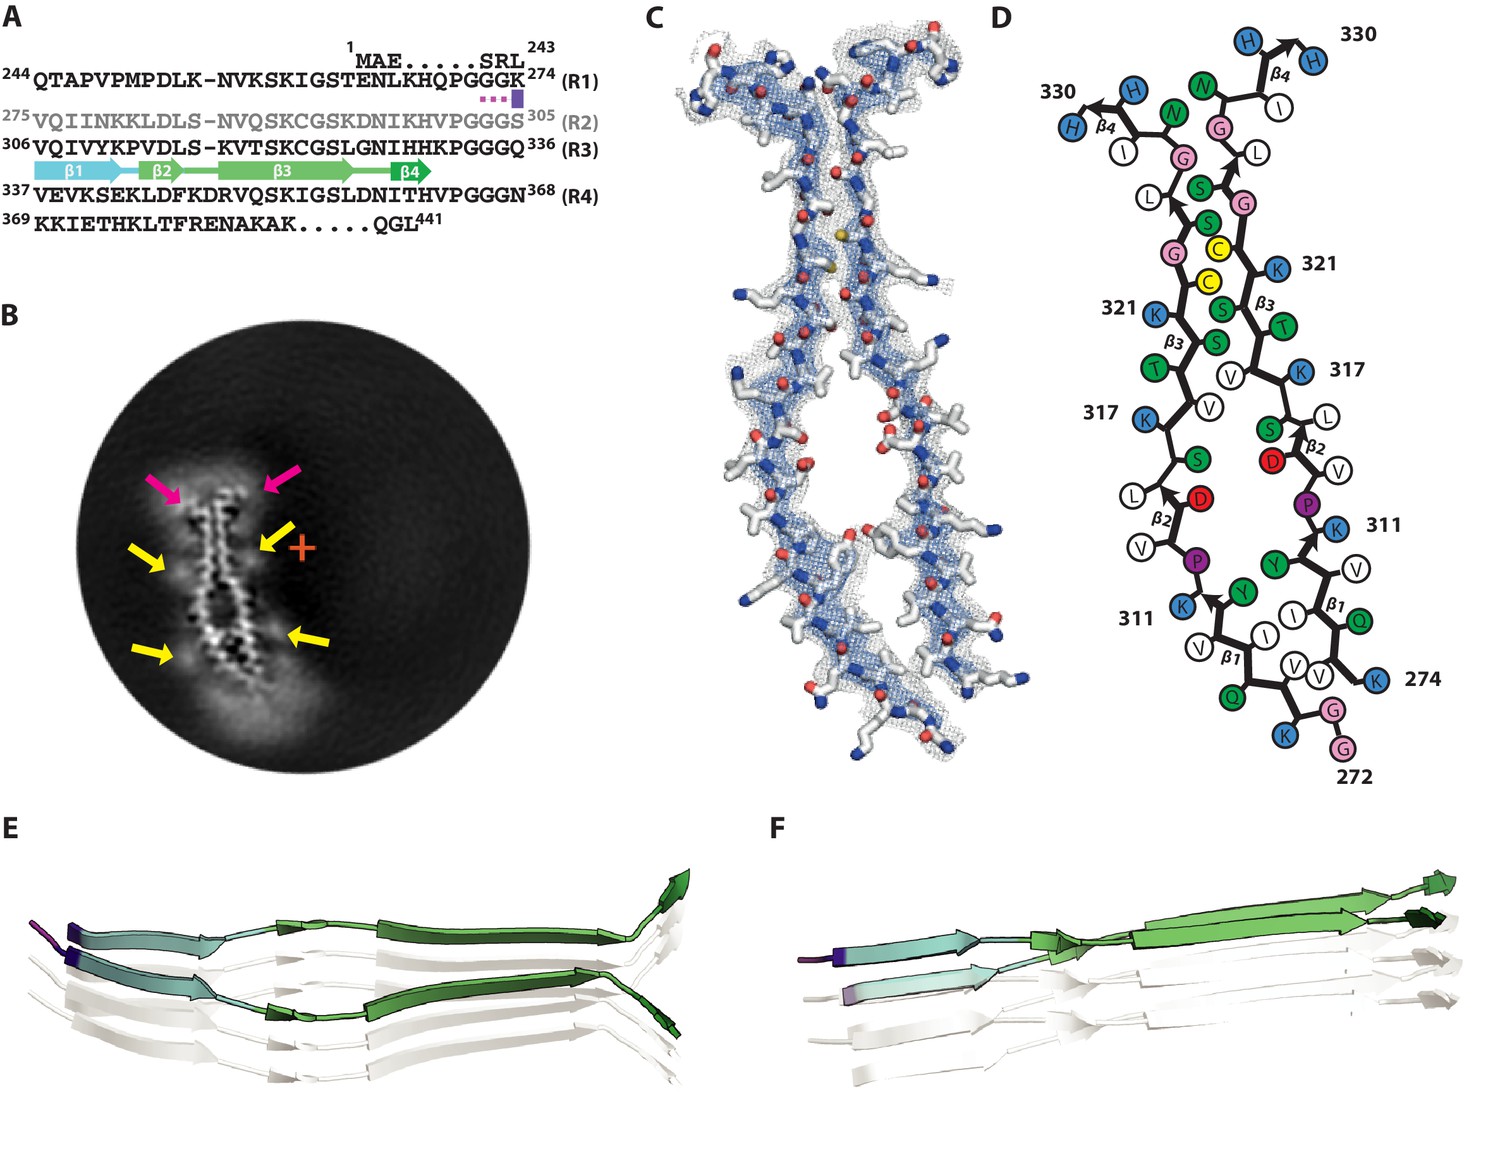
Cryo-EM structure of 2N4R tau snake filaments.
(A) β-strands and loop regions in the filaments are shown in different colours below the primary sequence of the microtubule-binding repeats (R1–R4). (B) Central slice of the 3D map. The position of the helical axis is indicated by a red cross, extra densities close to outward-facing lysines by yellow arrows, and extra density in front of the hydrophobic patches by a pink arrow. (C) Cryo-EM density with the atomic model. The sharpened, high-resolution map is in blue, and an unsharpened, 4.0 Å low-pass filtered map in grey. (D) Schematic view of the snake filament. (E) Rendered view of secondary structure elements in three successive rungs. (F) As in E, but in a view perpendicular to the helical axis.
Figure 2—figure supplement 1
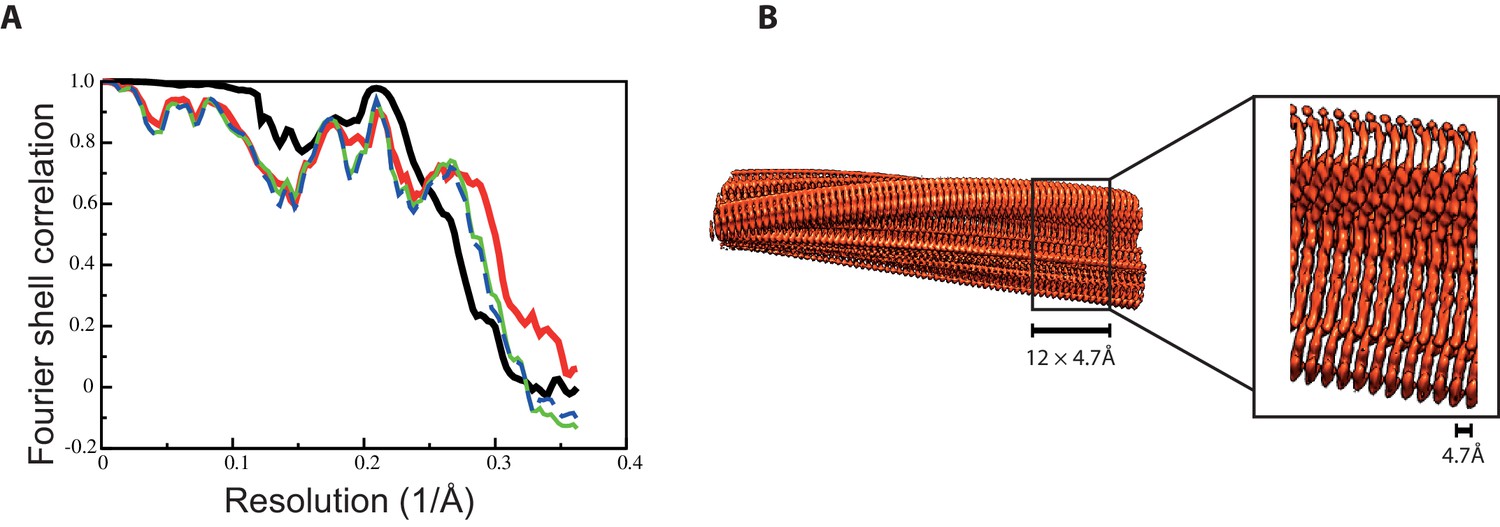
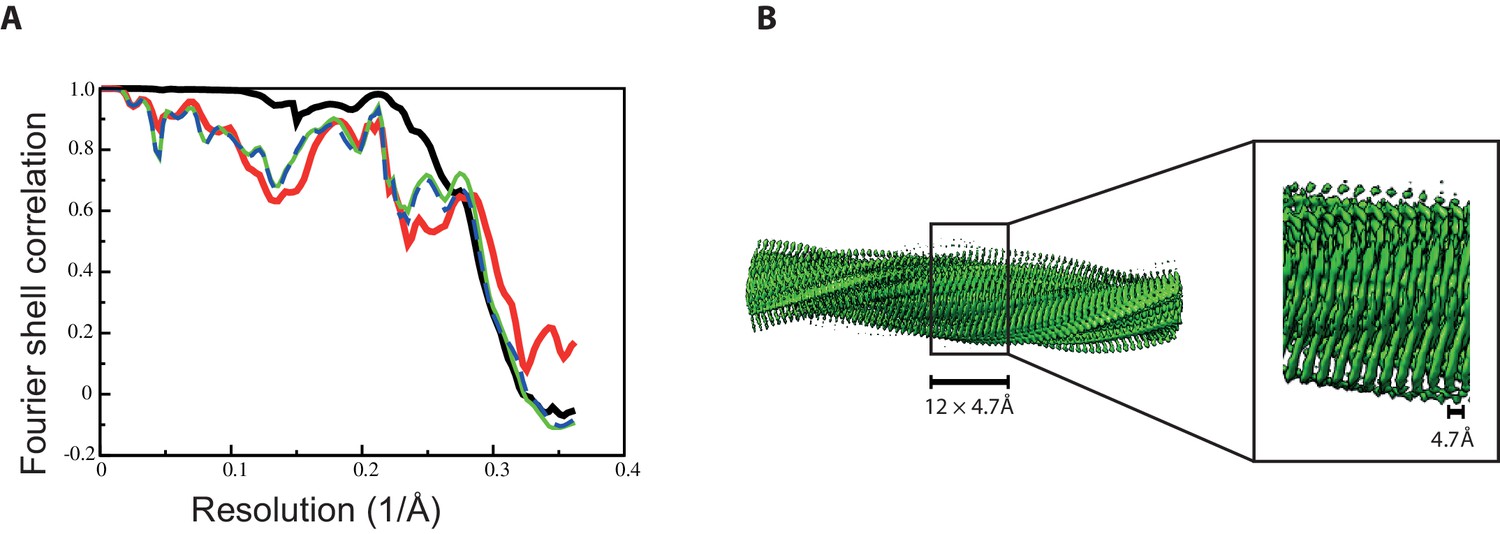
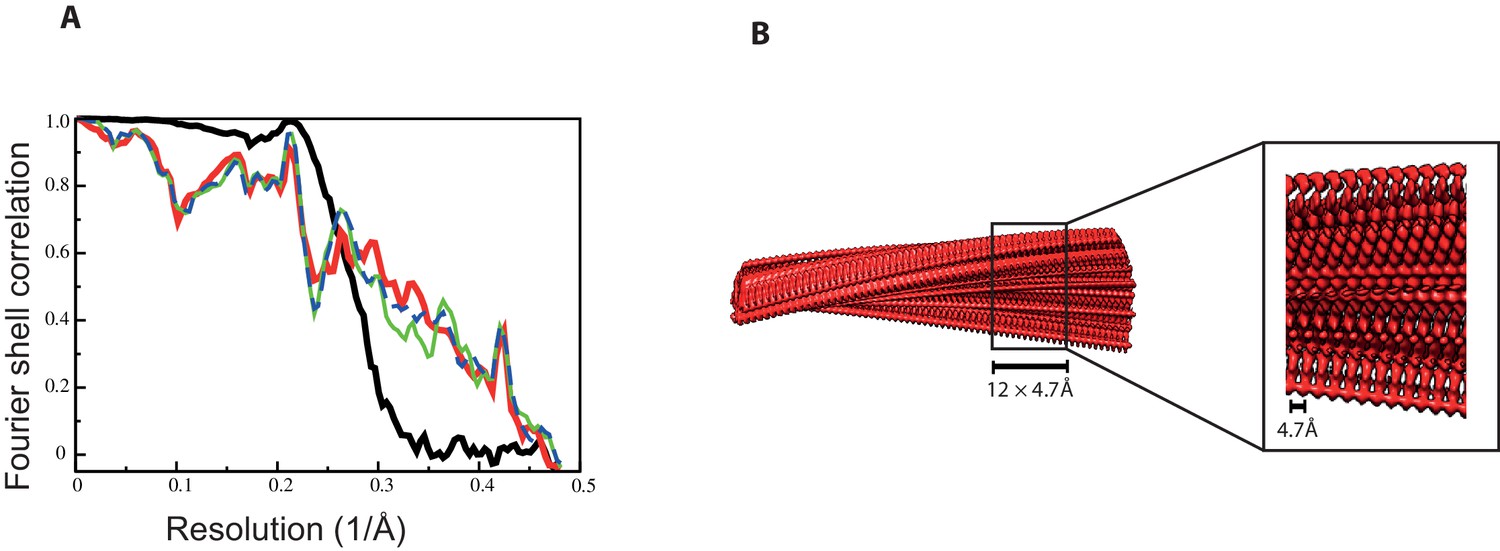
Fourier shell correlation curves and side views of the 3D reconstruction of 2N4R tau snake filaments.
(A) Fourier shell correlation curves between two independently refined half-maps (black, solid), of the final model versus the full map (red, solid), of a model refined in the first independent half map versus the first half map (green, solid), and of the same model versus the second independent half map, which was not used for refinement (blue, dashed) (B) Side views of the 3D reconstruction. The detailed view of the helical axis is at higher threshold to show it more clearly.
Figure 3 with 1 supplement
Cryo-EM structure of 2N4R tau twister filaments.
(A) β-strands and loop regions in the filaments are shown in different colours below the primary sequence of the microtubule-binding repeats (R1–R4). (B) Central slice of the 3D map. The position of the helical axis is indicated by a red cross, extra densities close to the outward-facing lysines by yellow arrows, and extra density in front of the hydrophobic patches by pink arrows. (C) Cryo-EM density with the atomic model. The sharpened, high-resolution map is in blue, and an unsharpened, 4.0 Å low-pass filtered map in grey. (D) Schematic view of the twister filament. (E) Rendered view of secondary structure elements in three successive rungs. (F) As in E, but in a view perpendicular to the helical axis.
Figure 3—figure supplement 1
Fourier shell correlation curves and side views of the 3D reconstruction of 2N4R tau twister filaments.
(A) Fourier shell correlation curves between two independently refined half-maps (black, solid), of the final model versus the full map (red, solid), of a model refined in the first independent half map versus the first half map (green, solid), and of the same model versus the second independent half map, which was not used for refinement (blue, dashed) (B) Side views of the 3D reconstruction. The detailed view of the helical axis is at higher threshold to show it more clearly.
Figure 4 with 1 supplement
Cryo-EM structure of 2N4R tau jagged filaments.
(A) β-strands and loop regions in the filaments are shown in different colours below the primary sequence of the microtubule-binding repeats (R1–R4). (B) Central slice of the 3D map. The position of the helical axis is indicated by a red cross, extra densities close to the outward-facing lysines by yellow arrows, and extra density in front of hydrophobic patches by a pink arrow. (C) Cryo-EM density with the atomic model. The sharpened, high-resolution map is in blue, and an unsharpened, 4.0 Å low-pass filtered map in grey. (D) Schematic view of the jagged filament. (E) Rendered view of the secondary structure elements in three successive rungs. (F) As in E, but in a view perpendicular to the helical axis.
Figure 4—figure supplement 1
Fourier shell correlation curves and side views of the 3D reconstruction of 2N4R tau jagged filaments.
(A) Fourier shell correlation curves between two independently refined half-maps (black, solid), of the final model versus the full map (red, solid), of a model refined in the first independent half map versus the first half map (green, solid), and of the same model versus the second independent half map, which was not used for refinement (blue, dashed) (B) Side views of the 3D reconstruction. The detailed view of the helical axis is at higher threshold to show it more clearly.
Figure 5 with 1 supplement
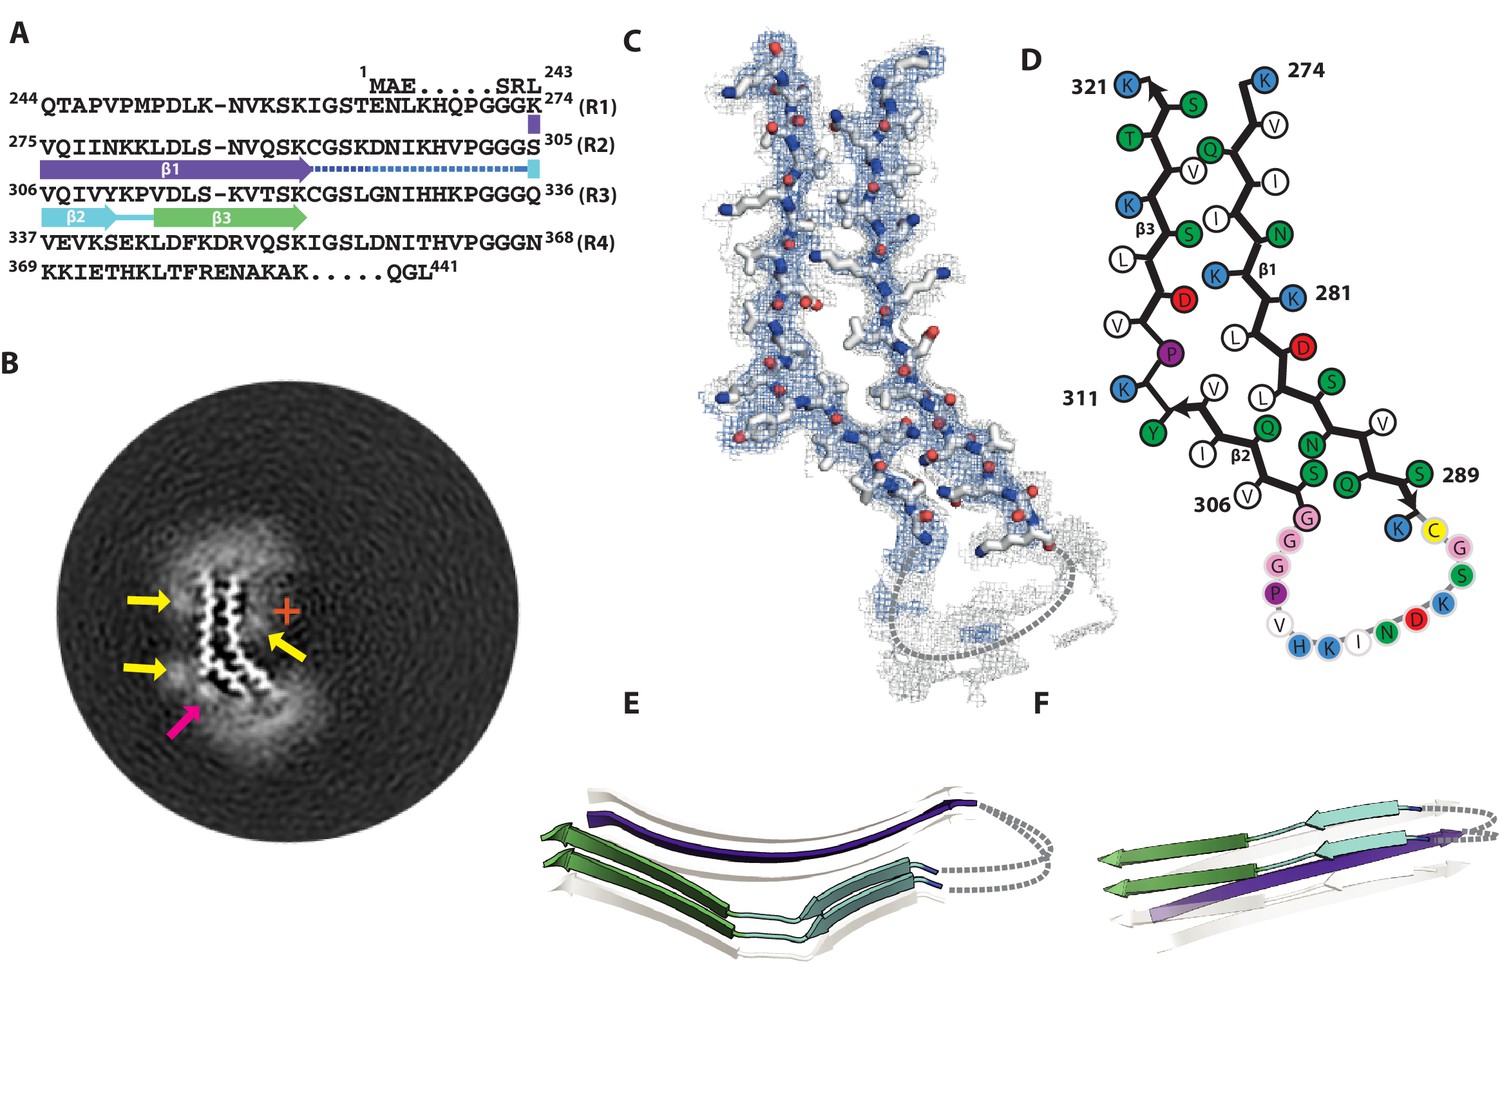
Cryo-EM structure of 2N3R tau filaments.
(A) β-strands and loop regions in the filaments are shown in different colours below the primary sequence of the microtubule-binding repeats (R1–R4). (B) Central slice of the 3D map. The position of the helical axis is indicated by a red cross, extra densities close to outward-facing lysines by yellow arrows, and extra density in front of hydrophobic patches by pink arrows. (C) Cryo-EM density with the atomic model. The sharpened, high-resolution map is in blue, an unsharpened, 4.0 Å low-pass filtered map in grey. (D) Schematic view of 2N3R tau filament. (E) Rendered view of the secondary structure elements in three successive rungs. (F) As in E, but in a view perpendicular to the helical axis.
Figure 5—figure supplement 1
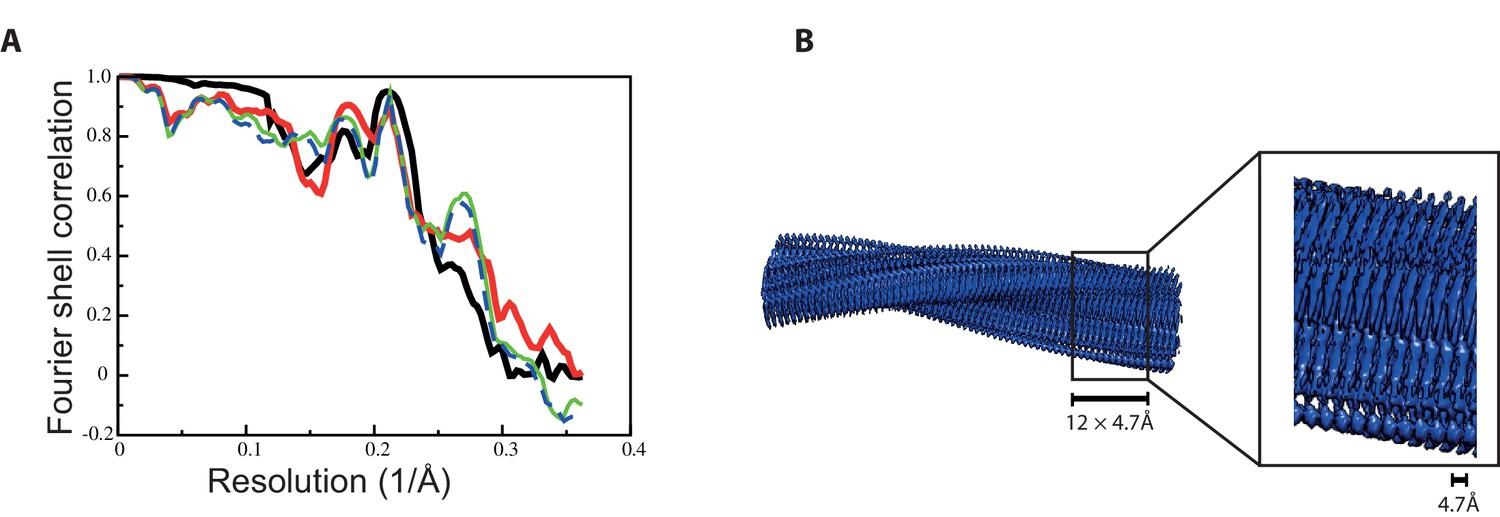
Fourier shell correlation curves and side views of the 3D reconstruction of 2N3R tau filaments.
(A) Fourier shell correlation curves between two independently refined half-maps (black, solid), of the final model versus the full map (red, solid), of a model refined in the first independent half map versus the first half map (green, solid), and of the same model versus the second independent half map, which was not used for refinement (blue, dashed) (B) Side views of the 3D reconstruction. The detailed view of the helical axis is at higher threshold to show it more clearly.
Figure 6 with 1 supplement
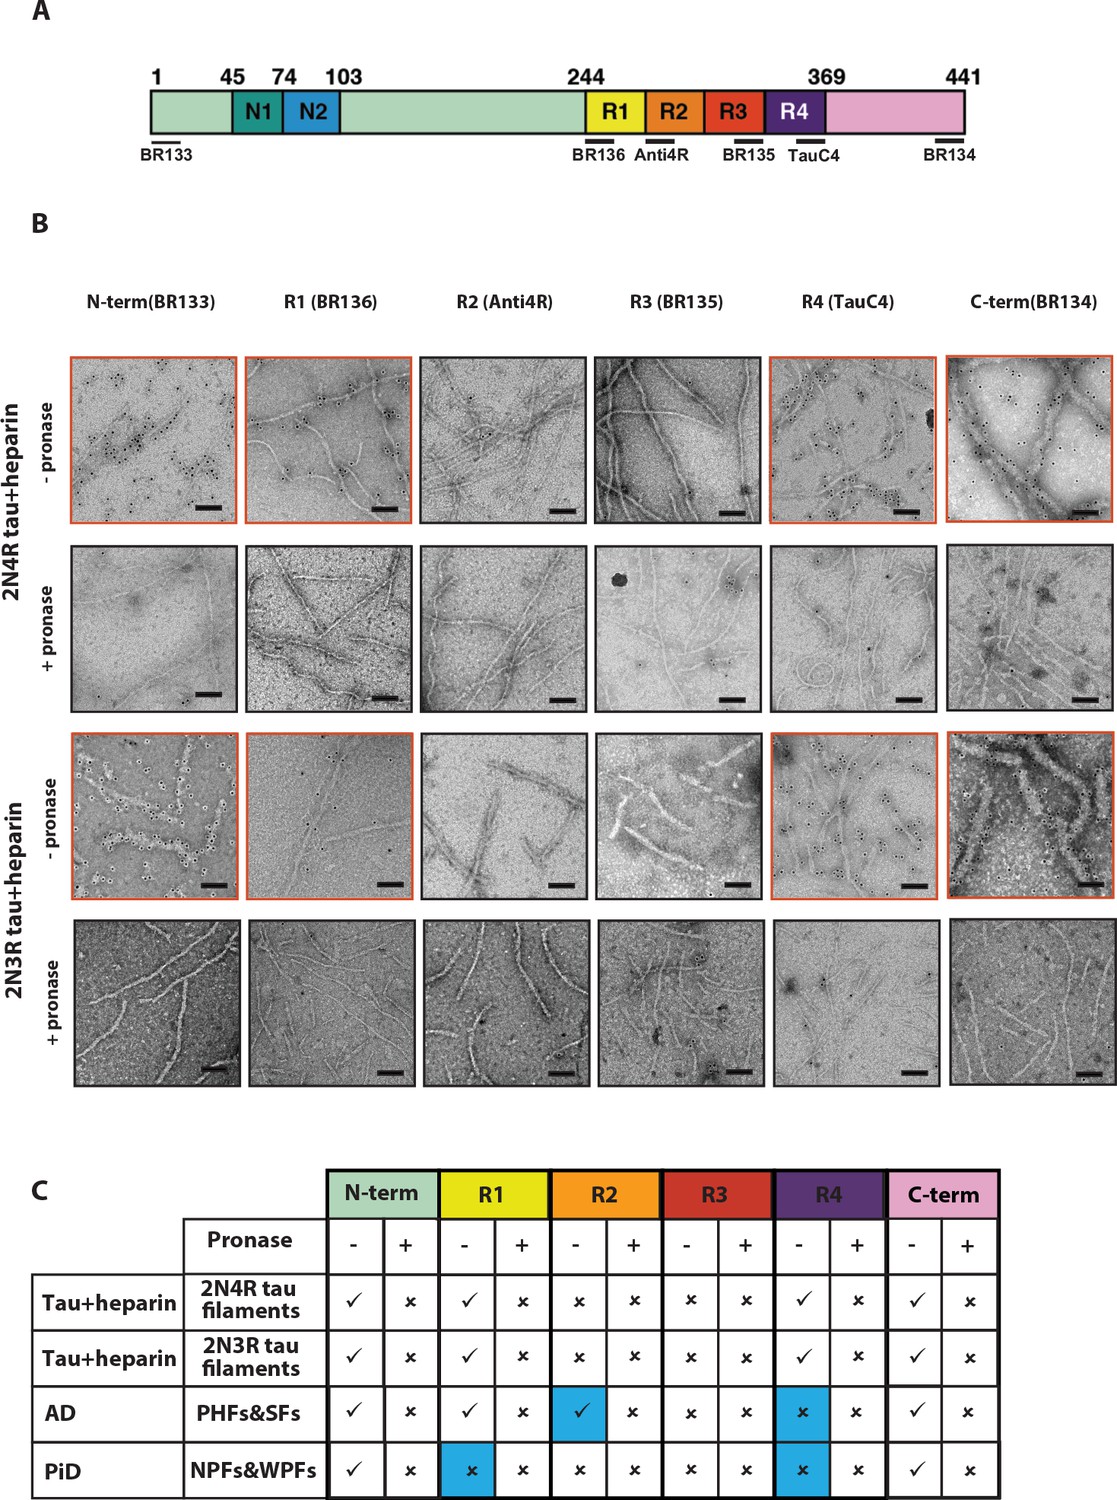
Immuno-EM of heparin-induced 2N4R and 2N3R tau filaments.
(A) Schematic of 2N4R tau with N-terminal inserts (N1 and N2) and microtubule-binding repeats (R1, R2, R3, R4) highlighted. The epitopes of antibodies BR133 (residues 1–16), BR136 (244-257), Anti4R (275-291), BR135 (323-335), TauC4 (354–369) and BR134 (428-441) are underlined. (B) Representative immuno-EM images with antibodies BR133, BR136, Anti4R, BR135, TauC4, and BR134 of heparin-induced 2N4R and 2N3R tau filaments without (-) and with pronase (+) treatment. Scale bar, 100 nm. (C) Table summarising the results from B, and comparison with the immuno-EM results of AD and PiD. Tick marks indicate antibody decoration of filaments; crosses indicate absence of decoration. The four boxes where the human diseases differ from the in vitro heparin-induced filaments are highlighted in blue.
Figure 6—figure supplement 1

Western blots.
Western blots of recombinant 2N3R and 2N4R tau using BR133, BR136, Anti4R, BR135, TauC4 and BR134.
Figure 7
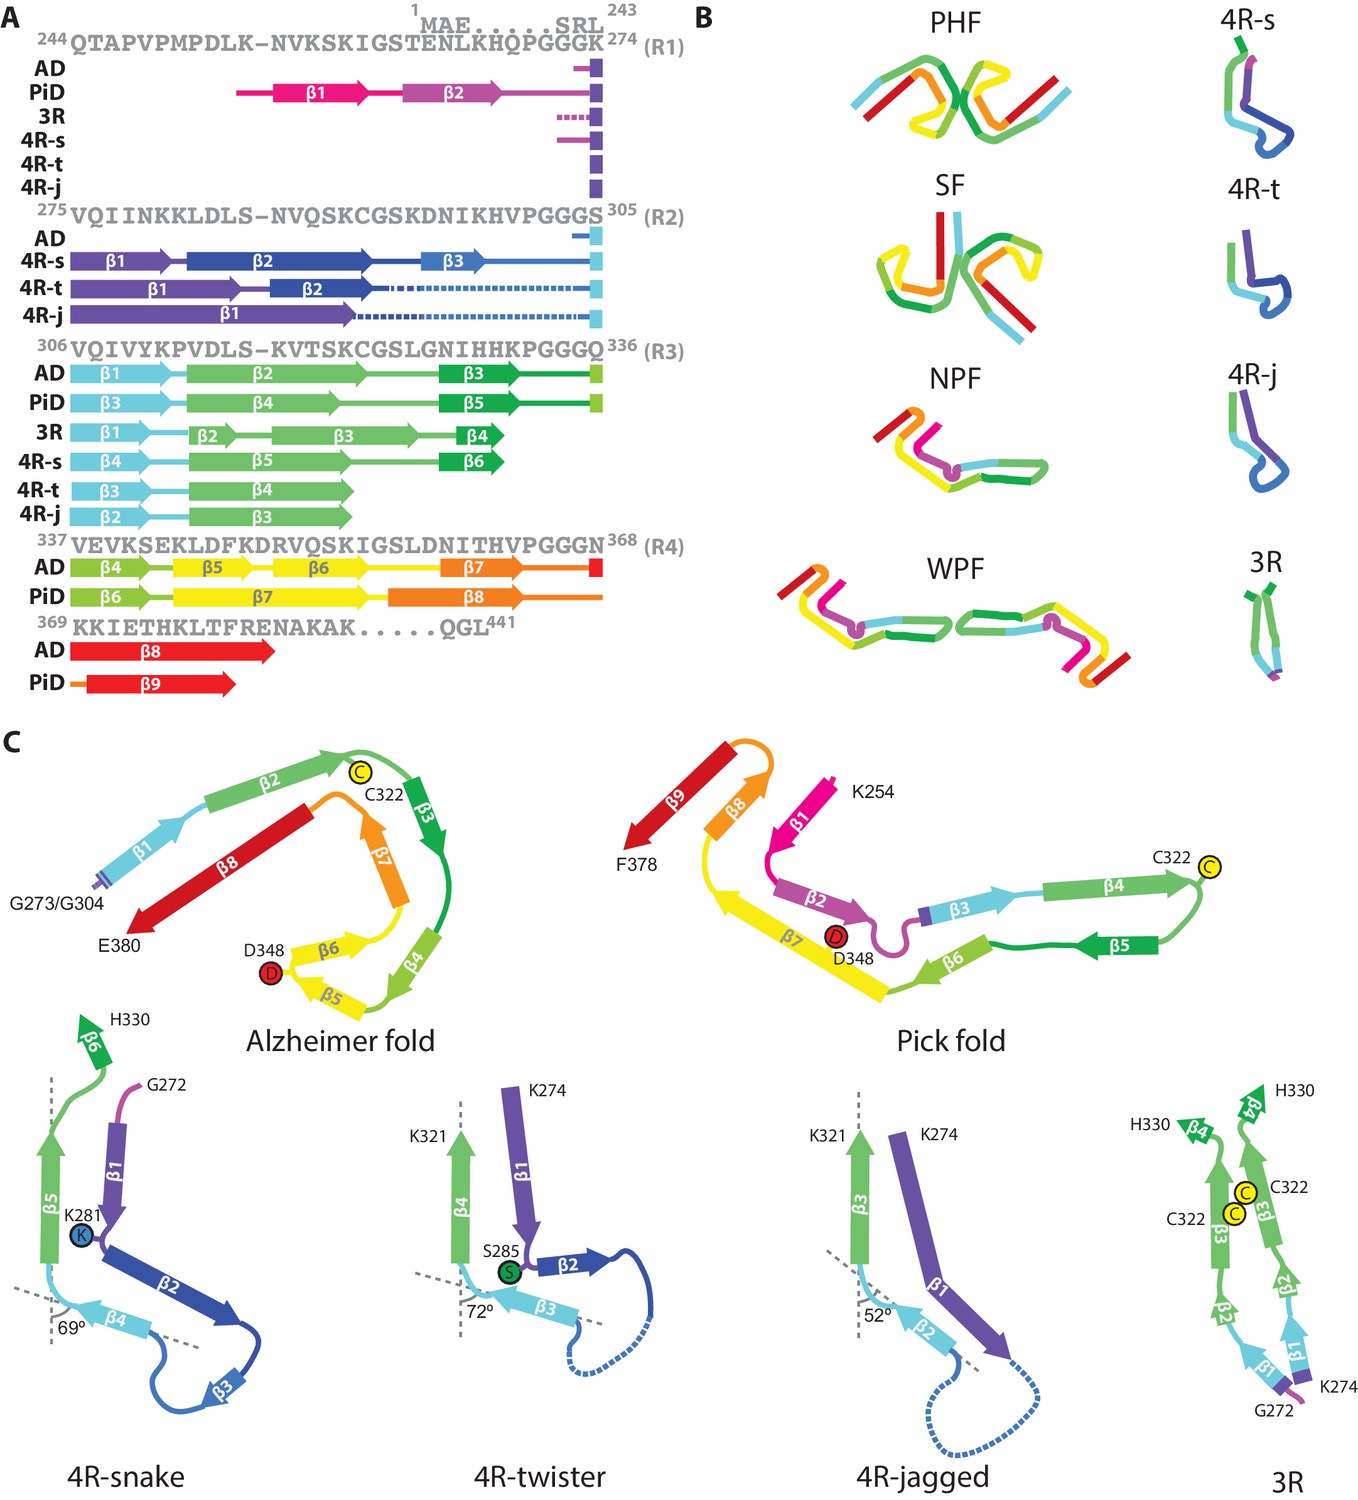
Comparison of known tau filament structures.
(A) β-strands and loop regions in the filaments are shown in different colours below the primary sequence of the microtubule-binding repeats (R1–R4). (B) Schematic representation of the different tau folds: the paired helical filament (PHF) and straight filament (SF) from Alzheimer's disease (AD); the narrow Pick filament (NPF) and wide Pick filament (WPF) from Pick's disease (PiD); the heparin-induced 2N4R snake (4 R-s), twister (4 R-t) and jagged (4 R-j); and the 2N3R heparin-induced filaments (3R). (C) Comparison of the structures of heparin-induced filaments of 2N4R and 2N3R tau with those of tau protofilaments from AD and PiD.
Tables
Table 1
Cryo-EM structure determination and model statistics
https://doi.org/10.7554/eLife.43584.011| 4 R-s | 4 R-t | 4 R-j | 3R | ||||||
|---|---|---|---|---|---|---|---|---|---|
| Data collection and processing | |||||||||
| Microscope | Polara | Polara | Polara | Titan Krios | |||||
| Voltage (kV) | 300 | 300 | 300 | 300 | |||||
| Detector | Falcon-III | Falcon-III | Falcon-III | K2 (post-GIF) | |||||
| Electron exposure (e–/Å2) | 50 | 50 | 50 | 50 | |||||
| Defocus range (μm) | −1.7 to −2.8 | −1.7 to −2.8 | −1.7 to −2.8 | −0.8 to −2.2 | |||||
| Pixel size (Å) | 1.38 | 1.38 | 1.38 | 1.04 | |||||
| Initial particle images (no.) | 303,754 | 187,555 | 44,456 | 788,359 | |||||
| Final particle images (no.) | 52,441 | 141,461 | 35,695 | 149,909 | |||||
| Map resolution (Å) | 3.3 | 3.3 | 3.5 | 3.7 | |||||
| Helical rise (Å) | 4.70 | 4.70 | 4.70 | 4.70 | |||||
| Helical twist (°) | −1.26 | −3.38 | −2.03 | −1.05 | |||||
| Refinement | |||||||||
| Map sharpening B factor (Å2) | −41.26 | −58.51 | −33.2 | −95.9 | |||||
| Model composition Non-hydrogen atoms Protein residues | |||||||||
| 1302 | 846 | 816 | 1218 | ||||||
| 177 | 111 | 105 | 162 | ||||||
| R.m.s. deviations Bond lengths (Å) Bond angles (°) | |||||||||
| 0.0094 | 0.0102 | 0.0099 | 0.0209 | ||||||
| 0.9007 | 1.0727 | 1.1342 | 1.0457 | ||||||
| Validation MolProbity score Clashscore Poor rotamers (%) | |||||||||
| 1.56 | 1.92 | 1.13 | 1.65 | ||||||
| 1.49 | 7.3 | 1.74 | 4.78 | ||||||
| 1.96 | 0 | 0 | 0 | ||||||
| Ramachandran plot Favored (%) Allowed (%) Disallowed (%) | |||||||||
| 92.98 | 90.91 | 96.77 | 94.0 | ||||||
| 100 | 100 | 100 | 98.0 | ||||||
| 0 | 0 | 0 | 2 | ||||||
| EMPIAR | 10243 | 10243 | 10243 | 10242 | |||||
| EMDB | 4563 | 4564 | 4565 | 4566 | |||||
| PDB | 6QJH | 6QJM | 6QJP | 6QJQ | |||||
Key resources table
| Reagent type (species)or resource | Designation | Source or reference | Identifiers | Additional information |
|---|---|---|---|---|
| Recombinant DNA | Plasmid: pRK172-2N4R | PMID: 2124967; 8849730; 9407097 | NCBI Reference Sequence: NM_005910.5 | Plasmid can be provided upon reasonable request. |
| Recombinant DNA | Plasmid: pRK172-2N3R | PMID: 2124967 | NCBI Reference Sequence: NM_001203252.1 | Plasmid can be provided upon reasonable request. |
| Strain, strainback ground (E. coli) | BL21 (DE3) | Agilent Technologies | 200131 | |
| Chemical compound, drug | Heparin | Sigma-Aldrich | H4784 | |
| Chemical compound, drug | Chymostatin | Sigma-Aldrich | C7268 | Protease inhibitor |
| Antibody | BR133 (Anti- N- terminus of tau proteins, Rabbit polyclonal) | In house PMID: 28678775; 30158706 | WB dilution: 1:4000 EM dilution: 1:50 | |
| Antibody | BR134 (Anti- C- terminus of tau proteins, Rabbit polyclonal) | In house PMID: 28678775; 30158706 | WB dilution: 1:4000 EM dilution: 1:50 | |
| Antibody | BR136 (Anti-R1 of tau proteins, Rabbit polyclonal) | In house PMID: 30158706; 30276465 | WB dilution: 1:4000 EM dilution: 1:50 | |
| Antibody | Anti-4R (Anti-R2 of 2N4R tau protein, Rabbit polyclonal) | Cosmo Bio PMID: 28678775; 30158706; 30276465 | CACTIP4RTP01 | WB dilution: 1:2000 EM dilution: 1:50 |
| Antibody | BR135 (Anti-R3 of tau proteins, Rabbit polyclonal) | In house PMID: 28678775; 30158706; 30276465 | WB dilution: 1:4000 EM dilution: 1:50 | |
| Antibody | TauC4 (Anti-R4 of tau proteins, Rabbit polyclonal) | Masato Hasegawa PMID: 28678775; 30158706; 30276465 | WB dilution: 1:2000 EM dilution: 1:50 | |
| Software, algorithm | RELION | PMID: 30412051 | RRID:SCR_016274 | |
| Software, algorithm | COOT | PMID: 20383002 | RRID:SCR_014222 | |
| Software, algorithm | REFMAC | PMID: 15299926 | RRID:SCR_014225 | |
| Software, algorithm | PHENIX | PMID: 20124702 | RRID:SCR_014224 |
-
WB: Western Blot; EM: Electron microscopy.
Additional files
-
Transparent reporting form
- https://doi.org/10.7554/eLife.43584.017
Download links
A two-part list of links to download the article, or parts of the article, in various formats.
Downloads (link to download the article as PDF)
Open citations (links to open the citations from this article in various online reference manager services)
Cite this article (links to download the citations from this article in formats compatible with various reference manager tools)
Heparin-induced tau filaments are polymorphic and differ from those in Alzheimer’s and Pick’s diseases
eLife 8:e43584.
https://doi.org/10.7554/eLife.43584


