Flura-seq identifies organ-specific metabolic adaptations during early metastatic colonization
- Cancer Biology and Genetics Program, Sloan Kettering Institute, Memorial Sloan Kettering Cancer Center, United States
- Sloan Kettering Institute, Memorial Sloan Kettering Cancer Center, United States
- Weill Cornell/Rockefeller/Sloan Kettering Tri-Institutional MD-PhD Program, United States
- Louis V. Gerstner, Jr. Graduate School of Biomedical Sciences, Memorial Sloan Kettering Cancer Center, United States
- Memorial Sloan Kettering Cancer Center, United States
Figures
Figure 1 with 1 supplement

Cell-type-specific labeling and isolation of RNAs by Flura-tagging.
(A) Schematic diagram showing RNA labeling and isolation using CD and 5-FC; (B) Chemical reactions steps involved in the labeling of RNA using CD and 5-FC; (C) Enrichment of mRNAs immunopurified by anti-BrdU antibody in cells expressing CD relative to WT cells and normalized to their corresponding inputs after 5-FC treatment for the indicated times, as measured by qRT-PCR for the representative genes (n = 3,±S.E.); (D) Schematic diagram of the constructs used for inducible expression of UPRT and/or CD, and the experimental design of Flura-tagging; (E) MDA231 cells expressing RFP-IRES-CD or UPRT-T2A-RFP-IRES-CD were co-cultured with unmodified control cells, treated with 5-FC, and Flura-tagging was assessed by BrdU immunostaining (n = 3, Scale bar, 20 μM). Arrow indicates cells lacking CD expression but stained with BrdU antibody; (F) 100, 500 or 1000 human MDA231 cells expressing CD/UPRT were co-cultured with 106 mouse 4T1 cells, treated with 5-FC for 12 hr, and 5-FU-tagged RNAs were immunoprecipitated. The fold enrichment of the indicated representative human genes over mouse housekeeping genes (mHPRT1) was measured by qRT-PCR (n = 3 ± S.E.). p-Values were calculated by unpaired two-tailed student’s t test.
Figure 1—figure supplement 1
Cell-type-specific labeling and isolation of RNAs by cytosine-deaminase-based 5-FU tagging.
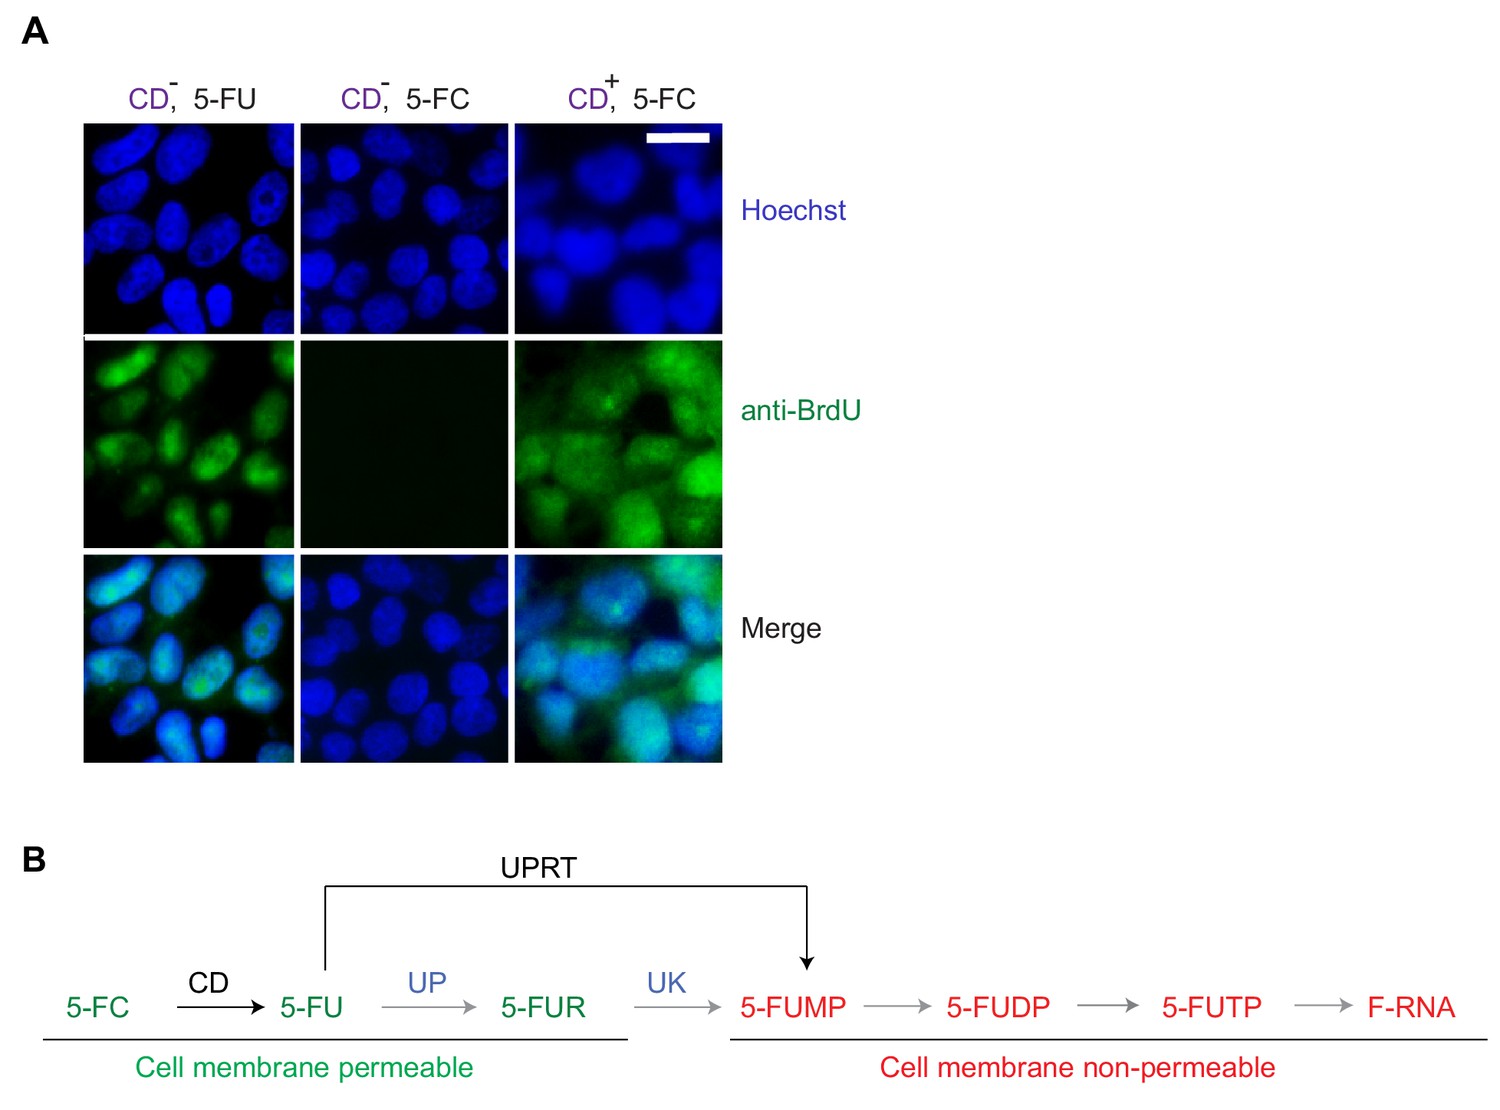
(A) Anti-BrdU antibody detects CD-based 5-fluorouracil (5-FU) derivatives but not 5-fluorocytosine (5-FC) derivatives. CD-expressing or control 293 T cells were treated with either 5-FC or 5-FU for 24 hr, followed by immunofluorescent staining with anti-BrdU antibody (n = 3, Scale bar, 20 μM); (B) Expression of UPRT bypasses the gradient-dependent export of intracellular 5-FU from cells expressing CD and treated with 5-FC. Schematic diagram of the steps involved in labeling RNAs using 5-FU tagging. Molecules that can diffuse across the cell membranes along a concentration gradient are labeled in green, membrane non-permeable molecules are labeled in red. Uridine phosphorylase (UP) and Uridine kinase (UK) are enzymes expressed in mammalian cells (labeled in blue) that act on 5-FU or its derivative in the indicated reaction steps.
Figure 2

Flura-tagging system effectively captures signal dependent change in gene expression.
(A–D) MDA231 cells expressing CD/UPRT were treated with 5-FC for 30 min prior to TGF-β or SB-505124 (SB, a TGF-β receptor inhibitor) treatment for 150 min. (A) Change in gene expression in TGF-β-treated cells relative to SB-treated cells as determined by RNA-seq of total RNA from control cells or 5-FU-tagged RNA from Flura-tagged cells. The heat map includes all the genes whose expression changed by more than 2-fold (p<0.01) in response to TGF-β in control cells; (B) Cartesian plot of the data in Figure 2B. Each dot represents a gene; typical TGF-β-responsive genes are highlighted (n = 3); (C) Violin plot of the genes induced by TGF-β as identified by RNA-seq and Flura-seq, and Flura-seq only; (D) Expression of the indicated representative TGF-β-induced genes was determined by qRT-PCR in total RNA and in anti-BrdU immunoprecipitate (n = 3,±S.E.). p-Values were calculated by unpaired two-tailed student’s t test.
Figure 3 with 1 supplement
Flura-tagging of rare metastatic cells in situ.
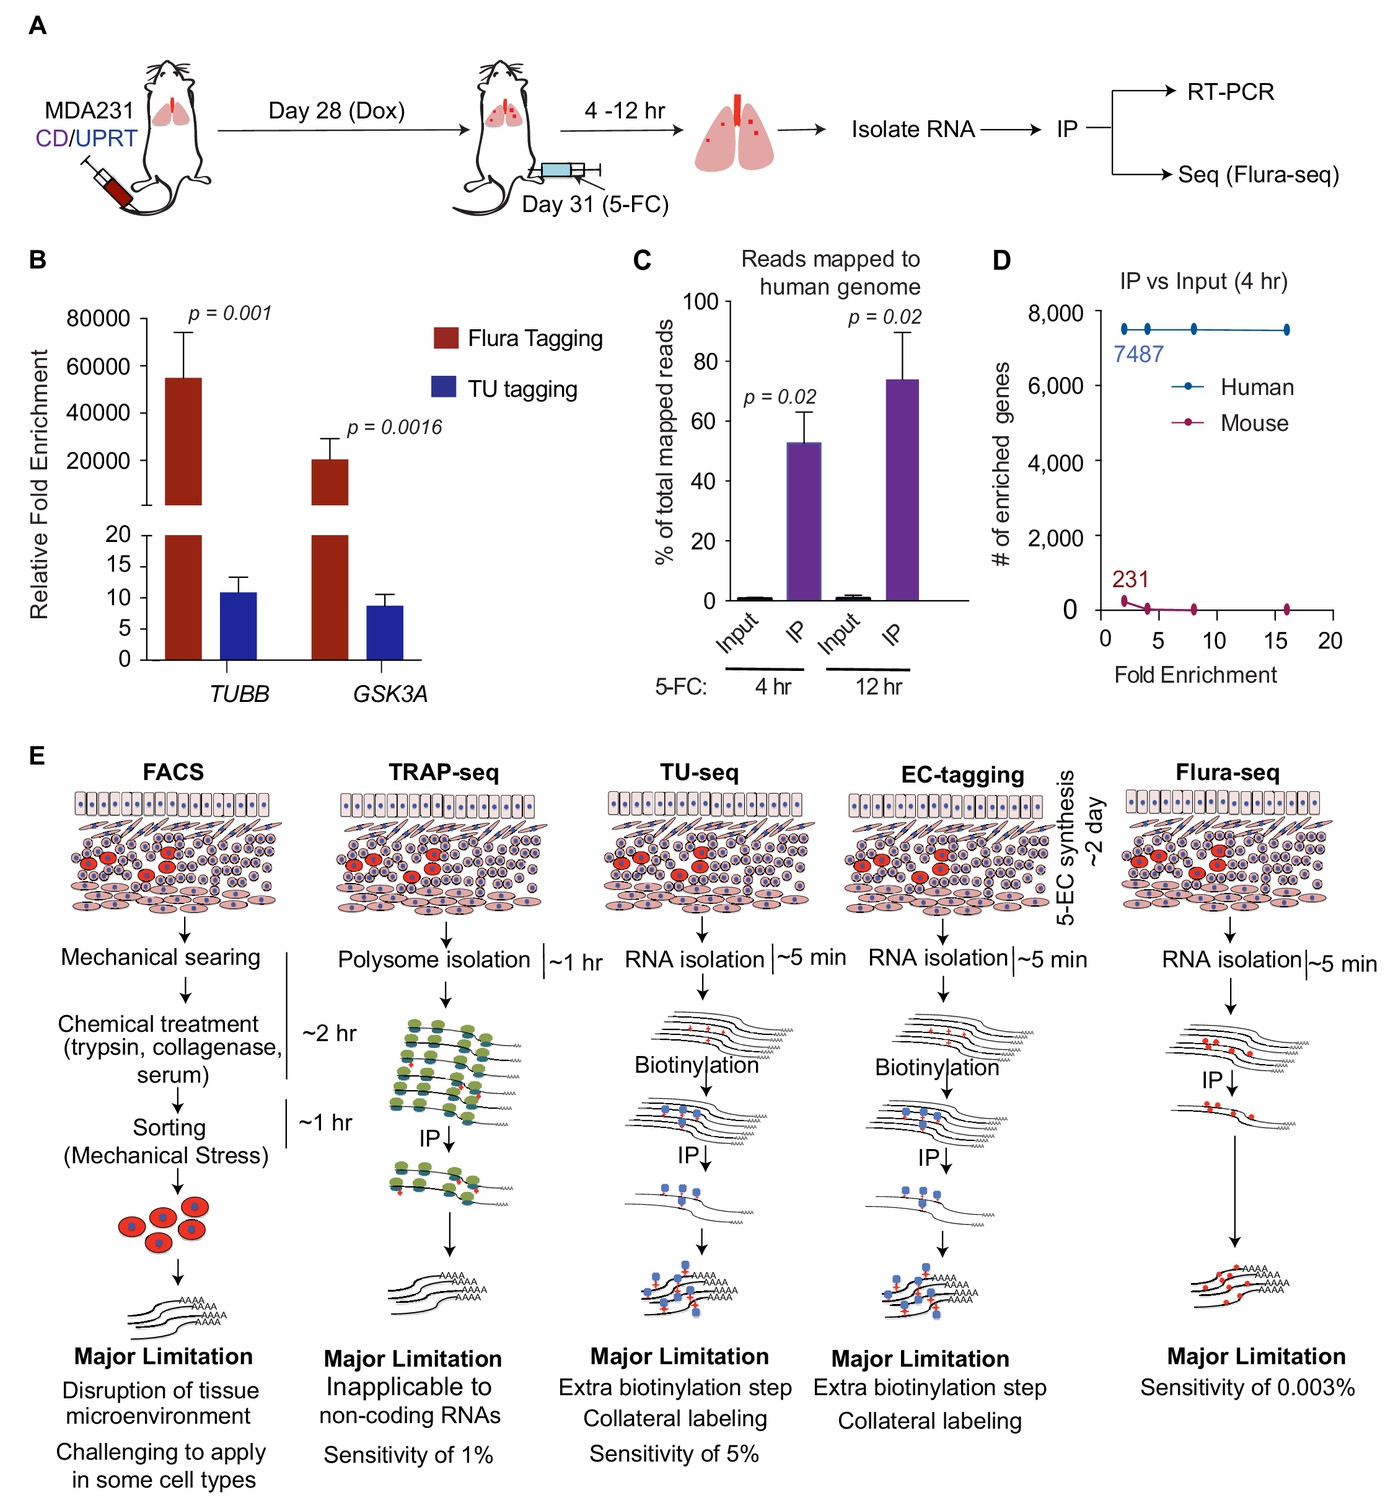
(A) Schematic diagram of lung colonization xenograft assay used for evaluation of Flura-tagging in vivo. Athymic mice were injected through the tail vein with 50,000 MDA231 cells expressing CD/UPRT and GFP-luciferase. After 4 weeks, mice were treated with doxycycline (3 days) to induce CD/UPRT expression in the disseminated cancer cells, and injected with 5-FC. Lungs were harvested 4 hr to 12 hr later, and subjected to immunopurification of 5-FU-tagged RNA for RNA-seq analysis (Flura-seq); (B) Comparison of relative fold enrichment of Flura-tagging and TU-tagging in vivo after immunoprecipitation. Mice with CD/UPRT expressing MDA231 lung metastases were injected with either 5-FC or TU for 12 hr, lungs were harvested. Flura-tagged RNA was purified by immunoprecipitation, and TU-tagged RNA was biotinylated and purified by streptavidin beads. The relative fold enrichment of representative human housekeeping genes relative to representative murine housekeeping genes (mHPRT1, mLDH1, mPGK1 and mGAPDH), normalized to their corresponding inputs, were determined by qRT-PCR (n = 5,±S.E.); (C) Flura-seq specifically enriches for 5-FU-tagged human transcripts from lung micrometastases. 5-FU-tagged RNA from mouse lungs bearing CD/UPRT-expressing MDA231 cells and treated with 5-FC for 4 hr or 12 hr were immunopurified and sequenced. RNA reads were aligned to a hybrid genome containing the human and mouse genomes. The percentage of aligned reads mapped to human genome for the Flura-seq samples and the corresponding unprecipitated input is shown (n = 2,±S.E.); (D) Number of human and mouse genes identified by Flura-seq (samples with 4 hr of 5-FC treatment) at different fold enrichment cutoffs relative to the corresponding unprecipitated inputs (n = 2); (E) Comparison of the workflow, limitations and sensitivity of Flura-seq versus other methods for transcriptomic analysis of rare cell populations in tissues. p-Values were calculated by unpaired two-tailed student’s t test.
Figure 3—figure supplement 1
Flura-tagging of rare metastatic cells in situ.
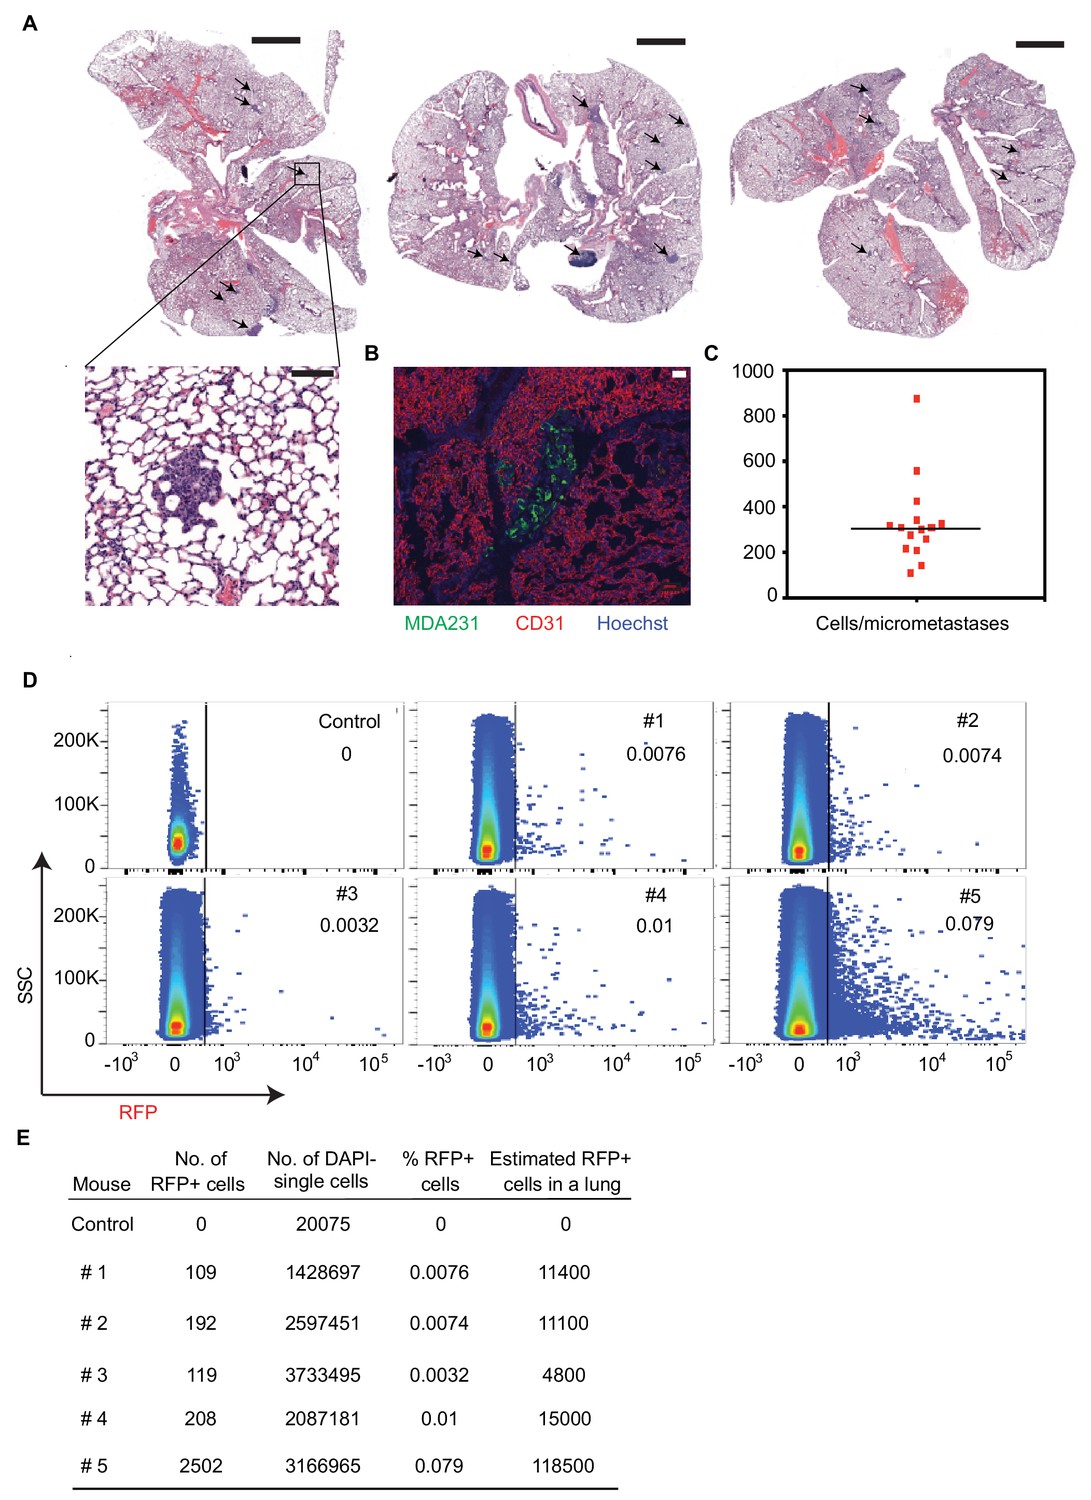
(A) Representative H and E stained sections of mouse lungs harboring micrometastases (arrows) used in Flura-tagging experiments. Inset shows higher magnification. Scale bar, 2 mm (top), 100 μM (bottom); (B) Representative lung micrometastases. MDA231 cells were stained with anti-GFP antibody, endothelial cells with anti-CD31 antibody and nuclei (DNA) with Hoechst 33258. Scale bar, 50 μM; (C) Quantification of the number of cells per micrometastasis in tissue section of engrafted lungs of mice used in the Flura-tagging experiments. The number of nuclei in individual micrometastases in lung sections from 16 mice were counted; (D) One-half portion of some of the mouse lungs used for Flura-tagging in Figure 3B was dissociated into single cells, and the percentage of RFP+ cells was analyzed using flow cytometry; (E) Quantification of the number of human cells in the mouse lungs used for Flura-tagging in the samples of Figure 3—figure supplement 1D. The total number of MDA231 cells per lung was estimated based on an assumption of 1.5 × 10⁸ cells per mouse lung (Perrone et al., 2010).
Figure 4 with 1 supplement
Flura-seq identifies organ specific in situ transcriptomes in micrometastases.
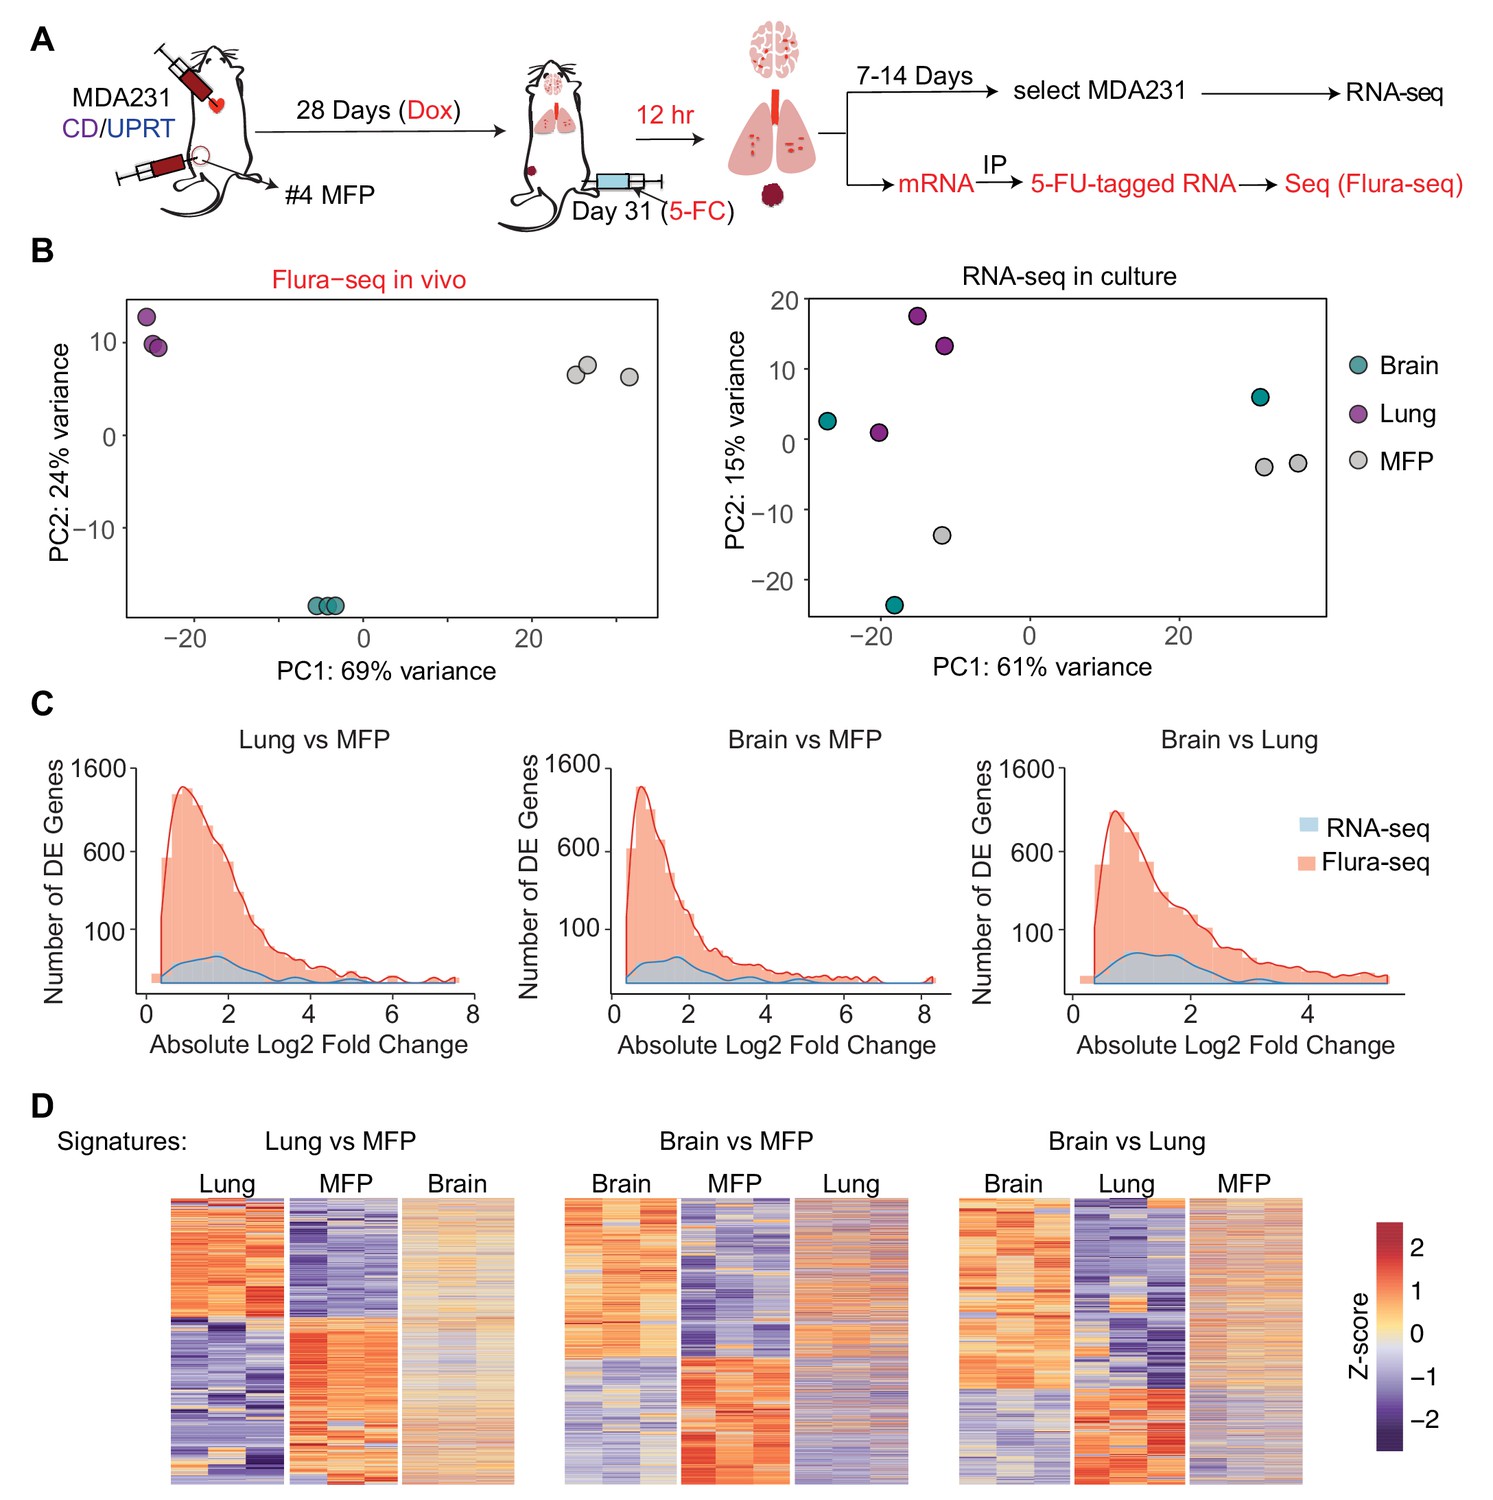
(A) Schematic diagram of experimental design used to obtain tissue specific transcriptomes of MDA231 cells in mice; (B) Principal component analysis of genes expressed by MDA231 cells in the indicated organs, as determined by Flura-seq of fresh tissue, or by RNA-seq of in vitro cultured cells derived from these tissues; (C) Comparison of differentially expressed genes in metastatic MDA231 cells in different organs as determined by Flura-seq of fresh tissue versus RNA-seq of tissue-derived MDA231 cell cultures. The number of differentially expressed genes and their corresponding fold-change in the indicated organ pairs were plotted for both methods; (D) Heatmap representation of differentially expressed genes identified by Flura-seq in MDA231 cells residing in the indicated pairs of organs, compared to the expression of these genes in the third organ.
Figure 4—figure supplement 1
Flura-seq identifies organ-specific in situ transcriptomes in micrometastases.
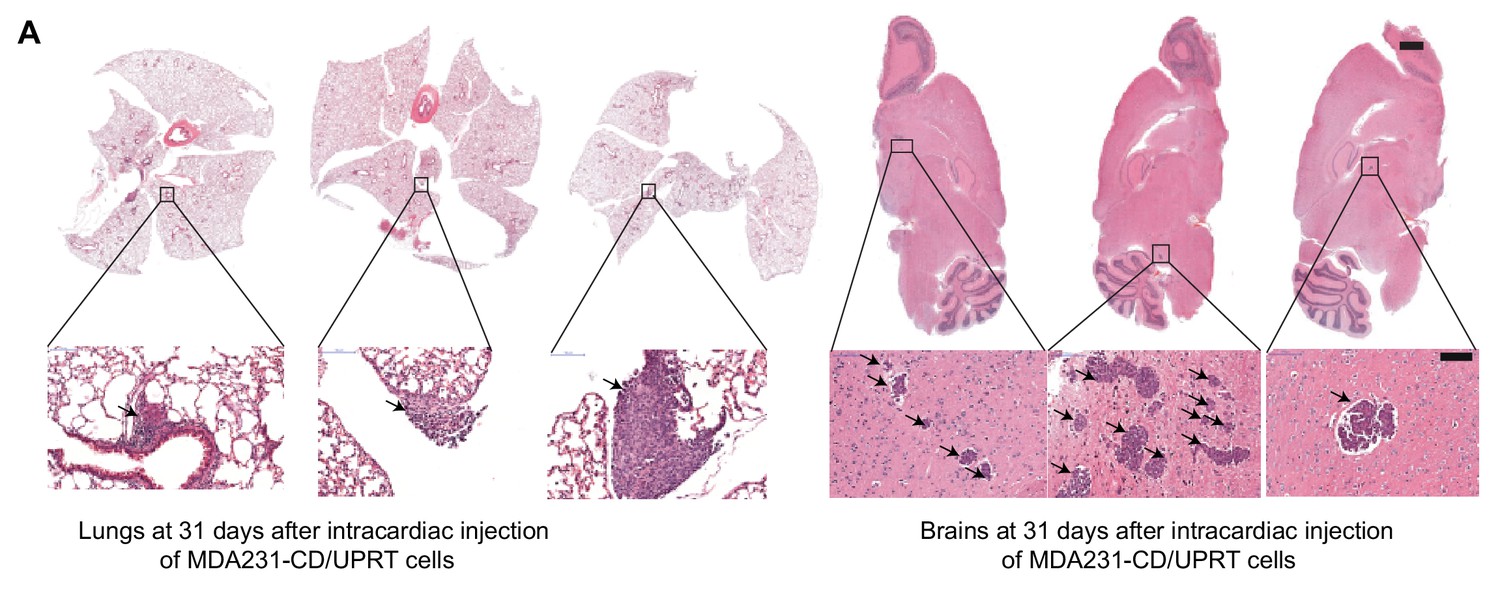
(A) Representative H and E stained sections of mouse lungs (left) and brain (right) harboring micrometastases (arrows) used in Flura-seq experiments. Inset shows higher magnification. Scale bar, 1 mm (top), 100 μM (bottom).
Figure 5 with 2 supplements
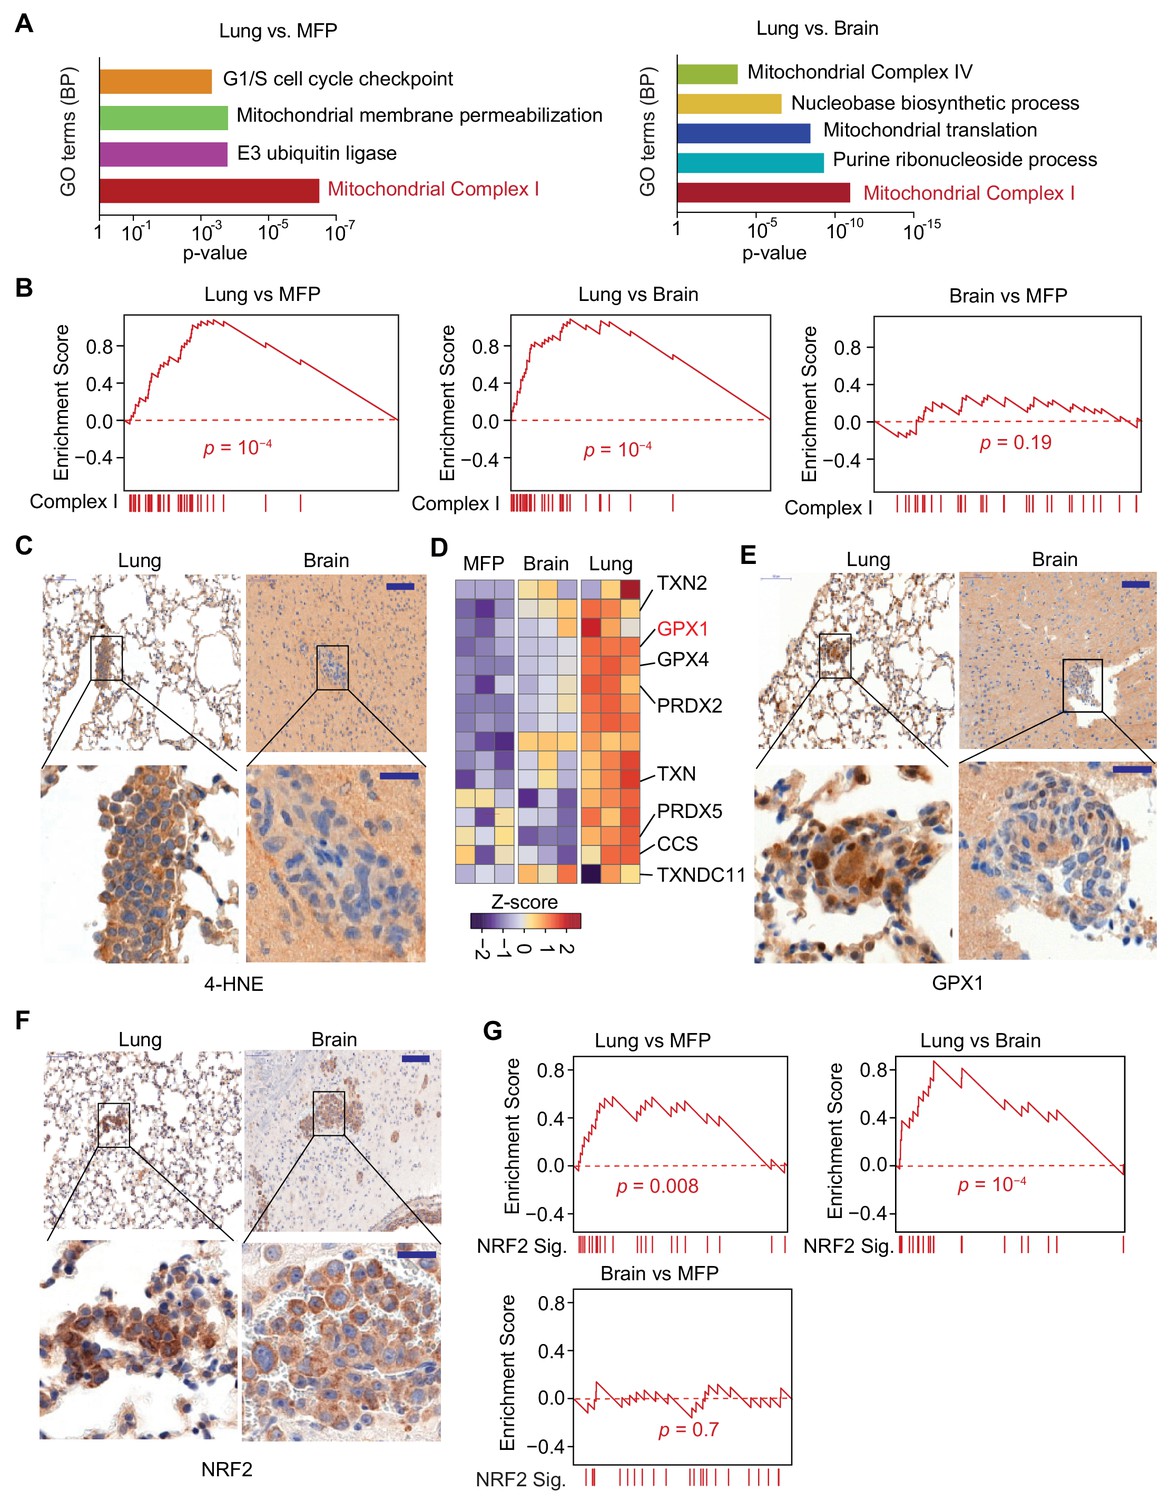
Mitochondrial Complex I expression and oxidative stress in lung micrometastases.
(A) Gene Ontology (GO) analysis of biological processes (BP) of genes that were upregulated in MDA231 lung micrometastases compared to brain micrometastases or mammary tumors. The top functional groups and their corresponding pvalues are shown (n = 3); (B) Gene Set Enrichment Analysis (GSEA) analysis of nuclear Complex I genes was performed for the genes identified by Flura-seq in the indicated pairs of MDA231 lung and brain micrometastases and mammary tumors. p-Values were calculated by random permutations; (C) Oxidative stress in lung and brain tissue sections containing micrometastases were examined by IHC using anti-4-HNE antibody. Scale bars, 100 μm (top) and 20 μm (bottom); (D) Heatmap representation of the expression of genes encoding known antioxidant factors in MDA231 tumors from the indicated organs. The highlighted genes were also upregulated in clinical samples of lung metastasis from breast cancer patients (Figure 6D); (E) IHC analysis of GPX1, an antioxidant gene product identified by Flura-seq to be selectively upregulated in lung micrometastases. Scale bars, 100 μm (top) and 20 μm (bottom); (F) IHC analysis of NRF2 in lung and brain micrometastases. Scale bars, 100 μm (top) and 20 μm (bottom); (G) GSEA analysis of the NRF2 response gene signature applied to Flura-seq data from the indicated pairs of MDA231 lung and brain micrometastases and mammary tumors (n = 3). p-Values were calculated by random permutations.
Figure 5—figure supplement 1
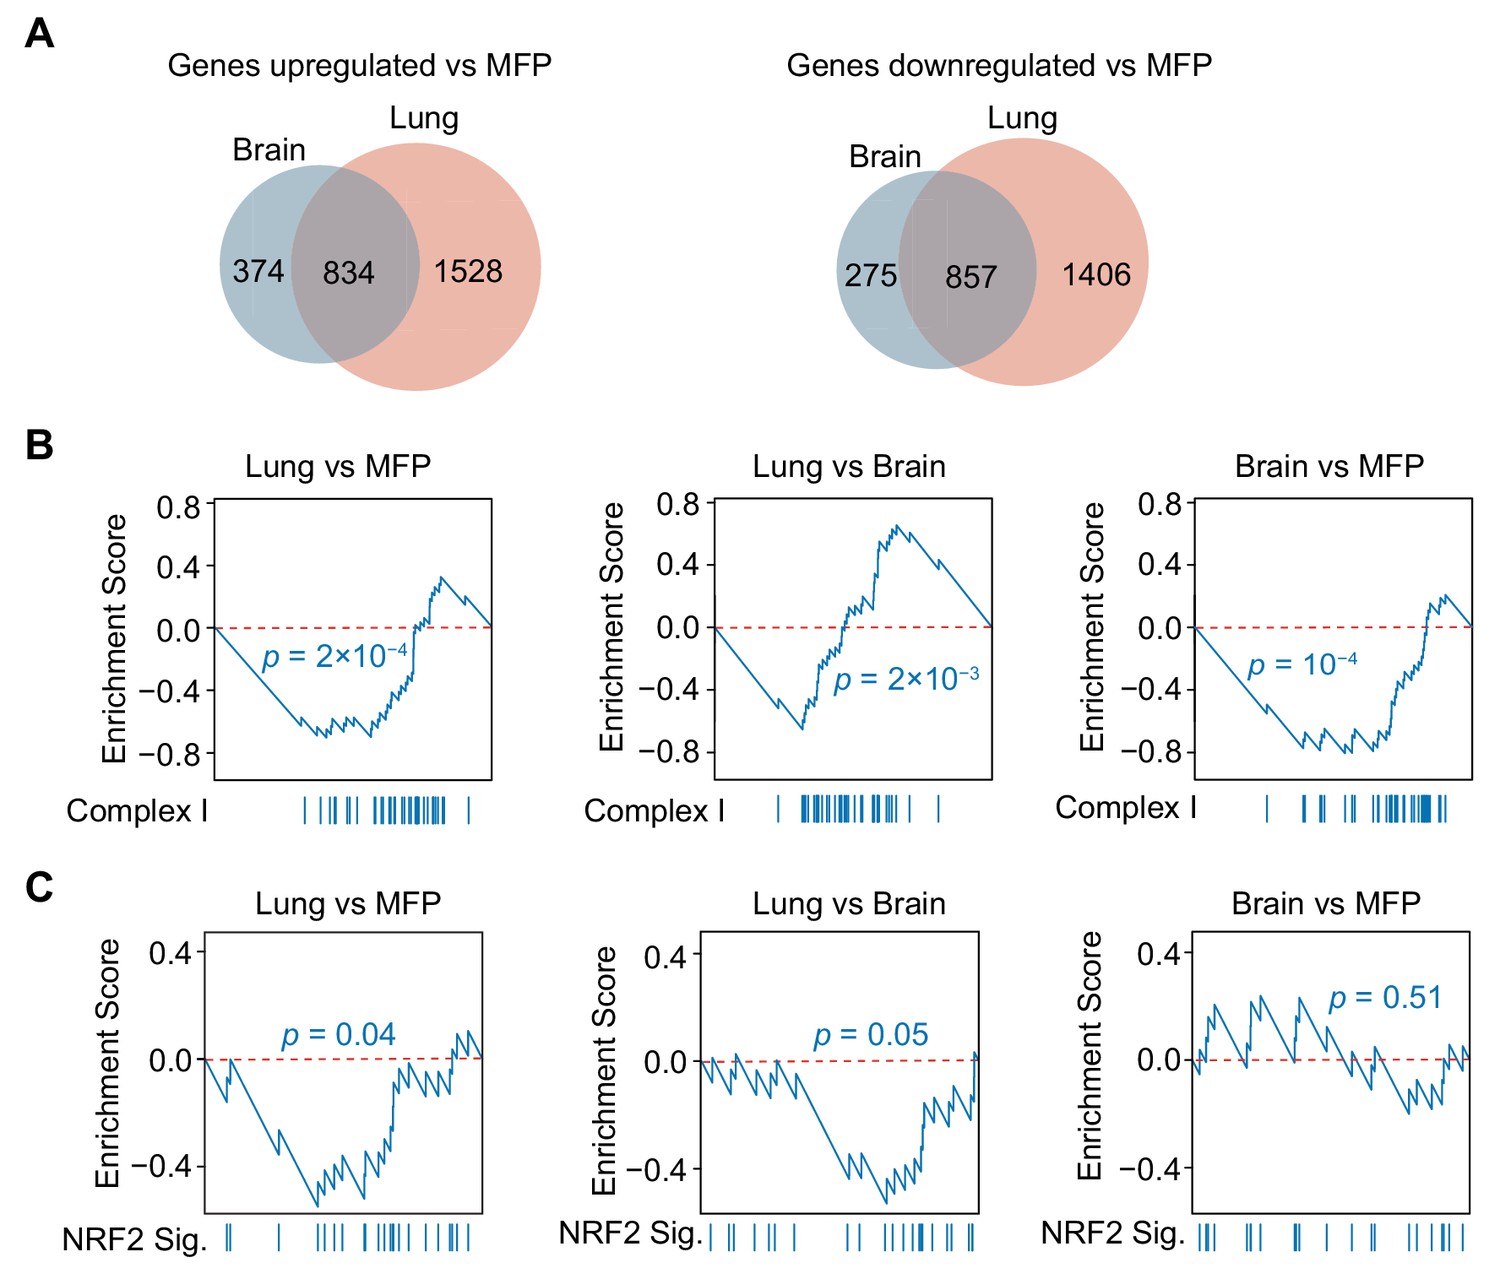
Differential gene expression in brain and lung micrometastatic cells.
(A) Genes differentially expressed in lung and brain micrometastases relative to mammary fat pad tumors were identified by Flura-seq, and the overlap of the upregulated genes (left) and downregulated genes (right) in the organs are shown. (B, C) Upregulation of Complex I genes and antioxidant response in lung micrometastases is dependent on the tissue microenvironment. MDA231 cells from lung and brain micrometastases, and from mammary tumors were isolated and cultured in vitro under identical conditions, and the expression of Complex I genes (B) and the NRF2 gene signature (C) were subjected to GSEA for the indicated tissue pairs. p-Values were calculated by random permutations.
Figure 5—figure supplement 2
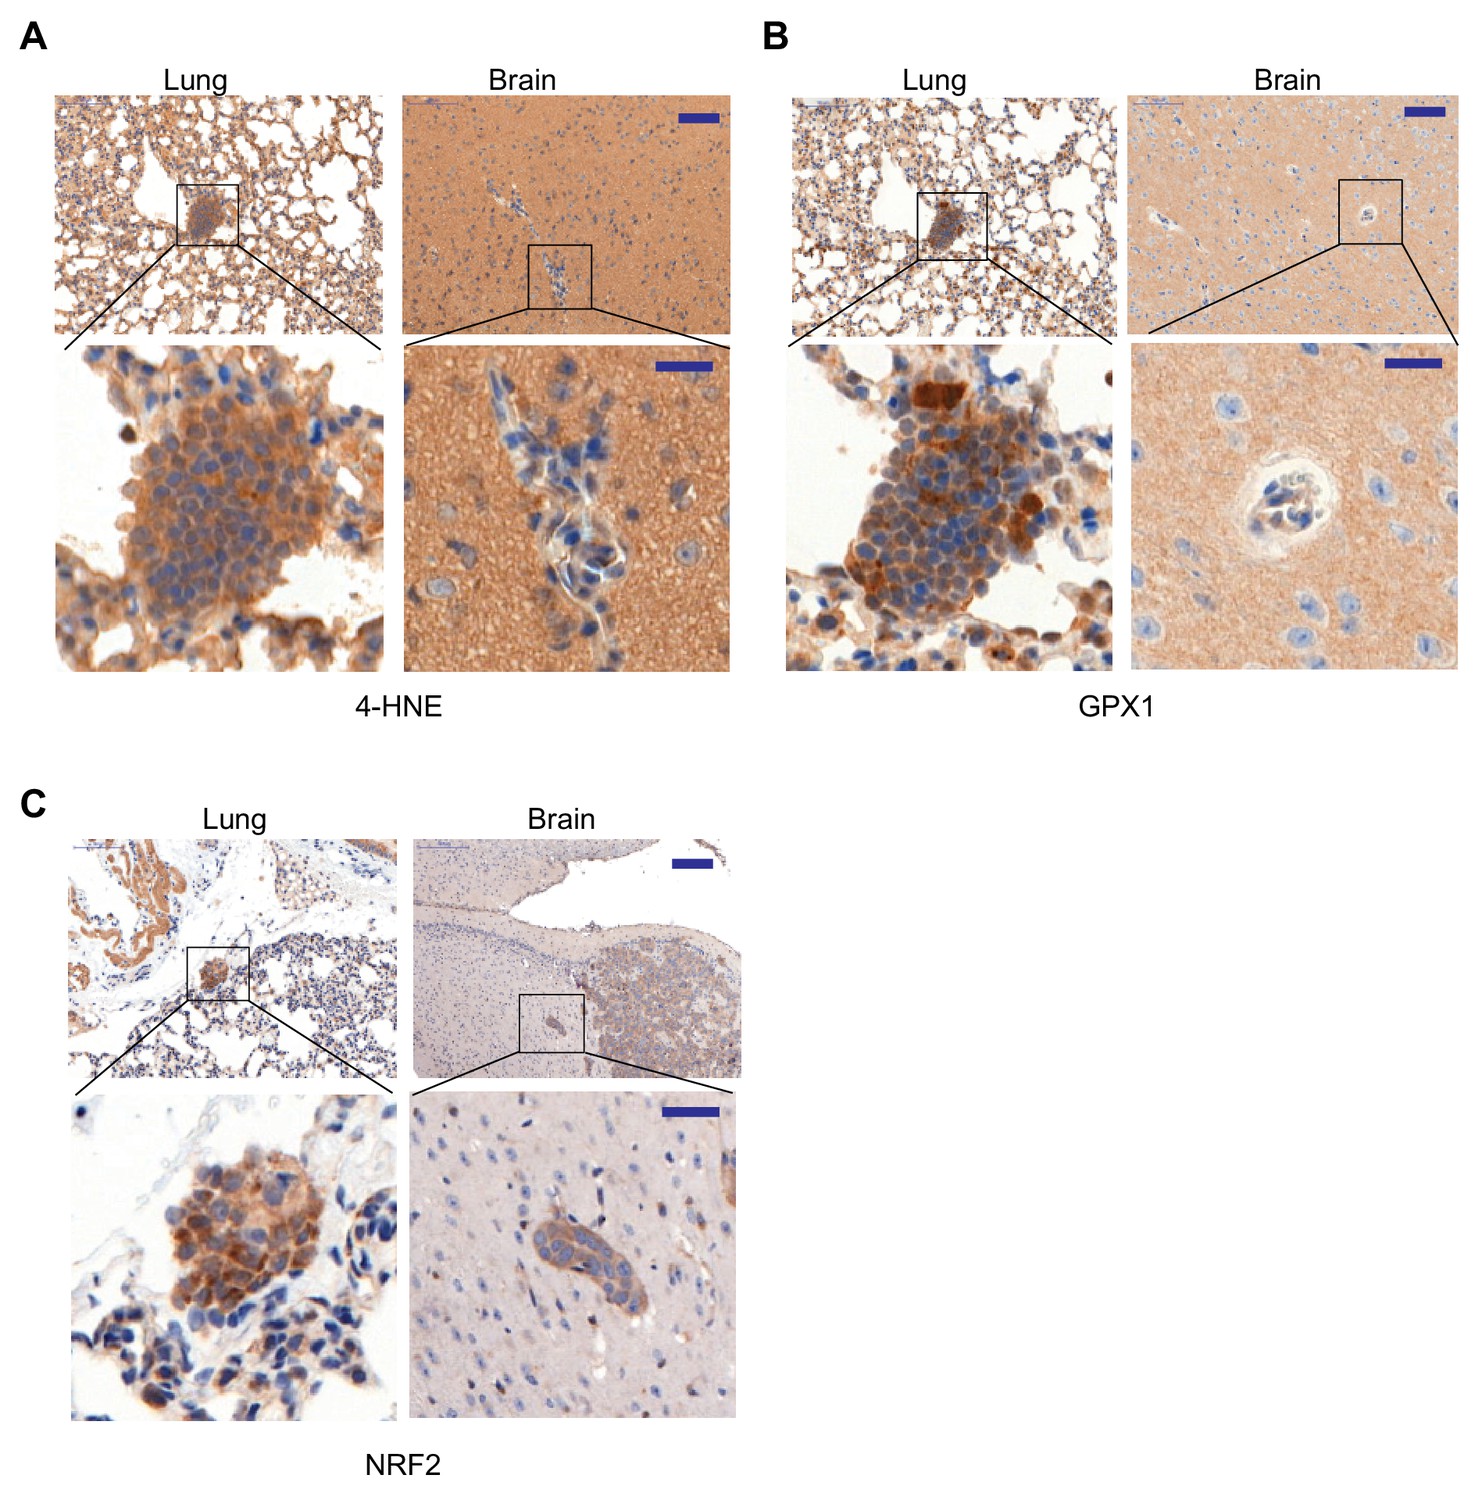
Oxidative stress and antioxidant programs are elevated in lung micrometastases relative to brain micrometastases in HCC1954 xenograft metastasis model.
(A–C) Oxidative stress (A), antioxidant GPX1 (B) and NRF2 (C) in lung and brain tissue sections containing HCC1954 micrometastases were examined by IHC using anti-4-HNE, anti-GPX1 and anti-NRF2 antibodies respectively. Scale bars, 100 μm (top) and 20 μm (bottom) (n = 3). Shown IHCs are from serial sections of organs derived from the same mouse.
Figure 6

Specific oxidative stress in patient-derived lung metastasis tissues.
(A–D) Expression of nuclear Complex I and antioxidant genes in a gene expression data set of matched primary tumors and lung metastases from patients with breast cancer (Siegel et al., 2018). (A) GSEA analysis of the expression of Complex I genes shows higher expression of these genes in lung metastases (LM) compared to primary tumors (Primary); (B) Complex I genes, lung antioxidant genes (from Figure 5D), and NRF2 response signature genes are upregulated in lung metastases (LM) compared to matched primary tumor (Pr). Gene set variation analysis (GSVA) analysis for transcriptomic data from primary tumors and matched lung metastases of individual patients (letter and color coded); (C) Association of anti-antioxidant gene expression with mitochondrial Complex I expression in lung metastasis. Patients were divided into two groups based on the upregulation of Complex I genes in the lung metastases relative to their corresponding primary tumor. The Complex I-High group consisted of five patients with more than 25 out of 43 Complex I genes upregulated by more than twofold in lung metastases relative to the corresponding primary tumor. The Complex I-Low group consisted of six patients with less than 25 Complex I genes upregulated by twofold in the lung metastases compared to the corresponding primary tumor. GSVA signature analysis of Complex I genes, lung antioxidant genes, and NRF2 signature genes was performed in the Complex I-High and -Low groups. p-Values were calculated by unpaired two-tailed student’s t test; (D) Heatmap of the relative expression of individual mitochondrial Complex I genes and antioxidant genes in lung metastases relative to the corresponding primary tumor. Complex I-High and –Low patient samples are shown as separate groups, in order to highlight the association of antioxidant gene expression with Complex I gene expression. Red dots, antioxidant genes that were also identified to be upregulated in mouse lung micrometastases by Flura-seq (shown in Figure 5D); (E, F) IHC analysis of oxidative stress marker 4-HNE (E) and NRF2 (F) in tissue microarrays of brain metastases (BrM) and lung metastases (LM) from breast cancer patients. Shown are representative images and the quantifications based on the degree of staining (0, no signal: 3, highest signal). (n = 55 samples for BrM and n = 45 for LM for 4-HNE; n = 48 for BrM and n = 41 for LM for NRF2). Scale bar, 20 μm; (G) Association between oxidative stress (4-HNE) and NRF2 scores in lung metastases and brain metastases of breast cancer patients. Heatmap of the IHC staining of 4-HNE (E) and NRF2 (F) was plotted for each patient sample in the TMAs; (H) Hazard Ratio plots of the predictive ability of NRF2 signatures in brain (BrM), lung (LM) and bone (BM) metastasis-free survival outcomes in EMC-MSK dataset (GSE2603, GSE5327, GSE2034 and GSE12276). p-Values were calculated using Log-rank test.
Tables
Key resources table
| Reagent type (species) or resource | Designation | Source or reference | Identifiers | Additional information |
|---|---|---|---|---|
| Antibody | anti-BrdU; BrdU antibody (Rat monoclonal) | Abcam | Cat#ab6326 | (1:200) |
| Antibody | anti-CD31; CD31 antibody (Rat monoclonal) | Dianova | Cat#DIA-310 | (1:100) |
| Antibody | anti-GFP; GFP antibody (Chicken monoclonal) | Aves Labs | Cat#GFP-1020 | (1:500) |
| Antibody | anti-4-Hydroxynonenal; 4-HNE antibodyl (Rabbit polyclonal) | Abcam | Cat#ab46545 | (1:75) |
| Antibody | anti-NRF2; NRF2 antibody (Rabbit polyclonal) | Abcam | Cat#ab137550 | (1:600) |
| Antibody | anti-Glutathione Peroxidase 1; GPX1 antibody (Rabbit polyclonal) | Abcam | Cat#ab22604 | (1:200) |
| Antibody | Goat polyclonal anti-chicken | Thermo Fisher | Cat#A-11039 | (1:1000) |
| Antibody | Goat polyclonal anti-rat | Thermo Fisher | Cat#A-11006 | (1:1000) |
| Antibody | Goat polyclonal anti-mouse | Abcam | Cat#ab150117 | (1:1000) |
| Biological sample (Human) | Human breast cancer lung metastases tissue microarray (TMA) | This paper (Section of lung tissue containing cancer cells was surgically removed from breast cancer patients, preserved in paraflim and a small portion of the preserved tumor was used to make the TMA) | N/A | Tissue microarray Available from Edi Brogi |
| Chemical compound, drug | Doxycycline | Sigmal-Aldrich | Cat#D9891 | |
| Chemical compound, drug | 5-Fluorocytosine; 5-FC | Sigma-Aldrich | Cat#F7129 | |
| Chemical compound, drug | 5-Fluorouracil; 5-FU | Sigma-Aldrich | Cat#F6627 | |
| Chemical compound, drug | SB-505124 | Sigma-Aldrich | Cat#S4696 | |
| Chemical compound, drug | Thymine | Sigma-Aldrich | Cat#T0376 | |
| Chemical compound, drug | 4-Thiouracil; TU | Sigma-Aldrich | Cat#440736 | |
| Other | Oligo (dT)25 magnetic beads | New England Biolabs | Cat#S1419S | |
| Other | Protein G Dynabeads | Thermo Fisher Scientific | Cat#10004D | |
| Commercial assay or kit | Tissue digestion C-tube | Miltenyi | Cat#130-096-334 | |
| Commercial assay or kit | Mouse Tumor Dissociation Kit | Miltenyi | Cat#130-096-730 | |
| Commercial assay or kit | TruSeq RNA Library Prep Kit v2 | Illumina | RS-122–2001 | |
| Commercial assay or kit | SMARTer PCR cDNA synthesis kit | Clontech | Cat#634926 | |
| Commercial assay or kit | Nextera XT DNA library Preparation Kit | Illumina | FC-131–1024 | |
| Commercial assay or kit | RNeasy MinElute Cleanup kit | Qiagen | Cat#74204 | |
| Commercial assay or kit | cDNA kit-First Strand Transcriptor | Roche | Cat#043790–12001 | |
| Cell line (Human) | MDA231 | Laboratory of Joan Massague | PMID: 19421193 | Expresses TGL |
| Cell line (Human) | MDA231-CD | This paper (MDA231 cells were transduced with rtTA3 and TRE-CD-IRES-RFP) | N/A | Available from Massague lab |
| Cell line (Human) | MDA231-CD/UPRT | This paper (MDA231 cells were transduced with rtTA3 and TRE-UPRT-T2A-RFP-IRES-CD) | N/A | Available from Massague lab |
| Cell line (Human) | 293T | Laboratory of Joan Massague | N/A | |
| Strain, strain background (Mus musculus) | Hsd:Athymic Nude- Foxn1nu | Envigo | Cat#069 | |
| Sequence-based reagents | Oligonucleotides | This paper | N/A | Oligonucleotide sequences are provided in Supplementary file 6 |
| Recombinant DNA reagent | CMV Tight RFP-IRES-CD | This paper (RFP-IRES-CD was subcloned into CMV Tight EGFP Puro (Addgene: Plasmid #26431) vector by removing EGFP). | N/A | Available from Massague lab |
| Recombinant DNA reagent | CMV Tight UPRT- T2A-RFP-IRES-CD | This paper (UPRT-T2A-RFP-IRES-CD was subcloned into CMV Tight EGFP Puro (Addgene: Plasmid #26431) vector by removing EGFP). | N/A | Available from Massague lab |
| Recombinant DNA reagent | rtTA3 | Addgene | Plasmid #26730 | |
| Software and Algorithms | STAR2.5.2b | PMID: 23104886 | https://github.com/alexdobin/STAR | |
| Software and Algorithms | HTSeq v0.6.1p1 | PMID: 20979621 | https://htseq.readthedocs.io/en/release_0.10.0/ | |
| Software and Algorithms | DESeq2 v3.4 | PMID: 25516281 | https://bioconductor.org/packages/release/bioc/html/DESeq2.html | |
| Software and Algorithms | GSVA v3.4 | PMID: 23323831 | https://bioconductor.org/packages/release/bioc/html/GSVA.html |
Additional files
-
Supplementary file 1
Genes that are differentially expressed in MDA231 cells expressing CD/UPRT and treated with indicated concentration of 5-FC for 4 hr compared to control cells were obtained by DESEQ2 analysis.
- https://doi.org/10.7554/eLife.43627.014
-
Supplementary file 2
Genes that are differentially expressed in TGF-β treated cells compared to SB-505124 by more than twofold are shown as identified by RNA-seq and Flura-seq.
Genes commonly identified by RNA-seq 6 hr post TGF-β, but not 2.5 hr post treatment, and Flura-seq 2.5 hr post TGF-β treatment are also shown.
- https://doi.org/10.7554/eLife.43627.015
-
Supplementary file 3
Genes that are differentially expressed in MDA231 cells in different organs in situ as determined by Flura-seq or in vitro after isolation from the organs as determined by RNA-seq are shown.
- https://doi.org/10.7554/eLife.43627.016
-
Supplementary file 4
Top 100 NRF2 target genes identified by two independent ChIP-seq experiments in Hela cells (ENCODE Project Consortium, 2012), and the genes that were common in both experiments were used as NRF2-responsive signature genes.
- https://doi.org/10.7554/eLife.43627.017
-
Supplementary file 5
Genes identified to be up-regulated by more than two-fold in lung metastases compared to the corresponding primary tumors in breast cancer patients described in Siegel et al. (2018) for each patients are shown.
Complex I genes are highlighted in red color and the total number of upregulated Complex I genes in each patient is shown.
- https://doi.org/10.7554/eLife.43627.018
-
Supplementary file 6
Oligonucleotide sequences used in the experiments described in the manuscript are shown.
- https://doi.org/10.7554/eLife.43627.019
-
Transparent reporting form
- https://doi.org/10.7554/eLife.43627.020
Download links
A two-part list of links to download the article, or parts of the article, in various formats.
Downloads (link to download the article as PDF)
Open citations (links to open the citations from this article in various online reference manager services)
Cite this article (links to download the citations from this article in formats compatible with various reference manager tools)
Flura-seq identifies organ-specific metabolic adaptations during early metastatic colonization
eLife 8:e43627.
https://doi.org/10.7554/eLife.43627


