Presenilin/γ-secretase-dependent EphA3 processing mediates axon elongation through non-muscle myosin IIA
- Universitat Autònoma de Barcelona, Spain
- Universitat de Lleida, Spain
- Monash University, Australia
Figures
Figure 1 with 1 supplement
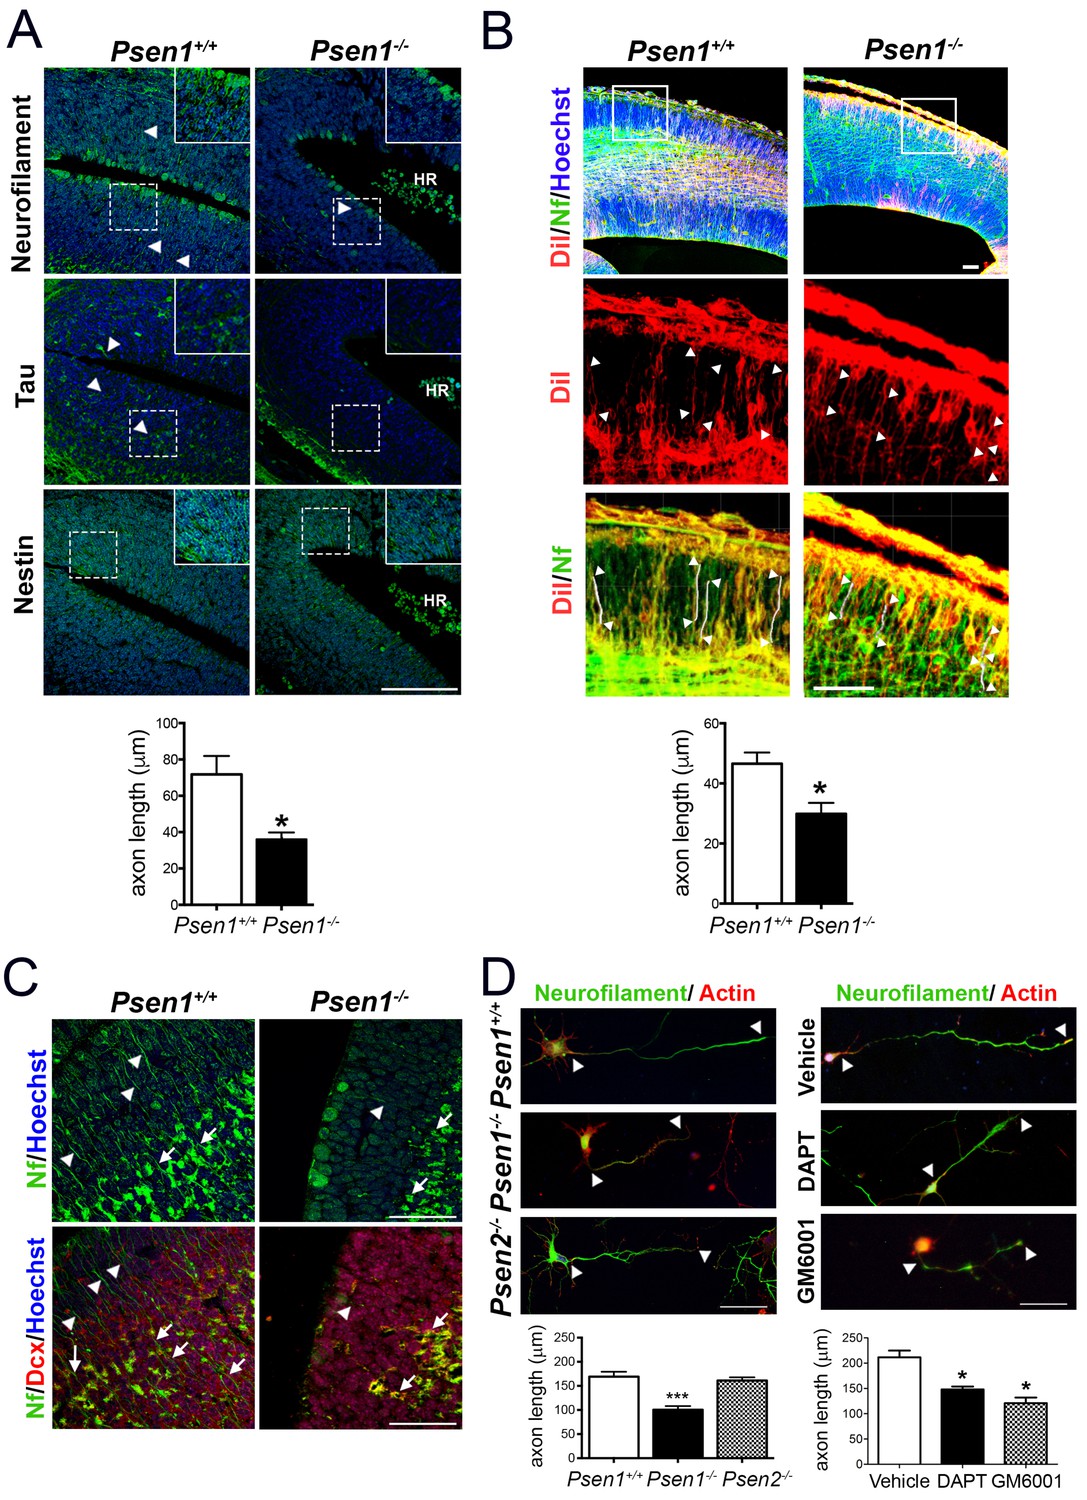
PS1/γ-secretase is required for axon growth in the developing brain.
(A) Reduced axon length in embryonic Psen1-/- mouse brains. Confocal microscope images showing reduced axon length in the ventricular zone of Psen1-/- mouse brains (E15.5). Axons (green) are labeled with neurofilament (SM312 staining) and tau, intermediate neurofilaments with nestin, and nucleus (Hoechst) staining is shown in blue. Insets show magnified regions marked by dotted lines. Psen1-/- mouse brains show enlarged ventricles and brain hemorrhages (HR; grouped blood cells are evident). Multiple neurofilament-stained axons (n = 5/section; 10–15 sections/animal) were analyzed and quantified. Scale bar, 50 μm. Data are mean ± SEM (n = 3–4 animals/genotype). Unpaired two-tailed Student’s t test: *p<0.05, compared to Psen1+/+. (B) DiI labeling of axons in embryonic Psen1+/+ and Psen1-/- mouse brains. Top images: confocal images showing DiI (red), neurofilament (Nf, 2H3; green) and Hoescht (blue) stainings. Insets in the top images are magnified in the middle (DiI, red) and bottom (DiI/Nf, yellow) images. Middle/bottom images: length of DiI/Nf-stained axons (in white) indicated with white arrowheads was quantified in the cortical plate of Psen1+/+ and Psen1-/- embryos (E13.5; n = 3–4/group). Scale bar, 50 μm. Unpaired two-tailed Student’s t test: *p<0.05, compared to Psen1+/+. (C) Reduced axon staining in doublecortin immature neurons in the developing hippocampus of Psen1-/- embryos. Psen1+/+ and Psen1-/- brain sections (E15.5) were immunostained for neurofilament (Nf, SMI321; green) and doublecortin, a marker of immature neurons (red). Confocal images show reduced axon length in doublecortin immature neurons in the inner (arrows) and outer (arrowheads) layers of Psen1-/- hippocampus. Scale bar, 50 μm. (D) Reduced axon length in primary hippocampal neurons from Psen1-/- mouse embryos. Cultured neurons (4 DIV) from control (Psen1/2+/+), Psen1-/- and Psen2-/- embryos (E15.5) or neurons treated with a γ-secretase inhibitor (DAPT) or a broad spectrum metalloprotease inhibitor (GM6001) were stained with neurofilament (Nf, SMI321: green) and actin (phalloidin, red). The length of axons is indicated with white arrowheads. Multiple axons (n = 25–30/coverslip) were analyzed and quantified. Scale bars: 50 μm. Data are mean ± SEM (n = 3 experiments). One-way ANOVA followed by Bonferroni post hoc test: *p<0.05, compared to vehicle or control.
Figure 1—figure supplement 1
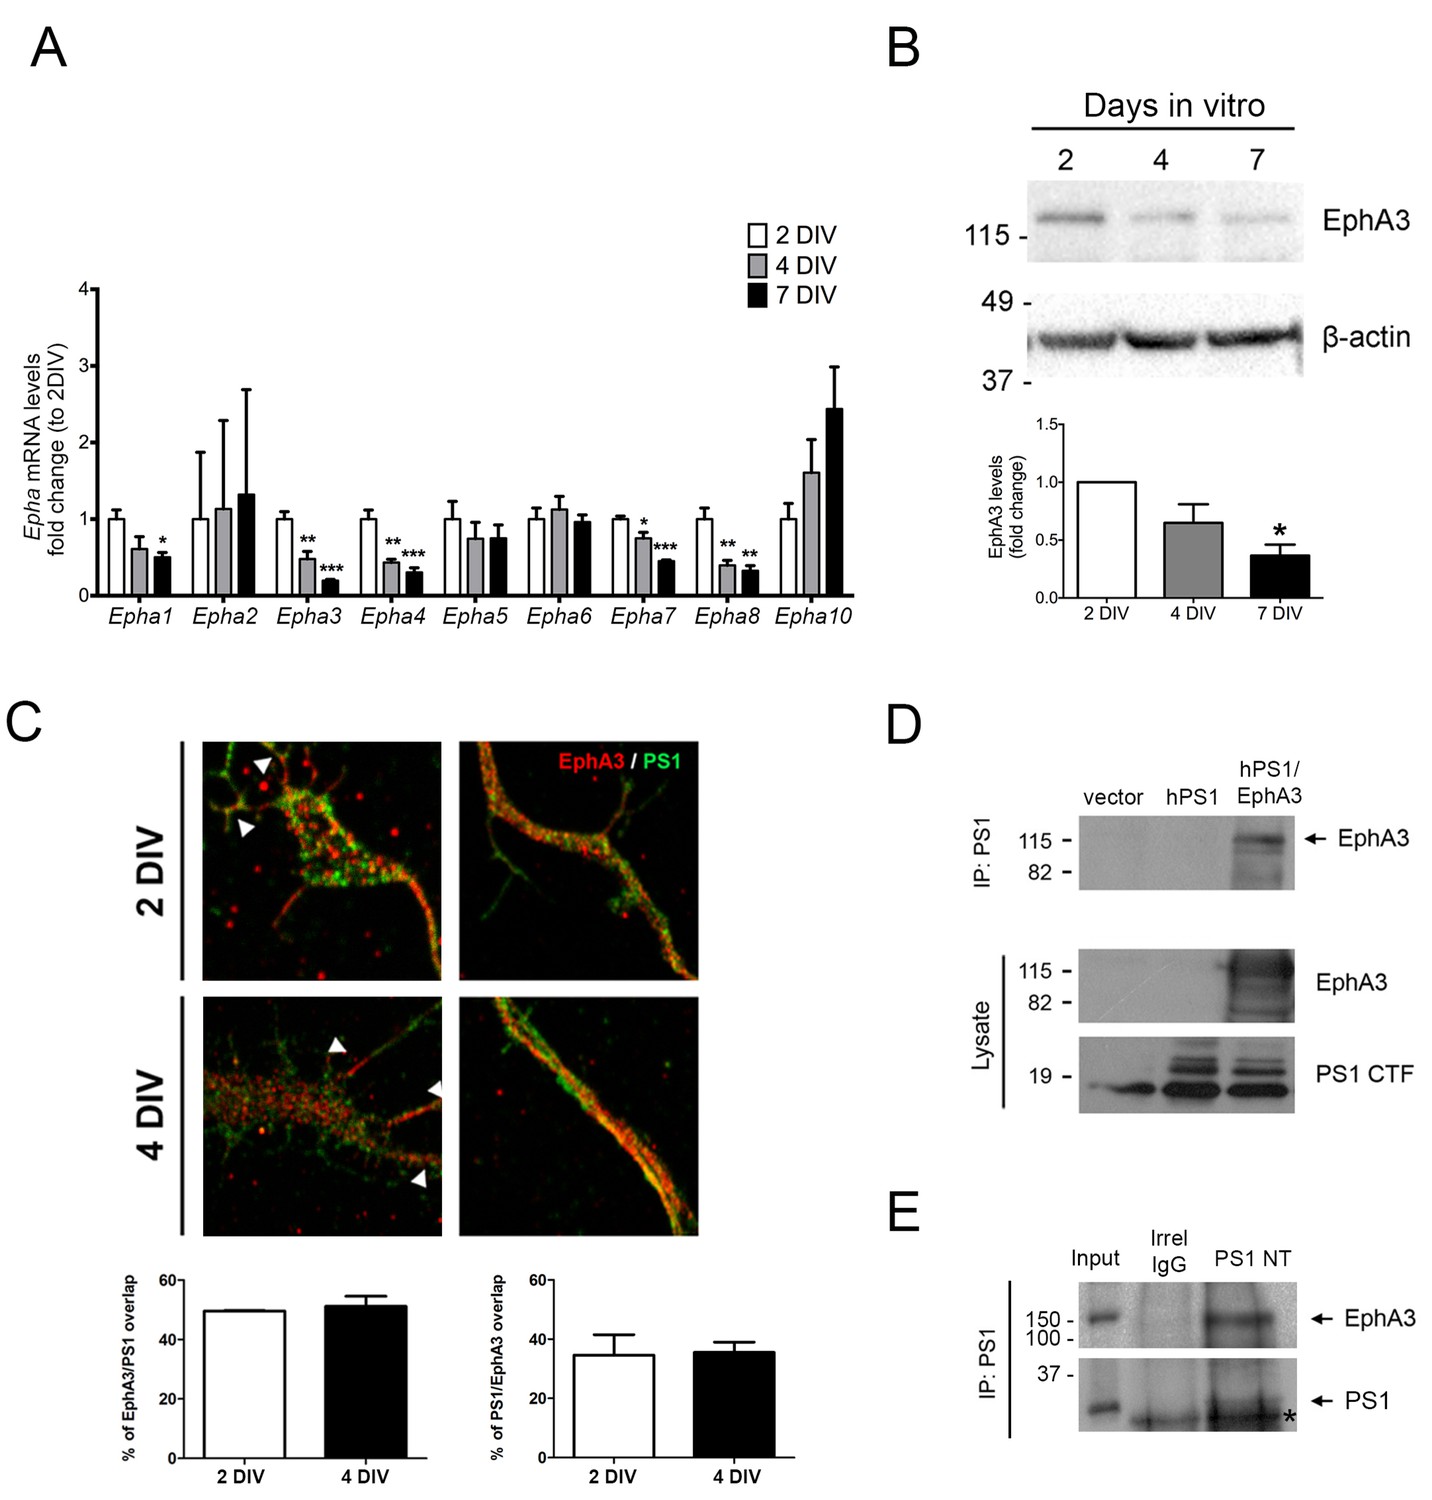
PS1 colocalizes and interacts with EphA3 in axons.
(A) Expression of EphAs during neuronal polarization. Levels of Epha mRNAs measured by qRT-PCR at different neuronal polarization stages (2, 4 and 7 DIV). Levels of mRNA were normalized to Gapdh and Hprt1. Values represent mean ± SEM (n = 4 experiments). Statistics in individual groups was tested by one-way ANOVA followed by Bonferroni post hoc test. *p<0.05, **p<0.01, ***p<0.001, compared to 2 DIV. (B) Biochemical analysis of EphA3 of cultured hippocampal neurons at different stages of neuronal polarization (5E11F2 antibody). The highest levels of EphA3 protein are found at 2–4 DIV. Statistics was tested by one-way ANOVA followed by Bonferroni post hoc test. *p<0.05, compared to 2 DIV. (C) Cultured hippocampal neurons were stained for F-actin (phalloidin; white), PS1 (green) and EphA3 (red). Superimposed confocal microscope images and quantitative analysis show punctuate colocalization of PS1 and EphA3 (yellow) at the growth cone (upper images; arrowheads) and along axons (lower images) in 2–4 DIV cultured hippocampal neurons. Student’s t test was used to determine statistical significance. (D) Coimmunoprecipitation assays using an anti-PS1 antibody showing PS1/EphA3 binding in HEK293 cells transfected with human PS1 and EphA3. (E) Coimmunoprecipitation assays using an anti-PS1 N-terminal (NT) antibody showing PS1/EphA3 binding in mouse brains (postnatal day 2).*, indicates IgG band.
Figure 2 with 1 supplement
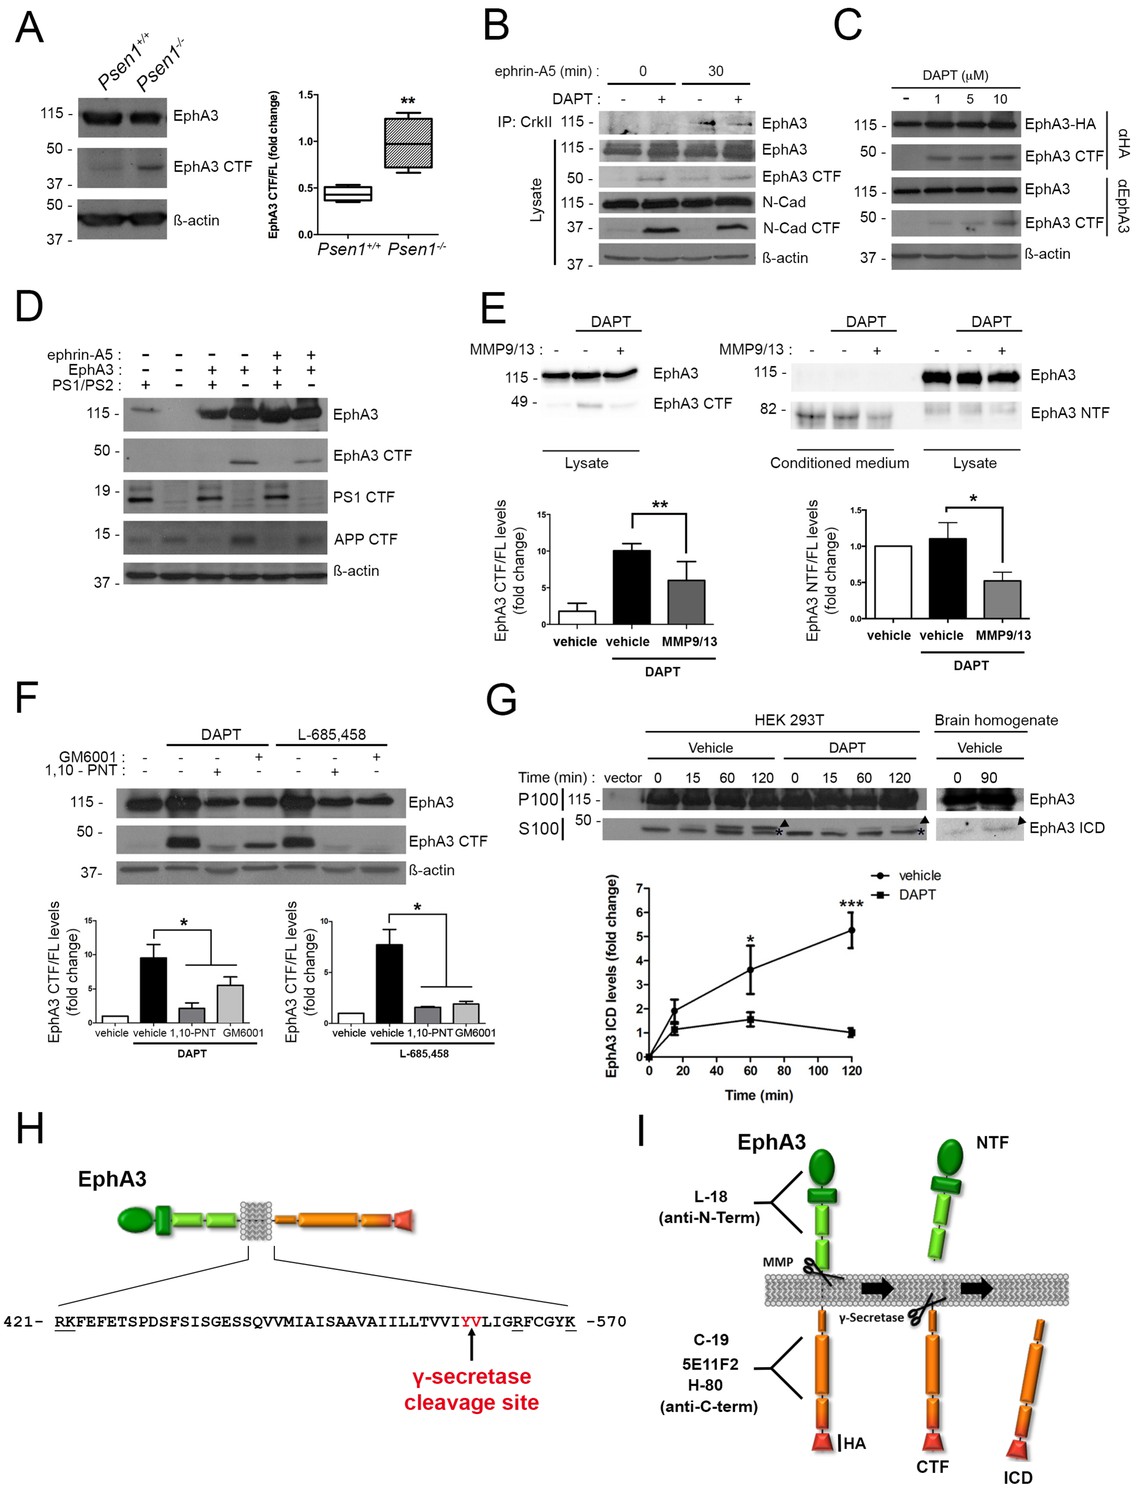
PS1/γ-secretase mediates EphA3 processing in mammalian cells.
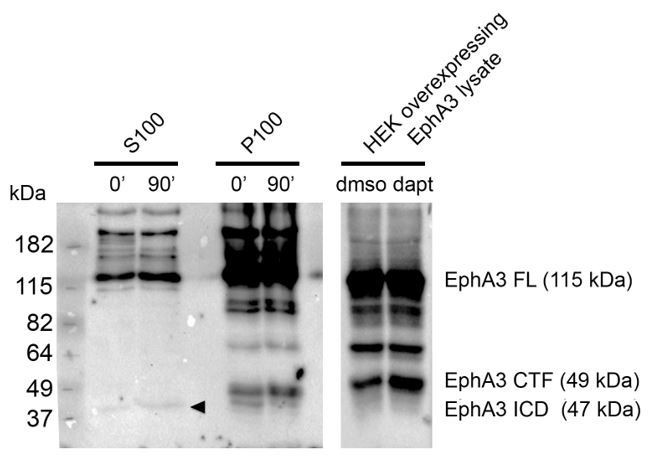
(A) Accumulation of EphA3 CTFs in Psen1-/- mouse brains. Western blot analysis of brain lysates from Psen1+/+ and Psen1-/- mouse embryos (E15.5). Values represent mean ± SEM (n = 4); Unpaired two-tailed Student’s t test: **p<0.01. (B) EphA3 CTFs accumulate in hippocampal neurons deficient in γ-secretase. Western blot analysis of EphA3 CTF (polyclonal C-19 antibody) in hippocampal neurons (4DIV) treated with γ-secretase inhibitor (DAPT) and/or ephrin-A5. (C) Accumulation of EphA3 CTFs in HEK293 cells treated with γ-secretase inhibitor. Western blot analysis of HEK293 cells expressing EphA3-HA (monoclonal anti-HA, top; 5E11F2 antibody, bottom) treated with increasing concentrations of DAPT. (D) Impaired EphA3 cleavage in PS/γ-secretase-deficient mouse embryonic fibroblasts (MEFs). Western blot analysis of EphA3 in Psen1+/+/2+/+ (PS1/PS2: +) or Psen1-/-/2-/- (PS1/PS2: -) MEFs non-transfected (EphA3-) or transfected (EphA3+) with EphA3 in the presence or absence of clustered ephrin-A5. Reduced PS1 and accumulated APP CTFs are used as controls of decreased PS1 expression and γ-secretase-deficiency, respectively. (E) Reduced EphA3 NTFs levels in HEK293 cells treated with MMP9/13. MMP9/13 reduces significantly EphA3 CTF accumulation induced by DAPT in lysates (5E11F2 antibody; left image) and EphA3 NTFs in conditioned medium (L-18 antibody) of EphA3-overexpressing HEK293 cells (n = 5). (F) The ADAM/metalloprotease inhibitors GM6001 and 1,10-PNT abrogated EphA3 CTF accumulation induced by DAPT or L-685,458 (C-19 antibody) in HEK293 cells. (G) In vitro EphA3 ICD generation. Cell-free γ-secretase assay showing time-dependent generation of EphA3 ICD (arrowheads) in the soluble fraction (S100) of HEK293 cells transfected with EphA3 (left) and mouse brains (P2) (right). Full-length EphA3 is present only in the pellet (P100). *Indicates a degradation band that appears independently of time and treatment. In E–G), data are mean ± SD (n = 3–5 experiments). One-way ANOVA followed by Bonferroni post hoc test: *p<0.05, **p<0.01, ***p<0.0001, compared to vehicle or control or the indicated group. (H) Identification of the PS/γ-secretase cleavage site in EphA3. LC-MS/MS analysis of trypsin-digested gel-in samples of the EpA3 ICD band generated in vitro using the γ-secretase assay of transfected HEK293 cells identified the VLIGR peptide, demonstrating that EphA3 is cleaved at Y560 (indicated in red). Trypsin target residues are underlined. (I) Model of PS/γ-secretase-dependent EphA3 processing. EphA3 structural domains (colored boxes) and epitopes detected by antibodies used in this study. MMP, matrix metalloproteinase protein; CTF, C-terminal fragment; ICD, Intracellular Domain.
Figure 2—figure supplement 1
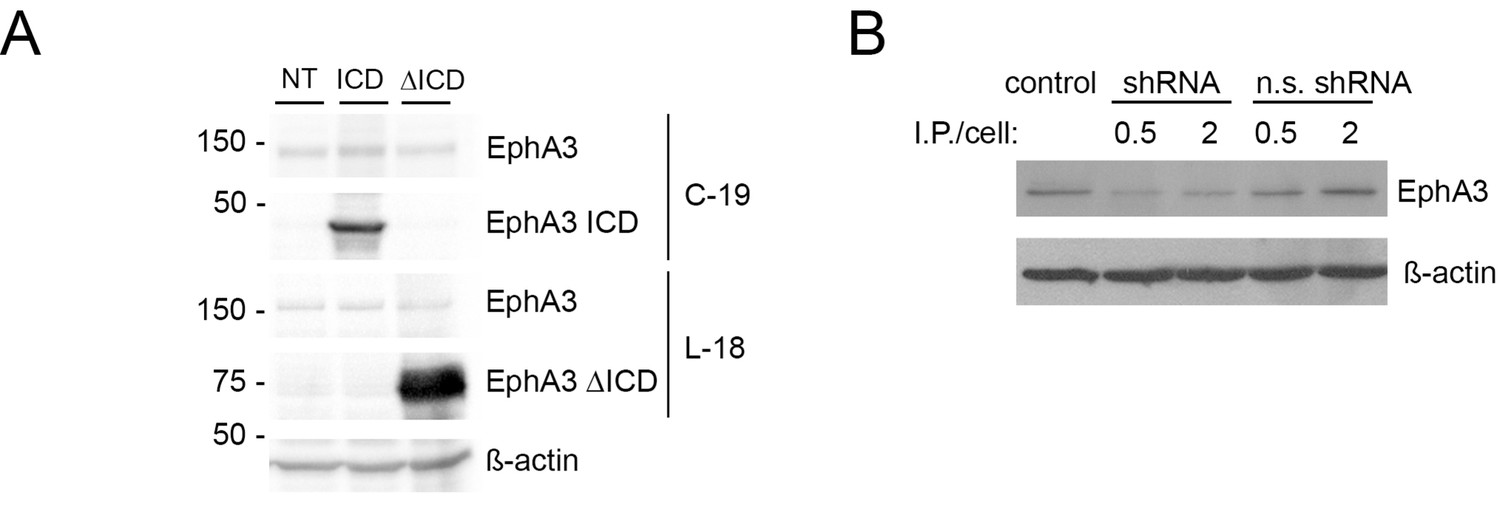
Overexpression of EphA3 mutants and Epha3 inactivation.
(A) Biochemical analyses showing expression of exogenous EphA3 ICD (C-19 antibody) and ΔICD (L-18 antibody) in HEK293 cells. (G) ShRNA-mediated Epha3 knock-down in neurons. Reduced EphA3 levels in Epha3 shRNA-treated cultured neurons. I.P: infected particles. N.s: non-specific.
Figure 3 with 1 supplement
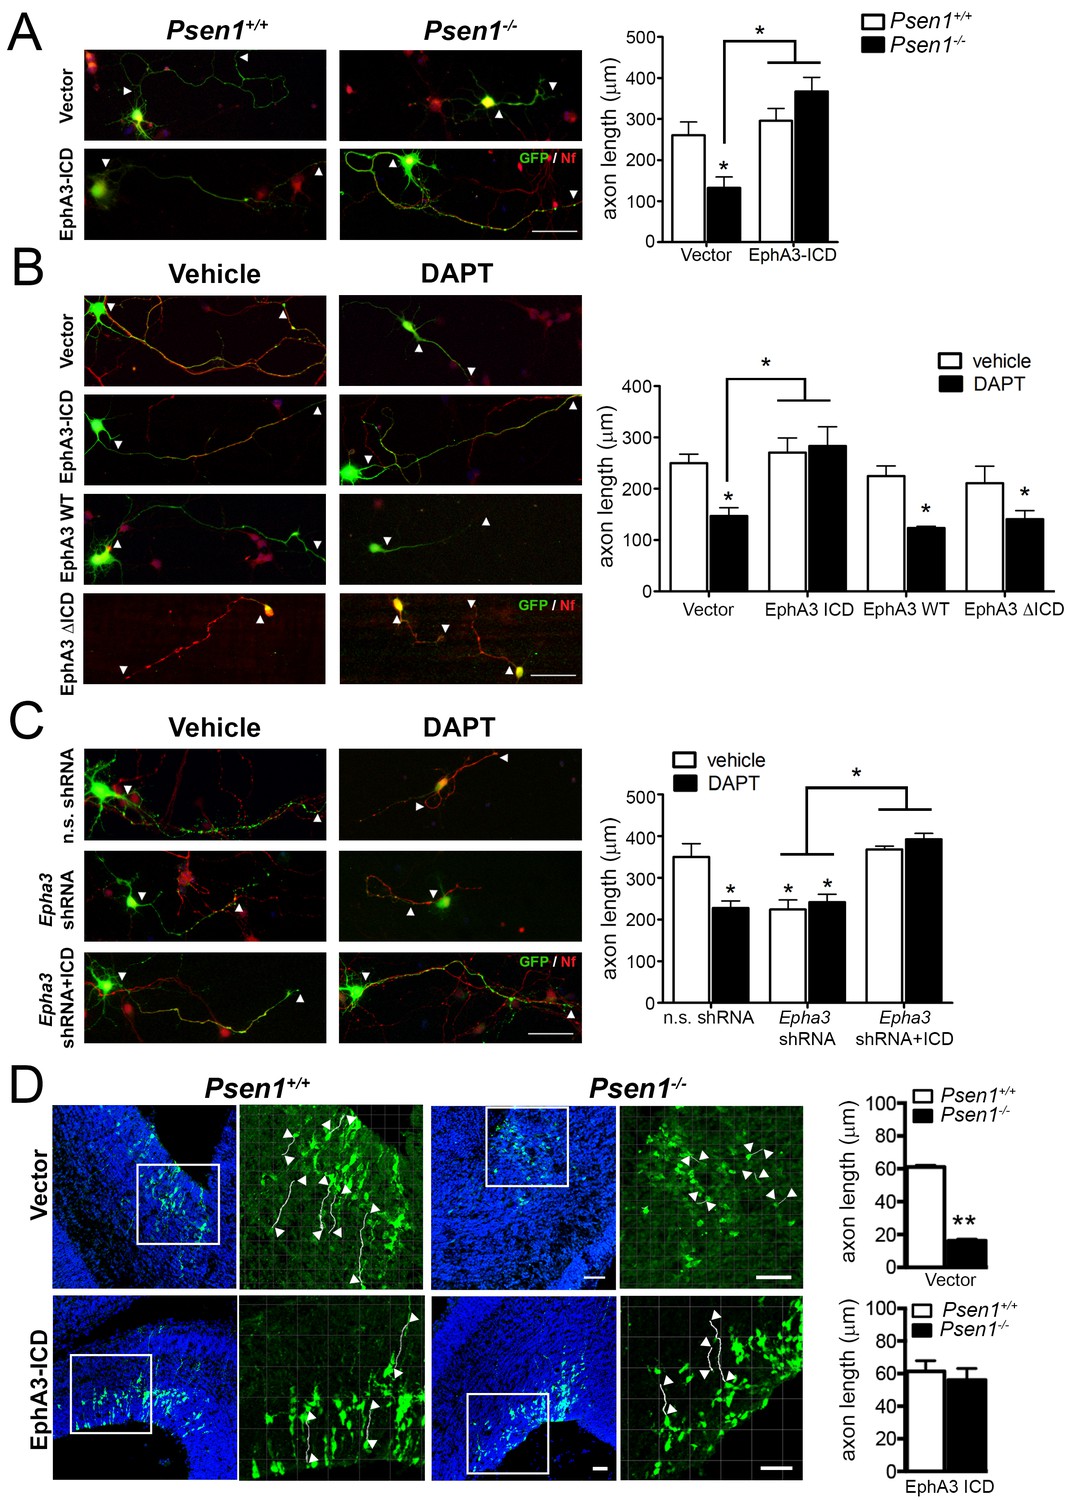
EphA3 ICD reverses axon defects in PS/γ-secretase- and EphA3-deficient neurons.
(A) EphA3 ICD reverses axon growth defects in Psen1-/- hippocampal neurons. Immunofluorescence staining (left) and quantitative analysis (right) of axon length (indicated by arrowheads) in PS/γ-secretase-deficient neurons expressing vector or EphA3 ICD (SMI312, red; GFP, green). (B) EphA3 ICD reverses axon growth defects in PS/γ-secretase-deficient hippocampal neurons. EphA3 ICD (GFP, green), but not EphA3 WT or ΔICD, reverses axon growth defects in DAPT-treated hippocampal neurons. Axons were visualized with SMI312 (red). (C) EphA3 ICD reverses axon defects in Epha3-deficient neurons. EphA3 ICD (GFP, green) reverses defects in axon length (SMI312, red) both in Epha3 ShRNA- or DAPT-treated hippocampal neurons. n.s. shRNA: non-specific scramble shRNAs. (D) In utero electroporation assays in Psen1+/+ and Psen1-/- embryos. Confocal microscope images showing mCherry (red color converted to green color; top) or GFP (green; bottom) and Hoescht (blue) stainings in Psen1+/+ and Psen1-/- mouse brains (E16.5) transduced with empty (mCherry; top) and EphA3 ICD (GFP; bottom) vectors. Marked square regions in the ventricular zone are magnified in the right images. Arrowheads indicate representative stained axons (white) quantified in the bar diagrams. Scale bar, 50 μm. Data in A–C) represent mean ± SEM of at least three experiments (3–6 coverslips, n = 30 neurons/coverslips). In D), data represent mean ± SEM of different sections (n = 3–9) of multiple mice. Statistics were analyzed by two-way ANOVA followed by Bonferroni post hoc test (A–C) or unpaired two-tailed t Student (D). **p<0.05, **p<0.0001 compared to vehicle (control), Psen1+/+ or the indicated group.
Figure 3—figure supplement 1
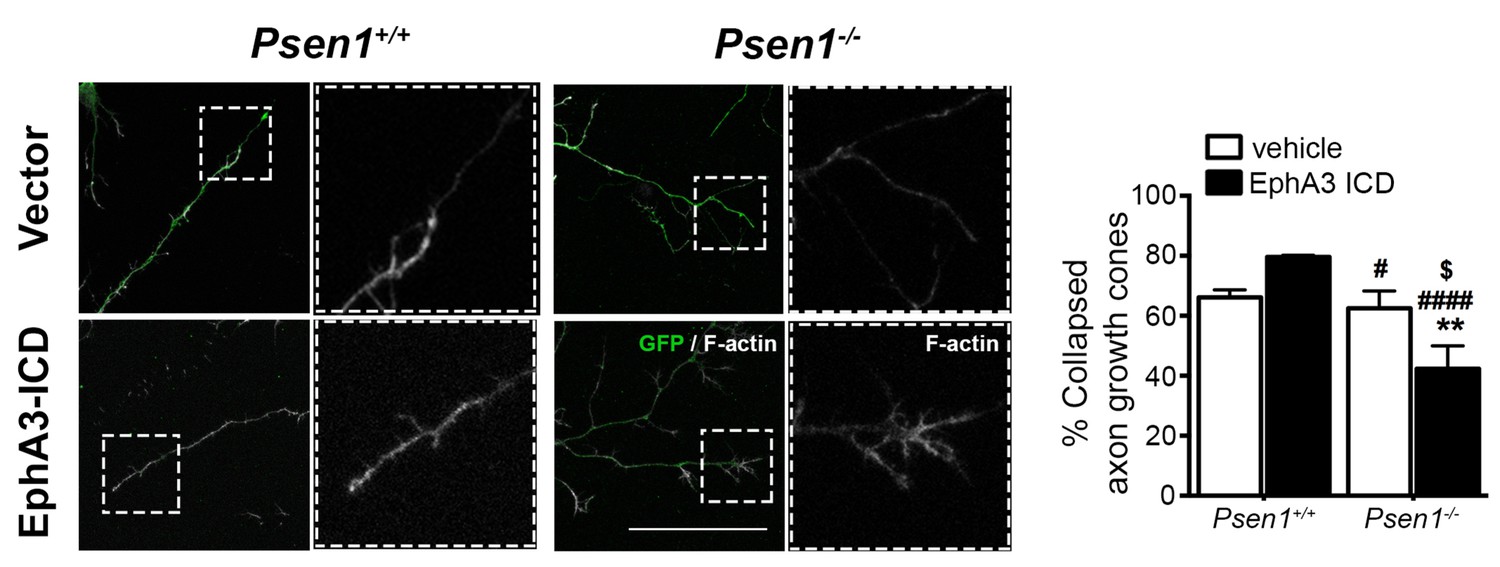
Effect of EphA3 ICD on axon growth cone collapse.
EphA3 ICD regulates growth cone collapse in hippocampal neurons. Hippocampal Psen1+/+ and Psen1-/- neurons were transfected with vector (pWPI-GFP) or EphA3 ICD (green) at 2 DIV and fixed and stained with F-actin (white) at 4 DIV. The percentage of collapsed growth cones is significantly different between genotypes (****p<0.0001), whereas EphA3 ICD induces a decrease in the percentage of collapsed growth cones in PS1-/- neurons. N = 26–33 neurons/group. Statistics was tested by two-way ANOVA followed by Bonferroni post hoc test. **p<0.01 compared with controls, ####p<0.0001 compared with Psen1+/+ neurons transduced with EphA3 ICD; $p<0.05, compared with vector Psen1-/-. Scale bar, 50 μm.
Figure 4
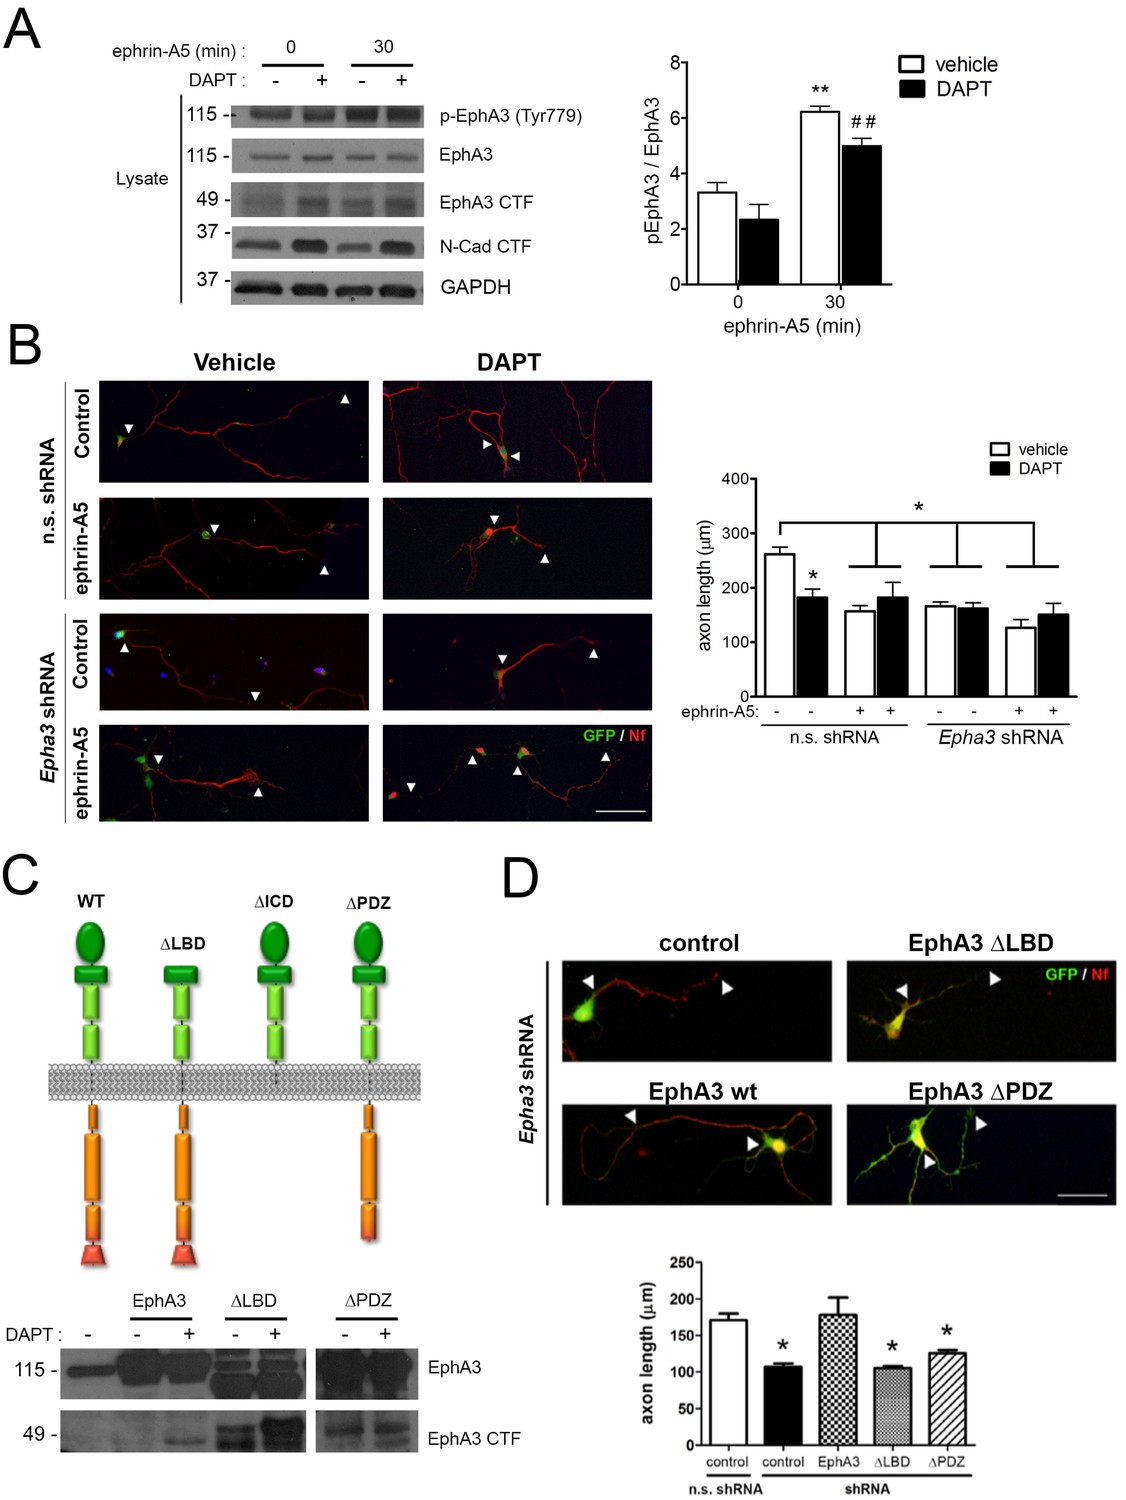
PS1/γ-secretase regulates axon growth independently of EphA3-ephrin signaling.
(A) Inhibition of PS1/γ-secretase does not affect EphA3 phosphorylation. Biochemical analysis of total and phosphorylated (Tyr779) EphA3 and EphA3 CTFs in hippocampal cultured neurons (4 DIV) treated with vehicle (-) or the γ-secretase inhibitor DAPT (+) in the absence or presence of clustered ephrin-A5 (normalized to GAPDH). Data are mean pEphA3/EphA3 fold ± SEM (n = 3–5 experiments). Two-way ANOVA followed by Bonferroni post hoc test: **p<0.01, compared with control (non-stimulated) and, ##p<0.01, compared to DAPT (non-stimulated). (B) EphA3 is required for axon elongation and ephrin-A5-mediated axon retraction. Representative immunofluorescence images (left) and quantification (right) of neurofilament-positive axons (SMI312: red) of hippocampal neurons (4 DIV) transduced with non-specific (n.s.) scramble and Epha3 shRNAs (GFP positive, green) and treated with DAPT and/or clustered ephrin-A5. Length of axons is indicated by arrowheads. Scale bar, 50 μm. Data represent mean ± SD (n = 3 experiments; n = 30–40 cells/condition/experiment). Two-way ANOVA followed by Bonferroni post hoc test: *p<0.05, compared with vehicle control. (C) Biochemical analysis of EphA3 mutants (left) in mammalian cells. Overexpression of EphA3 WT, ΔLBD and ΔPDZ mutants in HEK293 cells. (D) Effect of EphA3 deleted mutants on axon growth. Immunofluorescence images (left) and quantification (right) of neurofilament-positive axons (SMI312: red; arrowheads) of hippocampal neurons (4 DIV) transduced with murine-specific Epha3 shRNAs and the indicated EphA3 construct (GFP positive, green). Scale bar, 50 μm. Data represent mean ± SD (n = 3 experiments; n = 30–40 cells/condition/experiment). One-way ANOVA followed by Bonferroni post hoc test: *p<0.05, compared with vehicle control.
Figure 5
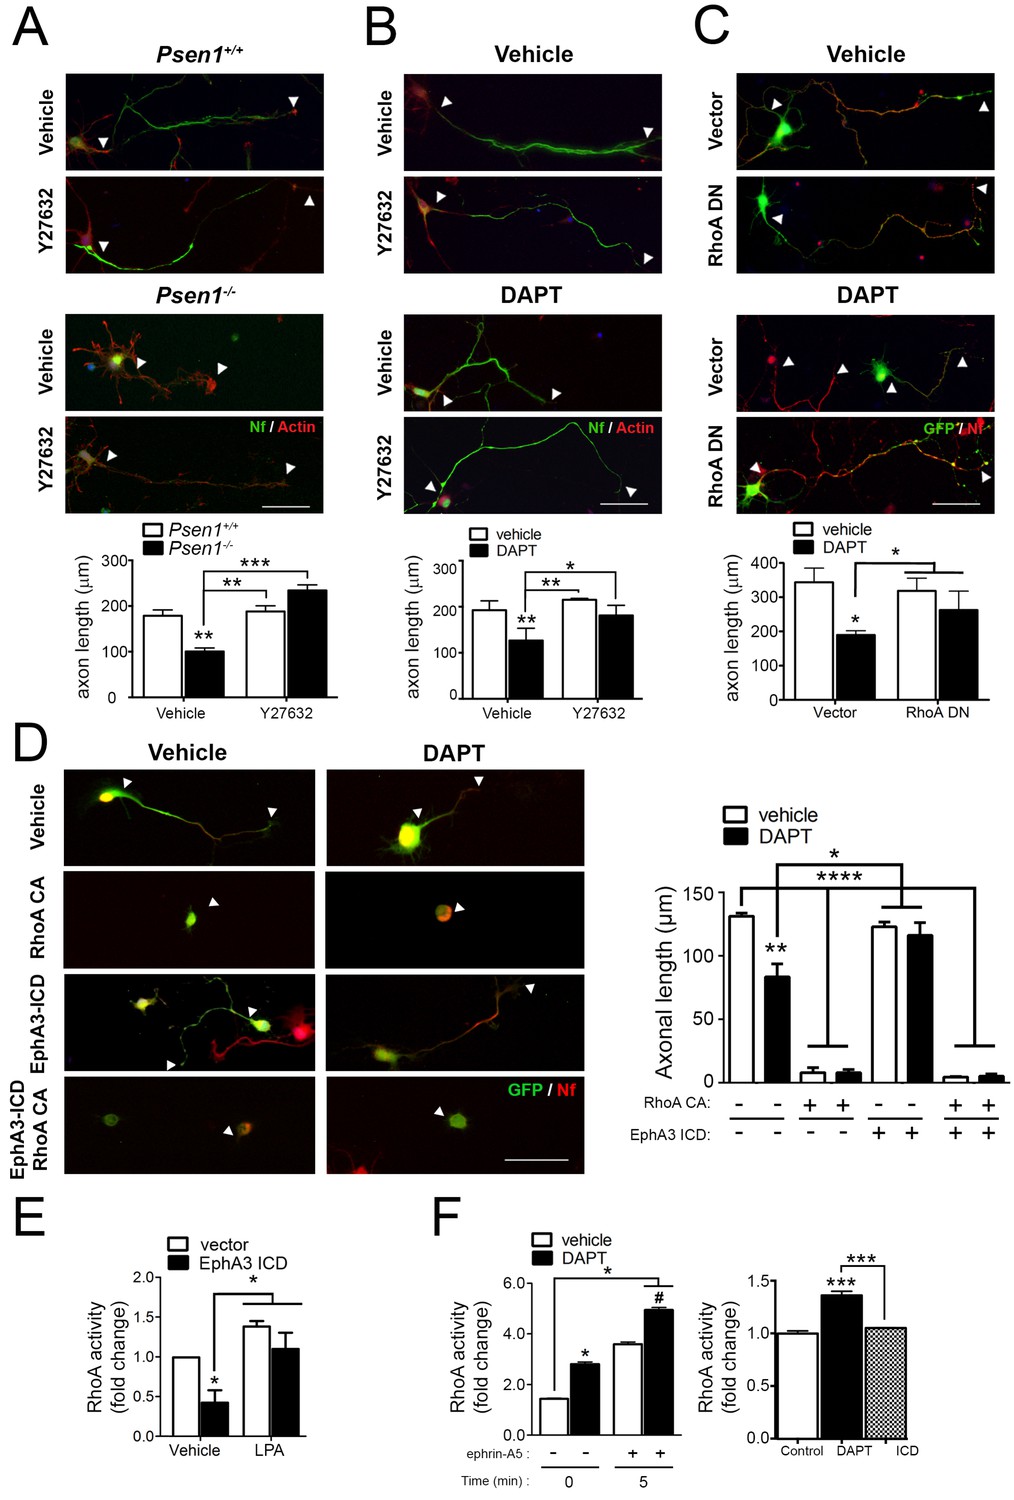
PS/γ-secretase-dependent EphA3 cleavage mediates axon elongation partially through RhoA signaling.
(A) ROCK inhibition reverses axon length deficits in Psen1-/- neurons. Immunofluorescence images of hippocampal neurons from Psen1+/+ and Psen1-/- embryos treated with vehicle or the RhoA inhibitor Y27632. Neurons were stained for neurofilament (SMI312: green; arrowheads) and β-actin (red). Scale bar, 50 μm. Arrowheads indicate axon length. Data represent mean ± SEM of three independent experiments (3–6 coverslips, n = 30 neurons/coverslip). **p<0.01, ***p<0.001, (B) ROCK inhibition reverses axon length deficits in γ-secretase-deficient neurons. Images of cultured hippocampal neurons treated with vehicle or DAPT and/or the RhoA inhibitor Y27632. Neurons were stained for neurofilament (SMI312: green; arrowheads) and β-actin (red). Scale bar, 50 μm. Data represent mean ± SEM of three independent experiments (3–6 coverslips, n = 30 neurons/coverslip). *p<0.05, **p<0.01. (C) RhoA inhibition reverses axon length deficits γ-secretase-deficient neurons. Immunofluorescence images of hippocampal neurons stained for GFP (green) or neurofilament (SMI312, red). Neurons were transfected with GFP (vector) alone or with a RhoA dominant negative (DN) mutant (RhoA T19N) in the presence of vehicle or DAPT. Scale bar, 50 μm. Data represent mean ± SEM of at least three experiments (3–6 coverslips, n = 30 neurons/coverslip). *p<0.05. (D) Constitutively active RhoA affects negatively axon growth of hippocampal neurons. Neurons were transfected with GFP (vector), EphA3-ICD-GFP (EphA3 ICD) and/or a RhoA constitutive active (CA) mutant (RhoA Q63L) in the presence of vehicle or DAPT. Immunofluorescence images of hippocampal neurons stained for GFP (green) and neurofilament (SMI312, red). Scale bar, 50 μm. Data are mean ± SD of three experiments (n = 40–80 neurons/group). *p<0.05, **p<0.01, ****p<0.0001. (E) RhoA activity in SK-N-AS neuronal cells transfected with vector or EphA3 ICD. LPA: Lipopolysaccharide acid. Data represent mean ± SEM (n = 3–4 independent cultures). *p<0.05. (F) Differential effect of DAPT and EphA3 ICD in RhoA activity in cultured neurons. RhoA activity in neurons treated with vehicle or DAPT plus clustered ephrin-A5, or transduced with EphA3 ICD. Data represent mean ± SEM (n = 3). *p<0.05, ***p<0.001. Statistical analysis was performed by two-way ANOVA followed by Bonferroni post hoc test.
Figure 6 with 2 supplements
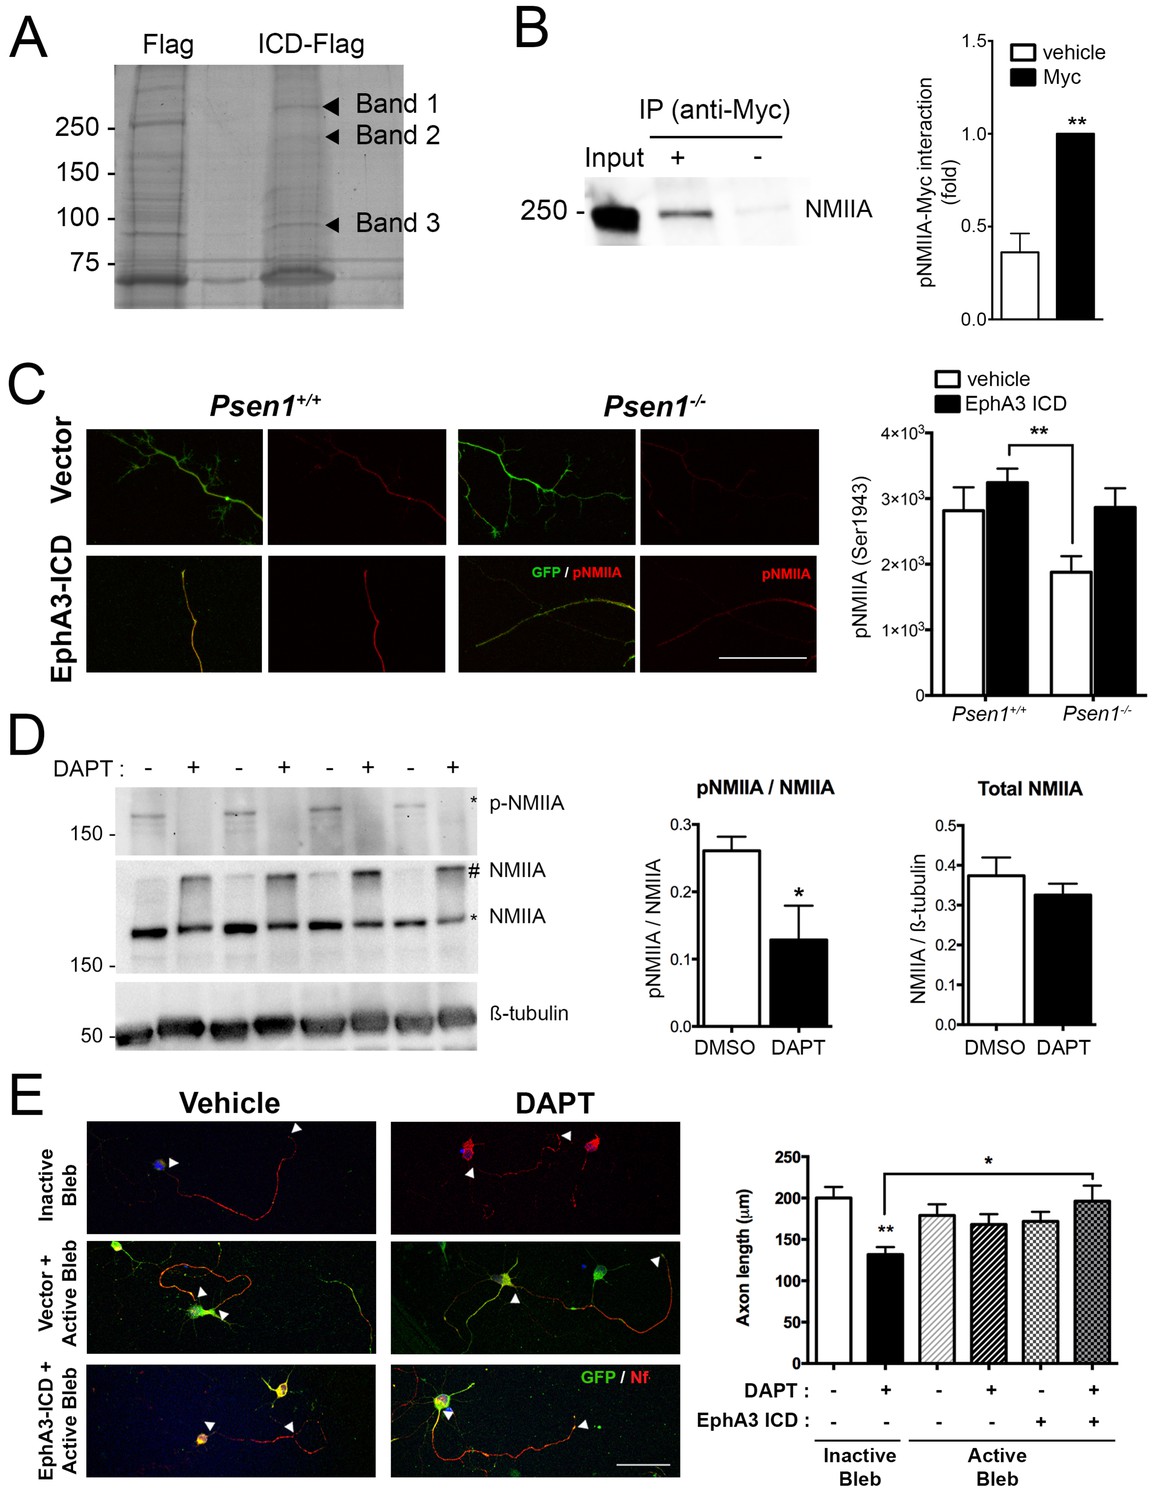
EphA3 ICD interacts with non-muscle myosin IIA and regulates its phosphorylation levels.
(A) Proteomic analysis of EphA3 interacting proteins. HEK293 cells overexpressing vector (Flag) or EphA3 ICD-Flag (ICD-Flag) were immunoprecipitated with anti-Flag antibody, and proteins were resolved by SDS-PAGE and stained with Coomassie Blue. Specific proteins (Band 1, 2 and 3) were identified by MALDI-TOF/TOF mass spectrometry. Band one corresponds to NMIIA. (B) Binding of EphA3 ICD-myc to NMIIA/myosin 9. Coimmunoprecipitation (IP) of endogenous NMIIA and EphA3 ICD-myc in HEK293 cells. Data are mean ± SEM of three experiments. Unpaired two-tailed Student’s t test: **p<0.01. (C) Reduced pNMIIA in axons of Psen1-/- neurons. Immunofluorescence staining (left) and quantitative analysis (right) of phosphorylated NMIIA heavy chain (S1943) (pNMIIA: red) in axons of Psen1+/+ and Psen1-/- neurons. Psen1-deficient neurons show reduced axonal pNMIIA intensity that is reversed by expressing EphA3 ICD (GFP, green) Scale bar, 50 μm. Data are mean ± SEM of 3 experiments (n = 25–33 neurons/group). Two-way ANOVA followed by Bonferroni post hoc test: **p<0.01. (D) Pharmacological PS/γ-secretase inhibition reduces phosphorylated NMIIA levels. DAPT treated hippocampal neurons show reduced pNMIIA (S1943) and soluble NMIIA (indicated with *), and increased insoluble/aggregated NMIIA (indicated with #). Multiple independent cultures are shown. Data are mean ± SD of four independent neuronal cultures. Unpaired two-tailed Student’s t test: *p=0.05. (E) Pharmacological inhibition of NMII by blebbistatin rescues the defects in axon length in DAPT-treated hippocampal neurons. Immunofluorescence images of hippocampal neurons stained for GFP (EphA3-ICD or vector-positive neurons; green) and neurofilament (SMI312, red). Scale bar, 50 μm. Data are mean ± SEM of 3 experiments (n = 44–56 neurons/group). Two-way ANOVA indicates a significant DAPT treatment x ICD/blebbistatin interaction. *p<0.05, **p<0.01.
Figure 6—figure supplement 1
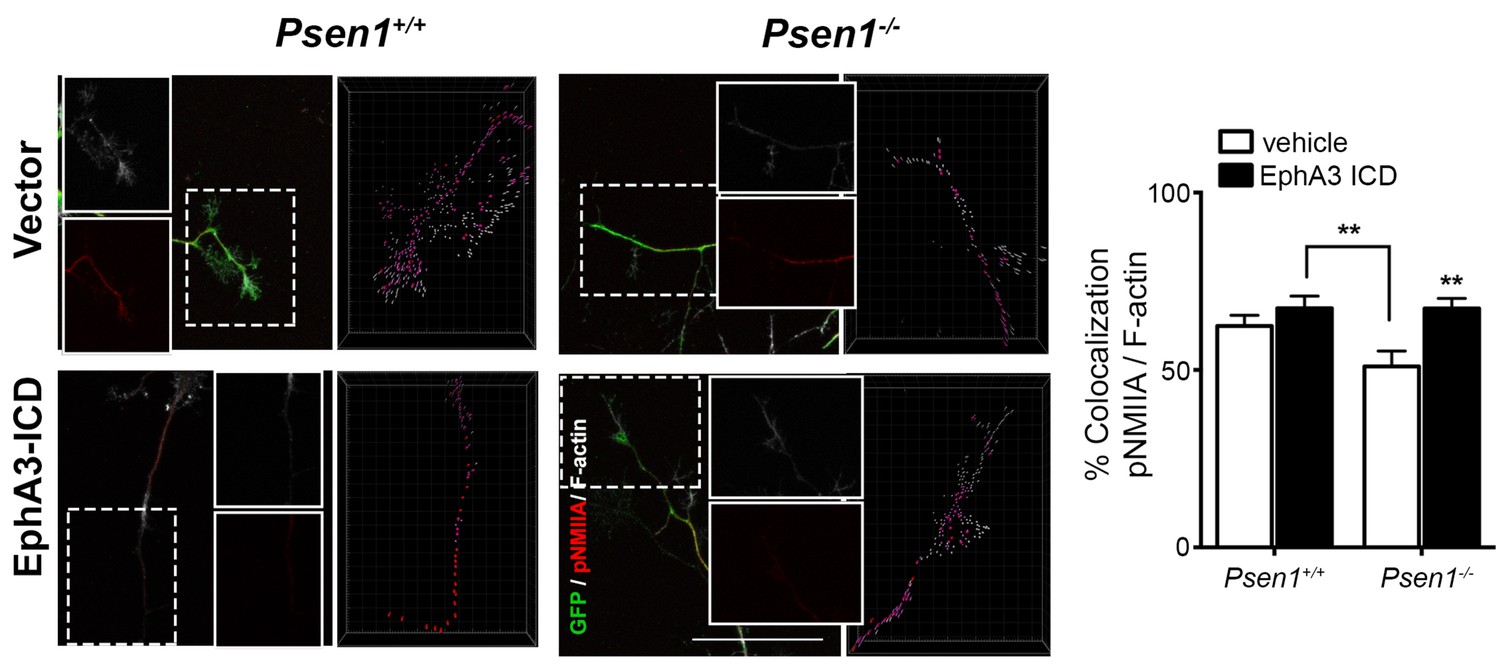
Reduced pNMIIA/F-actin colocalization in growth cones of Psen1-/- neurons.
Colocalization of pNMIIA and F-actin at growth cones of neurons from Psen1+/+ and Psen1-/- embryos. EphA3 ICD overexpression increases the pNMIIA spots that colocalize with F-actin at growth cones. Statistics was tested by two-way ANOVA followed by Bonferroni post hoc test. **p<0.01, as indicated and EphA3 ICD- vs vector-transfected Psen1-/- neurons. Data are mean ± SEM of 3 experiments (n = 26–33 neurons/group). Scale bar, 50 μm.
Figure 6—figure supplement 2
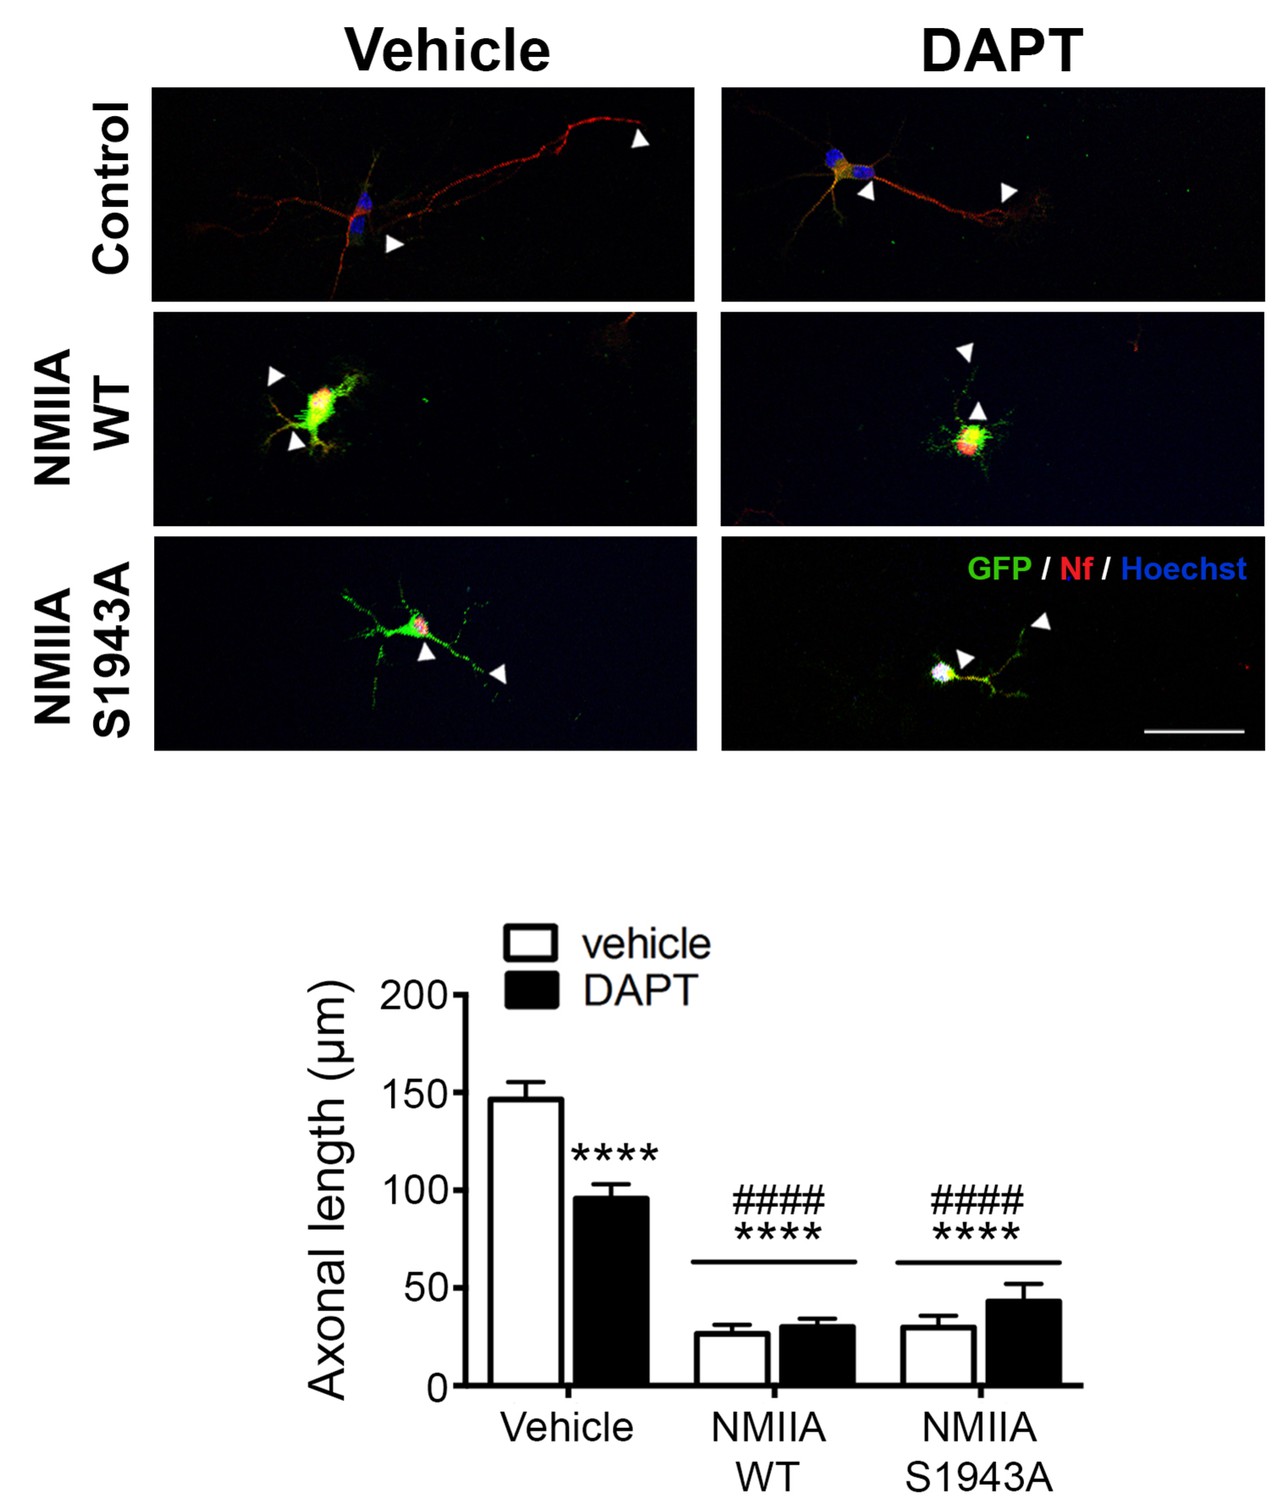
NMIIA regulates axon retraction.
Overexpression of NMIIA WT and NMIIA S1943A (deficient for S1943 phosphorylation) cause axonal retraction in hippocampal neurons. Hippocampal neurons were transfected with NMIIA WT and NMIIA S1943A vectors at 2 DIV, treated with vehicle or DAPT and fixed at 4 DIV. The immunofluorescence analysis with GFP (green) and neurofilament (SMI312, red) show that the expression of NMIIA WT and S1943A causes axon retraction. Scale bar, 50 μm. Statistics was tested by two-way ANOVA followed by Bonferroni post hoc test. Statistical analysis indicates a significant NMIIA transfection effect and DAPT treatment x NMIIA transfection interaction. Data are mean ± SEM of 3 experiments (n = 24–41 neurons/group). ****p<0.0001 (compared to Vehicle DMSO), ####p<0.0001 (compared to Vehicle DAPT).
Figure 7
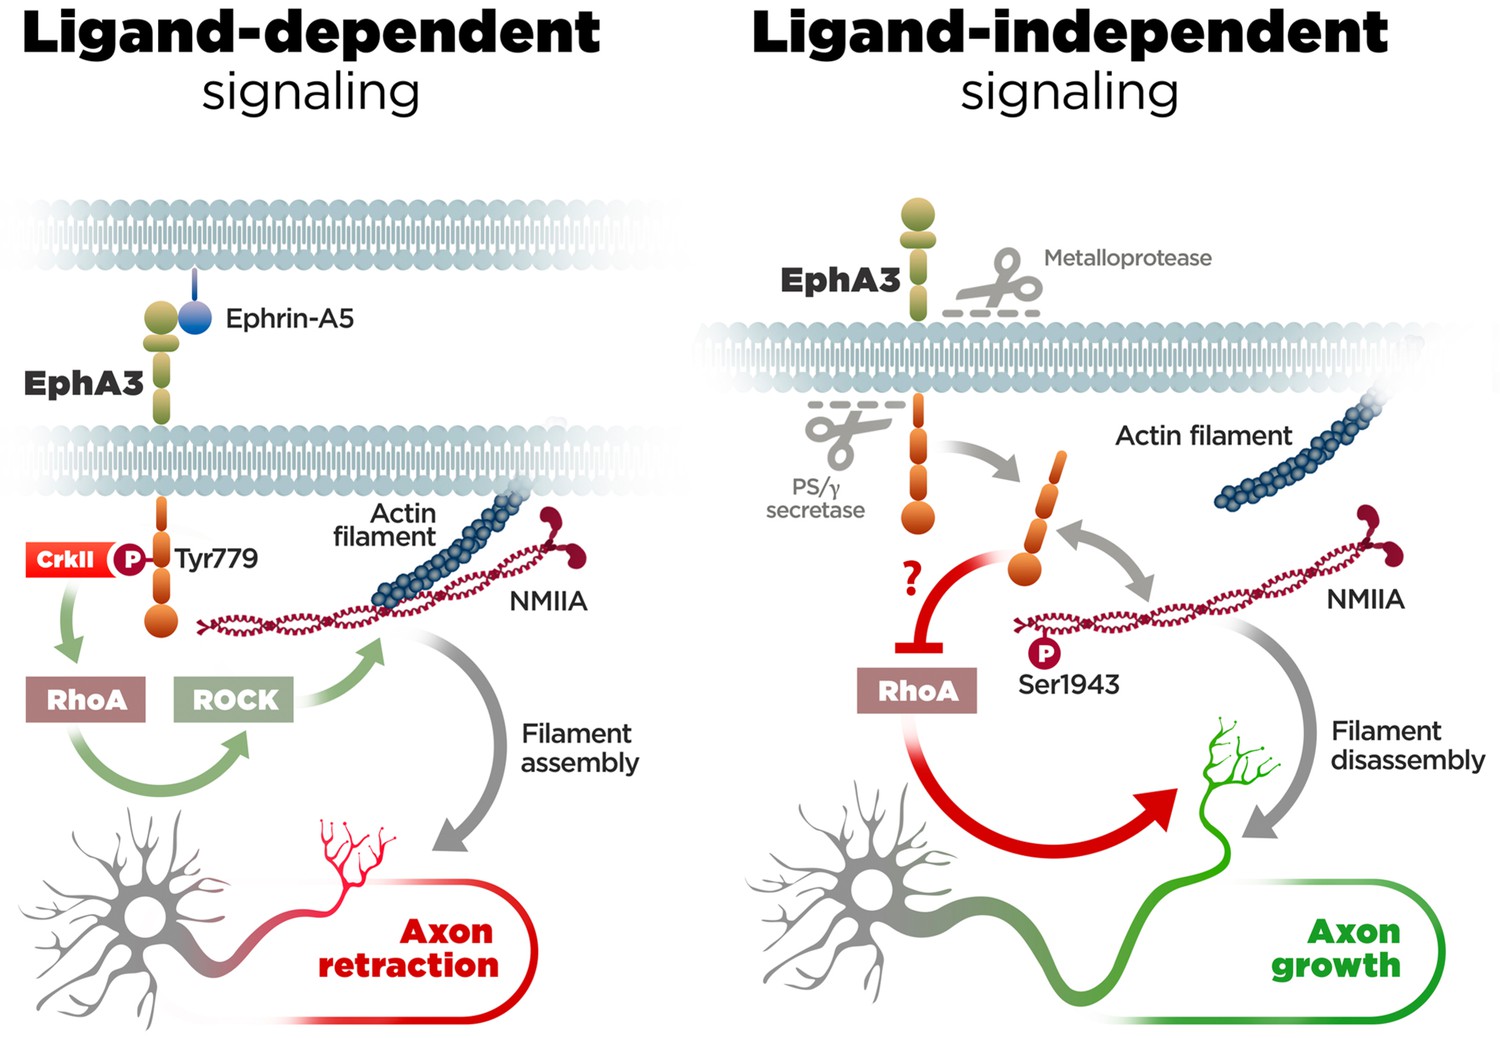
Molecular mechanisms of axon growth mediated by ephrin-dependent and -independent EphA3 signaling.
Proposed model of ligand-dependent and -independent EphA3 signaling regulating axon growth in neurons. Left: Ephrin-A5 induces EphA3 phosphorylation (Tyr779), CrkII binding and activation of RhoA/ROCK, resulting in actin/NMIIA filament assembly and axon retraction in hippocampal neurons (Figure 4). Right: EphA3 ICD, generated by sequential cleavage of EphA3 by matrix metalloproteinase/ADAM and PS/γ-secretase proteases, promotes axon growth possibly by inhibiting RhoA signaling, and binding to and increasing phosphorylation (Ser1943) of NMIIA heavy chain in axons (Figures 2, 3, 5 and 6). Inactivation of PS/γ-secretase decreases phosphorylated NMIIA and NMIIA/actin colocalization in axons, which stabilizes membrane cytoskeleton-associated NMIIA resulting in assembly or blocking disassembly of filaments, and leads to inhibition of axon growth (Figure 1).
Author response image 1
Detection of EphA3 ICD in mouse brains in vivo.
PS/γ-secretase-mediated EphA3 processing in mouse brain. In vitro γ-secretase activity assay in brain lysates of embryonic mouse brains (E17.5). Biochemical analysis shows generation of EphA3 ICD (90 min, arrowhead) in the soluble fraction (S100) and EphA3 CTF in the pellet fraction (P100). Mass spectrometry sequencing revealed the identity of this fragment as EphA3 ICD (Figure 2H).
Tables
Key resources table
| Reagent type (species) or resource | Designation | Source or reference | Identifiers | Additional information |
|---|---|---|---|---|
| Cell line (H. sapiens) | HEK293 (Human embryonic kidney293 cells) | American Type Culture Collection | ||
| Cell line (M. musculus) | PS1/PS2-/- MEF (mouse embryonic fibroblast cells) | B. De Strooper (Katholieke Universiteit Leuven, Belgium) | ||
| Strain (M. musculus) | Psen1+/+; Psen1-/-; Psen2-/- | J. Shen (Brigham and Women Hospital, USA) | MGI: 1202717 | PMID: 9160754 |
| Antibody | anti-EphA3 C19 (rabbit polyclonal) | Santa Cruz Biotechnology | Cat. #: sc-919 RRID: AB_2099221 | WB (1:1000) |
| Antibody | anti-EphA3 H80 | Santa Cruz Biotechnology | Cat. #: sc-25456 RRID: AB_2099214 | ICC (1:200) IHC (1:200) |
| Antibody | anti-EphA3 L18 (rabbit polyclonal) | Santa Cruz Biotechnology | Cat. #: sc-920 RRID: AB_2099218 | WB (1:1000) |
| Antibody | anti-EphA3 (mouse monoclonal) | ThermoFisher Scientific | Cat. #: 5E11F2 RRID: AB_10104885 | WB (1:1000) IP (5 μg) |
| Antibody | anti-CrkII | BD Biosciences | Cat. #: 610035 RRID: AB_397451 | WB (1:5000) IP (5 μl) |
| Antibody | anti-Neurofilament; SMI312 (mouse monoclonal) | Covance | Cat. #: SMI-312R RRID: AB_2314906 | ICC (1:1000) |
| Antibody | anti-tau; TNT-1 (mouse monoclonal) | Merck Millipore | Cat. #: MAB3420 RRID: AB_94855 | IHC (1:400) |
| Antibody | anti-Nestin; rat-401 (mouse monoclonal) | Abcam | Cat. #: ab11306 RRID: AB_1640723 | IHC (1:200) |
| Antibody | anti-NeuN (mouse monoclonal) | Merck Millipore | Cat. #: MAB377 RRID: AB_2298772 | IHC (1:1000) |
| Antibody | anti-MAP2 (mouse monoclonal) | Sigma-Aldrich | Cat. #: M9942 RRID: AB_477256 | ICC (1:300) IHC (1:800) |
| Antibody | anti-Doublecortin (rabbit polyclonal) | Abcam | Cat. #: ab18723 RRID: AB_732011 | IHC (1:1000) |
| Antibody | PS1; APS11 (mouse monoclonal) | Abcam | Cat. #: ab15456 RRID: AB_301867 | ICC (1:200) IHC (1:200) |
| Antibody | PS1 loop (rabbit polyclonal) | Merck Millipore | Cat. #: AB5308 RRID: AB_91785 | WB (1:4000) |
| Antibody | APP C-terminal Saeko (rabbit polyclonal; serum) | M. Shoji (Gunma Univ School Medicine, Japan) | - | WB (1:7500) |
| Antibody | ß-actin [AC-15] (mouse monoclonal) | Sigma-Aldrich | Cat. #: A1978 RRID: AB_476692 | WB (1:60000) |
| Antibody | anti-Flag [FG4R] (mouse monoclonal) | Abcam | Cat. #: ab127420 RRID: AB_11157374 | IP (10 μl) |
| Antibody | anti-HA (mouse monoclonal) | Cell Signaling Technology | Cat. #: 2362 | WB (1:1000) |
| Antibody | AlexaFluor 594-phalloidin | ThermoFisher Scientific | Cat. #: A12381 RRID: AB_2315633 | ICC (1:50) |
| Antibody | GFP (chicken polyclonal) | Abcam | Cat. #: 13970 RRID: AB_371416 | ICC (1:1000) |
| Recombinant DNA reagent | EphA3-GFP | P. W. Janes (Monash University, Australia) | ||
| Recombinant DNA reagent | EphA3-HA | This study | ||
| Recombinant DNA reagent | EphA3-∆ICD | P. W. Janes (Monash University, Australia) | ||
| Recombinant DNA reagent | EphA3-∆LBD | P. W. Janes (Monash University, Australia) | ||
| Recombinant DNA reagent | EphA3-∆PDZ | P. W. Janes (Monash University, Australia) | ||
| Recombinant DNA reagent | EphA3-ICD | This study | ||
| Recombinant DNA reagent | EphA3-ICD-Flag | This study | ||
| Recombinant DNA reagent | EphA3-ICD-pCAGIG | This study | ||
| Recombinant DNA reagent | RhoA T19N | X. R. Bustelo (Centro Investigación del Cáncer, CSIC, Spain) | ||
| Recombinant DNA reagent | RhoA Q63L | P. Crespo (IBBTEC, Santander, Spain) | ||
| Recombinant DNA reagent | NMIIA WT | A. Bresnick (Albert Einstein College Medicine, NY, USA) | ||
| Recombinant DNA reagent | NMIIA S1943A | A. Bresnick (Albert Einstein College of Medicine, NY, USA) | ||
| Sequenced-based reagent | Epha3 ShRNA | This study | ||
| Sequenced-based reagent | RT-qPCR primers | This study | See Materials and methods | |
| Peptide, recombinant protein | ephrin-A5 Fc chimera | R and D Systems | Cat. #: 374-EA | |
| Commercial assay or kit | RhoA G-LISA Activation Assay Kit | Cytoskeleton Inc | Cat. #: BK124 | |
| Commercial assay or kit | Rnease Mini kit | Qiagen | Cat. #: 74106 | |
| Chemical compound, drug | DAPT | Sigma-Aldrich | Cat. #: D5942 | 5 μM |
| Chemical compound, drug | L685,458 | Tocris | Cat. #: 2627 | 5 μM |
| Chemical compound, drug | GM6001 | Enzo | Cat. #: BML-EI300-0001 | 25 μM |
| Chemical compound, drug | 1,10-PNT | Sigma | Cat. #: 131377 | 83 μM |
| Chemical compound, drug | MMP9/13 | Calbiochem | Cat. #: 444252 | 10 μM |
| Chemical compound, drug | Y27632; ROCK-1 inhibitor | Calbiochem | Cat. #: 688000 | 10 μM |
| Software, algorithm | GraphPad Prism | GraphPad Prism (https://www.graphpad.com/) | RRID:SCR_015807 | Version 6 |
| Software, algorithm | ImageJ | ImageJ (https://imagej.nih.gov/ij/) | RRID:SCR_003070 | |
| Software, algorithm | Imaris | Imaris (https://imaris.oxinst.com/) | RRID:SCR_007370 | Version 8 |
Additional files
-
Supplementary file 1
Proteomic analysis of the PS/γ-secretase-mediated EphA3 cleavage site.
Mass spectrometry spectra of the trypsin-digested band (~47–49 kDa) (top spectra) and specific mass spectrometry spectra obtained for peptide VLIGR showing the mass/charge (m/z) values (bottom spectra). Detected signals corresponding with theoretical ions are labeled with red asterisks.
- https://doi.org/10.7554/eLife.43646.014
-
Supplementary file 2
Identified peptides from NMIIA protein.
- https://doi.org/10.7554/eLife.43646.015
-
Transparent reporting form
- https://doi.org/10.7554/eLife.43646.016
Download links
A two-part list of links to download the article, or parts of the article, in various formats.
Downloads (link to download the article as PDF)
Open citations (links to open the citations from this article in various online reference manager services)
Cite this article (links to download the citations from this article in formats compatible with various reference manager tools)
Presenilin/γ-secretase-dependent EphA3 processing mediates axon elongation through non-muscle myosin IIA
eLife 8:e43646.
https://doi.org/10.7554/eLife.43646


