Kinetochore protein depletion underlies cytokinesis failure and somatic polyploidization in the moss Physcomitrella patens
- Nagoya University, Japan
Figures
Figure 1 with 7 supplements
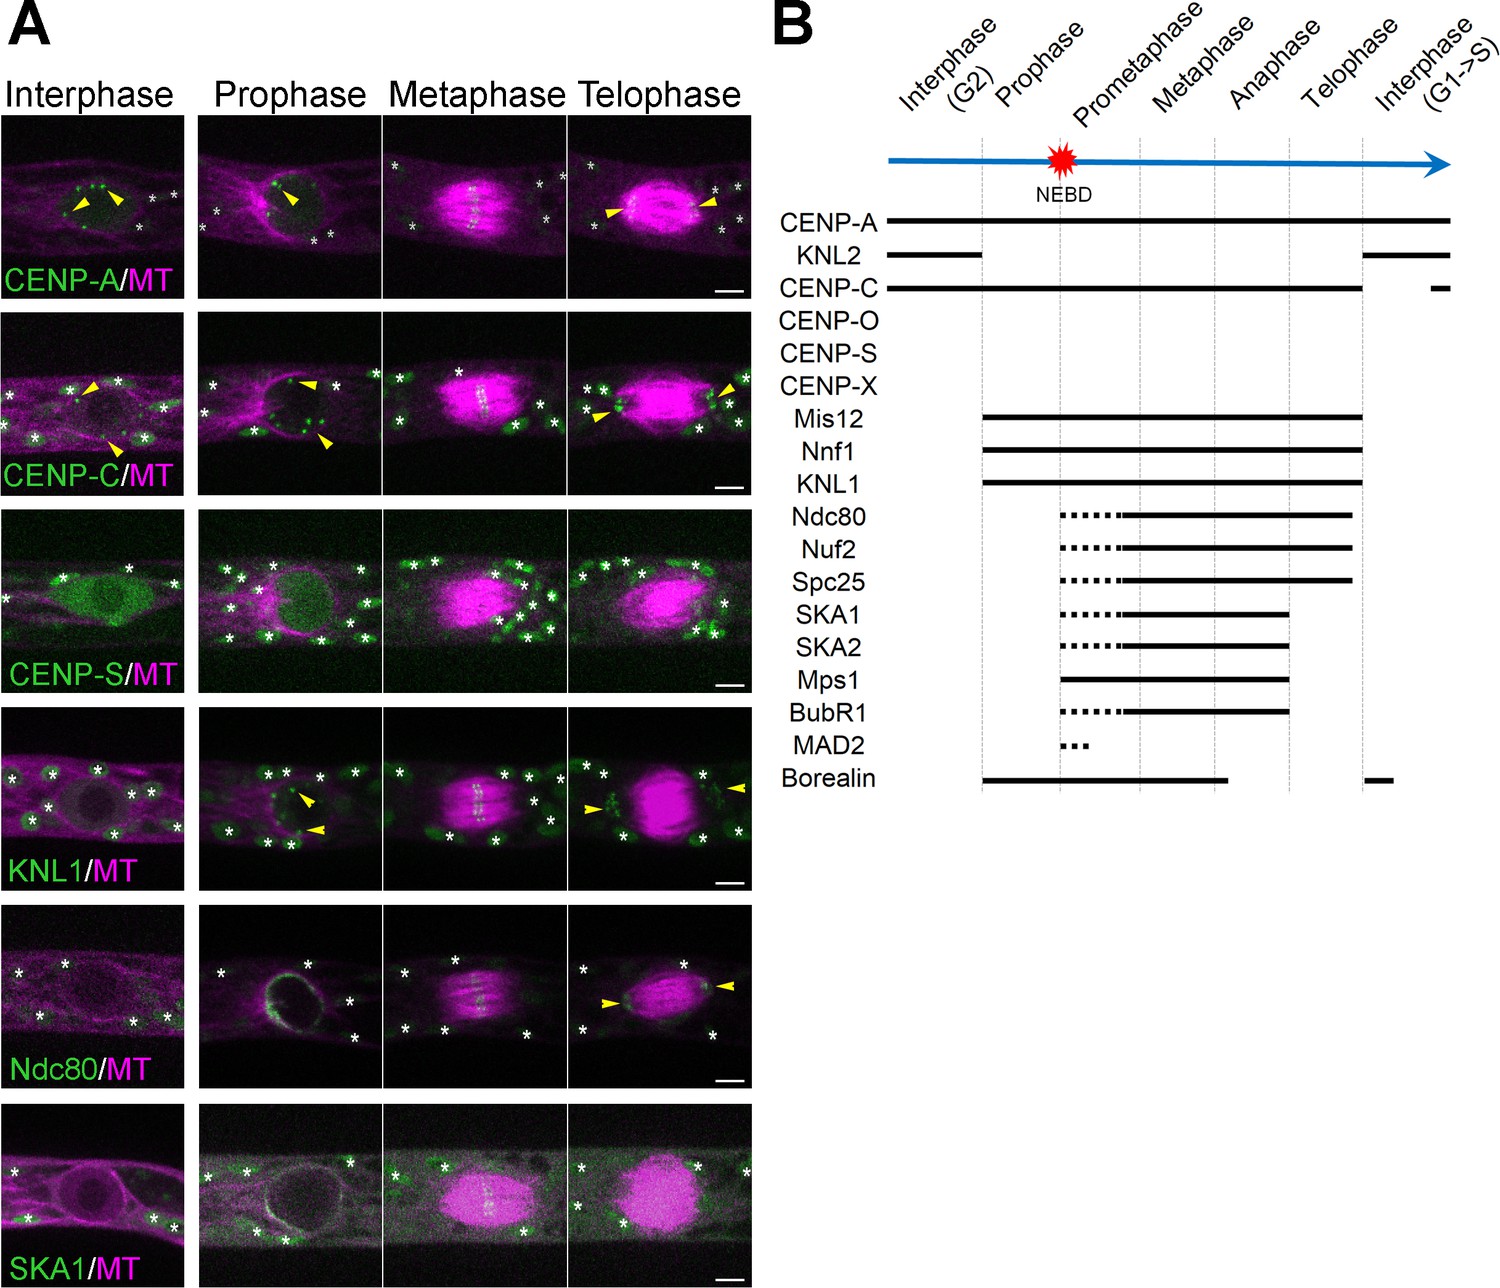
Unconventional localization of kinetochore proteins in P. patens.
(A) Live imaging of P. patens caulonemal apical cells expressing mCherry-tubulin and selected kinetochore proteins: Citrine-CENP-A; Citrine-CENP-C; Citrine-CENP-S; KNL1-Citrine; Ndc80-Citrine and SKA1-Citrine. Full localization data can be found in Supplemental data. Some kinetochore signals are marked with yellow arrowheads, whereas autofluorescent chloroplasts are all marked with white asterisks. Images were acquired at a single focal plane. Bars, 5 µm. See Figure 1—figure supplements 1–7, Videos 1–4. (B) Timeline of centromere/kinetochore localization during the cell cycle in P. patens caulonemal apical cells. Solid lines correspond to the detection of clear kinetochore signals, whereas dotted lines indicate more dispersed signals.
Figure 1—figure supplement 1
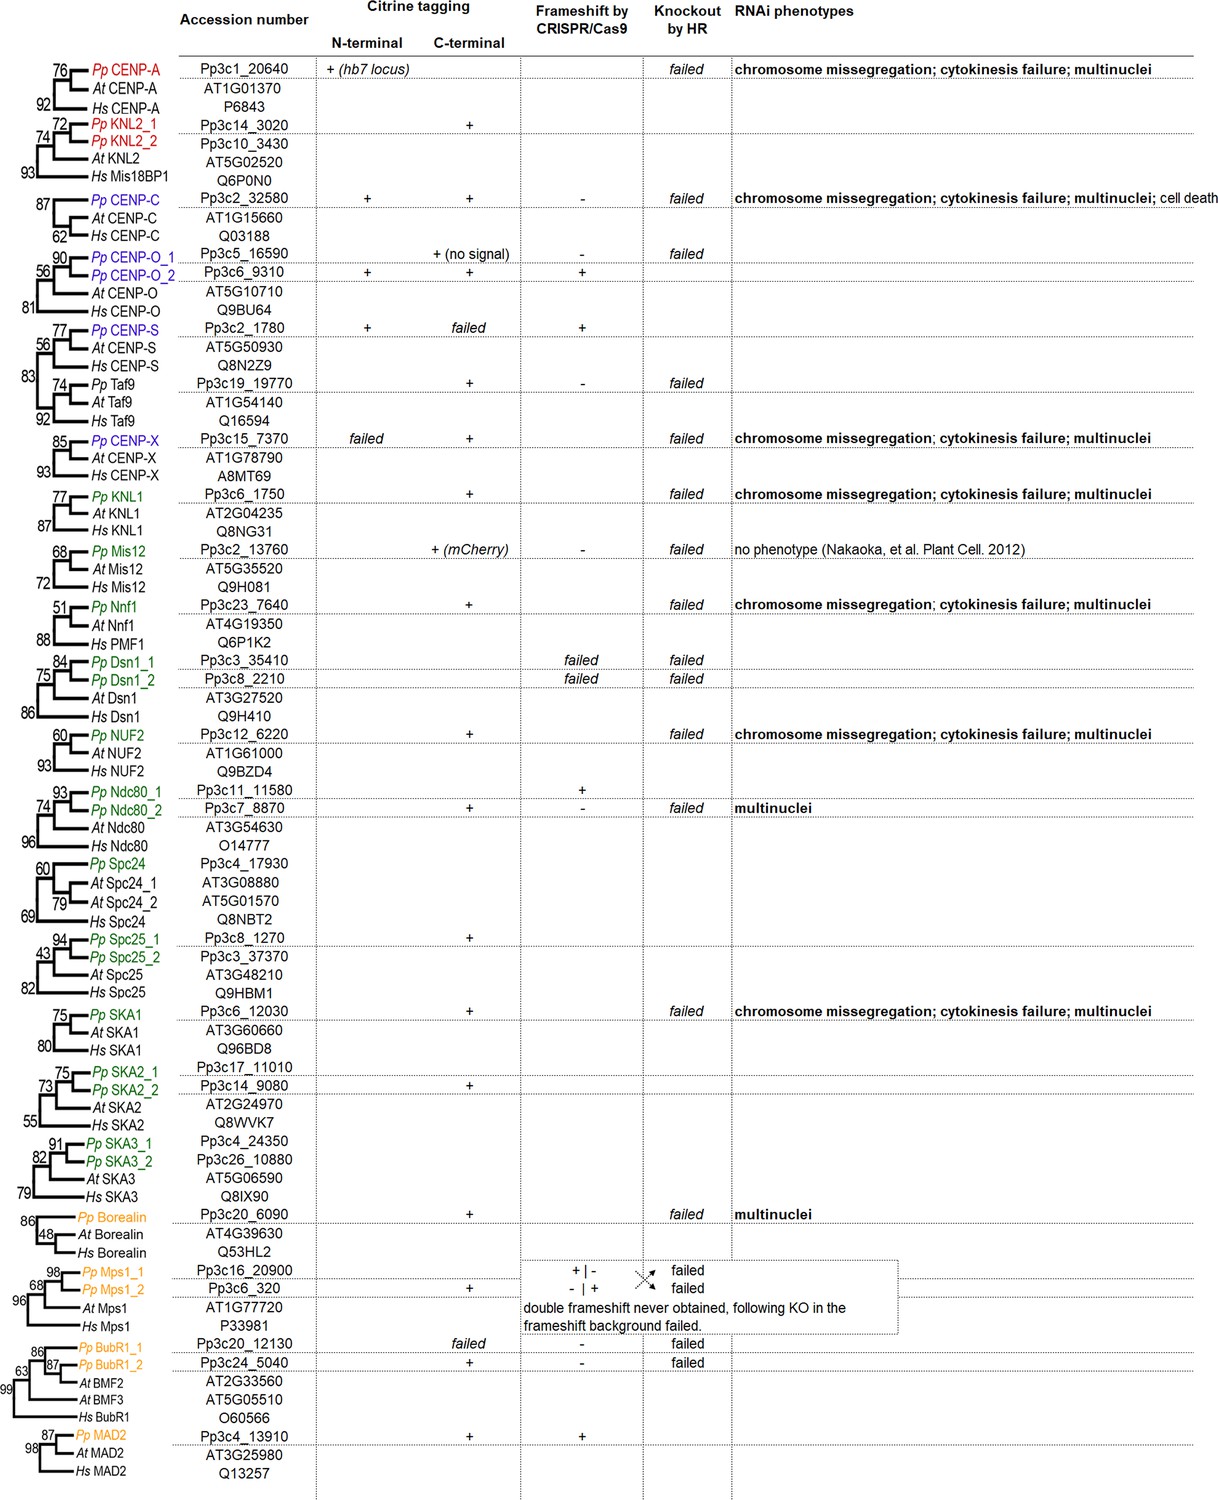
Summary of kinetochore protein tagging and disruption/knockdown in P. patens.
(Left) Maximum-likelihood phylogenetic trees of conserved centromere/kinetochore proteins in Physcomitrella patens, Arabidopsis thaliana and Homo sapiens. Numbers represent bootstrapping values (above 50%) calculated from 1000 replications. Accession numbers for each protein correspond to Phytozome (https://phytozome.jgi.doe.gov/) for P. patens; TAIR (https://www.arabidopsis.org/) for A. thaliana and UniProt (http://www.uniprot.org/) for H. sapiens. (Middle) Summary of Citrine tagging pursued in this study. (Right) Summary of knockout, CRISPR/Cas9 frameshift (‘-' indicates that frameshift mutations could not be obtained) and RNAi experiments pursued in this study. HR stands for homologous recombination. ‘+' indicates successful transgenic line selection.
Figure 1—figure supplement 2
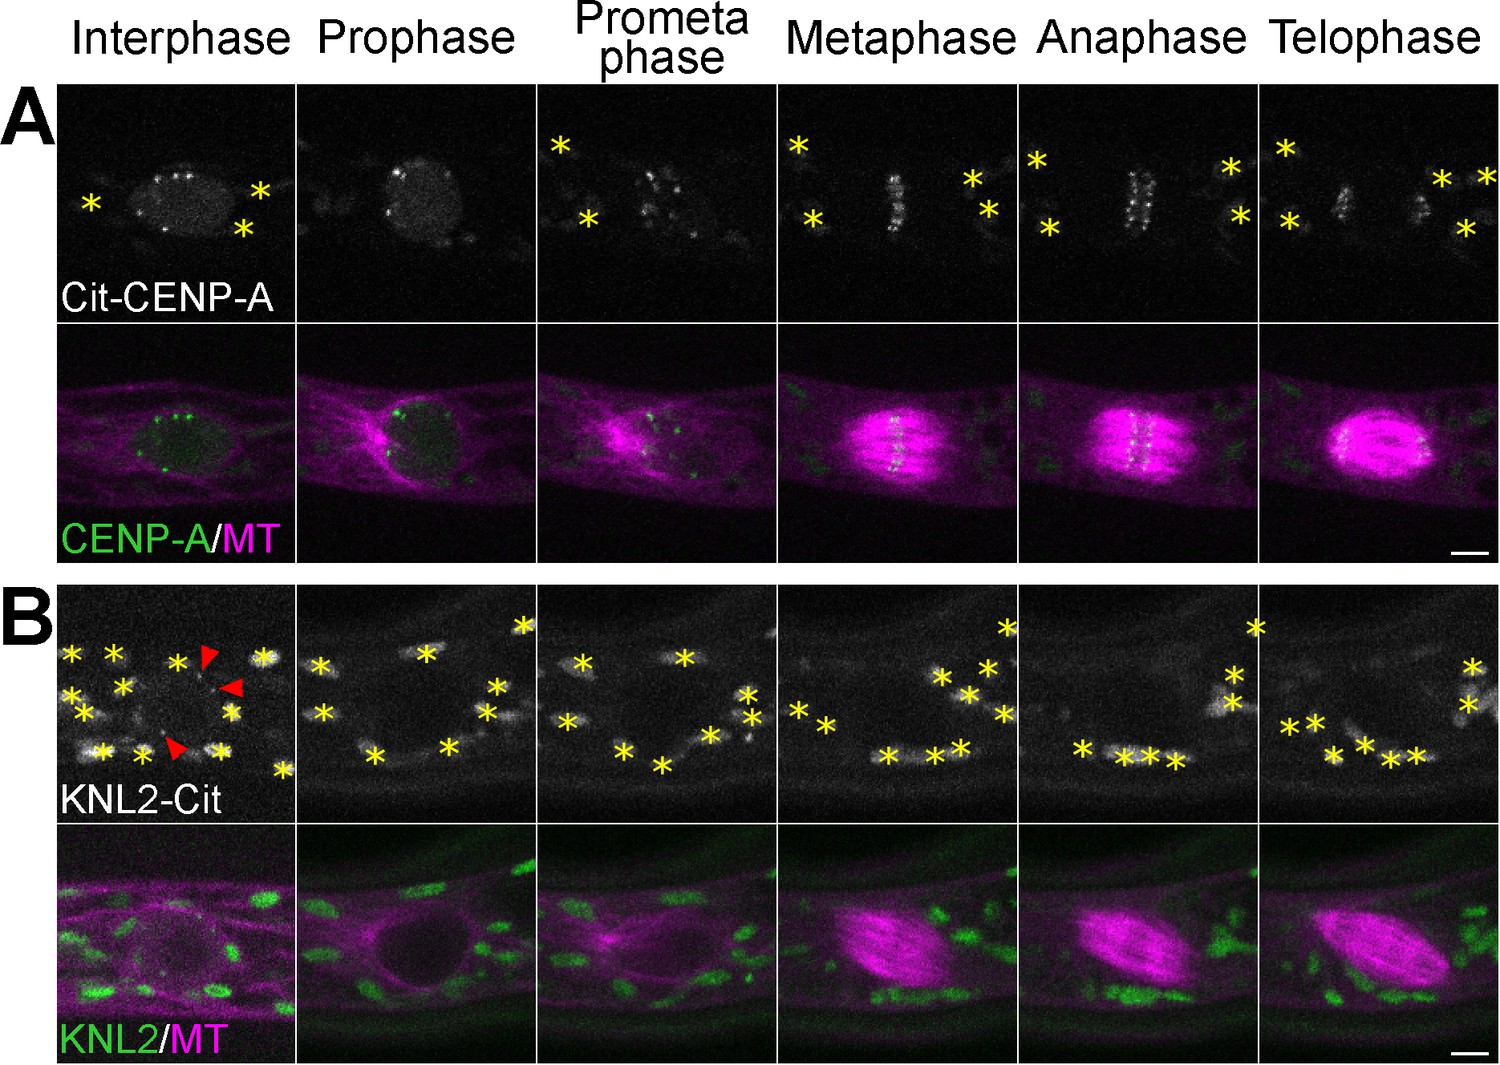
Localization of CENP-A and KNL2/MIS18BP1 during cell division.
Live imaging of P. patens protonemal apical cells expressing mCherry-tubulin (magenta) and Citrine-CENP-A (A) or KNL2-Citrine (B). Citrine-CENP-A data is an expanded version of Figure 1. Autofluorescent chloroplasts are marked with yellow asterisks. Images were obtained at a single focal plane. CENP-A was localized at the centromeric region throughout the cell cycle, whereas KNL2-Citrine was visible only during interphase (red arrowheads). Bars, 5 µm.
Figure 1—figure supplement 3
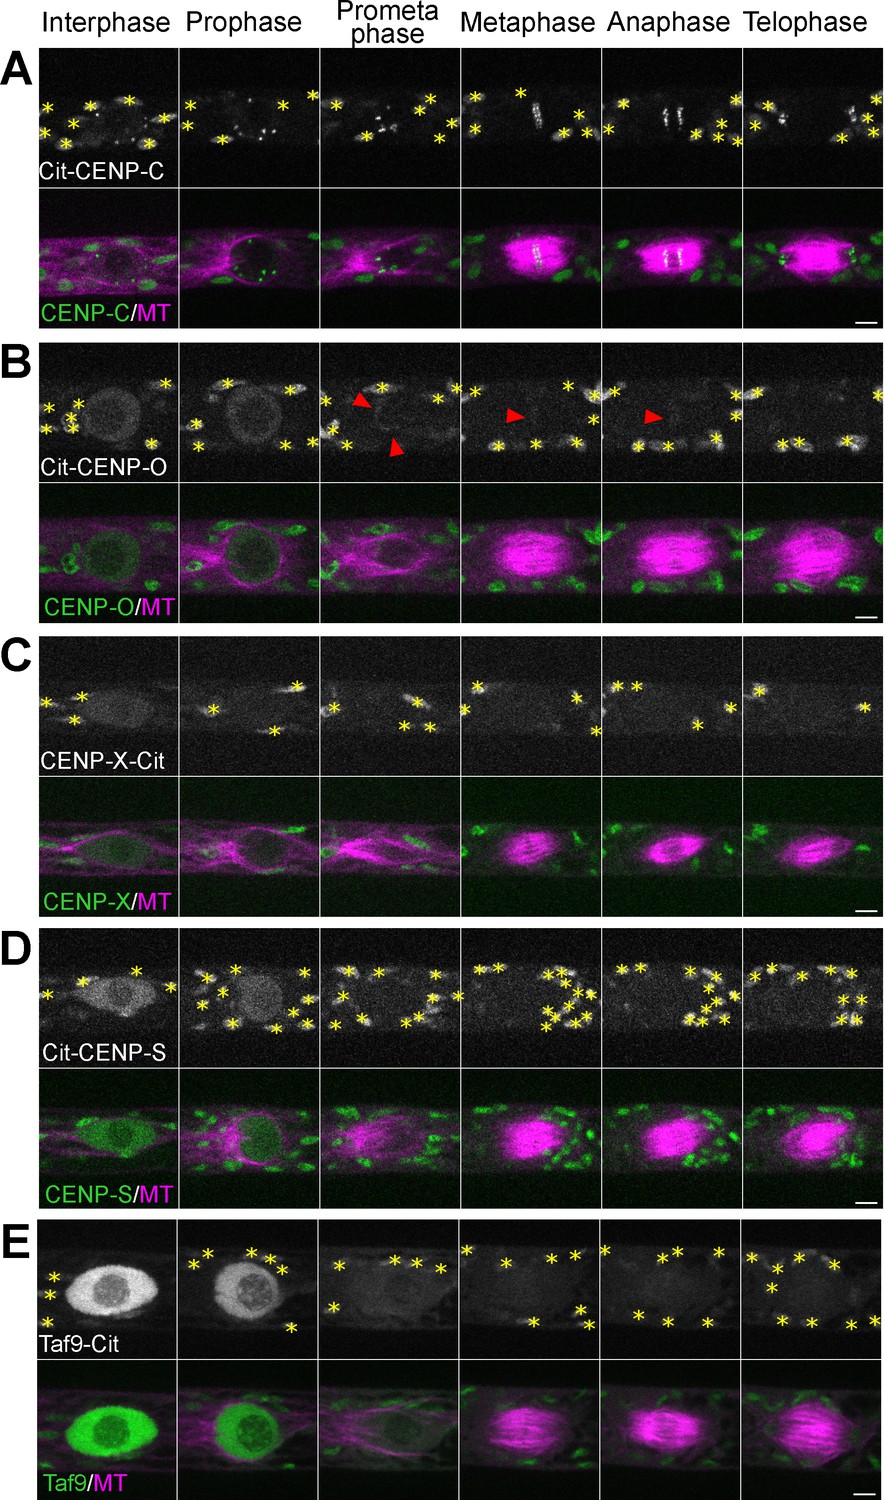
Localization of CCAN proteins during cell division.
Live imaging of P. patens protonemal apical cells expressing mCherry-tubulin (magenta) and Citrine-tagged (green) CENP-C (A), CENP-O (B), CENP-X (C), CENP-S (D) and CENP-S-like protein Taf9 (E). Citrine-CENP-C and Citrine-CENP-S data are expanded versions of Figure 1. Autofluorescent chloroplasts are marked with yellow asterisks. Images were obtained at a single focal plane. CENP-C was localized at the centromere from G2 to telophase, whereas none of the other CCAN proteins showed punctate signals throughout the cell cycle. CENP-O showed weak midzone localization from prometaphase to anaphase (arrowheads). Bars, 5 µm.
Figure 1—figure supplement 4
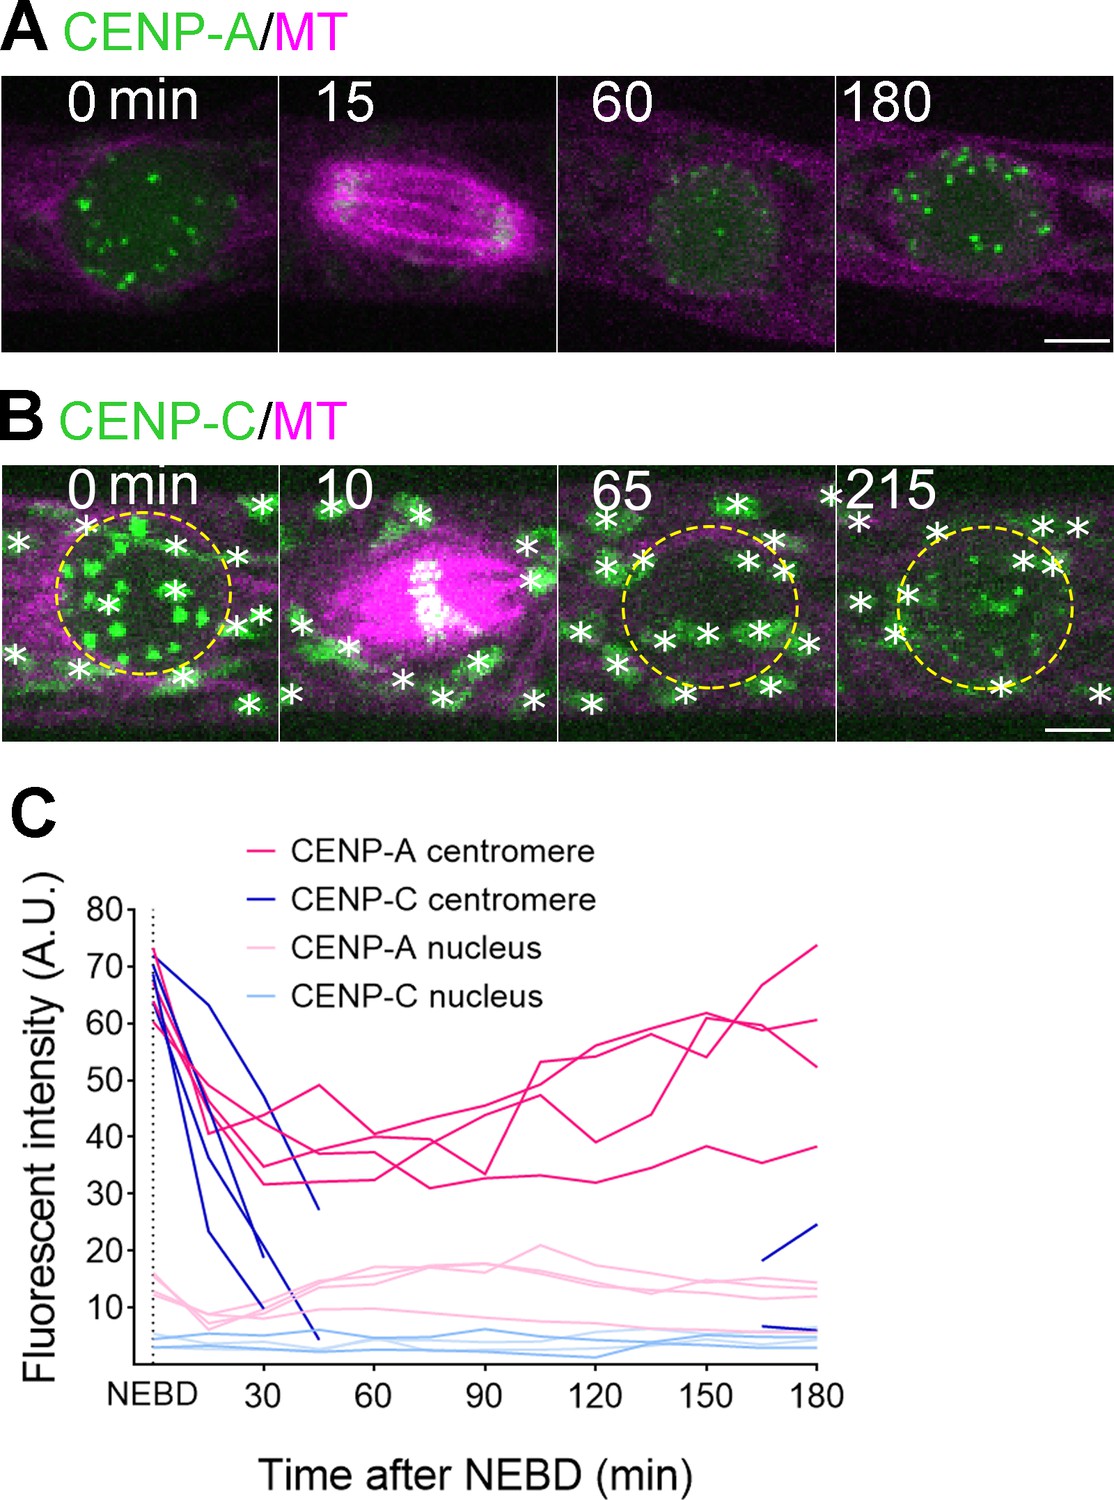
CENP-C is not a constitutive centromeric protein in P. patens.
Citrine-CENP-A (A) and Citrine-CENP-C (B) localization starting from NEBD. At each time point, 10 z-sections were acquired (separated by 1 µm). Merged images of mCherry-tubulin (single focal plane) and a maximum Z-projection of Citrine-CENP-A or -CENP-C are presented. Note that Citrine-CENP-C (B) brightness/contrast were enhanced to confirm no centromeric signals at 65 min. White stars label autofluorescent chloroplasts and yellow dotted lines mark the position of the nucleus. Bars, 5 µm. (C) Relative intensity plot of Citrine signals at the centromeres and at the non-centromeric region in the nucleus (background measurement). Each line represents average relative fluorescent intensity of ≥6 centromeres or ≥6 non-centromeric regions inside the nucleus in a single cell (four cells analyzed for both Citrine-CENP-A and Citrine-CENP-C lines), measured every 15 min from the maximum Z-projection. Note that we could not identify centromeric Citrine-CENP-C signals during ~2 hr after mitotic exit, and therefore, the data are missing from the graph.
Figure 1—figure supplement 5
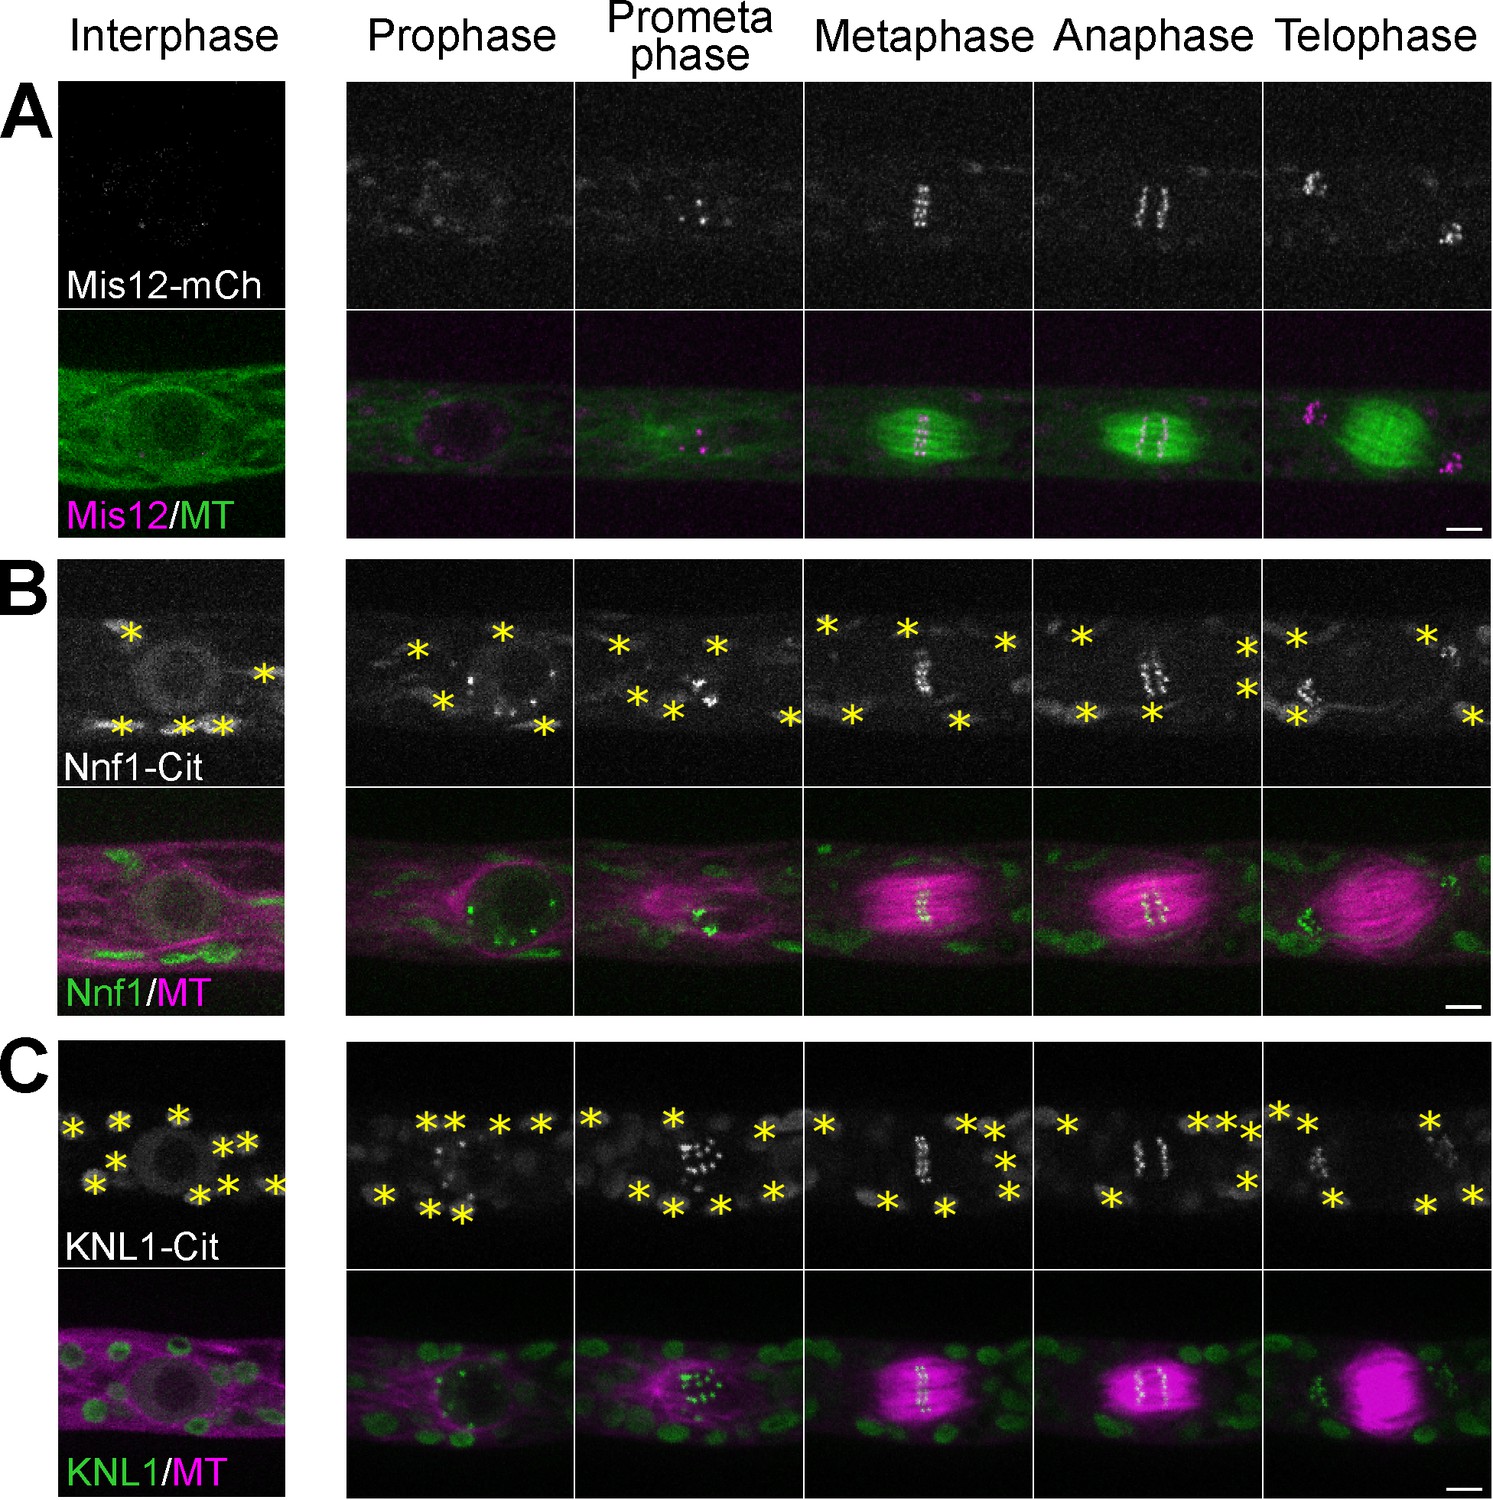
Localization of Mis12, Nnf1 and KNL1 during cell division.
Live imaging of P. patens protonemal apical cells expressing GFP-tubulin and Mis12-mCherry (A) or mCherry-tubulin and Nnf1-Citrine(B) or KNL1-Citrine (C) KNL1-Citrine data is an expanded version of Figure 1. Autofluorescent chloroplasts are marked with yellow asterisks. Images were acquired at a single focal plane. Bars, 5 µm.
Figure 1—figure supplement 6
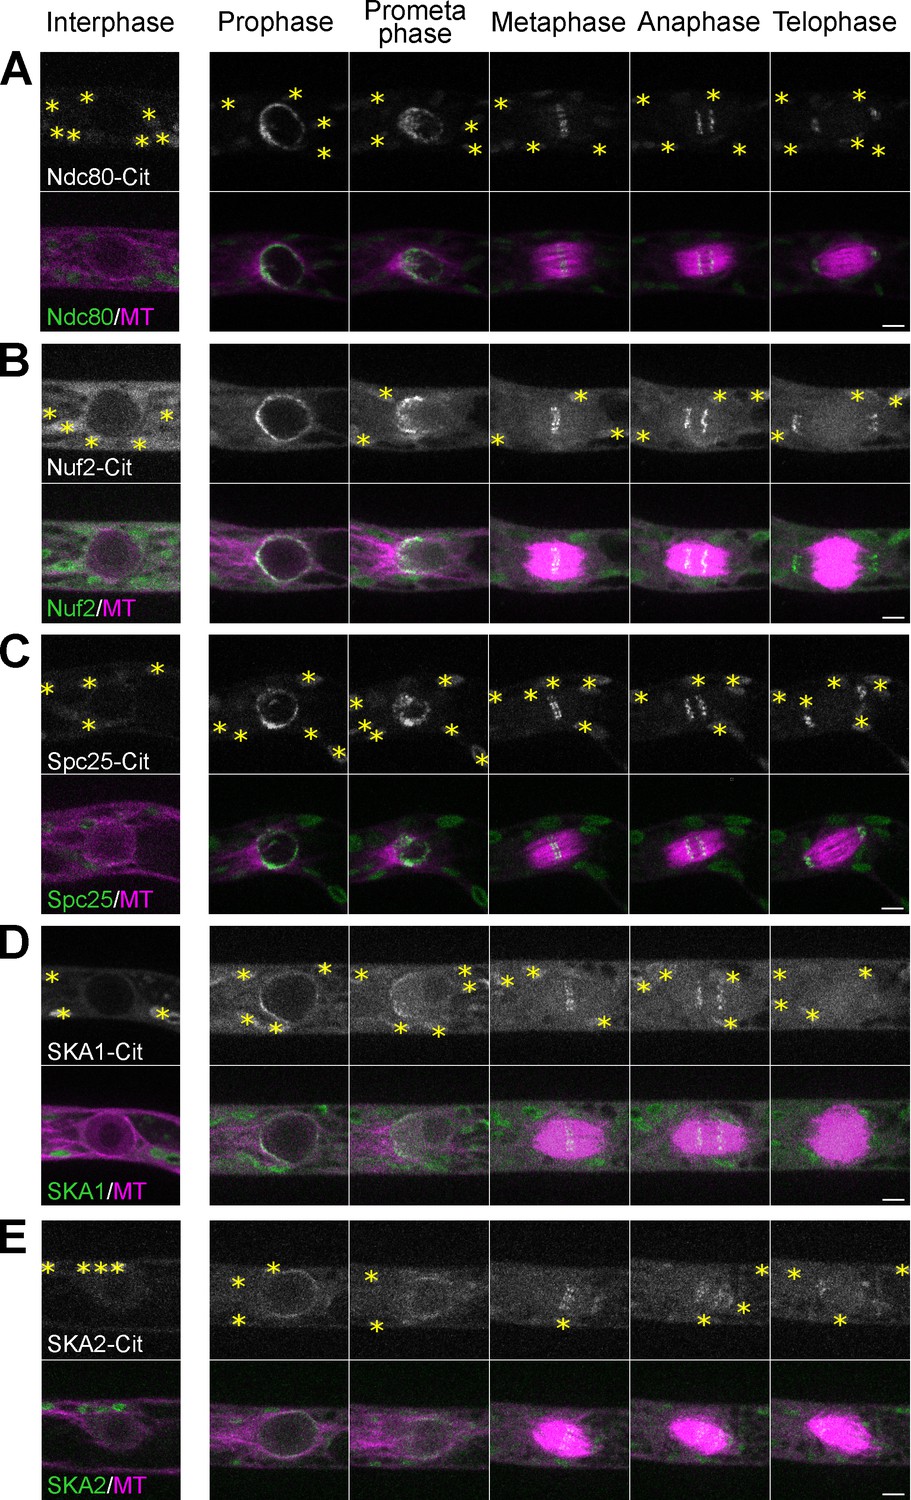
Localization of outer kinetochore proteins during cell division.
Live imaging in P. patens protonemal apical cells expressing mCherry-tubulin (magenta) and Citrine-tagged (green) Ndc80 (A), Nuf2 (B), Spc25 (C), SKA1 (D) and SKA2 (E). Ndc80-Citrine and SKA1-Citrine data are expanded versions of Figure 1. Autofluorescent chloroplasts are marked with yellow asterisks. Images were acquired at a single focal plane. Punctate Citrine signals appeared after prometaphase. Bars, 5 µm.
Figure 1—figure supplement 7
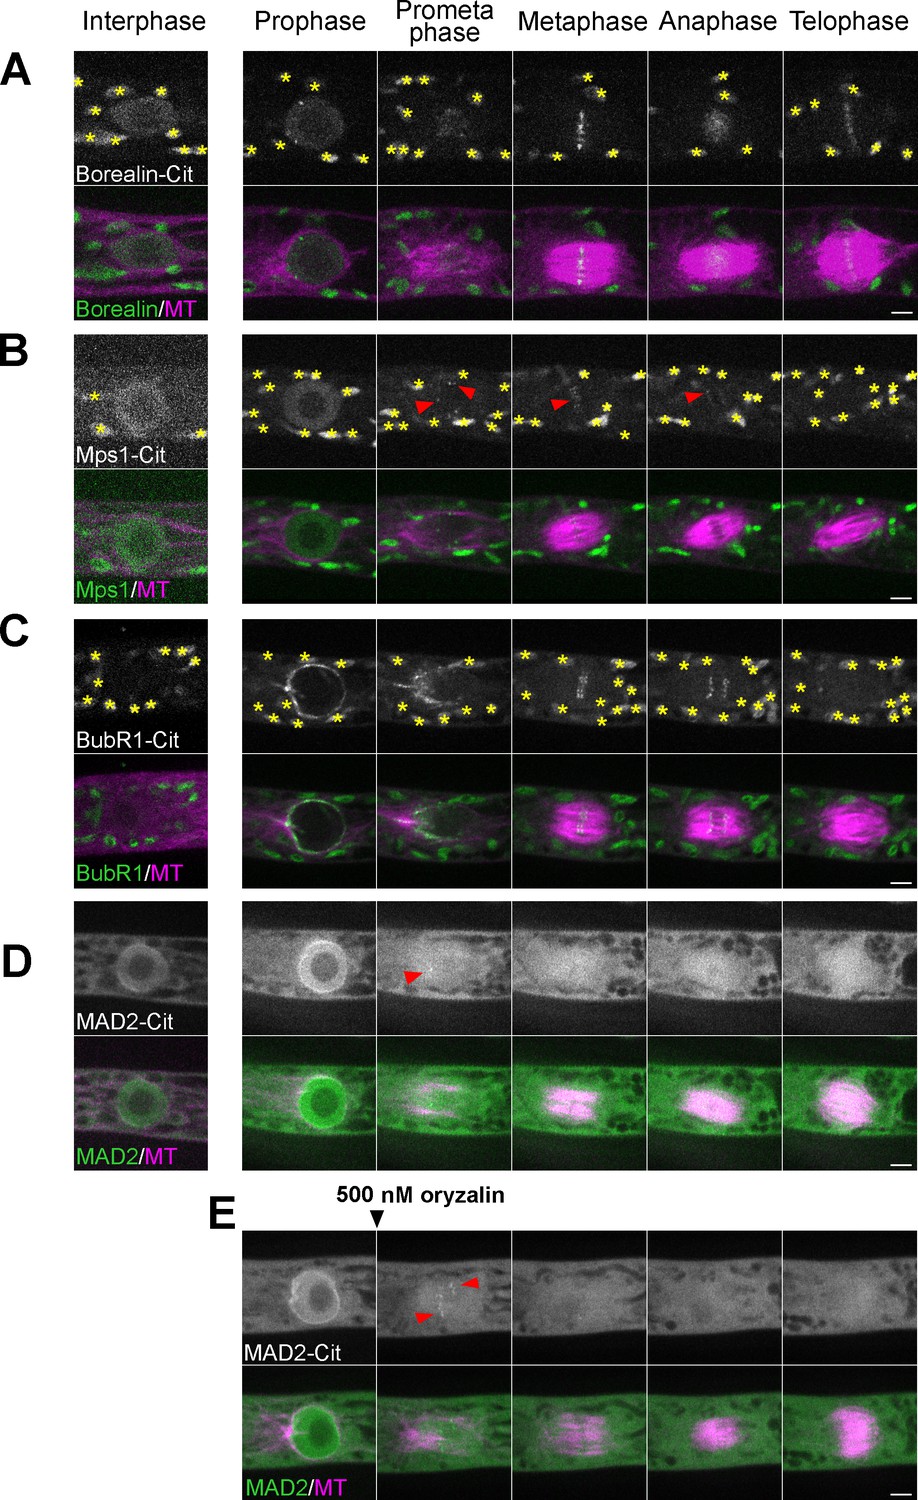
Localization of CPC and SAC proteins during cell division.
Live imaging of P. patens protonemal apical cells expressing mCherry-tubulin (magenta) and Citrine-tagged (green) Borealin (A), Mps1 (B), BubR1(C) and Mad2 (D, E). Red arrowheads indicate punctate signals. Note that kinetochore localization of Mad2 was more clearly observed following addition of the microtubule-depolymerizing drug (500 nM oryzalin) (E). Autofluorescent chloroplasts were marked with yellow asterisks. Images were acquired at a single focal plane. Bars, 5 µm.
Figure 2 with 2 supplements
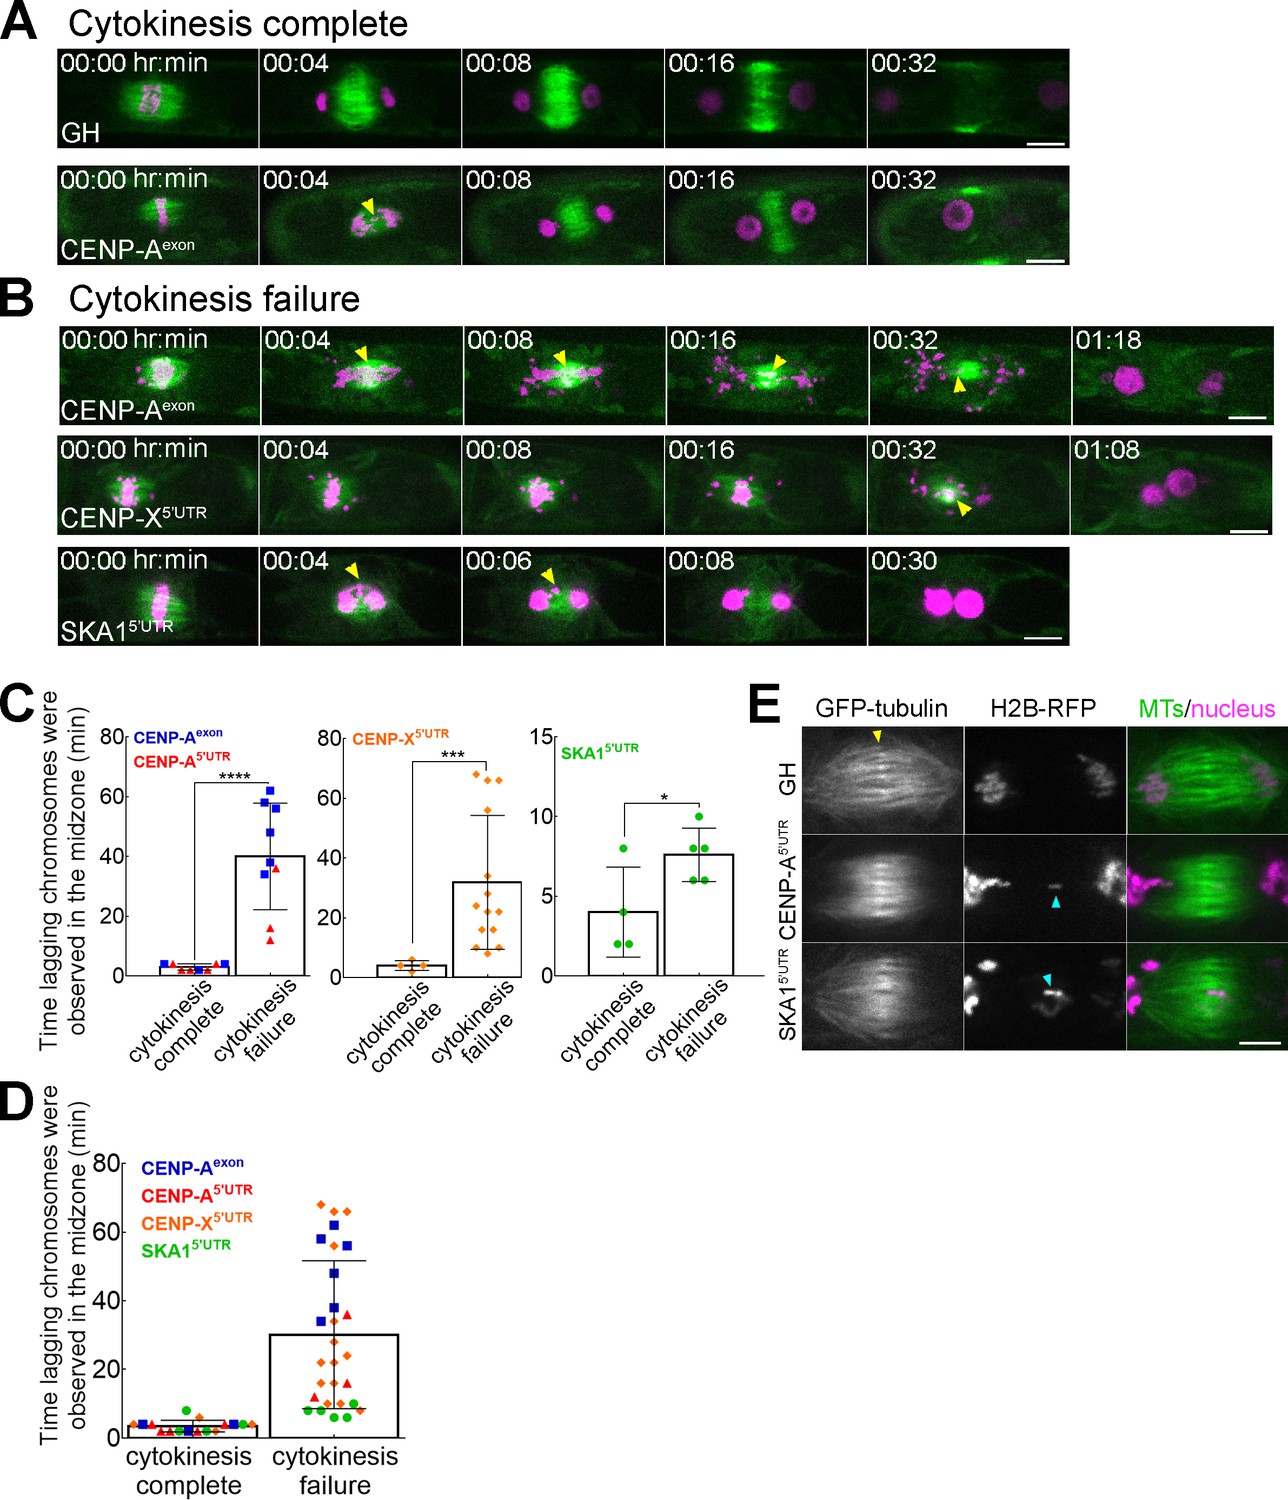
Lagging chromosomes in anaphase induce cytokinesis failure.
(A, B) Lagging chromosomes (yellow arrowheads) present for several minutes in the midzone between separated chromatids cause cytokinesis failure in CENP-A, CENP-X and SKA1 RNAi lines. GH represents a control line. Bars, 10 µm. See Figure 2—figure supplements 1, 2, Videos 5–8. (C, D) Correlation between cytokinesis failure and duration of lagging chromosomes observed in the midzone in the individual RNAi lines (C) and as combined data (D). Asterisks indicate significant differences between two groups (lagging chromosomes observed for short time or for several minutes) for two outcomes: cytokinesis complete and cytokinesis failure, calculated individually for CENP-A; CENP-X and SKA1 RNAi lines (*p=0.0476, ***p=0.0003, ****p<0.0001; Fisher’s test; see Figure 2—source data 1). Each data point corresponds to a single cell. Mean ±SD are presented. (E) Representative images of the microtubule overlap in the phragmoplast in the control line (GH) and in RNAi lines (CENP-A and SKA1) with lagging chromosomes. Note that microtubule overlaps appear more broad and fuzzy in RNAi cells. Yellow arrow indicates microtubule overlaps, whereas cyan arrows point to lagging chromosomes. Images were acquired with z-stacks and a single focal plane that best shows microtubule overlaps is presented. Bar, 5 µm.
-
Figure 2—source data 1
Dataset used for Fisher’s test in Figure 2C.
- https://doi.org/10.7554/eLife.43652.018
Figure 2—figure supplement 1
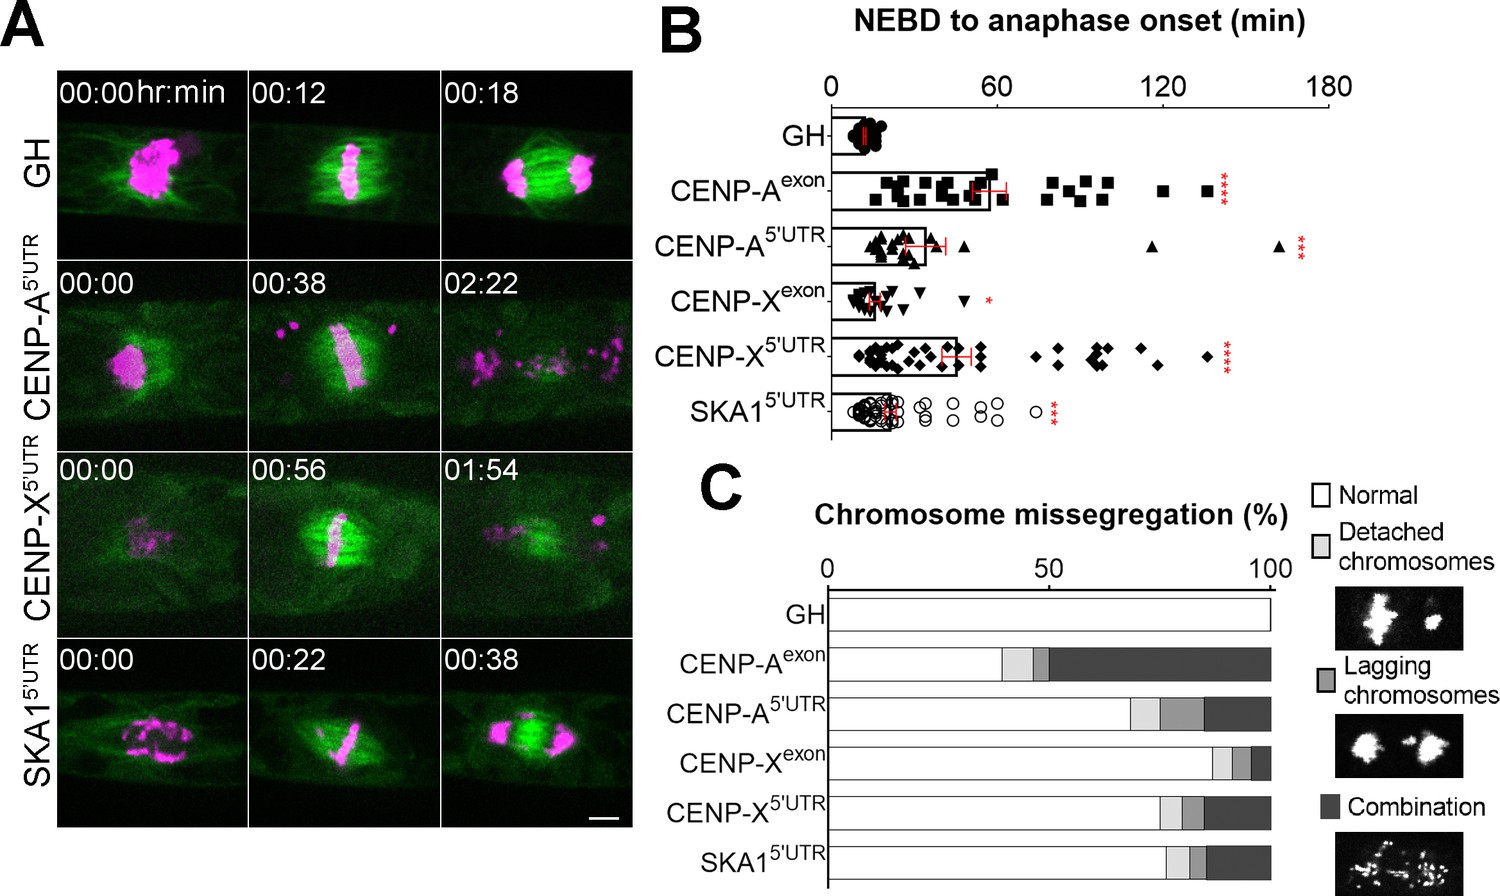
Chromosome segregation defects following depletion of CENP-A, CENP-X or SKA1.
(A) Representative mitotic progression and chromosome missegregation caused by depletion of CENP-A, CENP-X or SKA1. ‘GH’ is the control line. Bar, 5 µm. (B) Duration of mitosis (from NEBD to anaphase onset) was calculated from high-resolution live-cell imaging data for each RNAi line and the control line (GH). Bars indicate mean and SEM, whereas asterisks indicate significant differences compared with the control (*p<0.04, ***p<0.0007, ****p<0.0001; two-tailed t-test). More than 20 cells were analyzed for each line. (C) Frequency of chromosome missegregation in different RNAi lines. Chromosome missegregation defects were classified into three types: chromosomes detached from the metaphase plate (detached chromosomes), lagging chromosomes in anaphase (lagging chromosomes), and their combination. More than 20 cells were analyzed for each line.
Figure 2—figure supplement 2
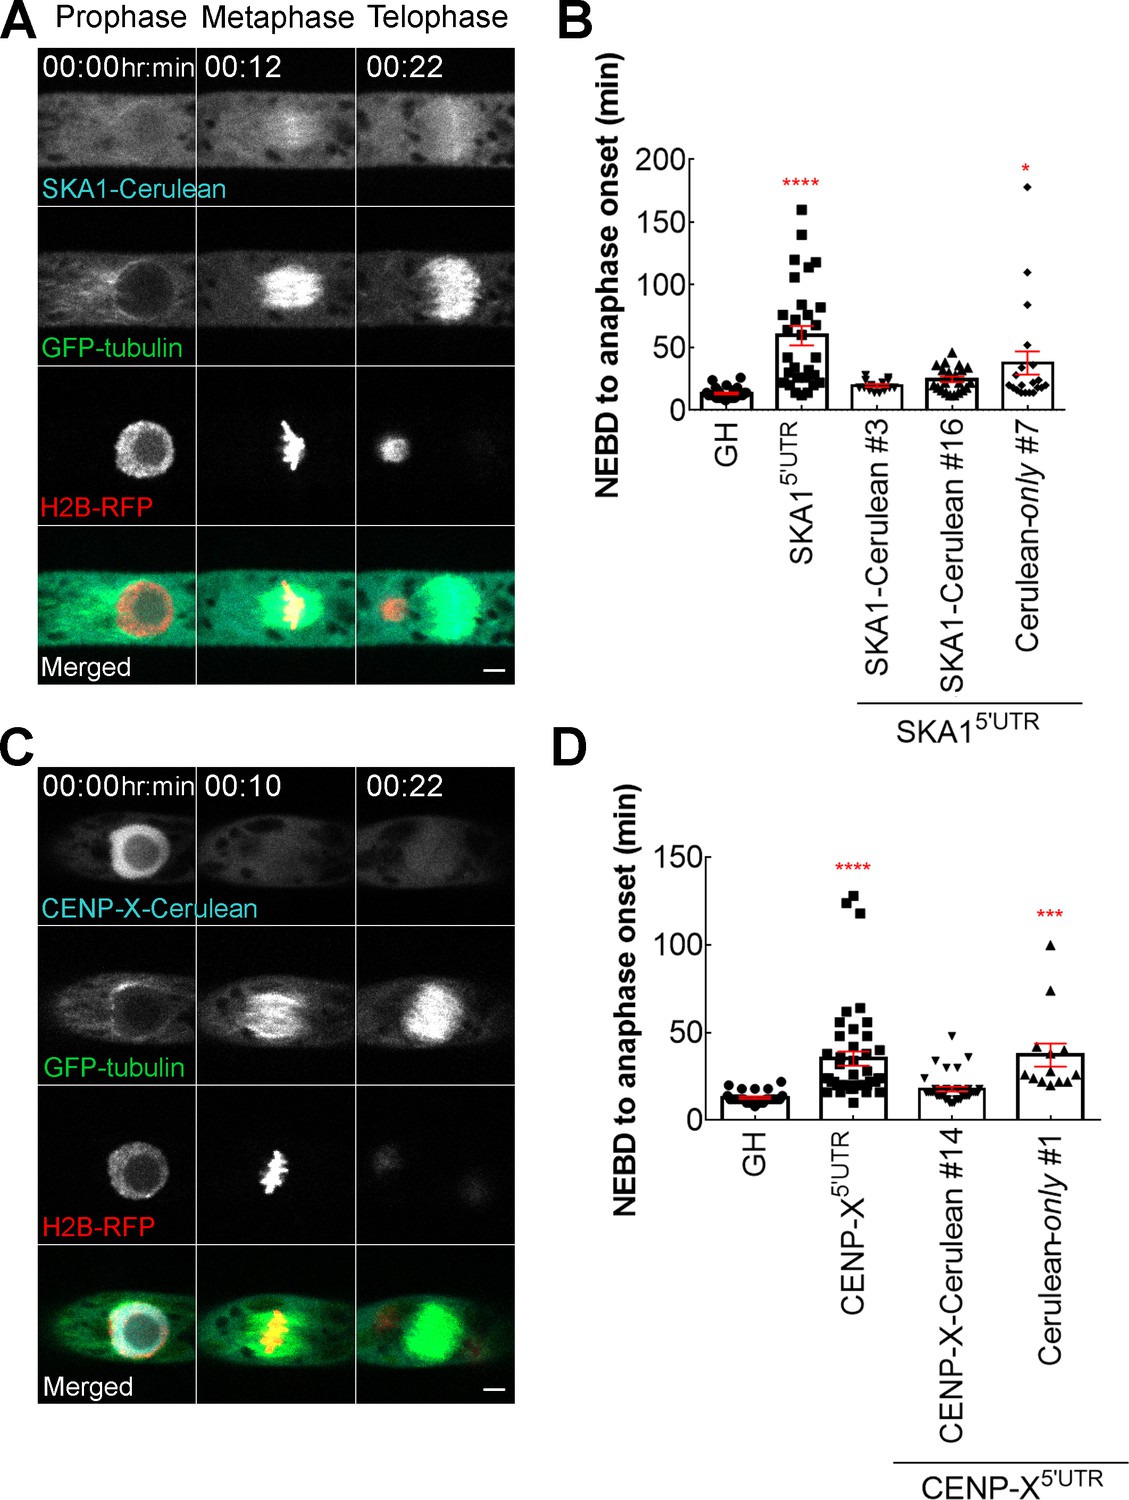
Rescue of RNAi phenotypes by ectopic expression of SKA1-Cerulean or CENP-X-Cerulean.
Live imaging of P. patens protonemal apical cells expressing SKA1-Cerulean (A) or CENP-X-Cerulean (C) in the SKA1 5’UTR RNAi or CENP-X 5’UTR RNAi lines, respectively. RNAi was induced by addition of β-estradiol to the culture medium at the final concentration of 5 µM, 5–6 days prior to observation. Bar, 5 µm. (B, D) Mitotic duration (from NEBD to anaphase onset) for each RNAi line with or without the rescue construct (two independent SKA1 rescue lines [#3, #16] were analyzed). ‘GH’ is the mother line used for RNAi transformation. Bars indicate mean and SEM, whereas asterisks indicate significant differences (*p<0.03, ***p<0.001, ****p<0.0001; one-way ANOVA). More than 10 cells were analyzed for each line.
Figure 3
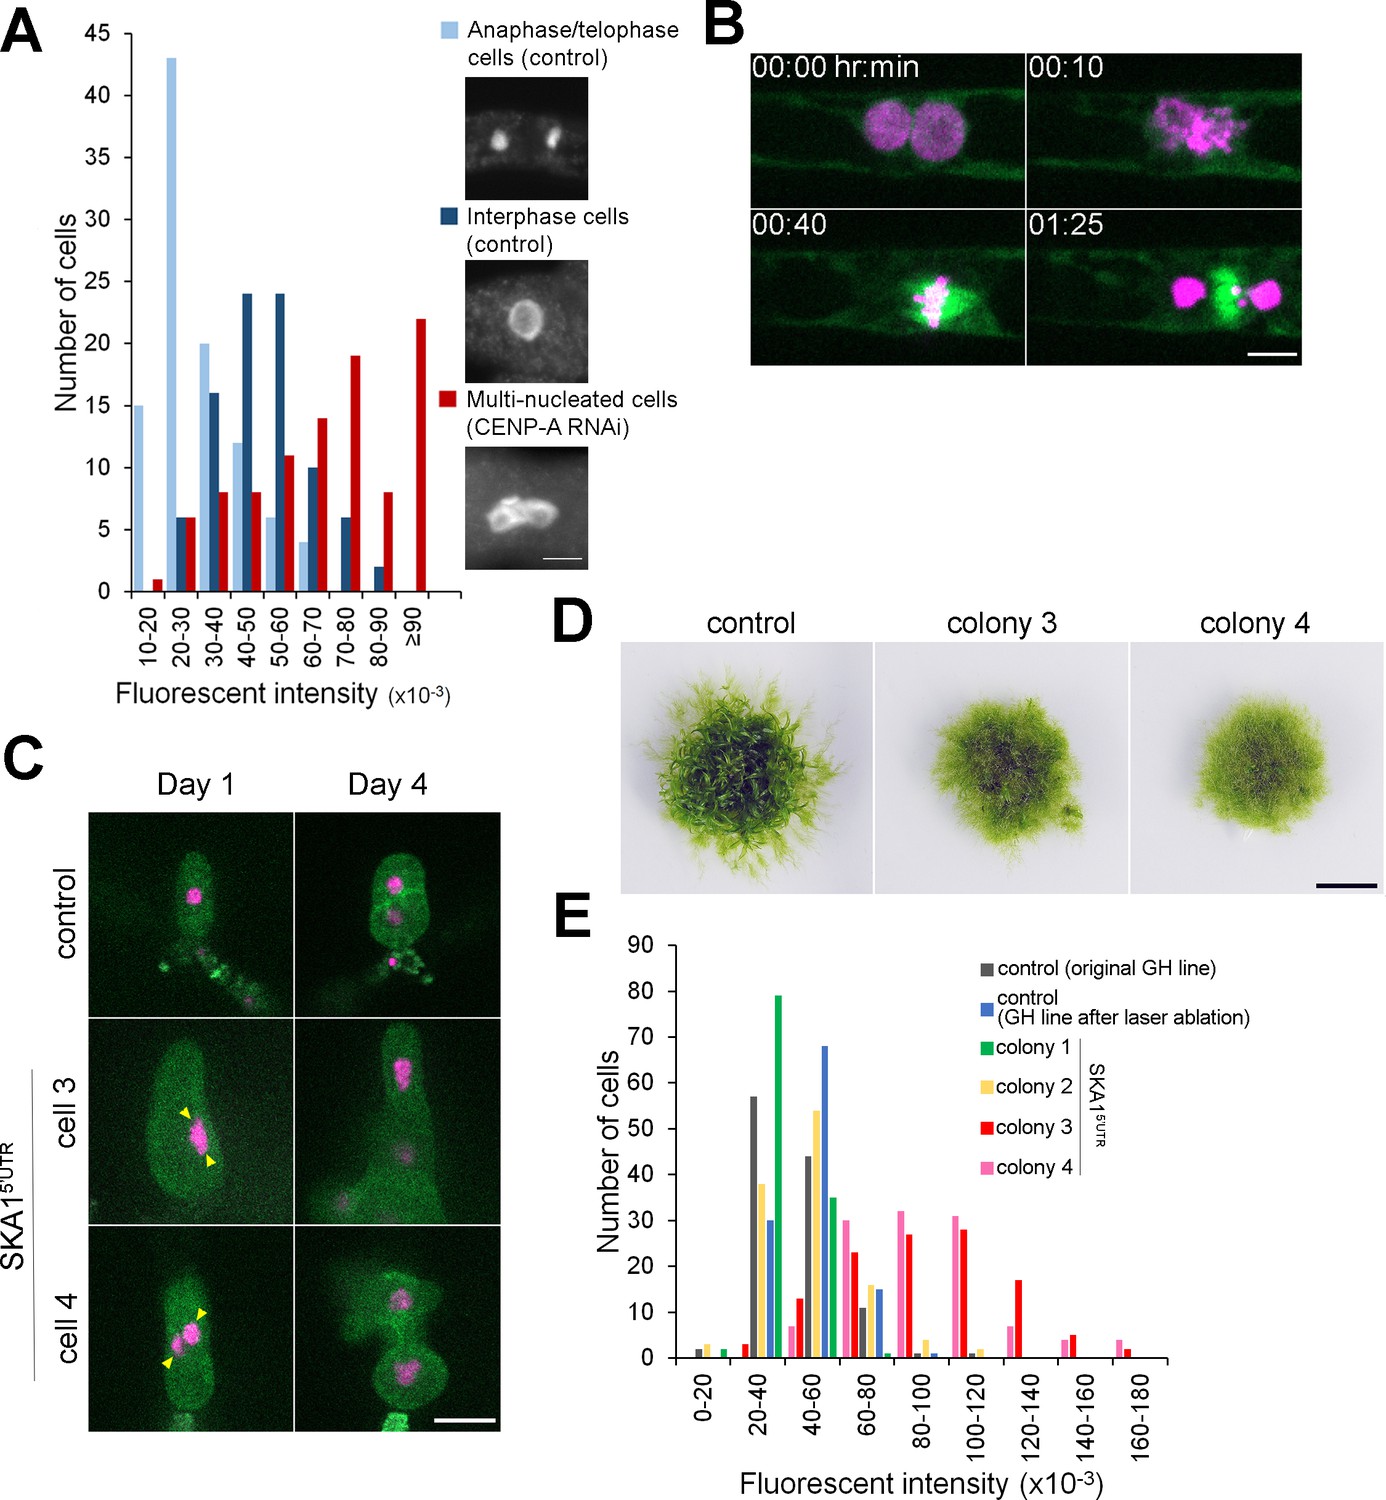
Cytokinesis failure in somatic cells can generate plants with whole-genome duplication.
(A) Quantification of the nuclear DNA content. Anaphase/telophase cells were used as a standard for 1N nuclei (light blue). Interphase cells randomly selected in the control line mostly had double amounts of DNAs as expected (dark blue), whereas cells that failed cytokinesis had higher ploidy (red). DNA amounts are shown as fluorescent intensity of the DAPI-stained nuclei per cell after subtraction of the cytoplasmic background. (B) Representative images of mitotic entry and single spindle formation of the multi-nucleated cell in the P. patens SKA1 RNAi line. Bar, 5 µm. See Video 9. (C) Regeneration of a single cell isolated by laser dissection microscopy from the control cell line (GH) or multi-nucleated cells from SKA1 RNAi line (multi-nuclei are marked with yellow arrowheads). Bar, 50 µm. (D) Moss colonies regenerated from single cells. Bar, 0.5 cm. (E) Quantification of the nuclear DNA content in the interphase nucleus of regenerated moss colonies, corresponding to (C) and (D).
Videos
Video 1
Localization of the centromere and CCAN proteins during cell division.
Live-cell imaging was conducted in P. patens protonemal cells expressing mCherry-tubulin (magenta) and one of the following tagged proteins(green): Citrine-CENP-A, KNL2-Citrine, Citrine-CENP-C, Citrine-CENP-O and Citrine-CENP-S. Note that brightness/contrast of Citrine-CENP-O images have been enhanced. Images are single focal plane and were acquired every 30 s. Bar, 10 µm.
Video 2
Transient disappearance of CENP-C from the kinetochore after cell division.
Live-cell imaging was conducted in P. patens protonemal cells expressing mCherry-tubulin (magenta) and one of the following tagged proteins (green): Citrine-CENP-A, Citrine-CENP-C and KNL2-Citrine. Displayed are the the merged images of a single focal plane for mCherry-tubulin (magenta) and maximum-projection of the Z-stack for Citrine-tagged proteins. Images were acquired every 5 min. Bar, 10 µm.
Video 3
Localization of the C-termini tagged CENP-C and CENP-O.
Live-cell imaging was conducted in P. patens protonemal cells expressing mCherry-tubulin (magenta) and one of the following tagged proteins(green):CENP-C-Citrine and CENP-O-Citrine. Images are single focal plane and were acquired every 30 s. Bar, 10 µm.
Video 4
Localization of the Mis12, KNL1, Nuf2 and SKA1 during cell division.
Live-cell imaging was conducted in P. patens protonemal cells expressing mCherry-tubulin or GFP-tubulin (magenta) and one of the following tagged proteins: Mis12-mCherry, KNL1-Citrine, Nuf2-Citrine and SKA1-Citrine Images were acquired at a single focal plane every 30 s. Bar, 10 µm.
Video 5
Mitotic defects observed in RNAi lines targeting CENP-C, Nnf1, Nuf2 and KNL1.
Representative images of mitotic progression and defects caused by depletion of four kinetochore proteins. White boxes indicate normal cell division in the control line (GH). White arrowheads show position of multinucleated cells, yellow arrowheads indicate chromosome missegregation and cytokinesis failure events, whereas cyan arrowheads show dead cells. RNAi was induced by addition of β-estradiol to the growth medium at the final concentration of 5 µM, 5–6 days prior to observation. Images were acquired at a single focal plane every 3 min. Bar, 100 µm.
Video 6
Chromosome missegregation after RNAi.
Representative images of mitotic progression and chromosome missegregation caused by depletion of CENP-A or CENP-X or SKA1. RNAi was induced by addition of β-estradiol to the growth medium at final concentration of 5 µM, 5–6 days prior to observation. Images were acquired at a single focal plane every 2 min. Bar, 10 µm.
Video 7
Cytokinesis defect associated with lagging chromosomes in anaphase.
Representative images of correlation between lagging chromosomes and cytokinesis defect in CENP-A exon RNAi and SKA1 5’UTR RNAi lines. Note that minor lagging chromosomes observed in the midzone for ≤4 min did not affect cytokinesis (upper rows); however, lagging chromosomes persistent for ≥6 min resulted in cytokinesis failure (bottom rows). This correlation is conserved in both CENP-A exon RNAi and SKA1 5’UTR RNAi lines. Cytokinesis failure was concluded when the nucleus moved without restraint of the cell plate. RNAi was induced by addition of β-estradiol to the growth medium at final concentration of 5 µM, 5–6 days prior to observation. Images were acquired at a single focal plane every 2 min. Bar, 10 µm.
Video 8
Visualization of the cell plate formation using FM4-64 dye.
Representative images of cytokinesis in the control GH line (upper row), SKA1 5’UTR RNAi line with minor lagging chromosomes (middle row), and with persistent lagging chromosomes (bottom row). Cell plate formation was visualized with 25 µM endocytic FM4-64 dye added during metaphase. FM4-64 dye was prone to photobleaching, and therefore was sometimes supplied multiple times during long-term imaging (bottom row). Images were acquired at a single focal plane every 2 min. Bar, 10 µm.
Video 9
Mitotic entry of the multi-nucleated cell in P. patens.
SKA1 5’UTR RNAi was induced by addition of β-estradiol to the growth medium at final concentration of 5 µM, 5–6 days prior to observation. Multi-nucleated cells resulting from cytokinesis failure were monitored with the spinning-disk confocal microscope. Images were acquired at a single focal plane every 5 min. Bar, 10 µm.
Additional files
-
Supplementary file 1
Physcomitrella patens transgenic lines generated in this study.
- https://doi.org/10.7554/eLife.43652.025
-
Supplementary file 2
Plasmids and primers used in this study.
- https://doi.org/10.7554/eLife.43652.026
-
Supplementary file 3
Protein alignments used for the phylogeny analysis.
- https://doi.org/10.7554/eLife.43652.027
-
Transparent reporting form
- https://doi.org/10.7554/eLife.43652.028
Download links
A two-part list of links to download the article, or parts of the article, in various formats.
Downloads (link to download the article as PDF)
Open citations (links to open the citations from this article in various online reference manager services)
Cite this article (links to download the citations from this article in formats compatible with various reference manager tools)
Kinetochore protein depletion underlies cytokinesis failure and somatic polyploidization in the moss Physcomitrella patens
eLife 8:e43652.
https://doi.org/10.7554/eLife.43652


