Amplification of a broad transcriptional program by a common factor triggers the meiotic cell cycle in mice
- Whitehead Institute, United States
- Massachusetts Institute of Technology, United States
- Howard Hughes Medical Institute, Whitehead Institute, United States
Figures
Figure 1 with 2 supplements
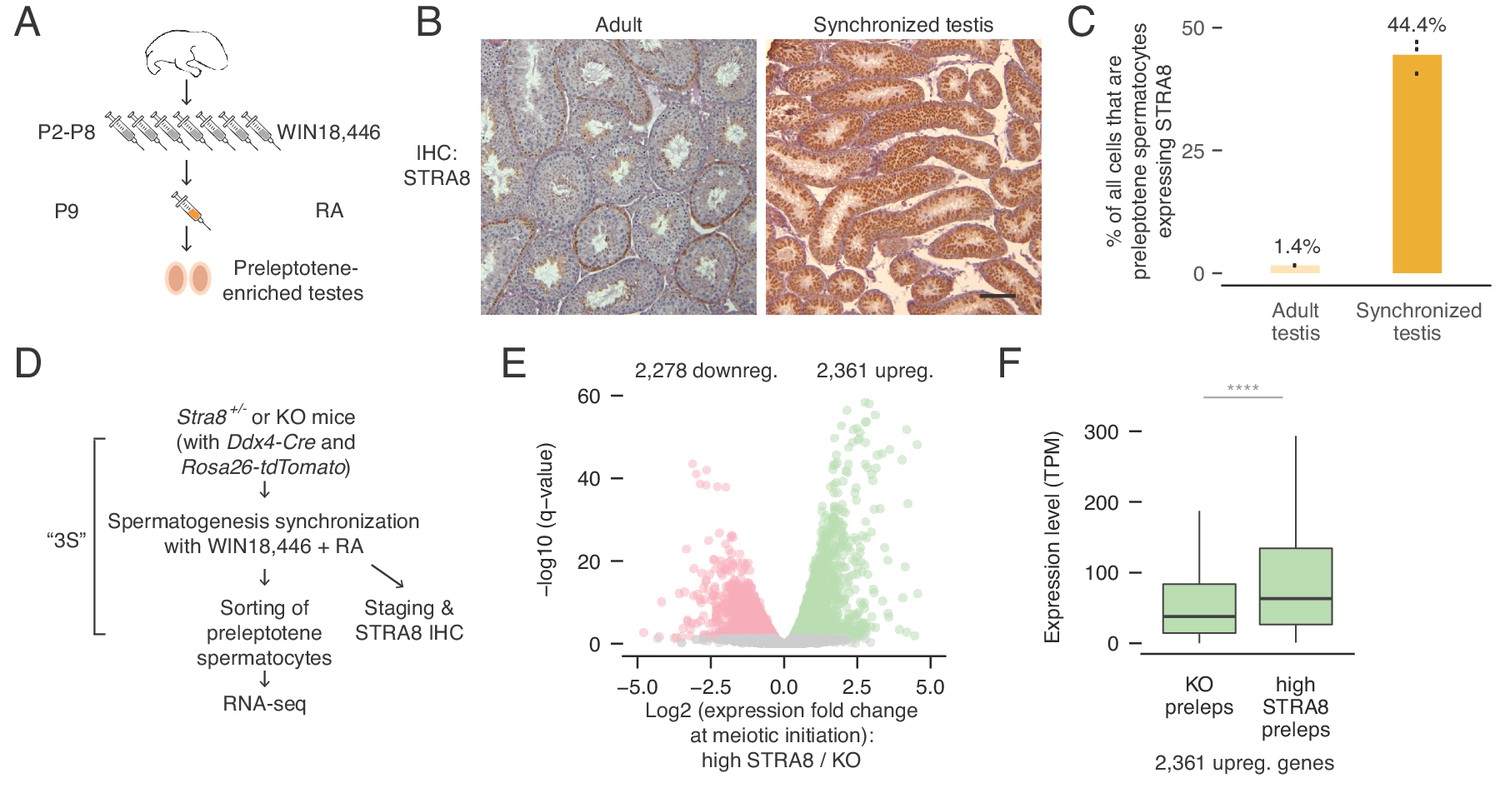
Transcriptional changes in the preleptotene stage population at meiotic initiation.
(A) Schematic for synchronization of spermatogenesis by WIN18,446 and retinoic acid (RA) to enrich for preleptotene cells. (B) STRA8 immunohistochemistry (IHC) of an unperturbed adult testis, left, and a synchronized and staged (2S) testis, right. The synchronized testis is highly enriched for meiosis-initiating preleptotene spermatocytes that express STRA8. Scale bar = 100 μm. (C) Percent of all cells that are STRA8-expressing preleptotene cells, in adult testes or in 2S testes. Synchronization results in a 31-fold increase in the proportion of these cells. (D) Schematic for collection of pure preleptotene populations by synchronization, staging, and sorting (3S) for RNA-seq. Germ-cell lineage tracing allows for sorting of pure preleptotene populations from Stra8+/- or Stra8-deficient ('KO’) testes. See Figure 1—figure supplement 1 for cell sorting schematic. (E) Transcriptional changes associated with meiotic initiation. Volcano plot represents gene expression changes between Stra8+/- preleptotene cells with high levels of STRA8 (high STRA8) and Stra8 KO preleptotene cells. Genes that are significantly (FDR < 0.05) downregulated or upregulated at meiotic initiation are in pink or green, respectively. Shown are 12,545 genes expressed in at least one preleptotene sample at transcripts per million (TPM) level ≥ 1. (F) Expression levels of genes upregulated at meiotic initiation, in KO and high-STRA8 preleptotene cells. Boxplots show sample medians and interquartile ranges (IQRs), with whiskers extending no more than 1.5 × IQR and outliers suppressed. ****p<2.2×10⁻¹⁶, one-tailed Mann-Whitney U test. See Figure 1—source data 1.
-
Figure 1—source data 1
Source data for RNA-seq analyses.
- https://doi.org/10.7554/eLife.43738.005
Figure 1—figure supplement 1
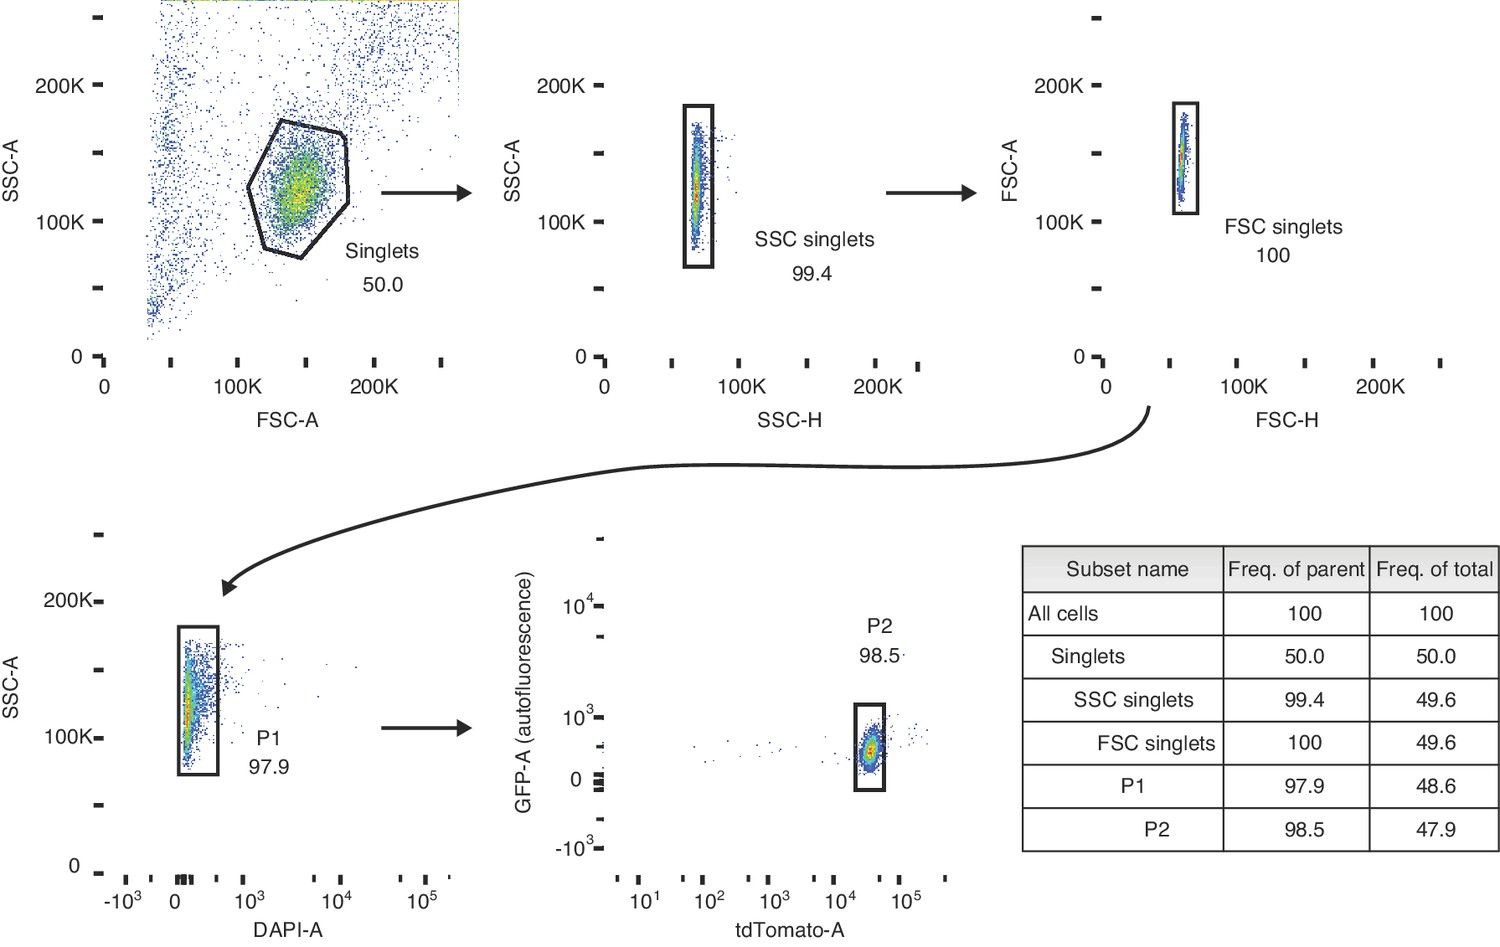
Gating strategy for sorting preleptotene cells.
Schematic depicting the sorting strategy used in the 3S (synchronization, staging, and sorting) method. Preleptotene spermatocyes are sorted from preleptotene-enriched 2S testes. P1 represents the live cell fraction, and P2 represents the preleptotene cell population that is collected for RNA-seq.
Figure 1—figure supplement 2
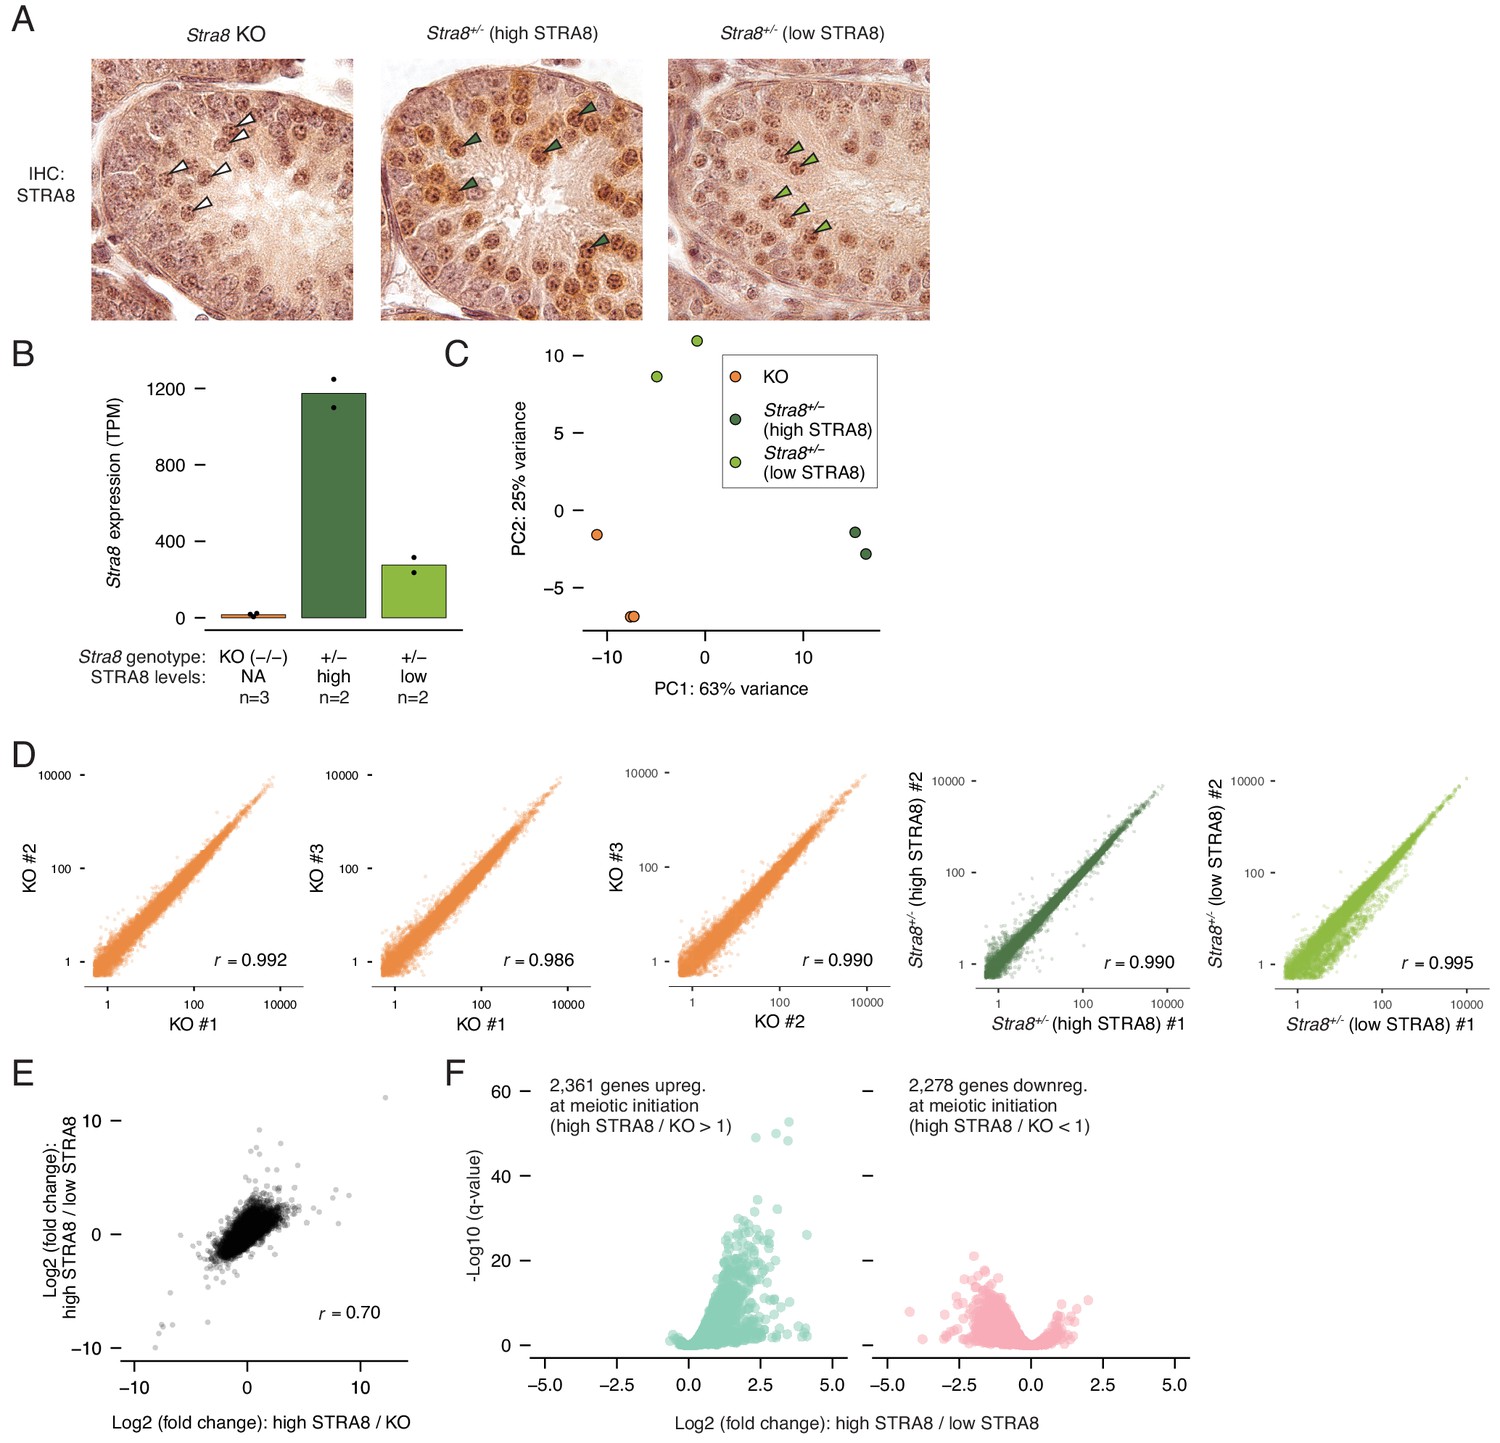
RNA-seq analysis to identify transcriptional changes at meiotic initiation.
(A) Staging of testis samples from which sorted ‘3S’ preleptotene cells were isolated for RNA-seq. IHC for STRA8 (antibody ab49405) reveals synchronized Stra8+/- testes with ‘high’ and ‘low’ (almost indistinguishable from background staining) levels of STRA8. Shown are tubule cross sections. Select preleptotene cells are labeled with arrowheads: white, Stra8-deficient; dark green, high STRA8; light green, low STRA8. (B) Stra8 expression levels (TPM) in individual RNA-seq samples from sorted Stra8 KO (n = 3), high-STRA8 (n = 2), or low-STRA8 (n = 2) preleptotene cells. Horizontal bars represent the mean level per sample type, and dots indicate values in individual replicates. (C) Principal component analysis of the RNA-seq data. The first two components are shown. (D) Correlations between biological replicates of expression values (TPM) for all protein-coding genes. Pearson’s correlation coefficients are shown. (E) Correlation between gene expression changes between high-STRA8 and Stra8 KO preleptotene cells and expression changes between Stra8+/- preleptotene spermatocytes with high or low levels of STRA8. Pearson’s correlation coefficient is shown. (F) Volcano plot showing gene expression differences between preleptotene cells with high or low STRA8 expression. Shown are the genes that are significantly up or downregulated at meiotic initiation between high-STRA8 and KO preleptotene cells (see Figure 1E).
Figure 2 with 4 supplements
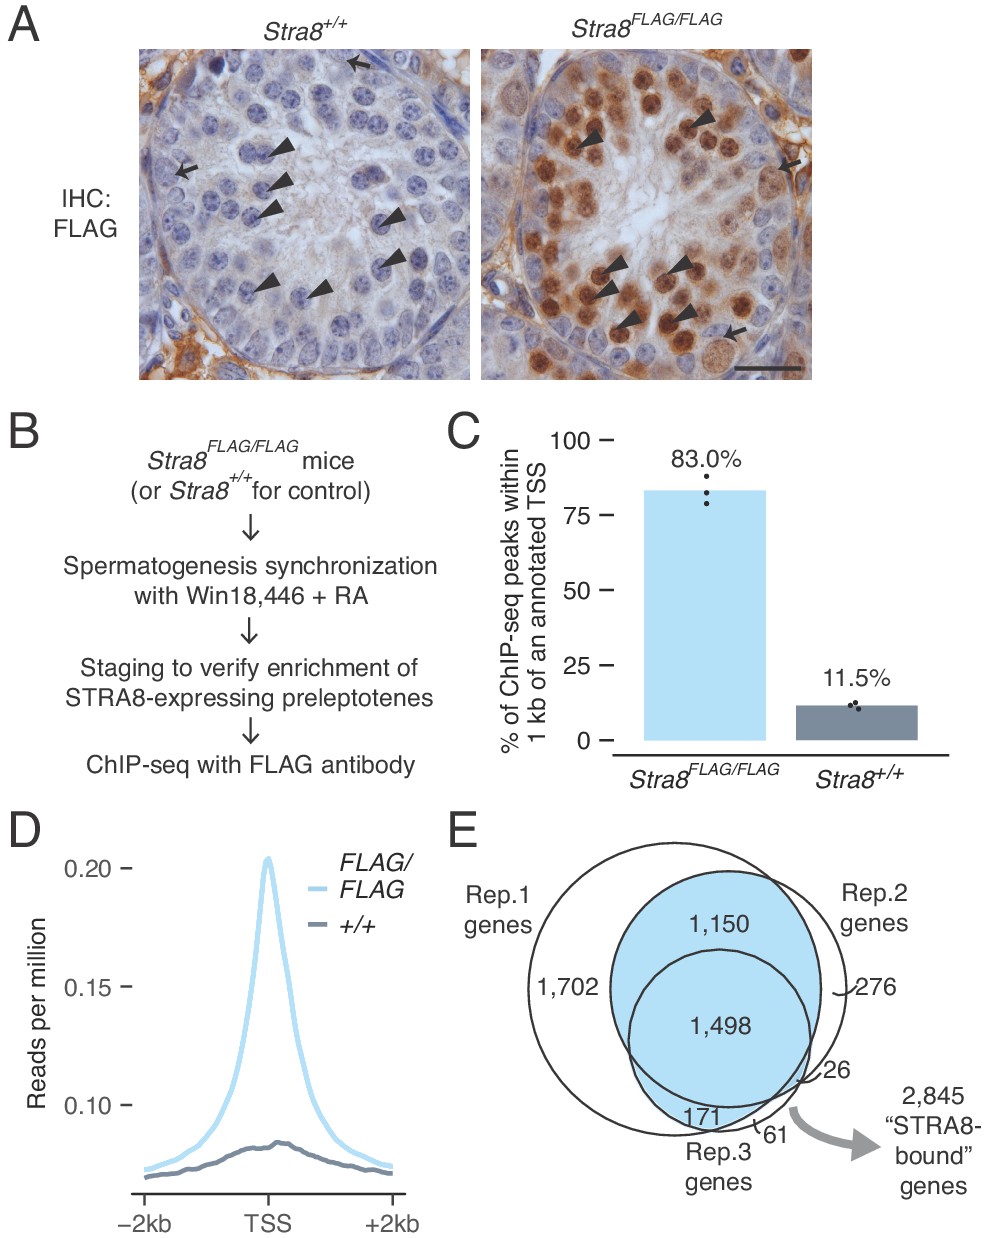
Identification of genes bound at meiotic initiation by STRA8.
(A) FLAG IHC of preleptotene-enriched tubules in wild-type or Stra8FLAG/FLAG 2S testes. Preleptotene germ cells are marked by arrowheads, and spermatogonia by arrows. Scale bar = 20 μm. (B) Schematic for STRA8 ChIP-seq experiments using preleptotene-enriched testes. (C) Percent of ChIP-seq peaks at protein-coding gene promoters, defined as the window within 1 kb of annotated transcription start sites (TSS). Bar heights represent the average of three replicates, and dots indicate values in individual replicates. For comparison, 2.3% of the mouse genome lies within these regions. See also Figure 2—figure supplement 4. (D) Average Stra8FLAG/FLAG and Stra8+/+ ChIP seq profiles over the TSS of genes. Sequencing reads were pooled from three ChIP replicates. See Figure 2—figure supplement 4 for profiles of individual replicates. (E) Overlap of promoter-bound genes identified in Stra8FLAG/FLAG ChIP-seq replicates. Genes identified in at least two of the three replicates are considered ‘STRA8-bound genes’. See Figure 2—source data 1.
-
Figure 2—source data 1
Source data for STRA8 binding at promoters.
- https://doi.org/10.7554/eLife.43738.011
Figure 2—figure supplement 1
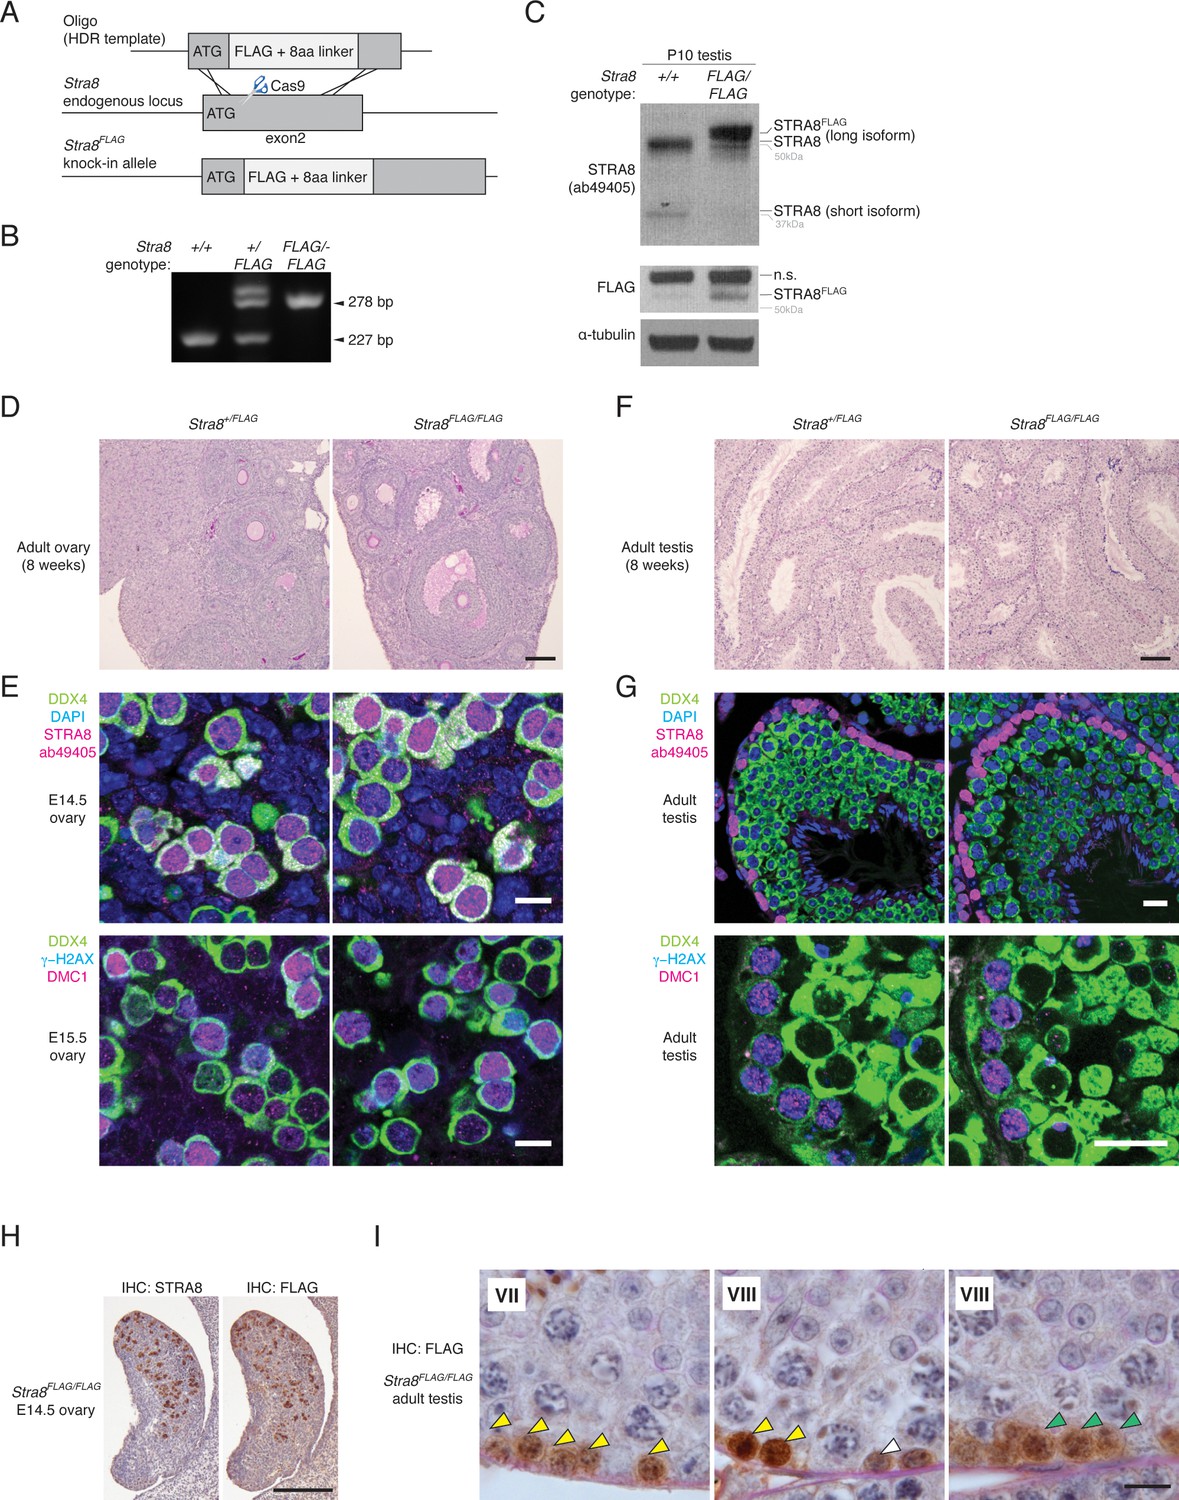
Generation and characterization of the Stra8FLAG knock-in mouse.
(A) Schematic for generation of the Stra8FLAG allele. The FLAG sequence was inserted directly after the ATG in exon 2. (B) PCR genotyping for the Stra8FLAG allele. (C) Western blot showing STRA8 (ab49405) and FLAG signal in protein lysates prepared from P10 wild-type and Stra8FLAG/FLAG testes. α-tubulin was used as a loading control. The long STRA8 isoform, which is required for meiosis (see Figure 2—figure supplement 2), is tagged by FLAG. Stra8FLAG/FLAG testes show reduced expression of the shorter STRA8 isoform, perhaps due to splicing changes caused by the FLAG insertion close to the start of exon 2. (D) Hematoxylin and periodic acid-Schiff (He/PAS)-stained sections from an 8 week Stra8+/FLAG ovary, left, and a Stra8FLAG/FLAG ovary, right. Scale bar = 100 μm. (E) Immunofluorescence (IF) staining for meiotic markers in E14.5 and E15.5 ovaries. Germ cells (marked by DDX4/VASA) in both Stra8+/FLAG (left) and Stra8FLAG/FLAG (right) ovaries express STRA8 and initiate meiosis; they show robust DMC1 and γ-H2AX staining. Scale bar = 10 μm. (F) He/PAS-stained testes from 8 week Stra8+/FLAG and Stra8FLAG/FLAG testes. Scale bar = 100 μm. (G) IF for meiotic markers in Stra8+/FLAG and Stra8FLAG/FLAG adult testes. In both genotypes, germ cells (marked by DDX4) initiate meiosis; they show STRA8, DMC1, and γ-H2AX staining. Scale bar = 20 μm. (H) IHC for STRA8 and FLAG, with hematoxylin counterstaining, of consecutive serial sections from an E14.5 Stra8FLAG/FLAG fetal ovary. Scale bar = 200 μm. (I) FLAG IHC of the adult Stra8FLAG/FLAG testis, with He/PAS counterstaining. Roman numerals indicate the seminiferous tubule stage. STRA8FLAG is robustly expressed in preleptotene stage spermatocytes (yellow arrowheads) and in leptotene stage spermatocytes (green arrowheads). STRA8FLAG is also expressed in spermatogonia (white arrowheads). Scale bar = 10 μm.
Figure 2—figure supplement 2
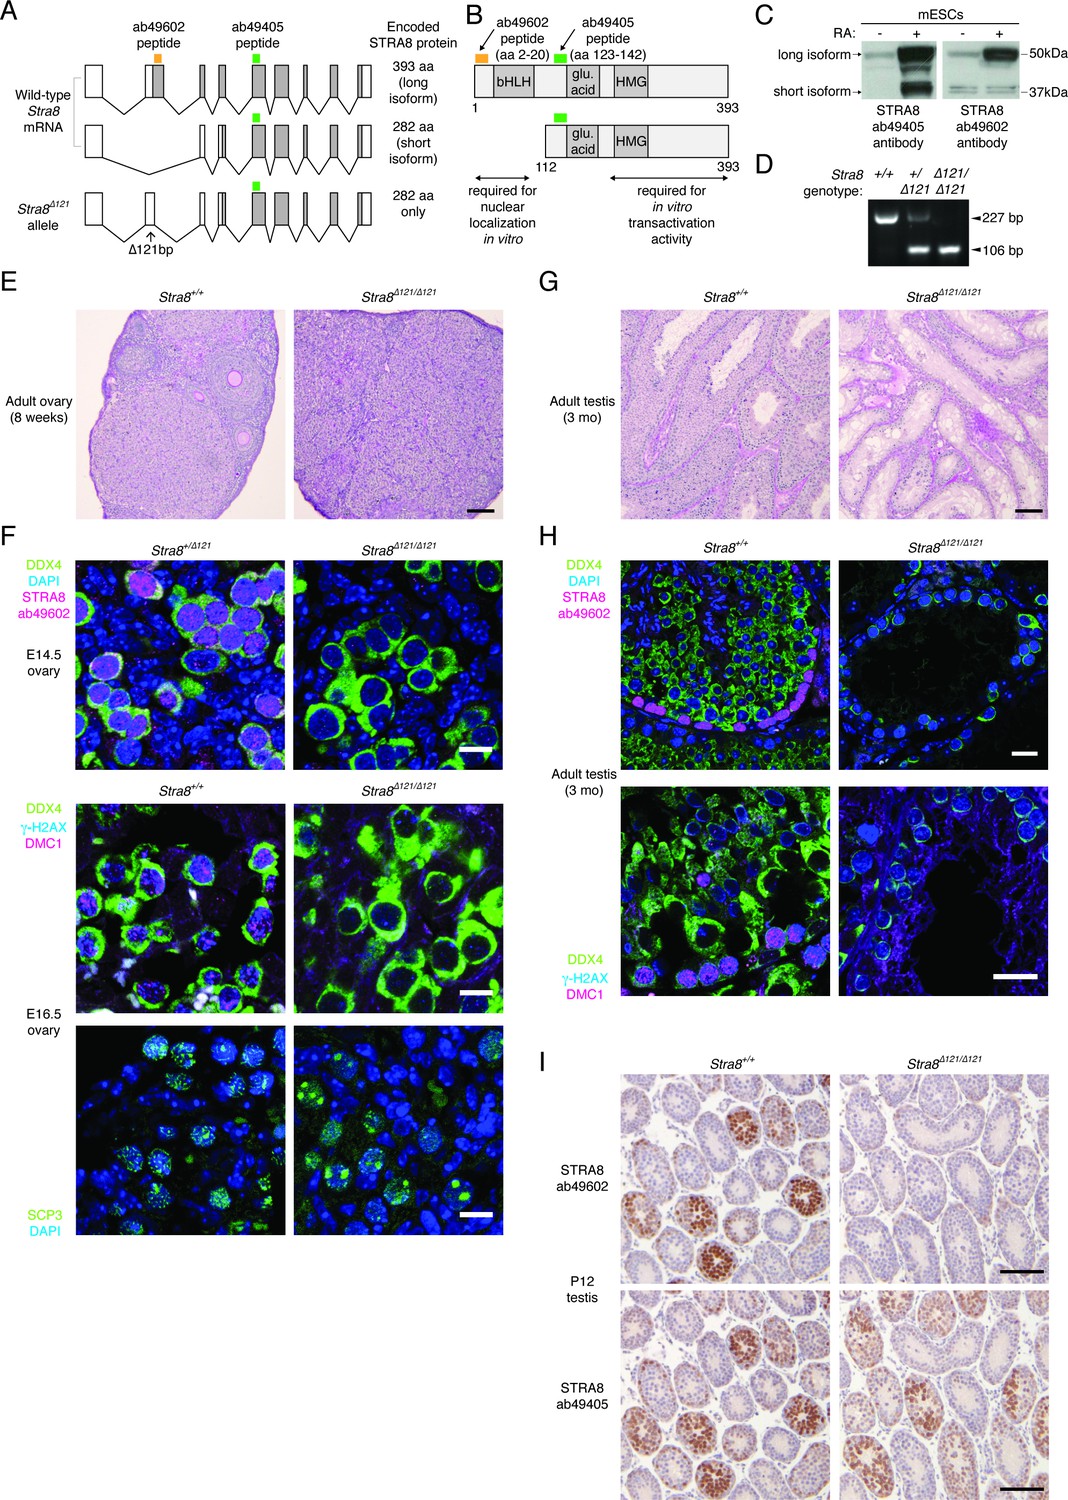
The longer STRA8 protein isoform is required for meiotic initiation in both males and females.
(A) Two Stra8 splice isoforms in wild-type mice. The Stra8Δ121 allele cannot express the longer protein isoform. The locations of peptides against which STRA8 antibodies were raised are marked. (B) STRA8 has a putative basic helix-loop-helix (bHLH) domain, a glutamic acid-rich region, and a putative high-mobility group (HMG) box domain (see Appendix 1). Shown are peptides recognized by antibodies, and regions required for nuclear localization and transactivation activity in vitro, as characterized by Tedesco et al. (2009). (C) Western blots showing isoforms detected by STRA8 antibodies. Lysates were prepared from murine embryonic stem cells treated with DMSO (-) or RA (+) to induce STRA8 expression. (D) PCR genotyping of the Stra8Δ121 allele. (E) He/PAS-stained 8 week wild-type and Stra8Δ121/Δ121 ovaries. Scale bar = 100 μm. (F) IF staining, in control (Stra8+/+ or Stra8+/Δ121) and Stra8Δ121/Δ121 embryonic ovaries, for the long STRA8 isoform (antibody ab49602), germ cell marker DDX4, and meiotic markers γ-H2AX, DMC1 and SCP3. Control germ cells express the long STRA8 isoform, are marked by γ-H2AX and DMC1 staining, and load the synaptonemal complex protein SCP3 onto condensed chromosomes. Stra8Δ121/Δ121 germ cells, which do not express the long isoform, do not show these signs of meiotic initiation. Scale bars = 10 μm. (G) He/PAS staining of 3 month wild-type and Stra8Δ121/Δ121 testes. Scale bar = 100 μm. (H) IF with antibodies for STRA8 (ab49602), γ-H2AX, DMC1, and DDX4 in adult testes (3 months). Scale bars = 20 μm. (I) STRA8 IHC, with hematoxylin counterstaining, of wild-type and Stra8Δ121/Δ121 P12 testes. Staining of consecutive serial sections with the ab49602 and ab49405 antibodies indicates that Stra8Δ121/Δ121 testes express only the shorter STRA8 isoform. Scale bar = 100 μm.
Figure 2—figure supplement 3
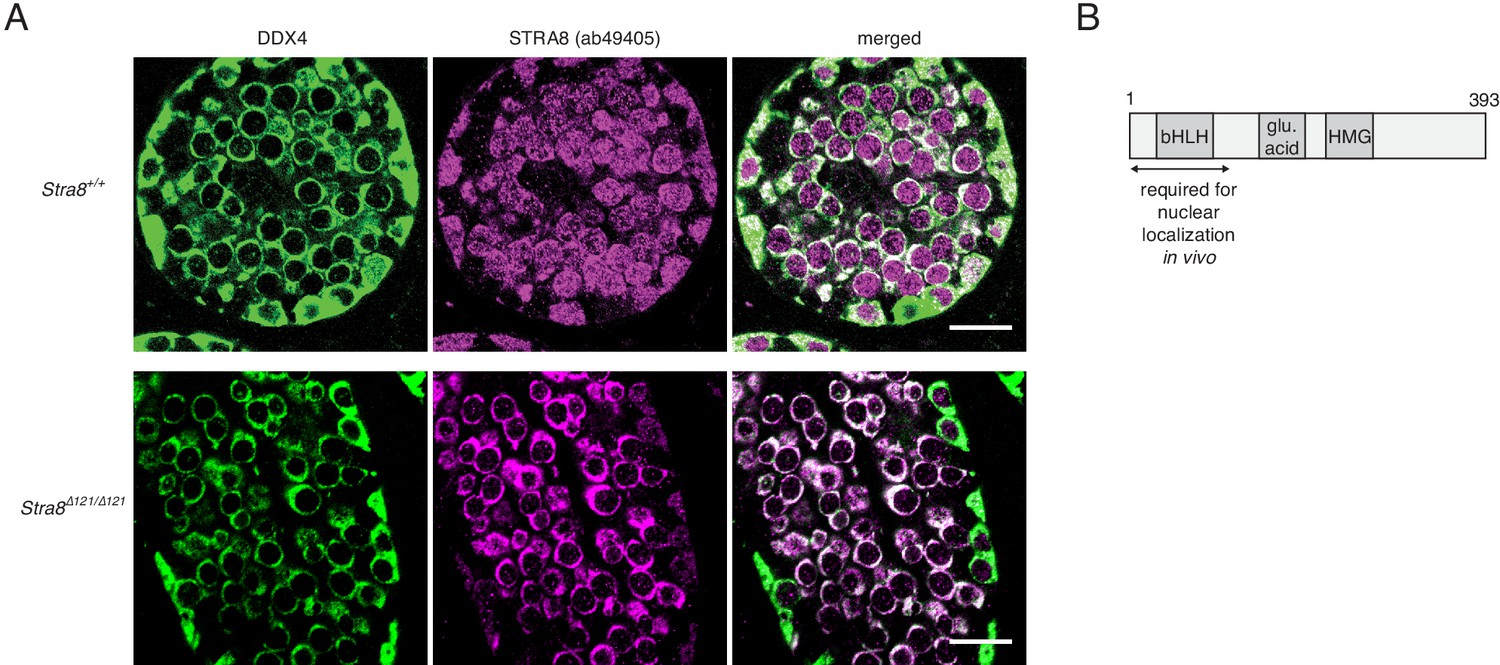
Nuclear localization of STRA8 requires its N terminus.
(A) IF staining of P12 testes using an antibody for the cytoplasmic germ cell marker DDX4 (VASA) and the STRA8 ab49405 antibody, which detects both STRA8 isoforms. Shown are images from a wild-type testis, which expresses both isoforms, and from a Stra8Δ121/Δ121 testis, which expresses only the short isoform that is missing the first 111 amino acids. Scale bar = 20 μm. (B) Model representing the region of the longer STRA8 protein (393 aa) that is required for STRA8’s nuclear localization.
Figure 2—figure supplement 4
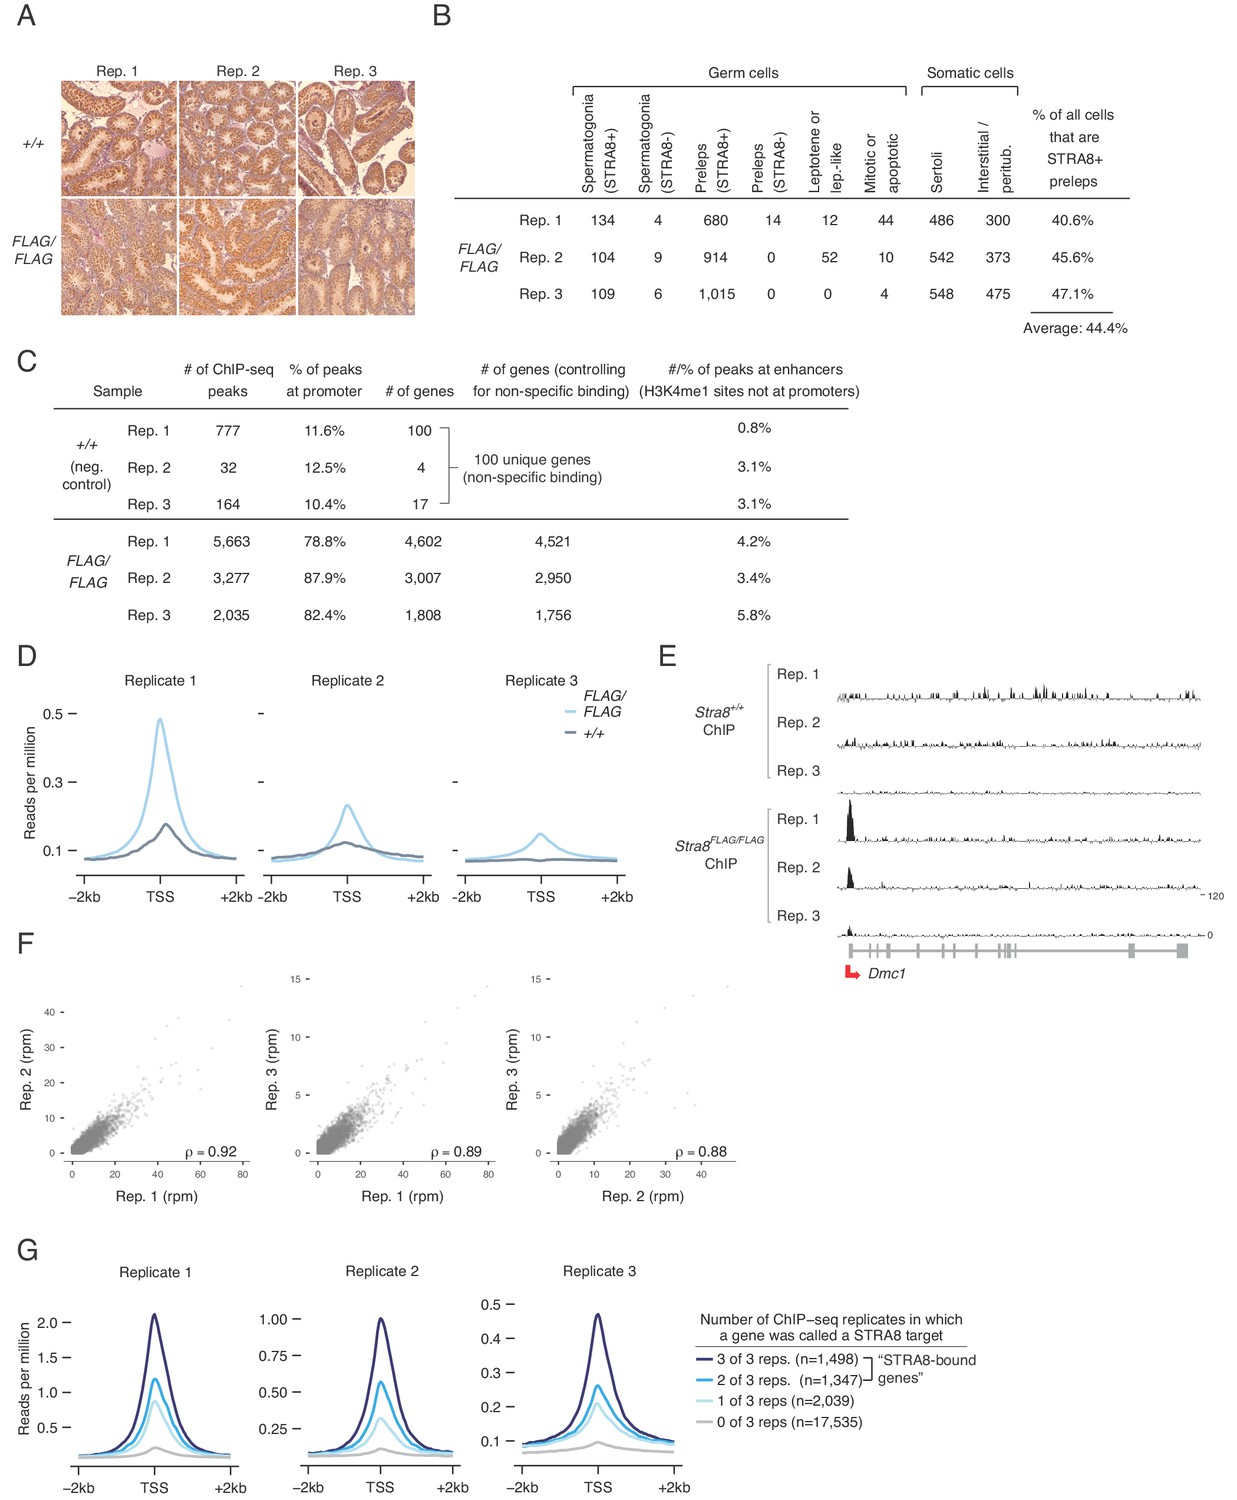
ChIP-seq analysis to determine sites of STRA8 binding.
(A) Staging of samples used for ChIP-seq. 2S testes were analyzed by IHC, using STRA8 antibody ab49405. See Figure 1B for another image of Stra8+/+, replicate 2. (B) Cellular composition of the 2S samples used for Stra8FLAG/FLAG ChIP-seq, and calculation of the percent of all cells that are STRA8-expressing preleptotene cells. See also Figure 1C. See Materials and methods for description of cell counting method. (C) ChIP-seq analyses of the six biological replicates (three each of Stra8FLAG/FLAG and Stra8+/+). ChIP-seq peaks were identified by MACS. A peak was assigned to a gene promoter if it was within 1 kb of an annotated TSS for that gene. Genes that were identified in any of the three Stra8+/+ replicates (likely a result of non-specific binding) were filtered out of the list of promoter-bound genes in the Stra8FLAG/FLAG replicates. A peak was assigned to an enhancer if it overlapped an H3K4me1 peak not at a gene promoter; a total of 39,272 enhancers were identified. (D) Average ChIP-seq profile from Stra8FLAG/FLAG and Stra8+/+ samples over the TSS of genes, indicating an enrichment of reads at the TSS. Each replicate is shown separately. See Figure 2D for profiles with reads from all replicates pooled together. (E) Input-subtracted ChIP-seq signal at Dmc1 in all six replicates. Track heights are the same for all samples. (F) Correlations between biological replicates of normalized, input-subtracted Stra8FLAG/FLAG ChIP-seq signal (in reads per million, rpm) at the promoters of all genes. The 100 genes that were STRA8-bound in any of the negative control replicates were excluded from this analysis. Pearson’s correlation coefficients are shown. (G) Average ChIP-seq signal over the TSS in each Stra8FLAG/FLAG replicate. Genes were binned by number of replicates that exhibited STRA8 binding.
Figure 3 with 1 supplement
Most genes upregulated at meiotic initiation are bound by STRA8.
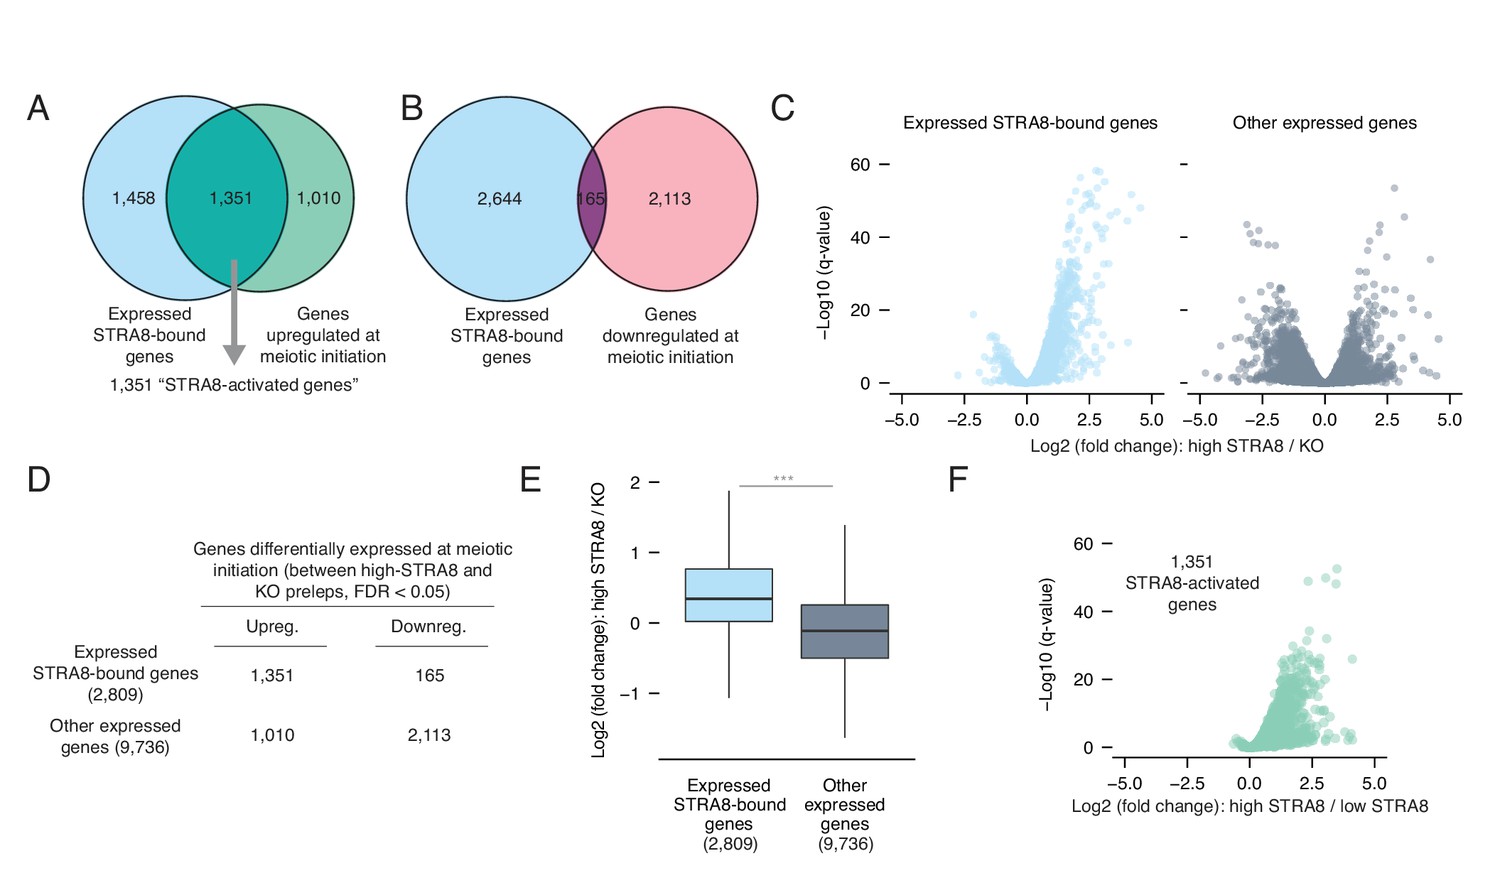
(A) Overlap between the genes upregulated at meiotic initiation (see Figure 1E) and the STRA8-bound genes (see Figure 2E). The two gene lists significantly overlap, with 1,351 ‘STRA8-activated genes’ that are directly bound and upregulated at meiotic initiation by STRA8 (p<6.8×10−322; one-tailed hypergeometric test). (B) Overlap between genes downregulated at meiotic initiation (see Figure 1E) and STRA8-bound genes. Downregulated genes are significantly depleted for STRA8-bound genes (p<7.5×10−99; one-tailed hypergeometric test). (C) Volcano plots, for STRA8-bound genes and all other genes, representing gene expression changes at meiotic initiation. Only expressed genes are shown. (D) Overlap between expressed STRA8-bound genes and genes differentially expressed at meiotic initiation. STRA8-bound genes are primarily upregulated; p<2.2×10⁻¹⁶, Fisher’s exact test. (E) Gene expression fold changes at meiotic initiation. Boxplots show sample medians and interquartile ranges (IQRs), with whiskers extending no more than 1.5 × IQR and outliers suppressed. ***p<2.2×10⁻¹⁶, one-tailed Mann-Whitney U test. (F) Volcano plot showing expression changes of ‘STRA8-activated genes’ in Stra8+/- preleptotene cells with high or low STRA8 levels. See Figure 3—source data 1.
-
Figure 3—source data 1
Source data for RNA-seq and ChIP-seq analyses.
- https://doi.org/10.7554/eLife.43738.014
Figure 3—figure supplement 1
The breadth of the gene expression program directly upregulated at meiotic initiation by STRA8.
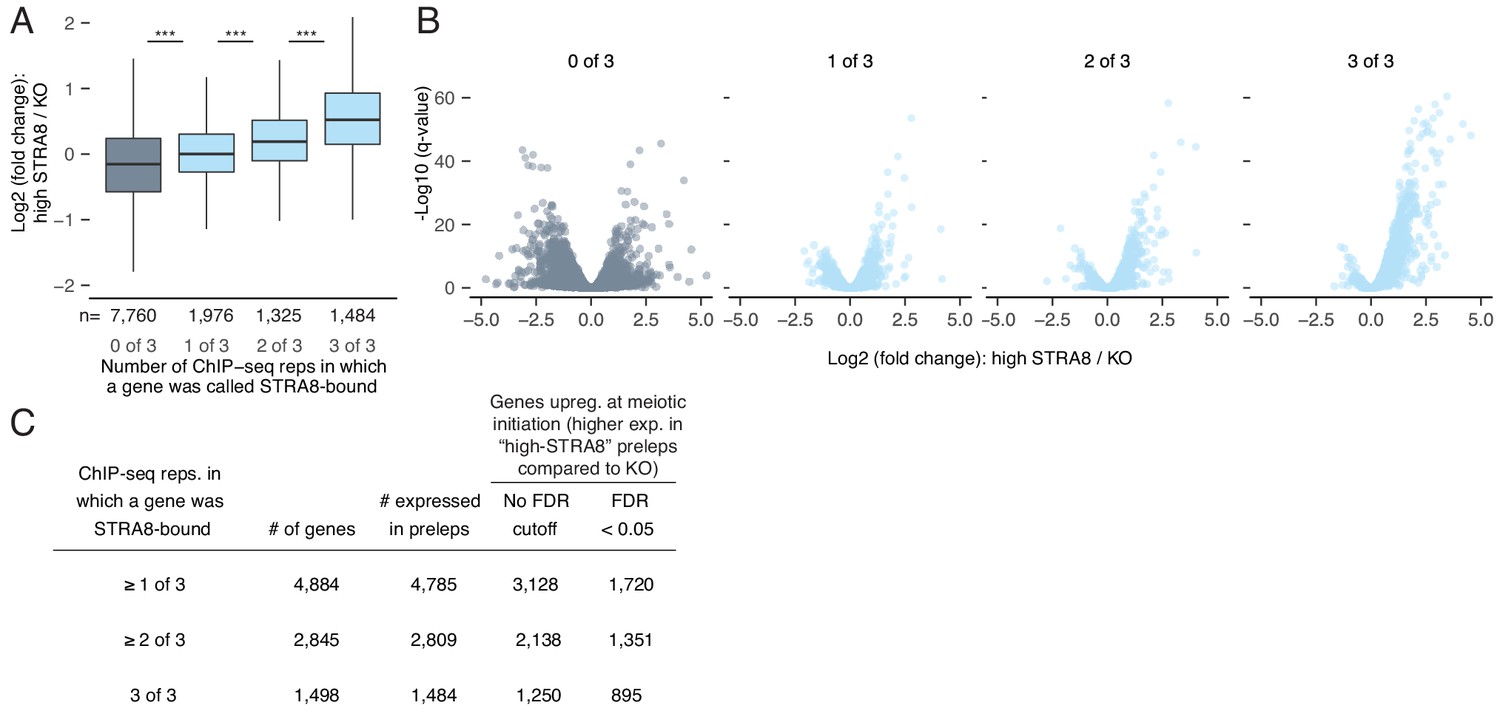
(A) Gene expression changes at meiotic initiation, represented as the fold change of gene expression (log2 scale) in high-STRA8 preleptotene cells compared to KO preleptotene cells. Genes are binned by the number of ChIP-seq replicates in which their promoters were bound by STRA8. Only expressed genes are shown. ***p<2.2×10⁻¹⁶, two-tailed Mann-Whitney U test. (B) Volcano plots for the gene groups in (A) showing the expression fold changes at meiotic initiation. (C) Number of STRA8-bound and STRA8-activated genes identified at different cutoffs for ChIP-seq (the number of replicates in which a STRA8 peak was observed) and RNA-seq (FDR cutoff to compare gene expression changes).
Figure 4 with 2 supplements
Mechanisms of gene activation at meiotic initiation.
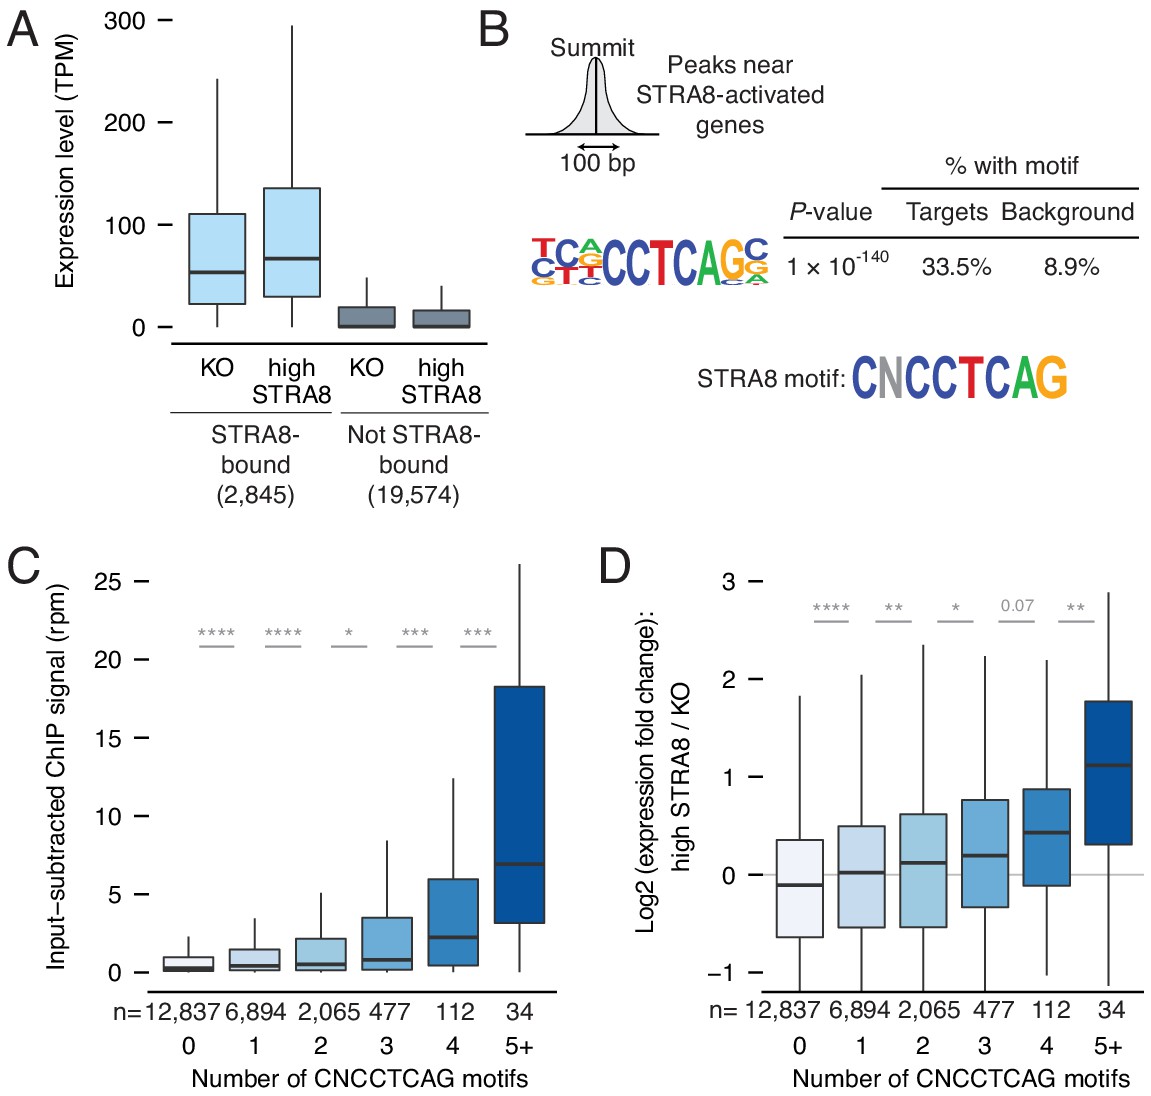
(A) Expression levels of genes in Stra8 KO and high-STRA8 preleptotene cells. Genes are binned by whether they are STRA8-bound or not. (B) Identification of potential STRA8 binding sequences by HOMER de novo motif analysis. We searched the STRA8 binding peaks within promoters of STRA8-activated genes. Shown is a graphical depiction of the input to the motif-finding algorithm: the 100 bp windows surrounding the summits of ChIP-seq peaks. The top enriched motif has the consensus sequence CNCCTCAG. See Figure 4—figure supplement 1 for other enriched motifs. (C) STRA8 ChIP-seq signal at gene promoters, with genes grouped by the number of promoter CNCCTCAG (perfect match) motifs. Boxplots show sample medians and interquartile ranges (IQRs), with whiskers extending no more than 1.5 × IQR; outliers are suppressed. *p<0.01, , ***p<1×10⁻⁴, ****p<1×10⁻⁵, two-tailed Mann-Whitney U tests. (D) The expression fold change of genes at meiotic initiation, with genes grouped by number of promoter CNCCTCAG (perfect match) motifs. *p<0.01, **p<0.001, ****p<1×10⁻⁵, two-tailed Mann-Whitney U tests. See Figure 4—source data 1.
-
Figure 4—source data 1
Source data for Figure 4 panels.
- https://doi.org/10.7554/eLife.43738.018
Figure 4—figure supplement 1

Identification of a binding motif for STRA8-mediated upregulation at meiotic initiation.
(A) HOMER de novo motif analysis (as in Figure 4B) for identification of a STRA8 binding motif near ChIP-seq peaks at STRA8-activated gene promoters. Shown are the top five de novo motifs, with HOMER’s predictions for the closest motif. (B) The top five enriched motifs in the 400 bp surrounding the TSS of the 1,351 STRA8-activated genes, compared to the corresponding regions of all other preleptotene-expressed genes. The top motif is similar to the top enriched motif in (A). (C) The number of CNCCTCAG motifs in the 100 bp surrounding ChIP-seq peak summits is associated with the peak score (as represented by –log10 (peak P-value from MACS)). Only peaks at the promoters of STRA8-activated genes are shown. Spearman’s correlation between the motif counts and peak scores is 0.24, p<1×10⁻⁶ by permutation testing. The addition of CNCCTCAG motifs at the peak results in statistically significant changes in the peak score, as determined by two-tailed Mann-Whitney U tests. (D) Percent of genes with annotated CpG islands (CGI) at their promoters. (E) ChIP-seq signal at promoters and the log2 expression fold change at meiotic initiation. Genes are binned by whether the promoter contains a CpG island (CGI) and by the number of promoter CNCCTCAG motifs. (F) Comparison of gene groups in (E). P-values were calculated by two-tailed Mann-Whitney U tests.
Figure 4—figure supplement 2
STRA8 binding is not associated with AP-2 transcription factor motifs.
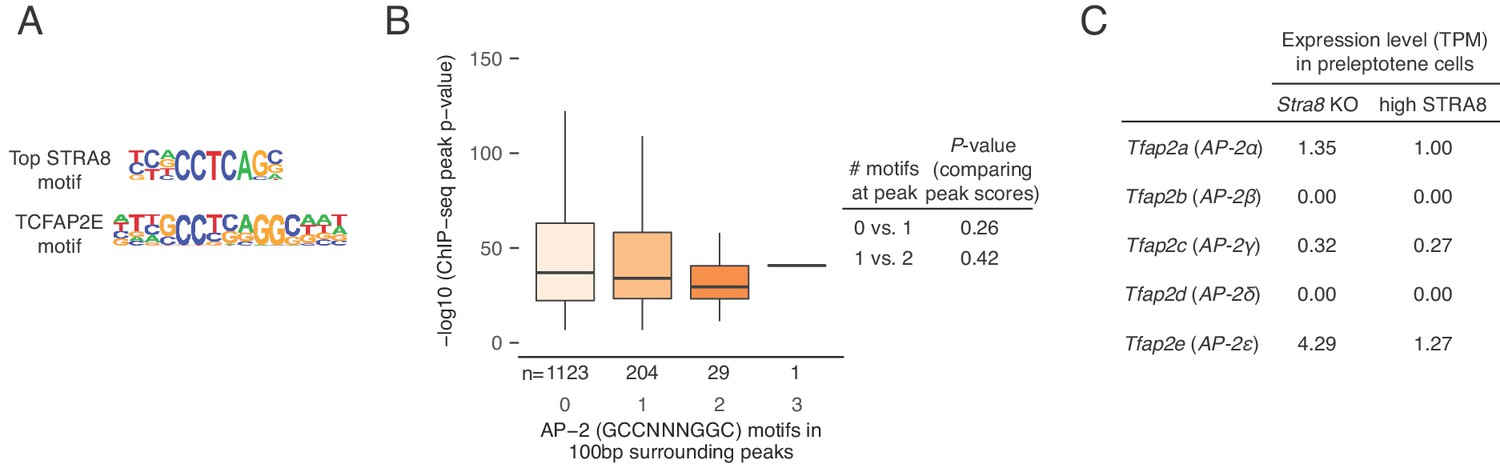
(A) Comparison of the top enriched motif at STRA8 binding sites (see Figure 4A and Figure 4—figure supplement 1A) with the closest known motif, that of TCFAP2E (also known as TFAP2E, or AP-2E; motif PB0088.1 in the Jaspar database). TCFAP2E is an AP-2 family transcription factor. Note that the AP-2 binding motif is palindromic, while the STRA8 motif is not. (B) The consensus AP-2 family motif (GCCNNNGGC; Eckert et al., 2005) is not enriched at STRA8 binding sites. The number of consensus AP-2 family motifs (GCCNNNGGC) in the 100 bp surrounding STRA8 ChIP-seq peak summits is not associated with the peak score (as represented by –log10 (peak P-value from MACS)). Only peaks at the promoters of STRA8-activated genes are shown. Spearman’s correlation between the motif counts and peak scores is −0.04, p<0.93 by permutation testing. P-values between groups were determined by two-tailed Mann-Whitney U tests. Compare with Figure 4—figure supplement 1C, which depicts CNCCTCAG motif enrichment at STRA8 binding sites. (C) Expression level, in TPM units, of AP-2 transcription factor genes. Note that none of the AP-2 transcription factors is highly expressed in preleptotene cells.
Figure 5
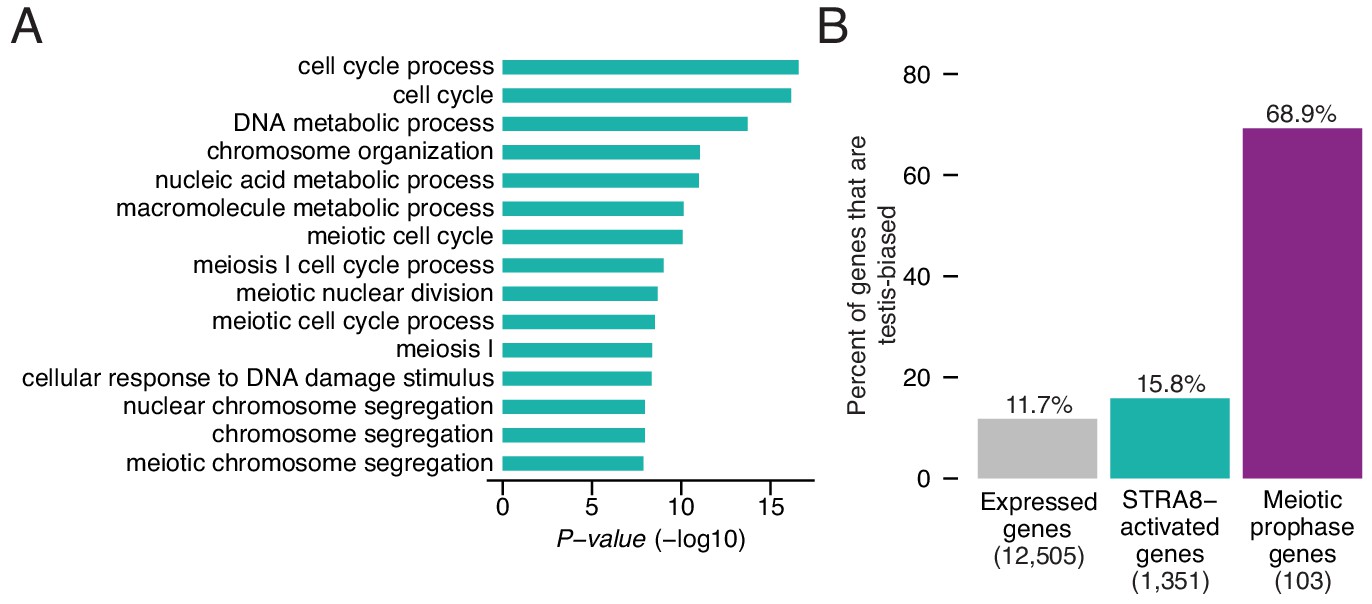
Upregulation of a broad gene expression program at meiotic initiation by STRA8.
(A) The top 15 enriched Gene Ontology biological processes among the 1,351 STRA8-activated genes, compared to all preleptotene-expressed genes. P-values are from binomial tests with Bonferroni correction. (B) Fraction of genes that are testis-biased. See Figure 5—source data 1.
-
Figure 5—source data 1
Source data for Figure 5 analyses.
- https://doi.org/10.7554/eLife.43738.020
Figure 6 with 2 supplements

Coordinated upregulation of the meiotic prophase I gene expression program by STRA8.
(A) Volcano plot depicting gene expression differences between high-STRA8 and Stra8 KO preleptotene cells. Shown are 103 genes associated with meiotic prophase I in the fetal ovary (Soh et al., 2015), with 76 STRA8-bound genes shaded light blue. (B) Comparison of expression levels of meiotic prophase genes in high-STRA8 and KO preleptotene cells. The light gray region identifies genes that are not expressed in the KO. (C) Input-subtracted STRA8 ChIP-seq signal at promoters of key meiotic genes. Sequencing reads were pooled from three Stra8FLAG/FLAG ChIP replicates. Red arrows mark the TSS. (D) Lack of STRA8 ChIP-seq signal at Rec8 gene. (E) STRA8 ChIP-seq signal at its own promoter. (F) STRA8 ChIP-seq signal at promoters of Meioc and Ythdc2..
-
Figure 6—source data 1
Source data for CNCCTCAG motif enrichment at meiotic genes.
- https://doi.org/10.7554/eLife.43738.024
Figure 6—figure supplement 1
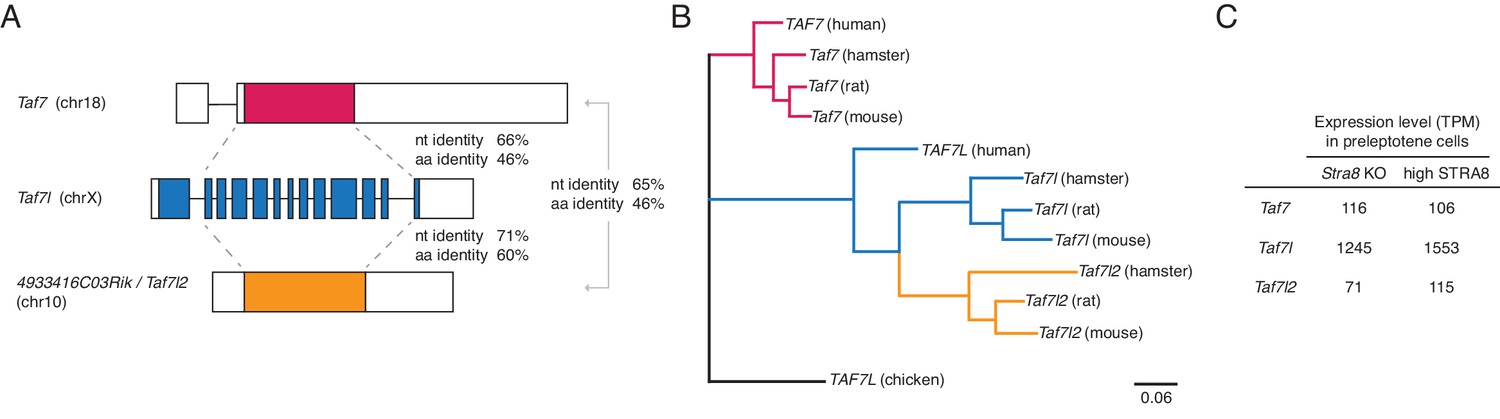
Taf7l2 (4933416C03Rik) is a functional retrogene of Taf7l.
(A) Comparison of the gene structures of the mouse Taf7, Taf7l, and 4933416C03Rik (now called Taf7l2) genes. Coding regions are colored, and the 5’ and 3’ untranslated regions are shown in white. Shown are the percent identities, in the coding region, of the nucleotide (nt) and amino acid (aa) sequences. Taf7 is a known functional retrogene of Taf7l (Cheng et al., 2007), and Taf7l2 also appears to be a retrogene of Taf7l. The Taf7l sequence is more similar to that of Taf7l2 than to the Taf7 sequence. (B) Maximum likelihood phylogenetic tree showing evolutionary relationships among genes of the Taf7l family in human, mouse, rat, and hamster. The rodent Taf7l2 genes cluster with rodent Taf7l genes, and no Taf7l2 ortholog was found in human, indicating that Taf7l2 arose from a retrotransposition event in the rodent lineage. (C) Expression level, in TPM units, of Taf7, Taf7l, and Taf7l2 genes in sorted mouse preleptotene cells. All three genes are robustly expressed.
Figure 6—figure supplement 2
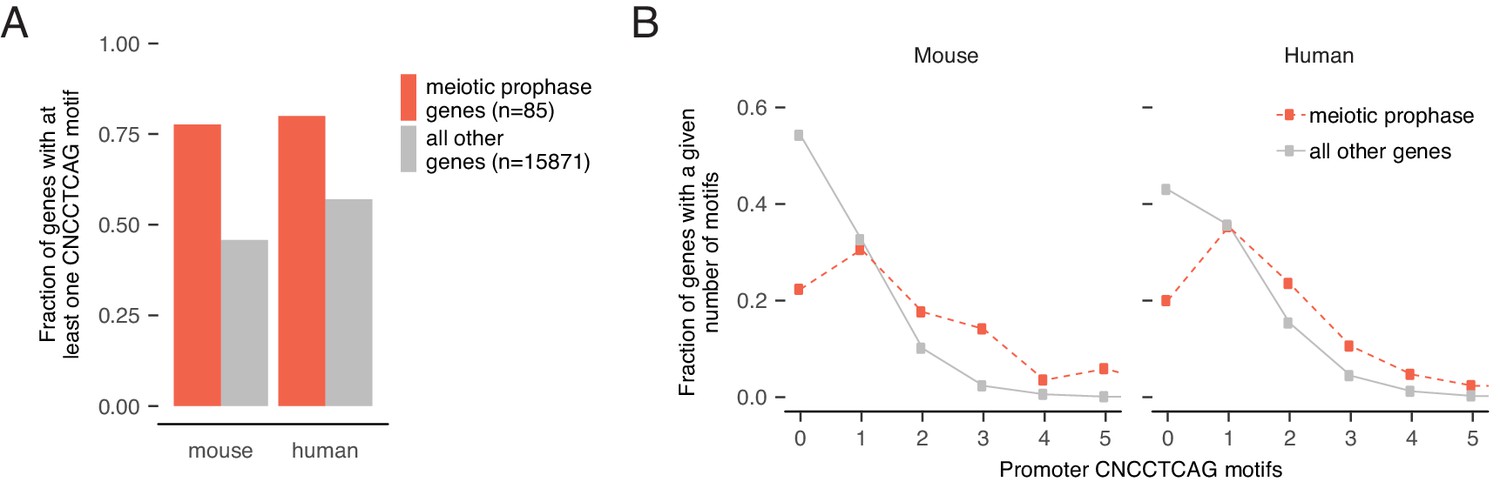
Enrichment and conservation of STRA8 (CNCCTCAG) motifs at promoters of meiotic genes.
(A) The fraction of genes with at least one STRA8 motif (CNCCTCAG) at the promoter, at meiotic prophase I genes (Soh et al., 2015) and at all other genes. In both mouse and human, the majority of meiotic genes have CNCCTCAG motifs (exact match) at their promoters. Only genes with known 1:1 orthologs between mouse and human are shown. (B) Comparison of distributions of promoter STRA8 motifs between meiotic prophase I genes and all other genes, in mouse and in human. Meiotic genes are significantly enriched for CNCCTCAG motifs (p<3.5×10⁻¹⁶ and 1.1×10⁻⁸ in mouse and human, respectively). P-values between groups were determined by two-tailed Mann-Whitney U tests.
Figure 7
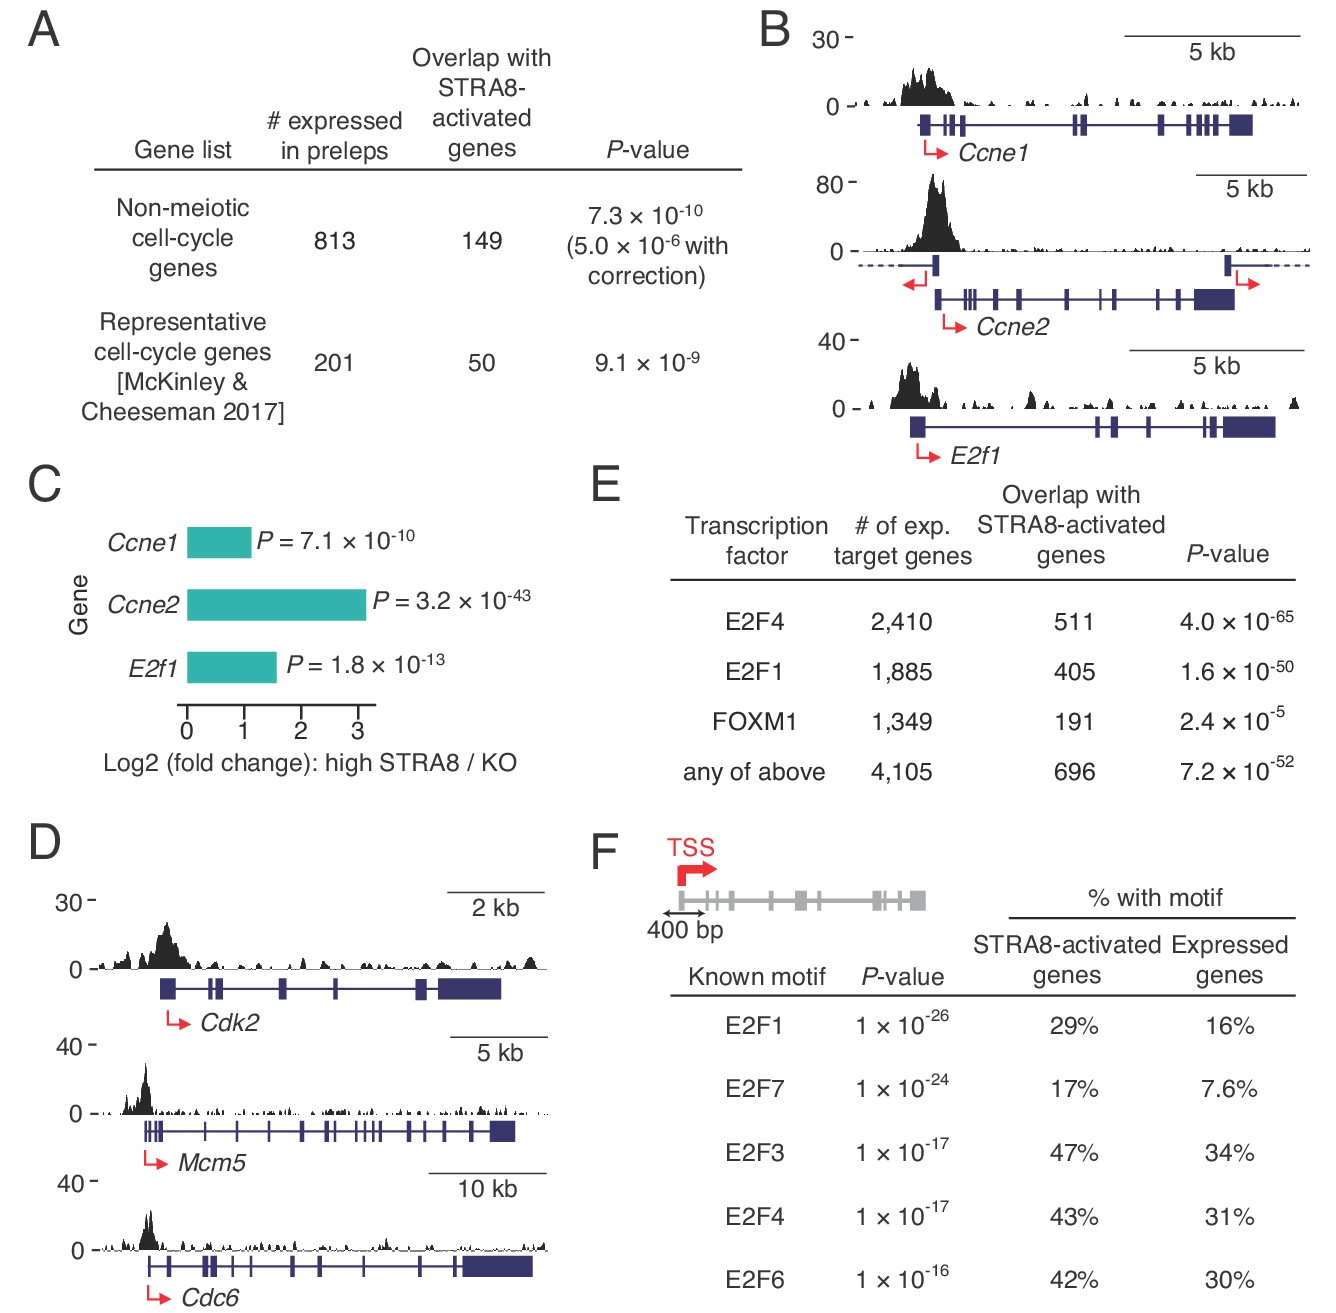
Coordinated upregulation of a transcriptional program for cell-cycle progression at meiotic initiation.
(A) Overlap of STRA8-activated genes at meiotic initiation with cell-cycle associated gene lists. P-value for the non-meiotic cell cycle GO terms was calculated using a binomial test with Bonferroni correction. P-value for overlap with a list of representative cell-cycle genes was calculated using a one-tailed hypergeometric test. (B) Input-subtracted STRA8 ChIP signal showing STRA8 binding at promoters of key G1-S transition genes. Sequencing reads were pooled from the three Stra8FLAG/FLAG ChIP replicates. (C) Expression changes of key G1-S genes at meiotic initiation. (D) Stra8FLAG/FLAG ChIP-seq signal at promoters of other key cell-cycle genes. (E) Overlap of STRA8-activated genes with targets of known cell cycle-driving transcription factors. E2F4-, E2F1-, and FOXM1-bound genes were identified from ENCODE consortium ChIP-seq datasets. P-values were obtained by one-tailed hypergeometric tests. (F) Top five known motifs enriched near the TSS of STRA8-activated genes, compared to all other expressed genes. Enrichment of E2F transcription factor motifs suggests STRA8’s role in regulating a cell cycle-associated transcriptional program. Note that the E2F6 motif enrichment could also reflect the known role of E2F6, a non-canonical E2F factor, in regulating the expression of meiotic genes (Kehoe et al., 2008; Pohlers et al., 2005).
Figure 8
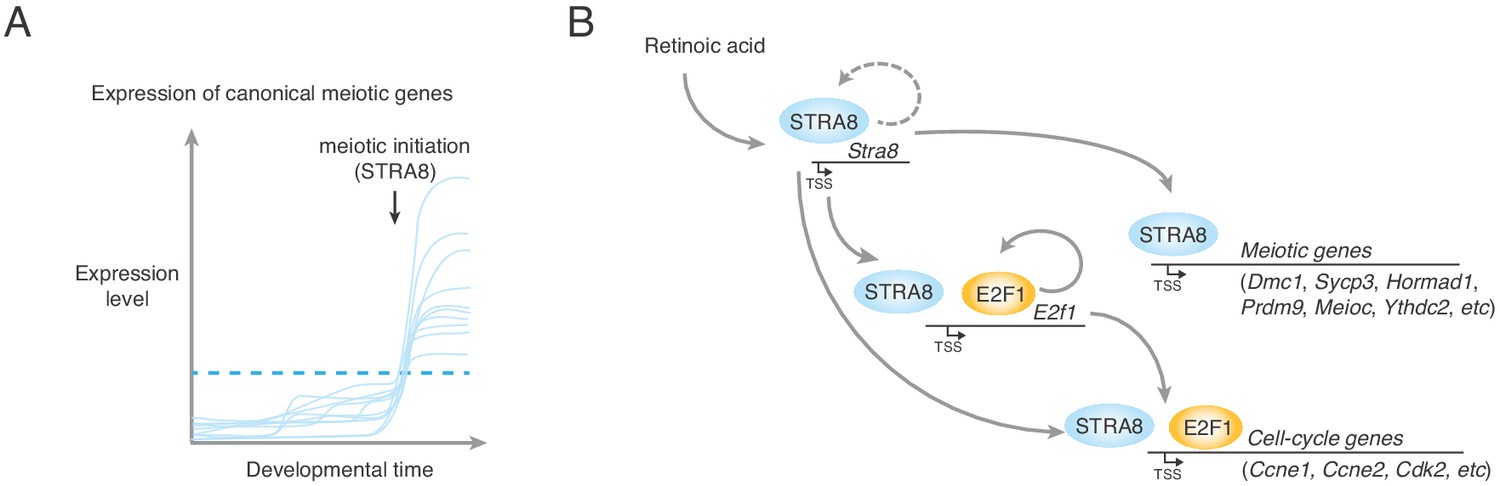
A model for upregulation of the transcriptional program that triggers the meiotic cell cycle.
(A) Upregulation of meiotic prophase genes at meiotic initiation. Shown are hypothetical meiotic genes and their expression levels across developmental time. Many meiotic genes are expressed at detectable levels before meiotic initiation. We propose that their upregulation above a threshold level (dotted blue line) required for events such as synapsis and meiotic recombination triggers the execution of the chromosomal events of meiotic prophase I. In preleptotene spermatocytes, STRA8 directly upregulates this ensemble of genes. (B) A model of STRA8-mediated gene expression changes at meiotic initiation. First, retinoic acid induces expression of Stra8. STRA8 then activates a broad transcriptional program by directly binding promoters of both meiotic genes and cell-cycle genes. Among STRA8-activated cell cycle genes is E2f1, which is known to drive the G1/S transition. E2F1 upregulates its own expression as well as a broad ensemble of cell cycle-associated genes, including those involved in a positive feedback loop to reinforce cell-cycle entry. STRA8 also binds its own promoter, potentially establishing a feedback loop that further commits germ cells to the meiotic cell cycle.
Tables
Key resources table
| Reagent type (species) or resource | Designation | Source or reference | Identifiers | Additional information |
|---|---|---|---|---|
| Gene (Mus musculus) | Stimulated by retinoic acid 8 (Stra8) | Mouse Genome Informatics | MGI:107917 | |
| Strain, strain background (M. musculus) | B6 | Taconic | TAC: B6-F | C57BL/6NTac |
| Strain, strain background (M. musculus) | B6/129 | Taconic | TAC: B6129-F | B6129F1/Tac |
| Strain, strain background (M. musculus) | CD-1 | Charles River Laboratories | CRL: 022 | Crl:CD1(ICR) |
| Genetic reagent (M. musculus) | Stra8FLAG | this paper | FLAG-tagged knock-in allelegenerated by CRISPR/Cas9 | |
| Genetic reagent (M. musculus) | Stra8Δ121 | this paper | Stra8 allele with a121-bp deletion generated by CRISPR/Cas9 | |
| Genetic reagent (M. musculus) | Stra8-deficient allele, Stra8- | The JacksonLaboratory | JAX: 023805; MGI:3622304 | Stra8tm1Dcp |
| Genetic reagent (M. musculus) | Ddx4-Cre | PMID:23858447 | MGI:5554579 | Ddx4tm1.1(cre/mOrange)Dcp' |
| Genetic reagent (M. musculus) | Rosa26-tdTomato | The Jackson Laboratory | JAX: 007914 | B6.Cg-Gt(ROSA)26Sortm14(CAG-tdTomato)Hze/J |
| Cell line (M. musculus) | v6.5 embryonic stem cells | other | RRID:CVCL_C865 | Jaenisch Lab, Whitehead Institute |
| Biological sample (M. musculus) | CF6Neo Mouse Embryonic Fibroblasts (MEF), Mitomycin C Treated | MTI-GlobalStem | GlobalStem:GSC-6105M | |
| Antibody | anti-STRA8 (rabbit polyclonal) | Abcam | Abcam:ab49405; RRID:AB_945677 | (IF 1:250; IHC 1:500: WB 1:1000) |
| Antibody | anti-STRA8 (rabbit polyclonal) | Abcam | Abcam:ab49602; RRID:AB_945678 | (IF 1:250; IHC 1:500: WB 1:1000) |
| Antibody | anti-FLAG M2 (mouse monoclonal) | MilliporeSigma | MilliporeSigma:F1804; RRID:AB_262044 | (IHC 1:200) |
| Antibody | anti-FLAG M2, HRP-conjugated (mouse monoclonal) | MilliporeSigma | MilliporeSigma:A8592; RRID: AB_439702 | (WB 1:1000) |
| Antibody | anti-DMC1 H100 (rabbit polyclonal) | Santa Cruz Biotechnology | SantaCruz:sc-22768; RRID:AB_2277191 | (IF 1:250) |
| Antibody | anti-SCP3 D-1 (mouse monoclonal) | Santa CruzBiotechnology | SantaCruz:sc-74569; RRID:AB_2197353 | (IF 1:250) |
| Antibody | anti-phospho-histone H2AX (Ser139), clone JBW301 (mouse monoclonal) | MilliporeSigma | MilliporeSigma:05–636; RRID:AB_309864 | (IF1:250) |
| Antibody | anti-DDX4/MVH (goat polyclonal) | R and D Systems | R and D Systems:AF2030; RRID:AB_2277369 | (IF 1:500) |
| Antibody | anti-alpha tubulin, HRP-conjugated (rabbit polyclonal) | Abcam | Abcam:ab40742; RRID:AB_880625 | (WB 1:5000) |
| Antibody | anti-goat Alexa Flour 488 (donkey polyclonal) | JacksonImmunoResearch | JacksonImmunoResearch:705-546-147 | (IF 1:250) |
| Antibody | anti-rabbit Rhodamine Red-X (RRX) (donkey polyclonal) | JacksonImmunoResearch | JacksonImmunoResearch:711-295-152 | (IF 1:250) |
| Antibody | anti-mouse Cy5 (donkey polyclonal) | JacksonImmunoResearch | JacksonImmunoResearch:715-175-150 | (IF 1:250) |
| Antibody | anti-rabbit, peroxidase -conjugated (donkey polyclonal) | JacksonImmunoResearch | JacksonImmunoResearch:711-035-152 | (WB 1:5000) |
| Recombinant DNA reagent | pX330-U6-Chimeric_BB- CBh-hSpCas9 (plasmid) | Addgene | Addgene:42230 | |
| Sequence- based reagent | primers and oligonucleotides used in this study | this paper | All primers and oligonucleotides used in this study are available in Supplementary file 6 | |
| Chemical compound, drug | N,N′-Octamethylenebis(2,2-dichloroacetamide) [Win18,446] | Santa Cruz Biotechnology | SantaCruz:sc-295819 | |
| Chemical compound, drug | Retinoic acid | MilliporeSigma | MilliporeSigma:R2625 | |
| Software, algorithm | FASTX Toolkit | other | RRID:SCR_005534 | http://hannonlab.cshl.edu/fastx_toolkit/ |
| Software, algorithm | Bowtie1 (v.1.2.0) | PMID:19261174 | RRID:SCR_005476 | http://bowtie-bio.sourceforge.net/index.shtml |
| Software, algorithm | Samtools (v1.5) | PMID:19505943 | RRID:SCR_002105 | http://samtools.sourceforge.net/ |
| Software, algorithm | MACS2 (v2.1.1.20160309) | PMID:18798982 | RRID:SCR_013291 | https://github.com/taoliu/MACS |
| Software, algorithm | htseq count (v0.8.0) | PMID:25260700 | RRID:SCR_011867 | https://htseq.readthedocs.io |
| Software, algorithm | kallisto (v0.43.0) | PMID:27043002 | RRID:SCR_016582 | https://pachterlab.github.io/kallisto/about |
| Software, algorithm | DESeq2 (v1.18.1) | PMID:25516281 | RRID:SCR_015687 | https://bioconductor.org/packages/release/bioc/html/DESeq2.html |
| Software, algorithm | PANTHER (v13.1) | PMID:27899595 | RRID:SCR_004869 | http://www.pantherdb.org/ |
| Software, algorithm | HOMER (v4.9.1) | PMID: 20513432 | RRID:SCR_010881 | http://biowhat.ucsd.edu/homer/index.html |
| Software, algorithm | deepTools (v2.5.3) | PMID:27079975 | RRID:SCR_016366 | http://deeptools.readthedocs.io/en/latest/index.html |
| Software, algorithm | RStudio v1.1.414 | RStudio | RRID:SCR_000432 | |
| Software, algorithm | PHYLIP (v3.66) | Other | RRID:SCR_006244 | Distributed by J Felsenstein. http://evolution.genetics.washington.edu/phylip.html |
| Commercial assay or kit | Periodic Acid-Schiff (PAS) Kit | MilliporeSigma | MilliporeSigma:395B | |
| Commercial assay or kit | Mouse on Mouse ImmPRESS HRP (Peroxidase) Polymer Kit | VECTOR Laboratories | VectorLabs:MP2400 | |
| Commercial assay or kit | ImmPRESS HRP Anti-Rabbit IgG (Peroxidase) Polymer Detection Kit, made in Horse | VECTOR Laboratories | VectorLabs:MP-7401 | |
| Commercial assay or kit | mMESSAGE mMACHINE T7 Kit | Thermo Fisher Scientific | ThermoFisher:AM1344 | |
| Commercial assay or kit | MEGAshortscript T7 Kit | Thermo Fisher Scientific | ThermoFisher:AM1354 | |
| Commercial assay or kit | MEGAclear Kit | Thermo Fisher Scientific | ThermoFisher:AM1908 | |
| Commercial assay or kit | ChIP DNA Clean and Concentrator Kit | Zymo Research | Zymo:D5205 | |
| Commercial assay or kit | TruSeq ChIP Sample Preparation Kit | Illumina | Illumina:IP-202–1024 | |
| Commercial assay or kit | Accel-NGS 2S Plus DNA Library Kit | Swift Biosciences | SwiftBio:21024 | |
| Commercial assay or kit | TruSeq Stranded mRNA Library Prep Kit | Illumina | Illumina:20020594 | |
| Other | Hematoxylin | Life Technologies | LifeTech:008011 | |
| Other | 2.5% Normal Horse Serum Blocking Solution | VECTOR Laboratories | VectorLabs:S-2012 | |
| Other | ImmPACT DAB Peroxidase (HRP) Substrate | VECTOR Laboratories | VectorLabs:SK-4105 | |
| Other | Normal donkey serum | Jackson ImmunoResearch | JacksonImmunoResearch:017000121 | |
| Other | VECTASHIELD Antifade Mounting Media for Fluorescence | VECTOR Laboratories | VectorLabs:H-1000 | |
| Other | Collagenase, Type I | Worthington Biochemical | Worthington:LS004196 | |
| Other | Hyaluronidase | MilliporeSigma | MilliporeSigma:H3506 | |
| Other | DNaseI | MilliporeSigma | MilliporeSigma:D5025 | |
| Other | Benzonase Nuclease | MilliporeSigma | MilliporeSigma:70664–3 | |
| Other | Protease inhibitor, EDTA Free | MilliporeSigma | MilliporeSigma: 11836170001 | |
| Other | ESGRO Recombinant Mouse LIF Protein | MilliporeSigma | MilliporeSigma:ESG1107 | |
| Other | Dynabeads Protein G for Immunoprecipitation | Thermo Fisher Scientific | ThermoFisher:10004D | |
| Other | Lumi-Light Western Blotting Substrate | MilliporeSigma | MilliporeSigma:12015200001 | |
| Other | DirectPCR Lysis Reagent (Mouse Tail) | Viagen Biotech | Viagen:102 T |
Additional files
-
Supplementary file 1
Relevant gene lists generated by this study.
- https://doi.org/10.7554/eLife.43738.027
-
Supplementary file 2
STRA8 ChIP-seq status, RNA-seq data, and CNCCTCAG motif count for all protein-coding genes.
- https://doi.org/10.7554/eLife.43738.028
-
Supplementary file 3
STRA8 ChIP-seq status and RNA-seq data for all meiotic prophase genes listed in Soh et al. (2015).
- https://doi.org/10.7554/eLife.43738.029
-
Supplementary file 4
Sequences used to generate the Taf7l2 phylogenetic tree.
- https://doi.org/10.7554/eLife.43738.030
-
Supplementary file 5
ENCODE datasets used in this study.
- https://doi.org/10.7554/eLife.43738.031
-
Supplementary file 6
Primer and oligonucleotide sequences used in this study.
- https://doi.org/10.7554/eLife.43738.032
-
Transparent reporting form
- https://doi.org/10.7554/eLife.43738.033
Download links
A two-part list of links to download the article, or parts of the article, in various formats.
Downloads (link to download the article as PDF)
Open citations (links to open the citations from this article in various online reference manager services)
Cite this article (links to download the citations from this article in formats compatible with various reference manager tools)
Amplification of a broad transcriptional program by a common factor triggers the meiotic cell cycle in mice
eLife 8:e43738.
https://doi.org/10.7554/eLife.43738


