A connectional hub in the rostral anterior cingulate cortex links areas of emotion and cognitive control
- McLean Hospital, Harvard Medical School, United States
- University of Oxford, United Kingdom
- University of Rochester School of Medicine & Dentistry, United States
- Massachusetts General Hospital, Harvard Medical School, United States
Figures
Figure 1
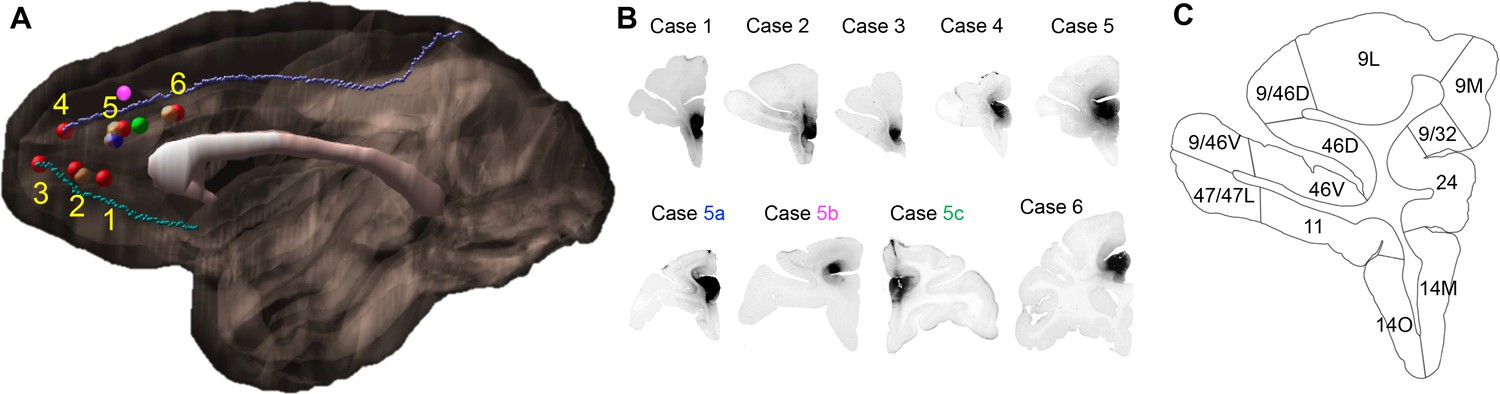
Injection sites and cortical area definition.
(A) Locations of the 9 out of 16 rACC injections that were selected for stereology analysis. Six cases (red) were analyzed as the main result and the additional three (blue = 5a, pink = 5b, green = 5c) as control. The numbering of cases followed the longitudinal axis of the cingulate gyrus. Cases not used for stereology due to the overlap with sites at the same location were colored beige. The cortex of the right hemisphere is shown in semi-transparent brown, the corpus callosum in white, and the cingulate sulcus and rostral sulcus in purple and cyan. (B) Photomicrographs to show the histology of each injection site. (C) Section outline of FC areas on an example slide. The borders between areas were hand-drawn following the atlas by Paxinos et al. (2000).
Figure 2
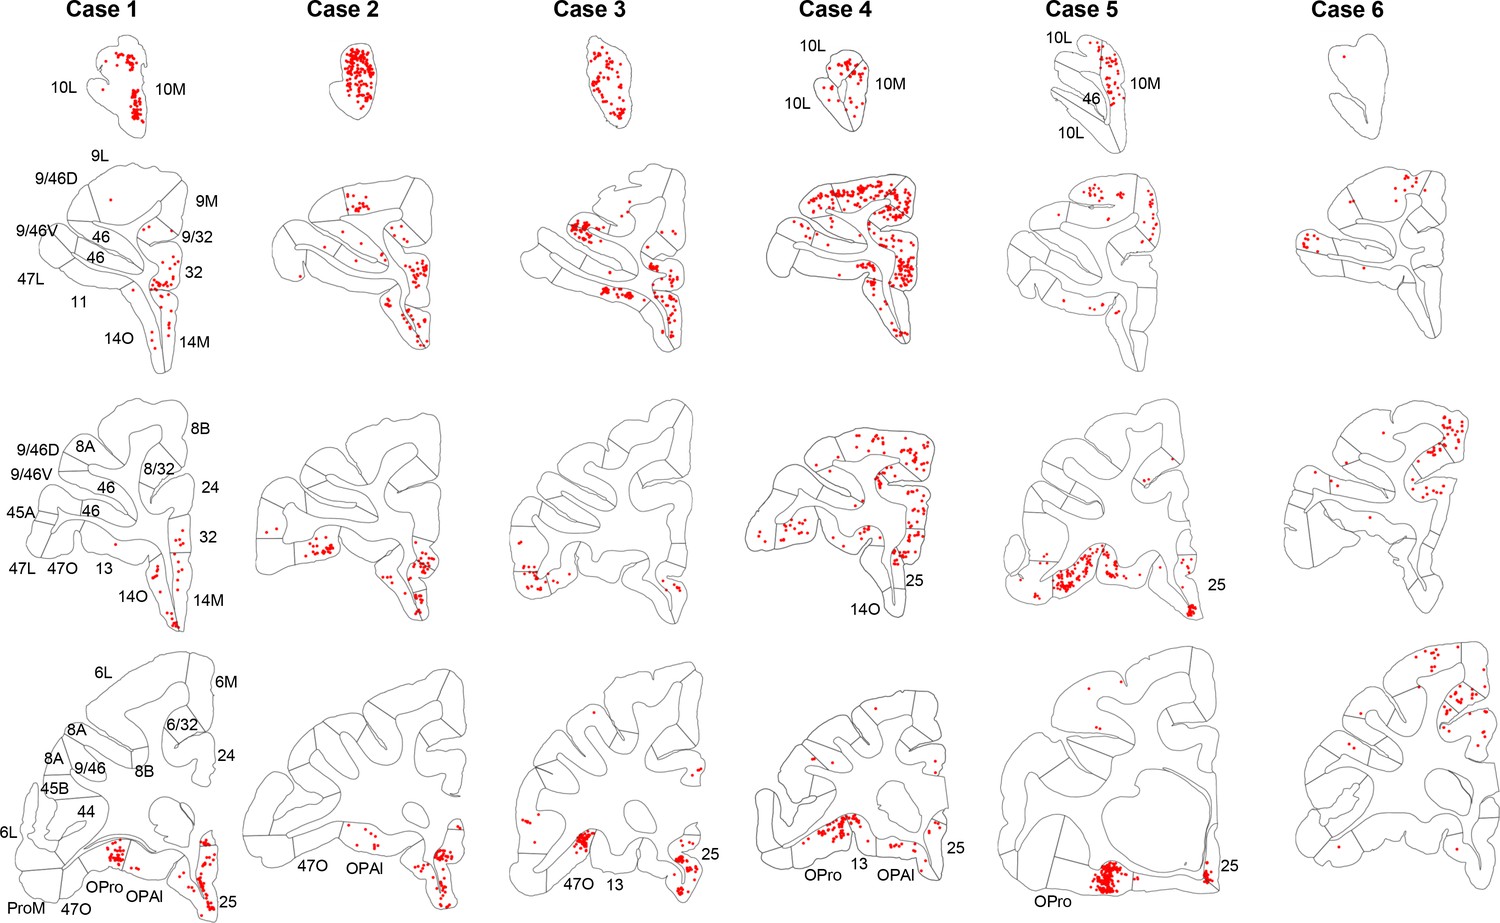
Retrogradely labeled cells (red) in cases 1–6.
Each column contains rostral to caudal coronal sections from one case. Sections of the same row have matching locations along the rostro-caudal axis. FC areas are labeled in the first column. Areas not matching the parcellation in the first column were labeled additionally on the corresponding sections.
Figure 3

Cumulative percent cell count across areas in cases 1–6.
Cutoff remarks: green line = 50%, red line = 75%, gray line = 100%. Areas after 100% are in a random order. The slope of each curve indicates deviation from a uniform distribution (steeper slope = further deviation).
Figure 4
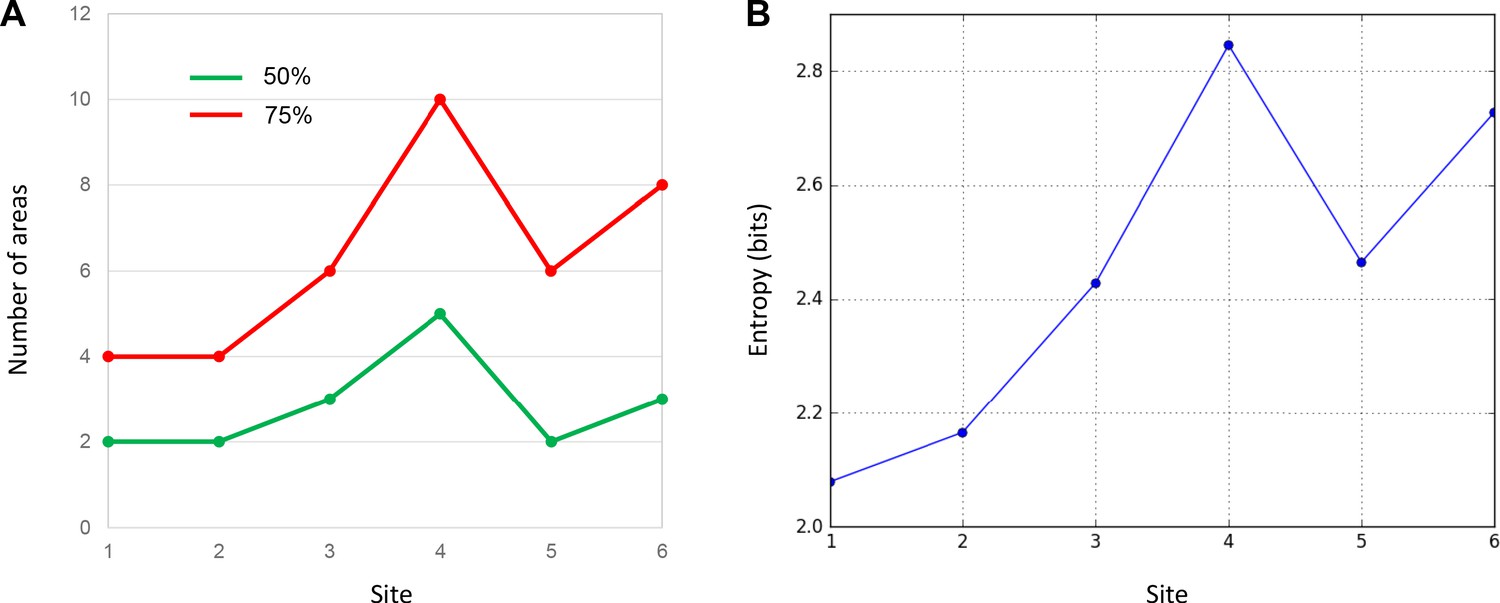
Quantitative comparison of cell distributions in cases 1–6.
(A) The number of areas that contributed 50% (green) and 75% (red) of inputs in each case. The highest number was found in case 4. (B) The entropy of cell distribution in each case. Higher entropy corresponds to less deviation from the uniform distribution, that is more evenly distributed labeled cells across areas. The highest entropy was in case 4.
Figure 5
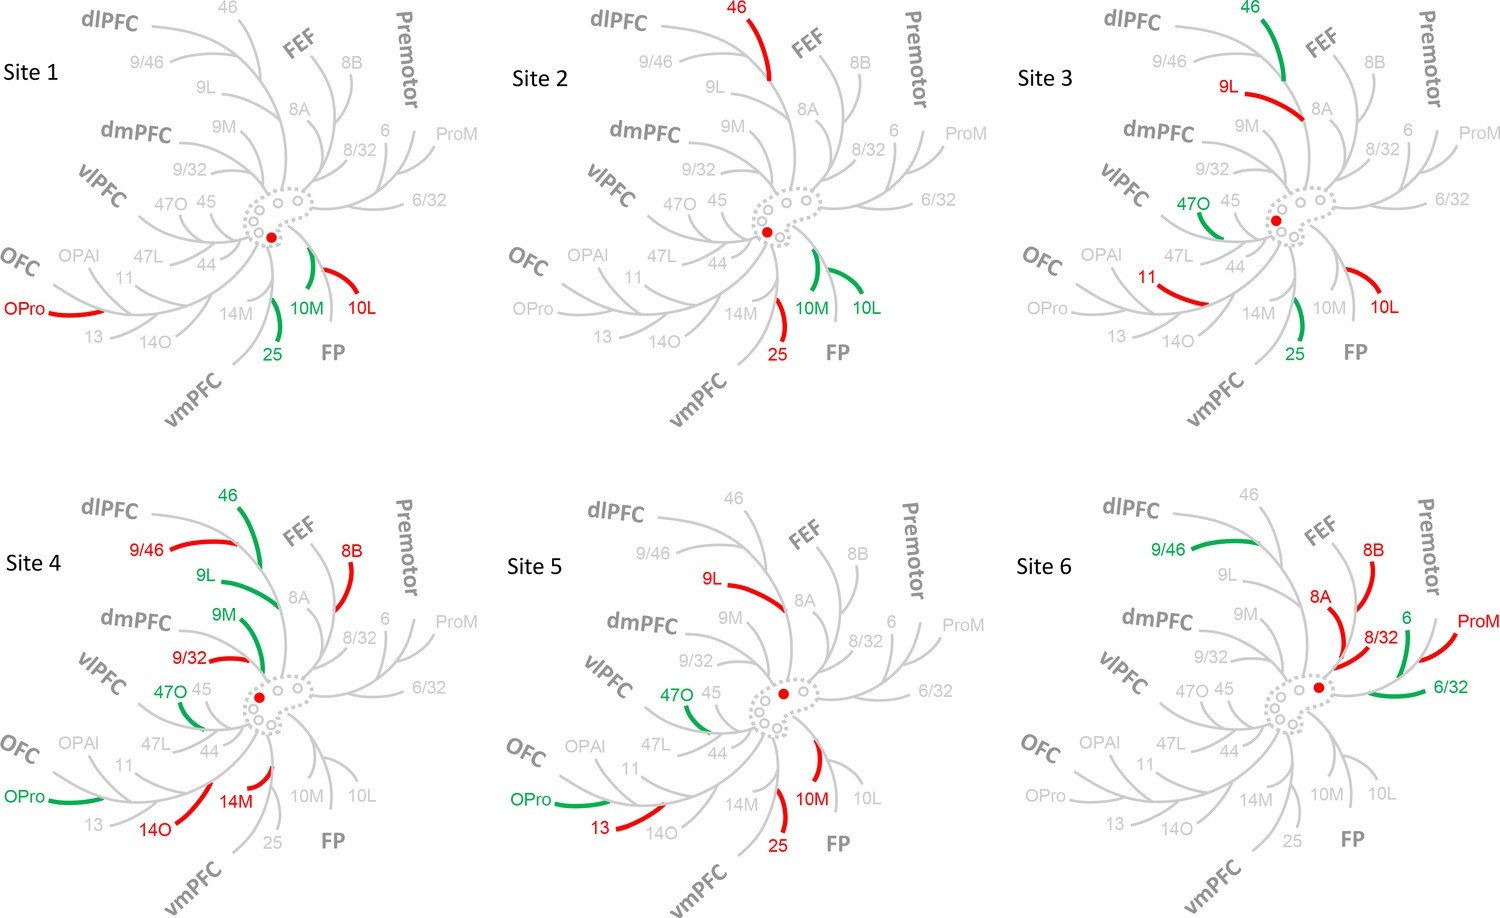
Schematic illustration of the FC regions with strong projections in each case.
The dashed contour represents the rACC and the circles injections of cases 1–6. The filled circle marks the case being shown. Colored branches represent brain areas that accounted for 75% cell counts in each case (green = adds up to 50%; green + red = adds up to 75%). The most extensive FC regions with strong input was found in case 4.
Figure 6
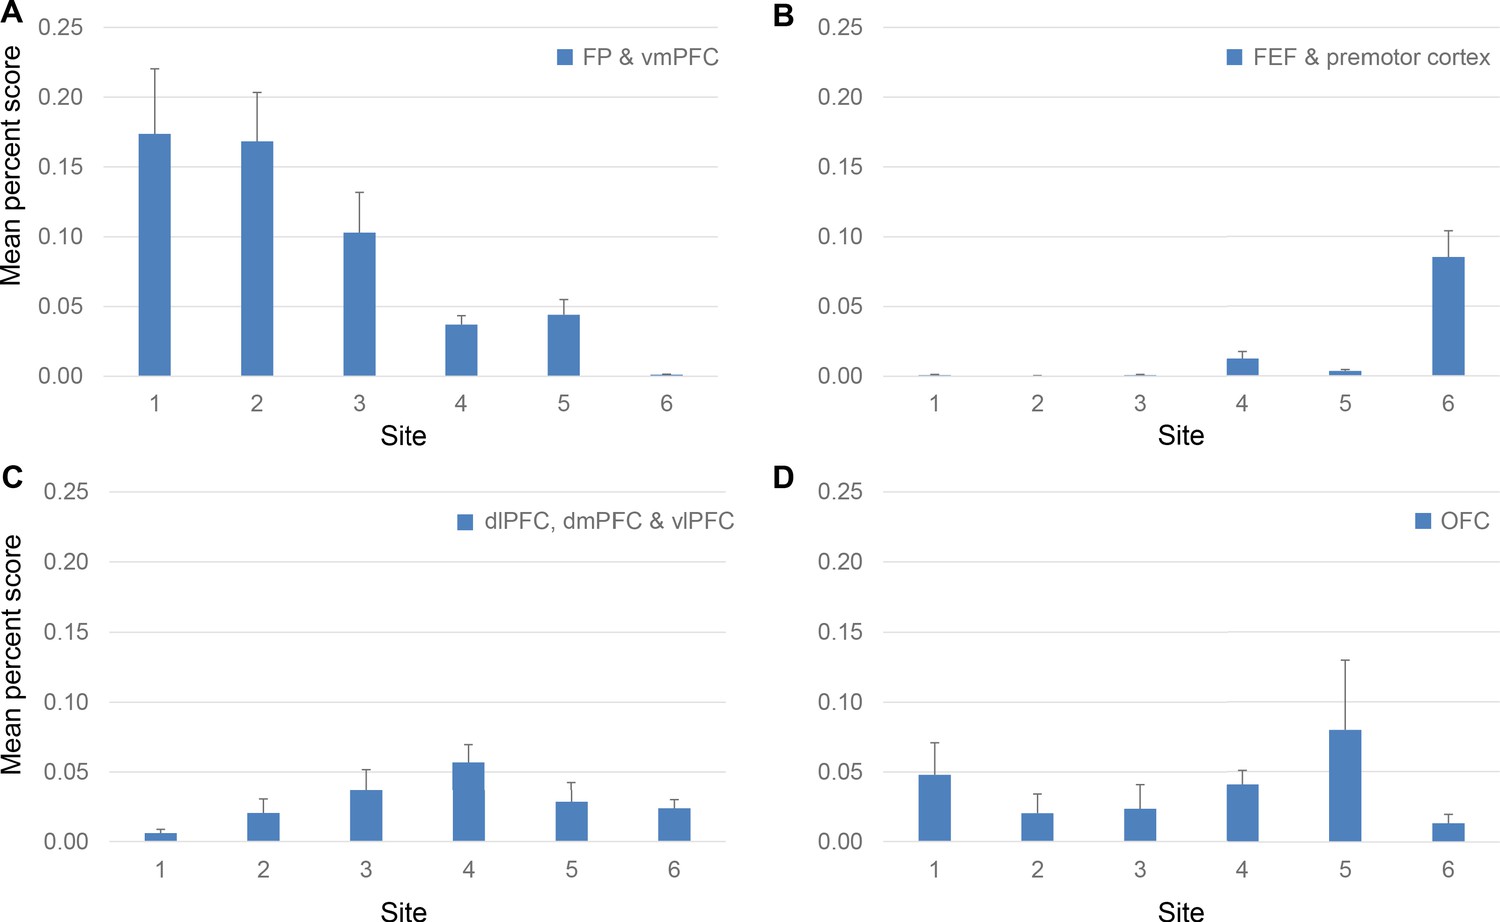
Projection strength from different FC regions at each site.
Percent scores of inputs from (A) FP and vmPFC, (B) FEF and premotor cortex, (C) dlPFC, dmPFC and vlPFC and (D) OFC are shown in separate panels. In each panel, the percent scores of areas in the corresponding regions were averaged. The mean and standard error across areas are shown for each site. The mean percent score of FP and vmPFC was greater at sites 1–3 than at sites 4–6; that of FEF and premotor cortex was lower at sites 1–3 than at sites 4–6. The mean percent score of dlPFC, dmPFC and vlPFC gradually increases from site 1–4 and decreases from site 4–6. There was no consistent pattern in the OFC percent scores across sites.
Figure 7 with 2 supplements

Projection patterns of the control cases 5a and 5b.
(A) Cumulative percent cell count across areas. Cutoff remarks: green line = 50%, red line = 75%, gray line = 100%. Areas after 100% are in a random order. (B) Illustration of the FC regions with strong projections following the same schema as in Figure 5. Red triangle marks the location of the injection.
Figure 7—figure supplement 1

Percent scores of retrogradely labeled cells were not dominated by the size of the injection site or that of the FC areas.
(A) Percent scores of labeled cells projecting to each site were not determined by the size of FC areas. The size was measured as the volume of each area divided by the total volume of all areas. Colors mark different sites. (B) Total number of labeled cells in each case.
Figure 7—figure supplement 2
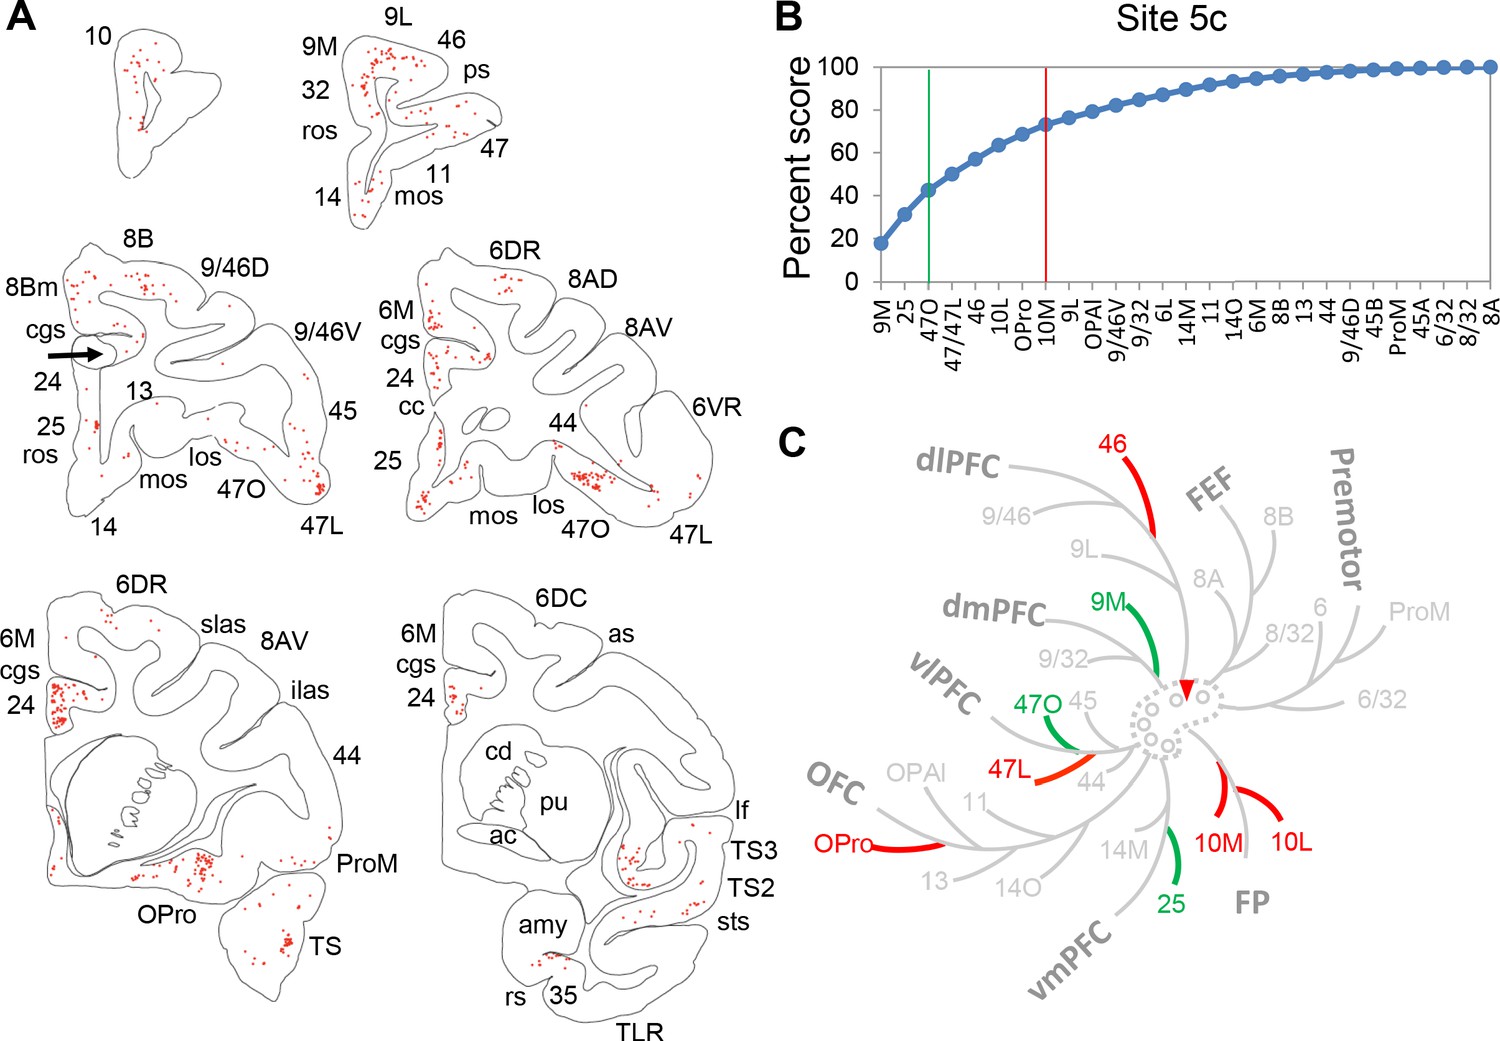
Projection patterns from the FC areas to control site 5 c.
(A) Coronal slides matching those shown in Morecraft et al. (2012) for case 3. Each red dot represents a labeled cell. Arrow points to the injection site. (B) Cumulative percent cell counts across FC areas. Cutoff remarks: green line = 50%, red line = 75%, gray line = 100%. Areas after 100% are in a random order. (C) Illustration of the FC regions with strong projections following the same schema as in Figure 5. Red triangle marks the location of the injection.
Figure 8
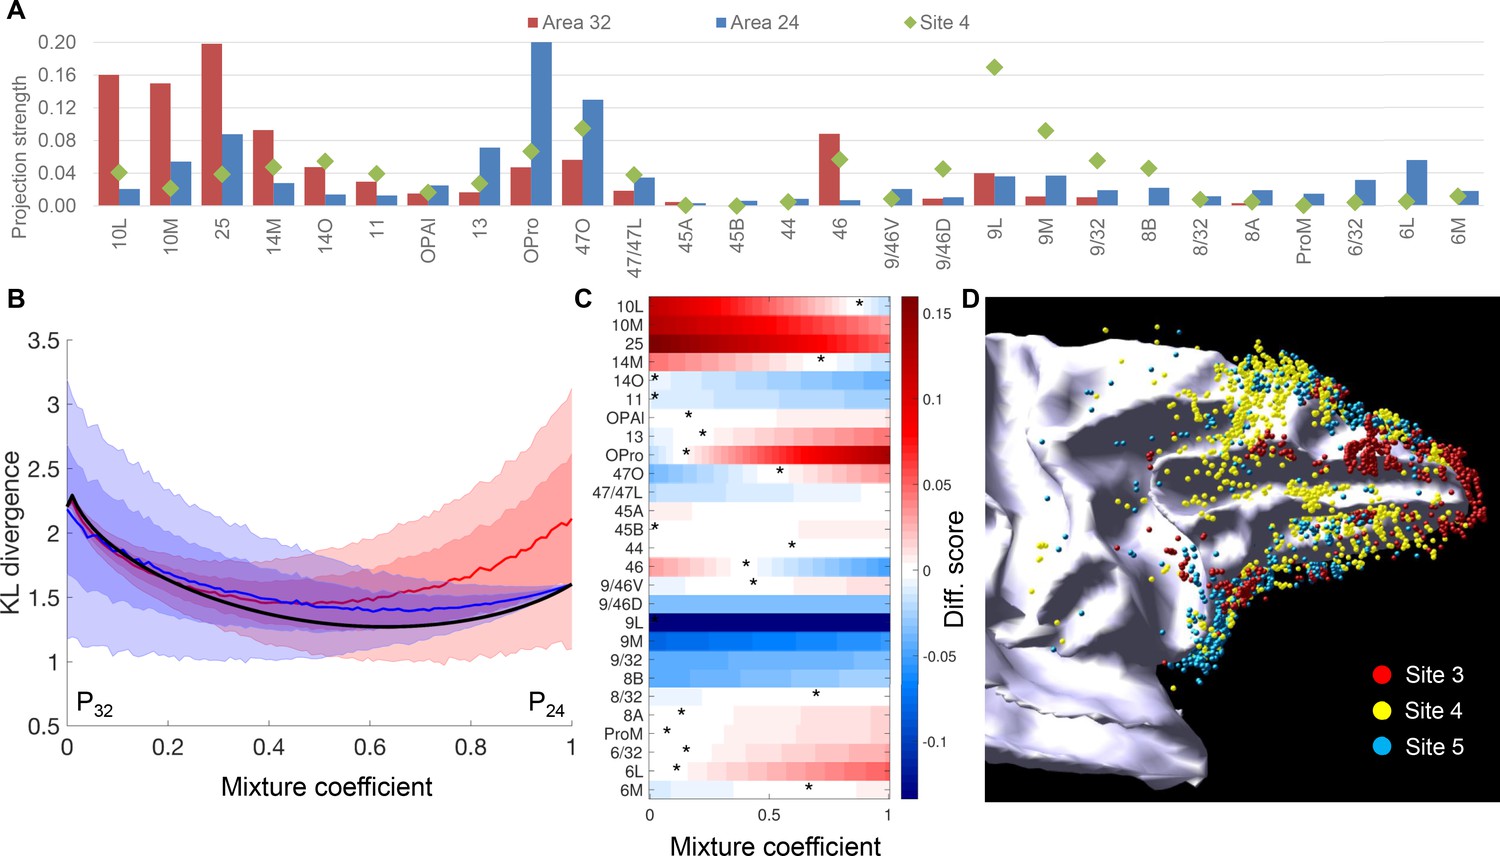
Comparison of projections to site 4 with those to areas 32 and 24.
(A) Projection strength across FC areas. Site 4: projection strength = percent cell count; area 32: projection strength = averaged percent cell count across sites 1–3; area 24: projection strength = averaged percent cell count across sites 5 and 6. (B) Comparison of site 4 cell counts to mixtures of connectivity profiles of nearby areas 32 and 24. The comparison uses the symmetric Kullback-Leibler divergence as a measure of distance between the normalized cell counts histograms. Although the distance is minimized for a mixture of approximately 2/3-1/3, this mixture is indistinguishable from mixing the distributions of areas 32 or 24 with a uniform distribution (shaded areas show mean +1 std (dark) and 2std (light) calculated with 10000 histograms of a uniform distribution). (C) Colors show the difference between the percent counts of site 4 compared to a linear mixture of areas 32 and 24. Optimal mixtures for individual target areas, corresponding to the color white, shows that the optimal mixture coefficient is variable across areas, but seven areas do not have an optimum (all red or all blue). (D) A 3D model of retrogradely labeled cells of sites 3, 4 and five on the white matter surface.
Figure 9 with 1 supplement
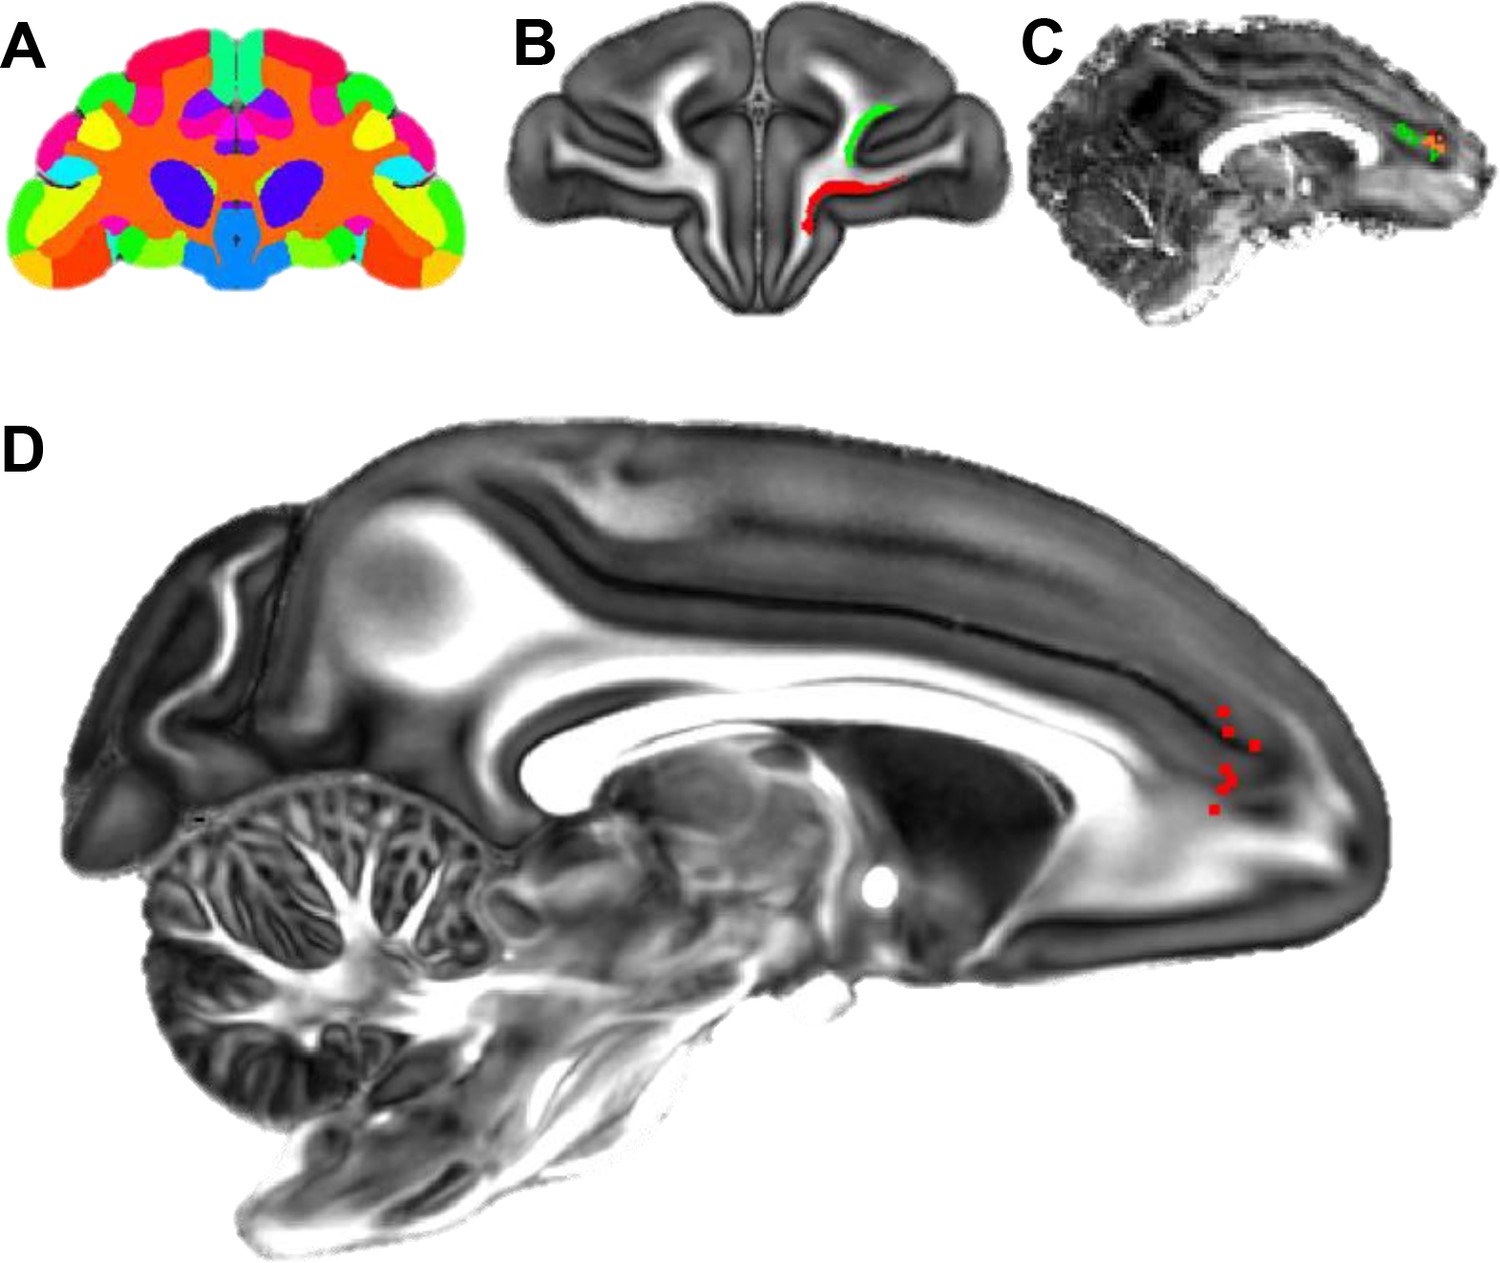
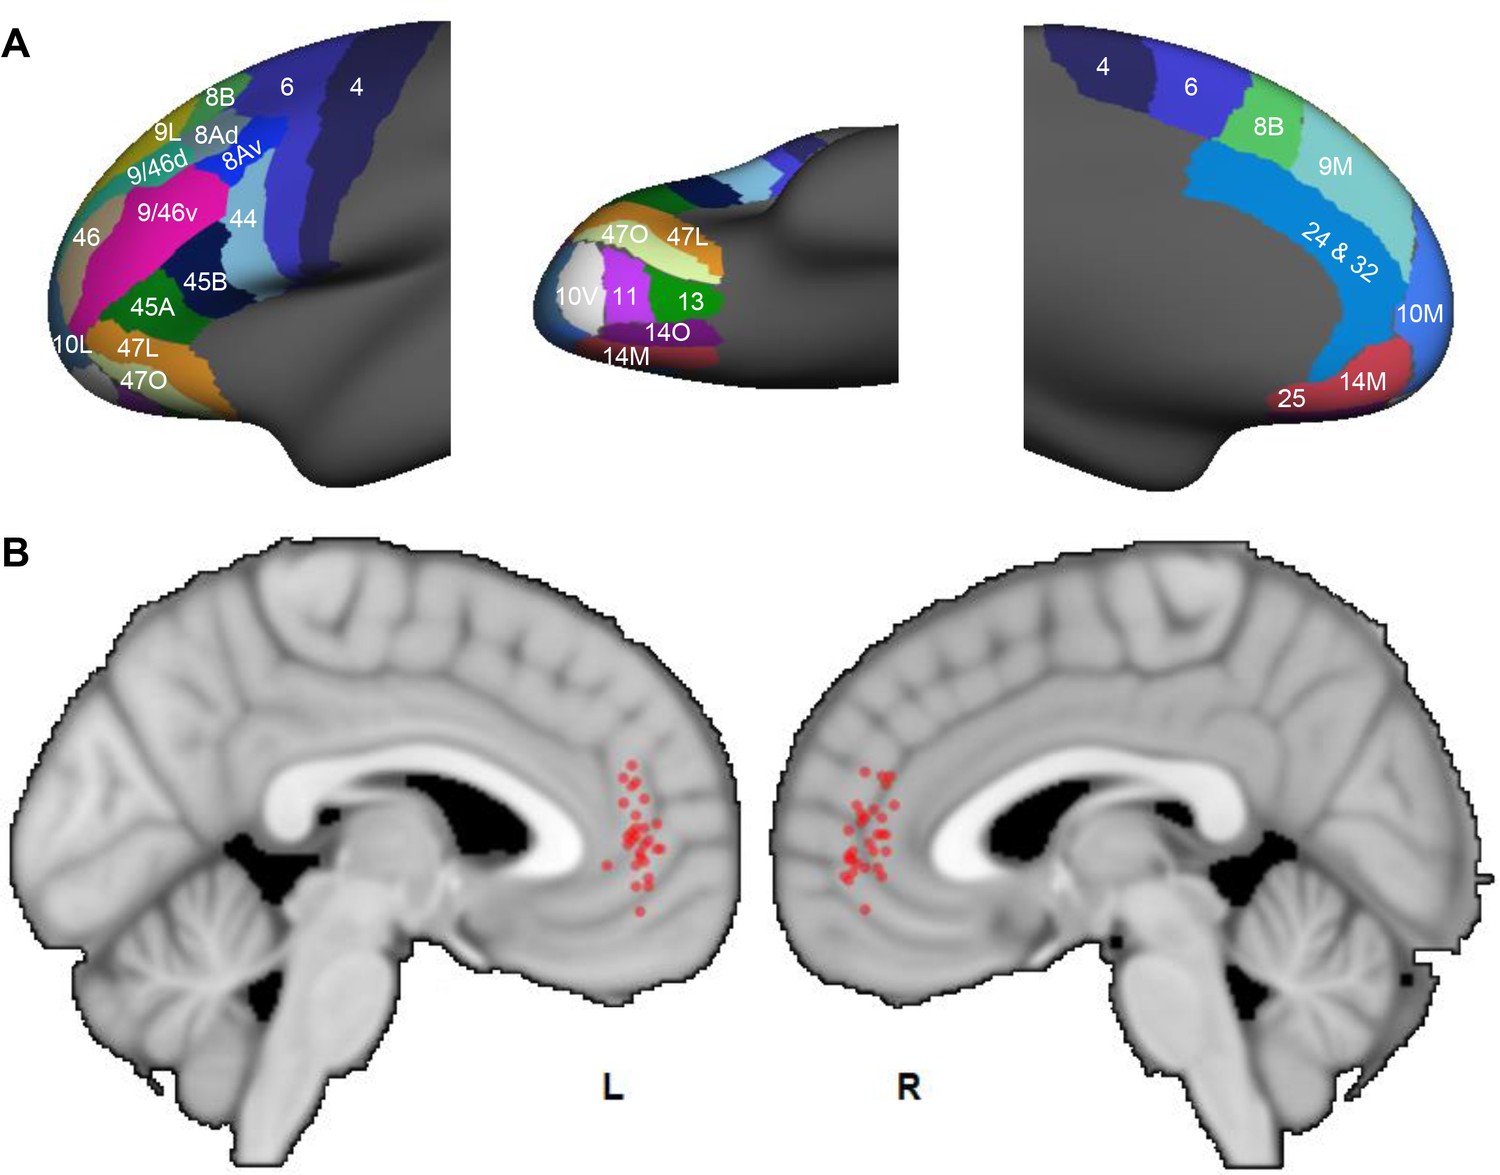
Localization of the hub region in the monkey rACC using dMRI tractography.
(A) A coronal section illustrating the Paxinos atlas in the dMRI space provided by Duke University. (B) A coronal section of the atlas brain showing two example seed masks for areas 11 (red) and 46D (green). (C) A sagittal section of an individual monkey brain showing the probabilistic streamline terminals in the rACC, separately for the seeds in area 11 (red) and 46D (green). Voxels with overlapping terminals were in orange. (D) A sagittal section showing the localized hub in seven individual monkeys. Each red dot marks the center of the hub region in one monkey. The center of the hub was defined by the voxel with the highest weighted-sum of probabilistic streamlines from all 29 seeded areas.
Figure 9—figure supplement 1
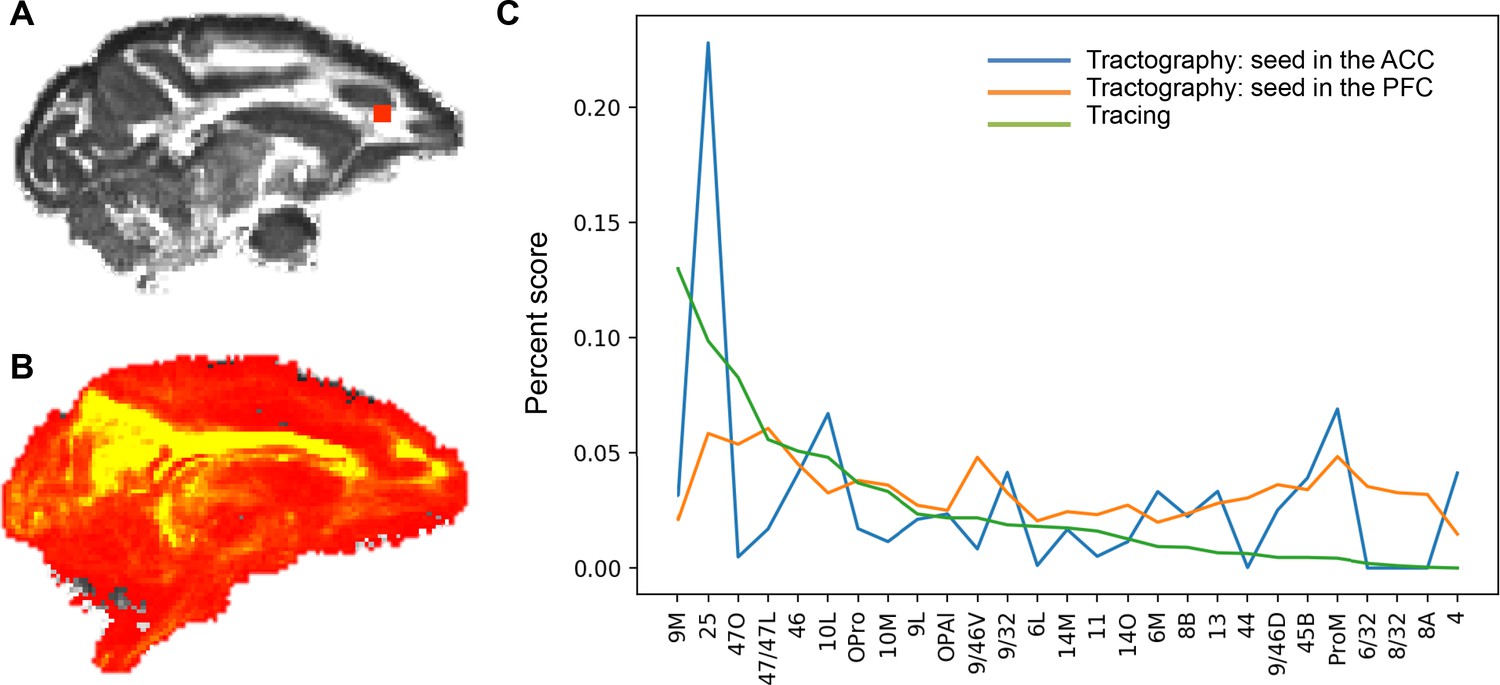
Difference in the tract strength pattern due to seeding procedures.
(A) A seed mask in the rACC. (B) Probabilistic map of the streamlines from the rACC seed to all the other voxels in the brain, showing the dominant high values in the cingulum bundle. (C) Comparison of the probabilistic streamline distributions with the tract tracing result. The percent score for tracing is based on cell counts, and that for tractography is based on the tract density between the seed and the target masks (values in the fdt_path output by FSL). The tract strength by seeding the FC areas was more correlated (Pearson’s coefficient = 0.42, p<0.05) with the tract tracing result than that by seeding the rACC (Pearson’s coefficient = 0.17, p>0.05).
Figure 10
Probabilistic streamlines converging in the rACC in human dMRI.
(A) Parcellation of the FC areas on the fsaverage template (FreeSurfer 4.5), following Petrides et al. (2012). The FreeSurfer labels are available in Supplementary file 1. (B) Sagittal sections showing the localized hub across individuals. Each red dot marks the center of the hub region in one subject. The center of the hub was defined by the voxel with the highest weighted-sum of probabilistic streamlines from all seeded FC areas.
Tables
Table 1
List of the 27 frontal areas.
https://doi.org/10.7554/eLife.43761.003| FP | vmPFC | dmPFC | OFC | vlPFC | dlPFC | FEF | Premotor |
|---|---|---|---|---|---|---|---|
| 10L | 14M | 9M | 14O | 47L | 9/46V | 8A | 6L |
| 10M | 25 | 9/32 | 11 | 47O | 9/46D | 8B | 6M |
| 13 | 44 | 46 | 8/32 | 6/32 | |||
| OPro | 45A | 9L | ProM | ||||
| OPAl | 45B |
Table 2
Summary of the major FC inputs to each site.
https://doi.org/10.7554/eLife.43761.007| Site | # areas contributing 50% inputs | Regions contributing 50% inputs | # areas contributing 75% inputs | Regions contributing additional 25% inputs |
|---|---|---|---|---|
| 1 | 2 | FP, vmPFC | 4 | FP, OFC |
| 2 | 2 | FP | 4 | vmPFC, dlPFC |
| 3 | 3 | vmPFC, vlPFC, dlPFC | 6 | FP, OFC, dlPFC |
| 4 | 5 | OFC, vlPFC, dmPFC, dlPFC | 10 | vmPFC, OFC, dmPFC, dlPFC, FEF |
| 5 | 2 | OFC, vlPFC | 6 | FP, vmPFC, OFC, dlPFC |
| 6 | 3 | dlPFC, FEF, Premotor | 8 | FEF, Premotor |
Additional files
-
Supplementary file 1
A cytoarchitecture-based surface parcellation of the frontal cortex.
- https://doi.org/10.7554/eLife.43761.017
-
Transparent reporting form
- https://doi.org/10.7554/eLife.43761.018
Download links
A two-part list of links to download the article, or parts of the article, in various formats.
Downloads (link to download the article as PDF)
Open citations (links to open the citations from this article in various online reference manager services)
Cite this article (links to download the citations from this article in formats compatible with various reference manager tools)
A connectional hub in the rostral anterior cingulate cortex links areas of emotion and cognitive control
eLife 8:e43761.
https://doi.org/10.7554/eLife.43761


