Influenza A virus surface proteins are organized to help penetrate host mucus
- University of California, Berkeley, United States
- Lawrence Berkeley National Laboratory, United States
- Chan Zuckerberg Biohub, United States
Figures
Figure 1 with 2 supplements
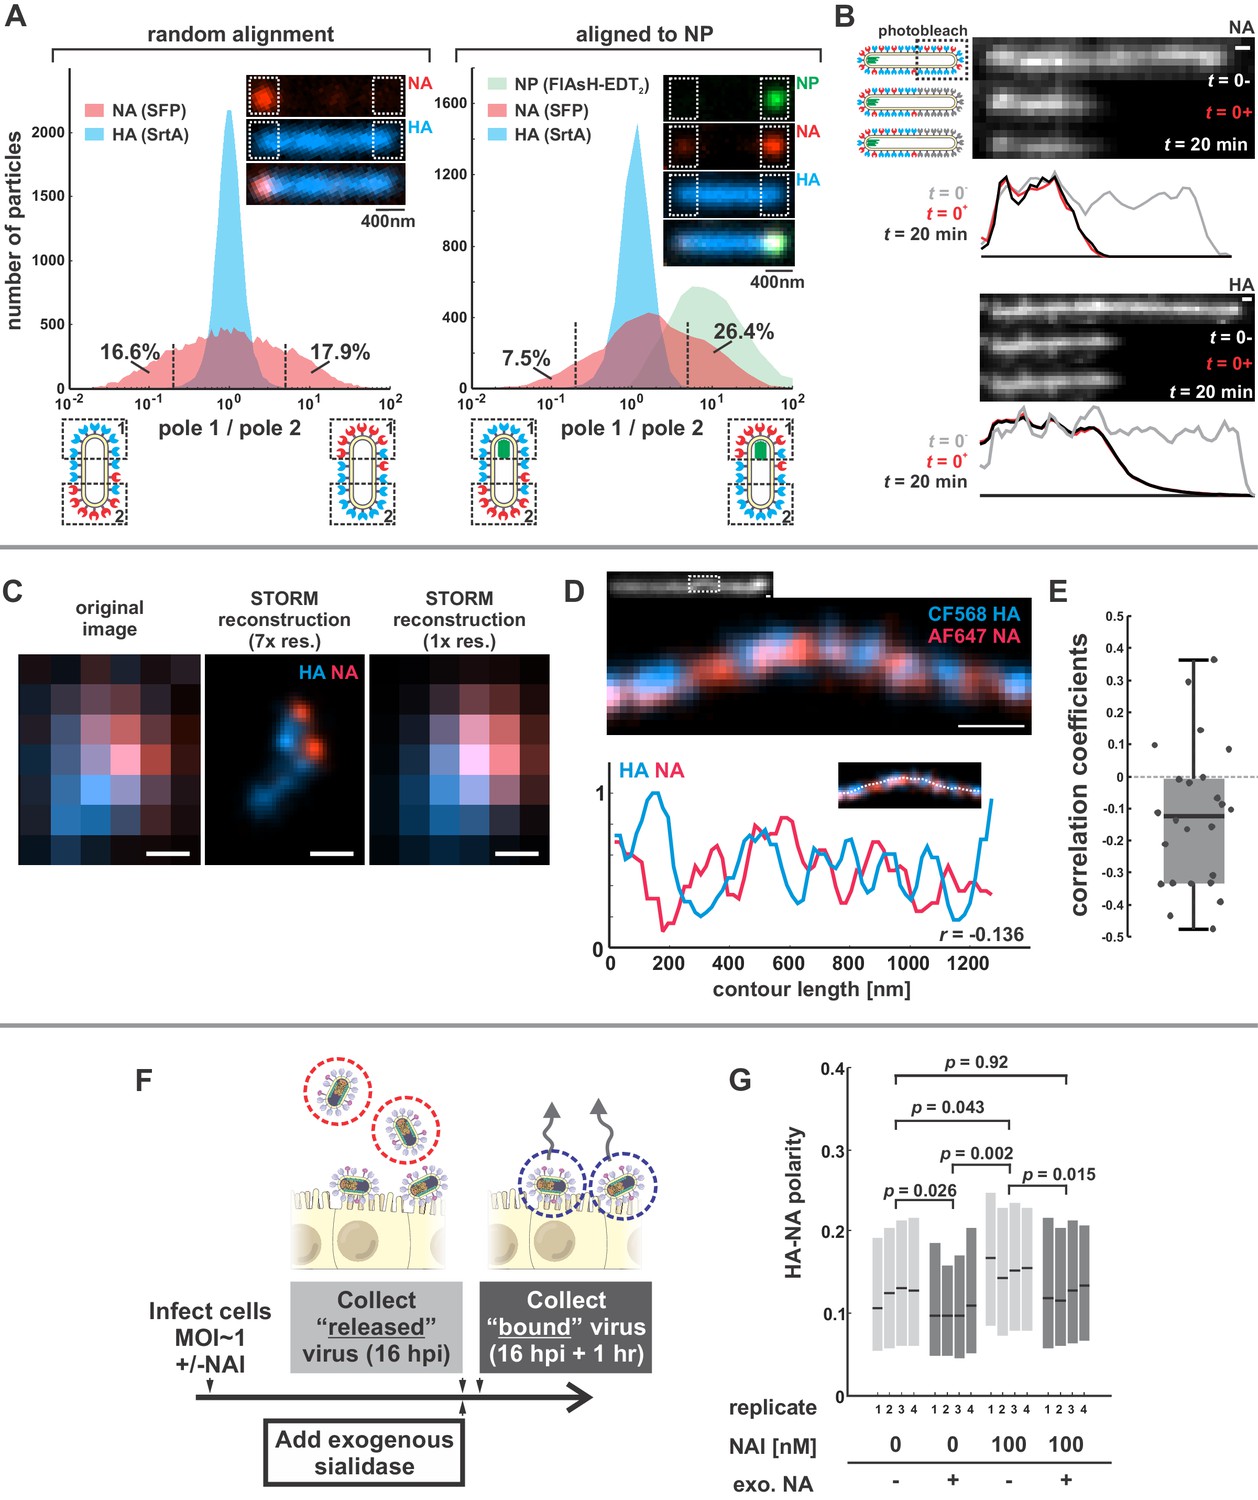
Organization of the IAV envelope in filamentous virus particles.
(A) Abundance of viral proteins at one viral pole relative to the other, measured as the ratio of intensities within ~400 nm of either end of the virus. The plot to the left compares HA and NA intensities for 20344 filamentous particles of at least ~1 μm in length. Approximately one third of filamentous particles have NA intensities five-fold higher on one pole than the other, as indicated by the vertical dashed lines (distributions are symmetric in this case because poles are designated randomly). Inset images show a particle with NA enrichment of ~5.6 fold (~31st percentile of particles). The plot to the right shows the same comparison for particles aligned to their NP-foci, designated as pole 1 (distributions are determined from a total of 4805 particles with polarized NP distributions). The prevalence of particles with NA ratios > 1 indicates a tendency for NA to be enriched at the virus’s genome-containing pole. Inset images show a particle with NA enrichment of ~3.3 fold (~48th percentile of particles based on NA polarity). (See also Figure 1—figure supplement 1).(B) Photobleached fluorescent NA (top) and HA (bottom) on filamentous particles show no recovery after 20 min, indicating that NA and HA are immobilized in the viral membrane (scale bar = 500 nm). Data is representative of n = 8 viruses (NA) and n = 5 viruses (HA) from three biological replicates. (C) STORM reconstructions at ~30 nm resolution of a pair of viruses unresolveable by diffraction-limited microscopy, each showing the characteristic localization of NA at one end of the virus (scale bar = 200 nm). (D) STORM reconstructions of a filamentous virus at ~30 nm resolution reveal clusters of HA and NA which partly exclude each other, illustrated by the inverse correlation in HA and NA intensities along the axis of the virus (scale bar = 200 nm). (E) Distribution of HA-NA spatial correlation coefficients from regions of 24 filamentous particles following reconstruction at ~30 nm resolution. (F) To compare populations of virus that are able to detach from infected cell to those that remain bound to the cell surface with or without NAIs, we collect virus in two separate stages: first, we harvest virus from media at 16hpi, followed by the addition of media supplemented with an exogenous, oseltamivir-resistant bacterial neuraminidase. After one hour of treatment with exogenous NA, we harvest virus that had previously remained bound to the cell surface. (G) Plot showing the HA-NA polarity of viruses released in the presence or absence of NAI and exogenous sialidase. Boxes show median values of HA-NA polarity and 25th-75th percentile ranges for each of four biological replicates, with between 499 and 2067 filamentous viruses each (p-values determined using a paired-sample T-test). See also Figure 1—source data 1.
-
Figure 1—source data 1
Matlab source data and code for Figure 1A and G.
- https://doi.org/10.7554/eLife.43764.005
Figure 1—figure supplement 1
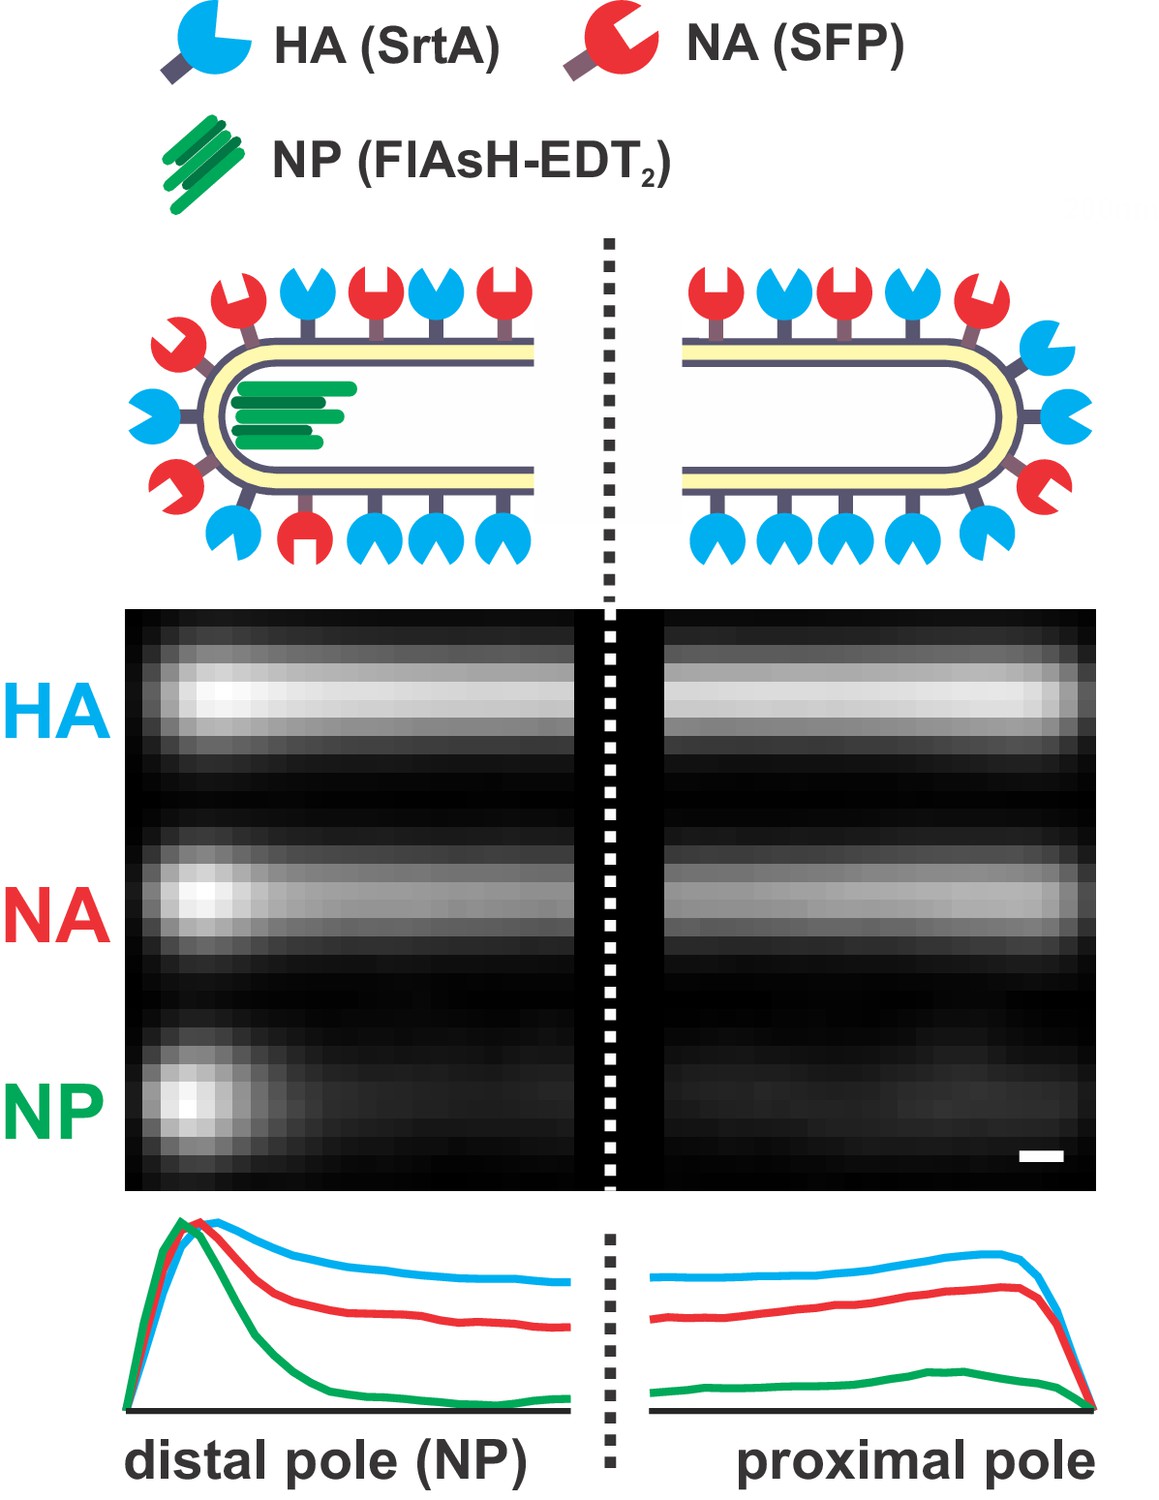
Distribution of HA, NA, and NP in filamentous particles.
A composite image of the poles of 540 filamentous viruses ≥ 4.5 μm in length with fluorescently labeled HA (SrtA), NA (Sfp), and NP (FlAsH-EDT2). Particles are aligned by the location of the viral genome (NP). On average, NA intensity at the NP-containing (‘distal’) pole of the virus is enriched ~ 2 x relative to rest of the virus after normalizing by HA intensity (scale bar = 200 nm).
Figure 1—figure supplement 2
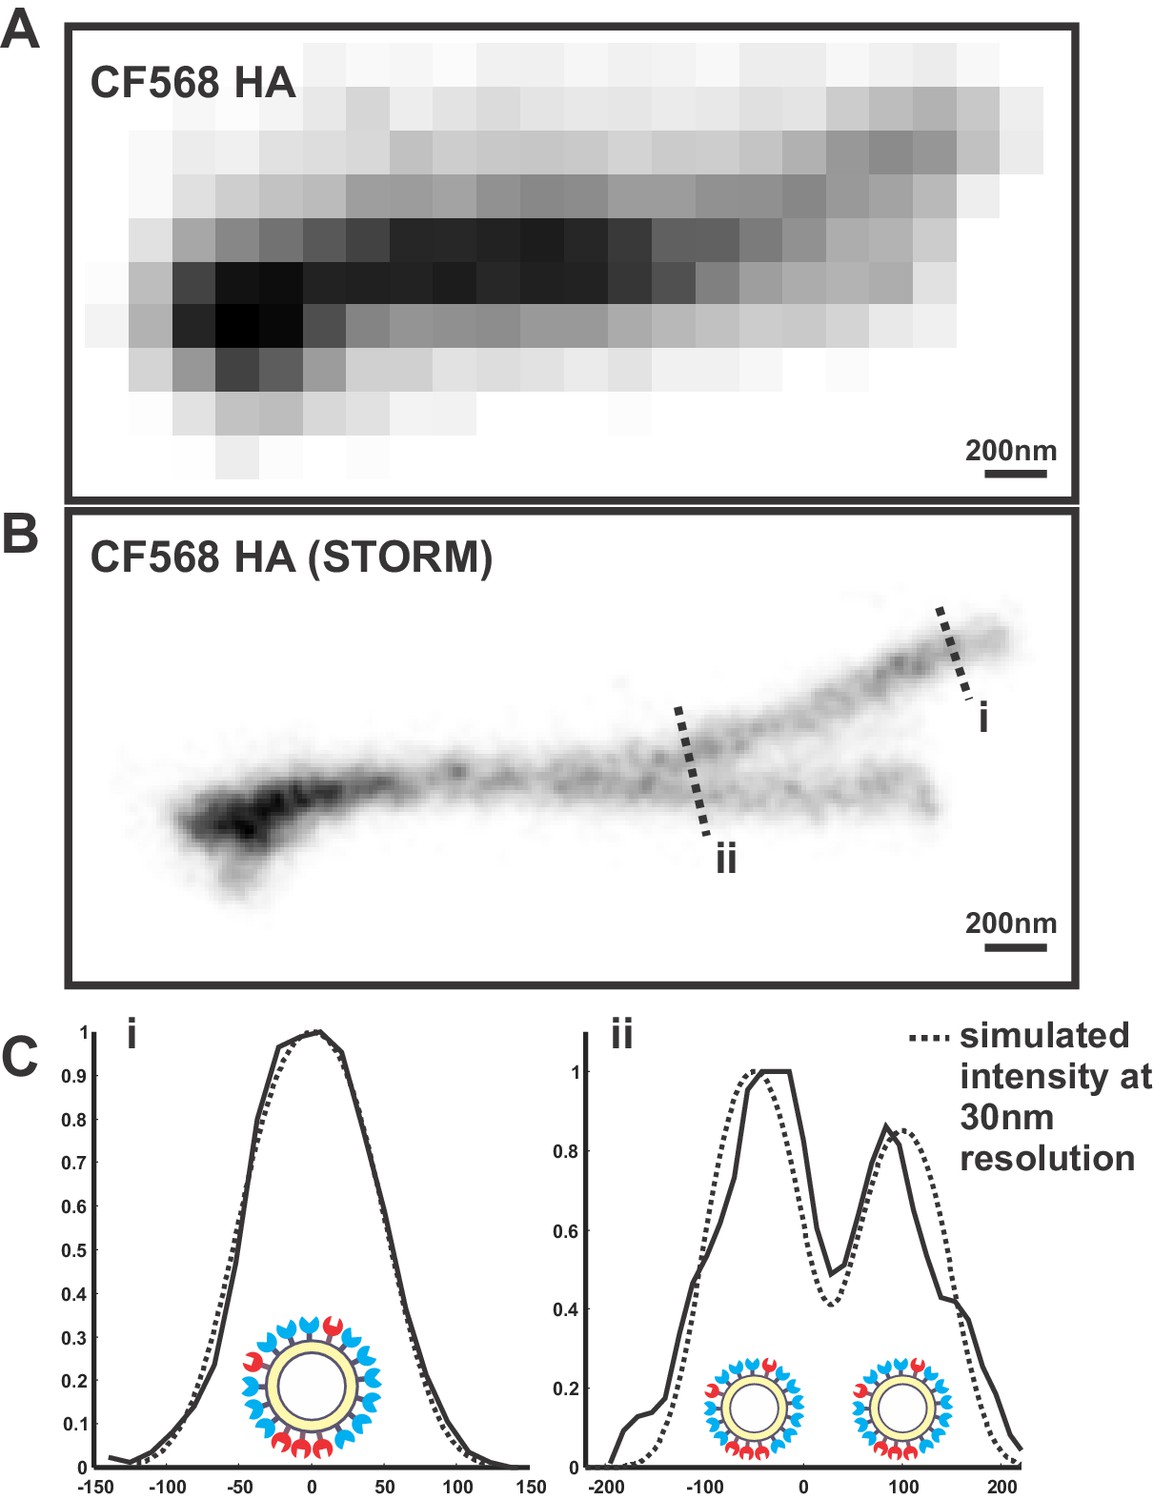
Determining the resolution of virus images reconstructed using STORM.
(A) Image of overlapping filamentous viruses acquired using diffraction-limited microscopy (shown with inverted contrast). (B) STORM reconstruction of the same image as in (A), with indicated cross sections i and ii. (C) To estimate the resolution of STORM reconstructions, we compare the collected STORM cross-sections of filamentous viruses (i and ii) to simulated cross-sections, where uniformly distributed molecules on the viral surface are each modeled as a gaussian whose standard deviation serves as a fit parameter. The standard deviation that yields the best fit with our data (~30 nm) provides an approximate resolution for our reconstructions.
Figure 2 with 1 supplement
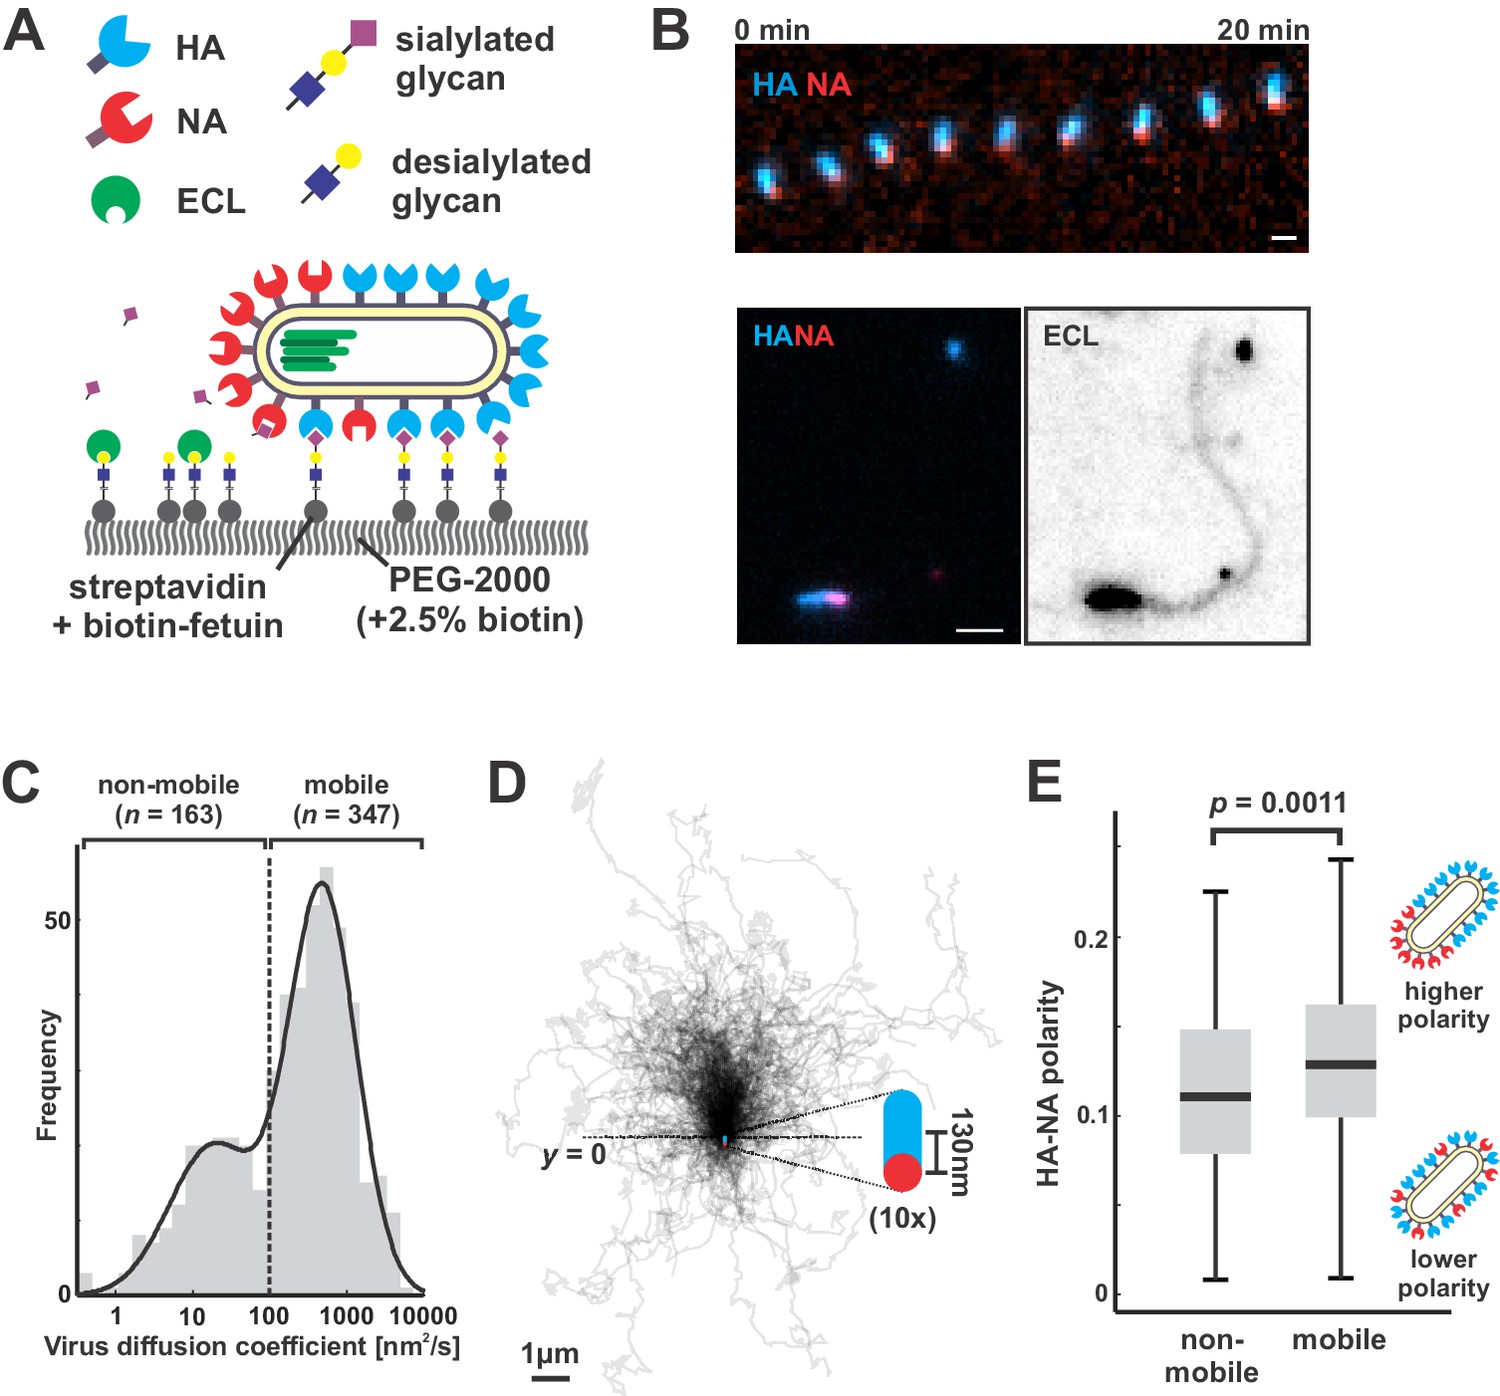
Filamentous IAV diffuses via a Brownian ratchet mechanism.
(A) Labeled viruses are placed on coverslips passivated with PEG2K and functionalized with biotinylated fetuin, which provides a high density of receptors for HA and substrates for NA that can be imaged using TIRF microscopy. (B) Time series of a virus migrating in the direction of its higher-HA pole (scale bar = 2 µm). Viruses exhibiting persistent motion on sialic acid-coated surfaces leave a trail of terminal galactose to which fluorescent ECL binds, indicating NA cleavage of receptors as the virus moves. (C) Distribution of virus diffusion coefficients determined by measuring the mean squared displacement versus time. Mobile particles are defined as those with diffusion coefficients > 100 nm2/s, corresponding to the more diffusive subset of the bimodally-distributed population. (D) Trajectories (measured from timelapse images) of n = 347 mobile viruses registered to their initial positions and aligned based on the orientation of the HA-NA axis. Blue and red dots at y = 0 show the median positions of HA and NA (with median separation of ~130 nm), respectively, across all viruses. Data is pooled from three biological replicates. (E) HA-NA organization correlates with virus mobility. Populations exhibiting little motion (‘non-mobile’) have significantly less polarized distributions of HA and NA than those that exhibit persistent directional mobility (quantification of n = 163 non-mobile and n = 347 mobile viruses combined from three biological replicates; boxes are centered on median values and span from 25th to 75th percentile; p-value calculated using a two-sample KS-test). See also Figure 2—source data 1.
-
Figure 2—source data 1
Matlab source data and code for Figures 2C, D and E.
- https://doi.org/10.7554/eLife.43764.008
Figure 2—figure supplement 1
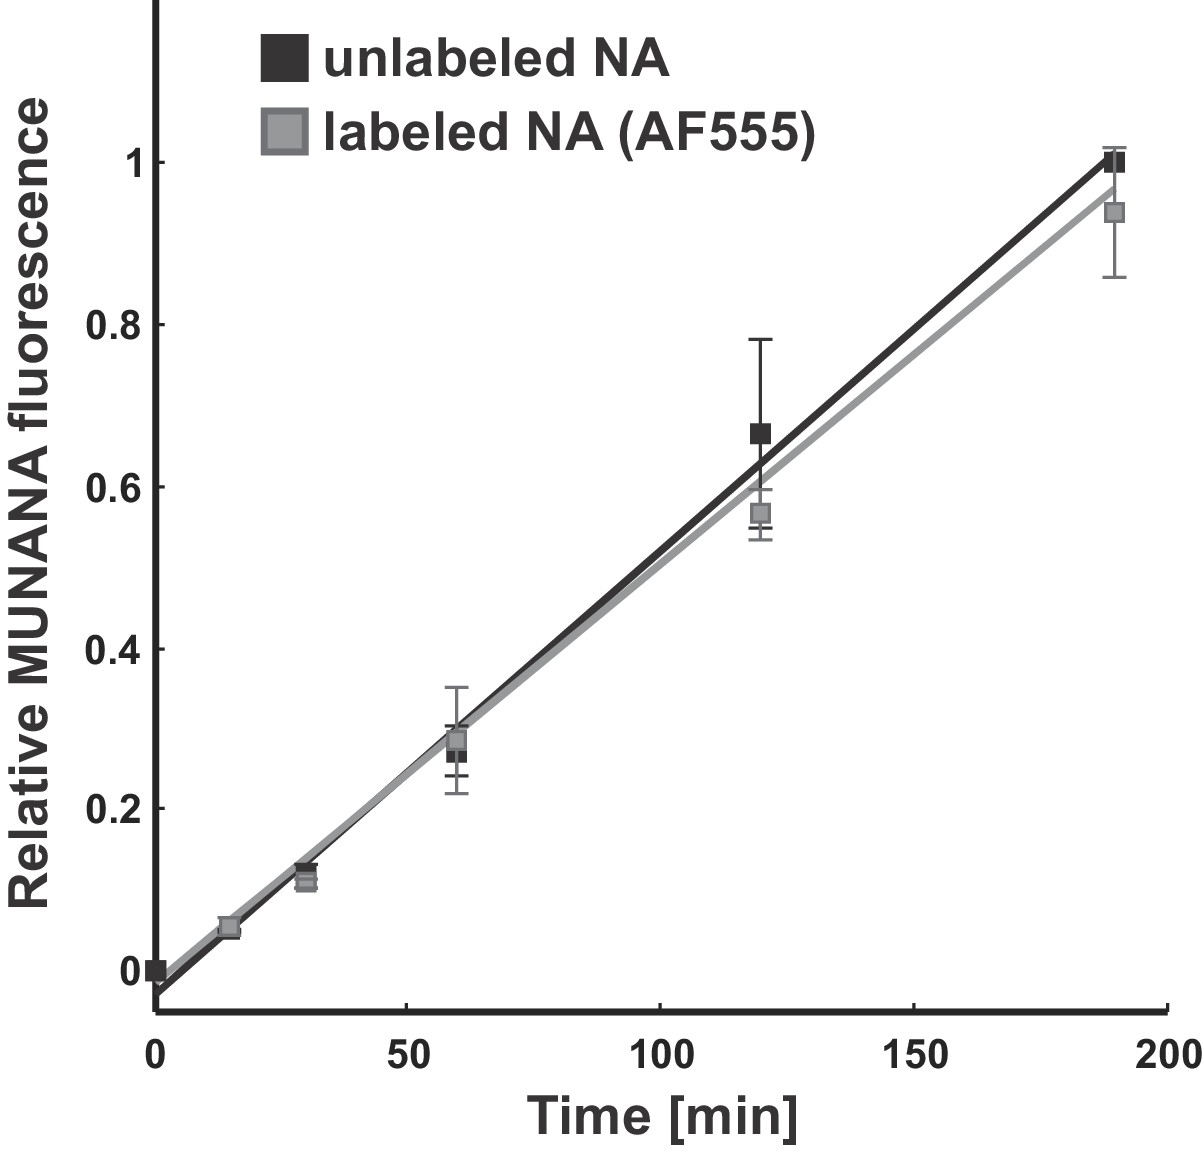
Effect of fluorescent labeling on NA activity.
The activity of viruses labeled with Alexa fluor 555 following the same protocol used for imaging experiments matches that of unlabeled samples. Data is from three biological replicates, normalized within each replicate to the MUNANA signal from unlabeled samples at the final timepoint. Under these labeling conditions, the efficiency of fluorophore attachment to NA is >50% (Vahey and Fletcher, 2019).
Figure 3 with 6 supplements
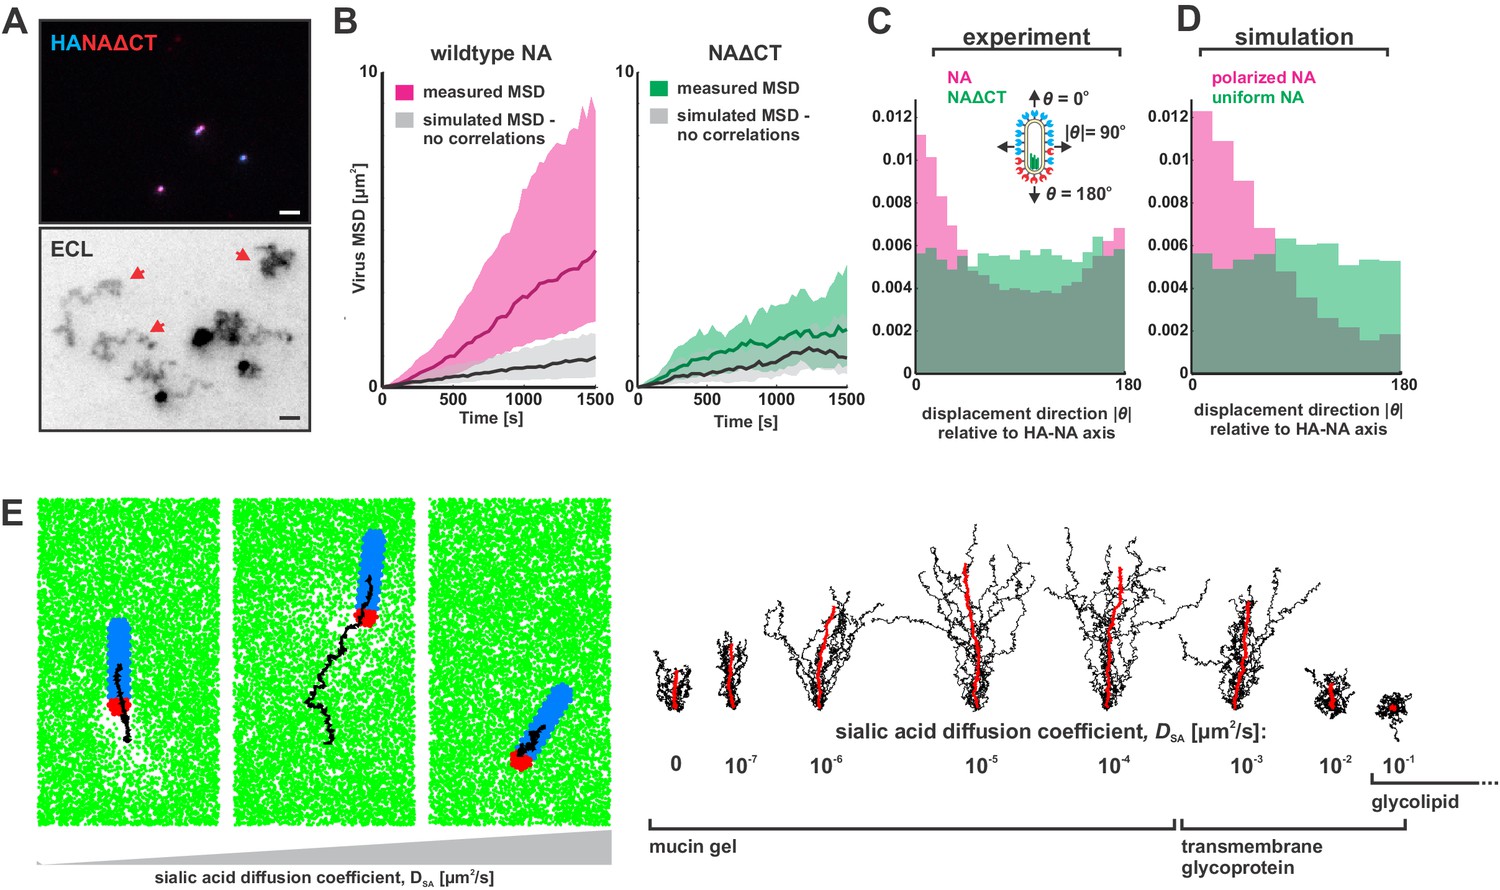
Organization of the IAV envelope and diffusion of sialic acid receptors determine persistence of directional mobility.
(A) NAΔCT virus create ECL tracks that appear less persistent than those generated by virus with wildtype NA. Red arrows indicate tracks where viruses have dissociated (scale bar = 2 µm). (B) Mean squared displacements (MSD) for mobile viruses with (left) and without (right) the NA cytoplasmic tail for an observation window of 1500 s. Measured MSDs (in magenta and green) are compared to MSDs from simulated random walks (gray) using the same step size and frequency but with uncorrelated direction. Dark lines show median MSDs, and shaded regions indicate the 25th to 75th percentile range. Data is pooled from three biological replicates. (C) Histogram of virus stepping angle relative to virus orientation for virus with wildtype NA (magenta) and NAΔCT (green). While wildtype viruses step in the direction of increasing HA roughly twice as frequently as they step in the opposite direction, virus with NAΔCT do not exhibit any orientational preference. Data is pooled from three biological replicates. (D) Quantification for n = 10 simulations of 250 nm viruses with uniform (green) or polarized (magenta) distributions of NA, showing the tendency of viruses to step preferentially along the viral axis only when NA is polarized. The model of an idealized virus is in general agreement with experimental results shown in (C) that include viruses with a wide variety of sizes and HA-NA organizations. (E) The effects of receptor (i.e. sialic acid) diffusion on virus motion. Allowing surface diffusion of sialic acid during simulations can enhance or suppress directional motion of viruses, depending on the receptor mobility and the catalytic rate of NA. Up to a diffusion coefficient of ~0.01 µm2/s, typical of a slowly diffusing membrane protein, a directional bias in virus diffusion is preserved. Trajectories show the results of 10 simulations for each condition in black, with the average is red. See also Figure 3—source data 1.
-
Figure 3—source data 1
Matlab source data and code for Figure 3B, C and D, Figure 3—figure supplement 2, and Figure 3—figure supplement 3.
- https://doi.org/10.7554/eLife.43764.017
Figure 3—figure supplement 1
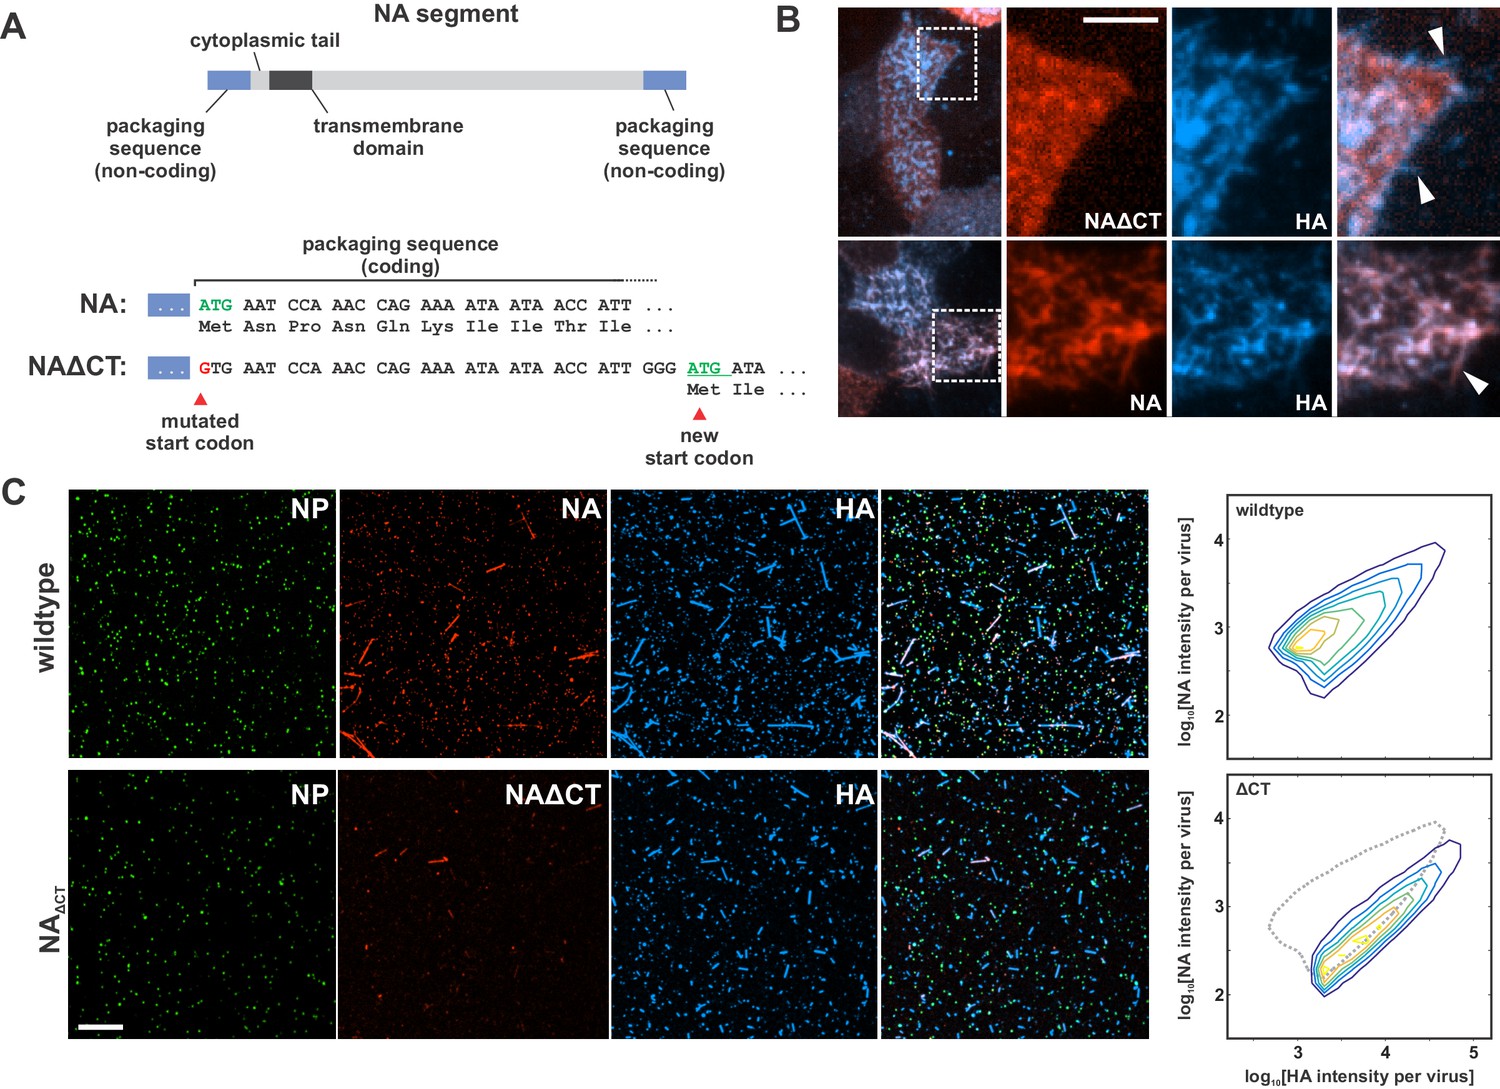
Characterization of influenza A virus lacking the NA cytoplasmic tail (NAΔCT).
(A) Construction of an NA segment lacking the N-terminal cytoplasmic tail. Mutating the initial methionine and inserting a new start codon following the coding regions important for vRNA packaging enables the rescue of recombinant virus. (B) NAΔCT virus is expressed on the cell surface but is incorporated into budding viruses (indicated with arrow) less efficiently than wildtype NA (lower panels) (scale bar = 5 µm). (C) Imaging released virions supports this observation, with NA incorporation per virion reduced ~ three fold with the deletion of the cytoplasmic tail (scale bar = 10 µm).
Figure 3—figure supplement 2
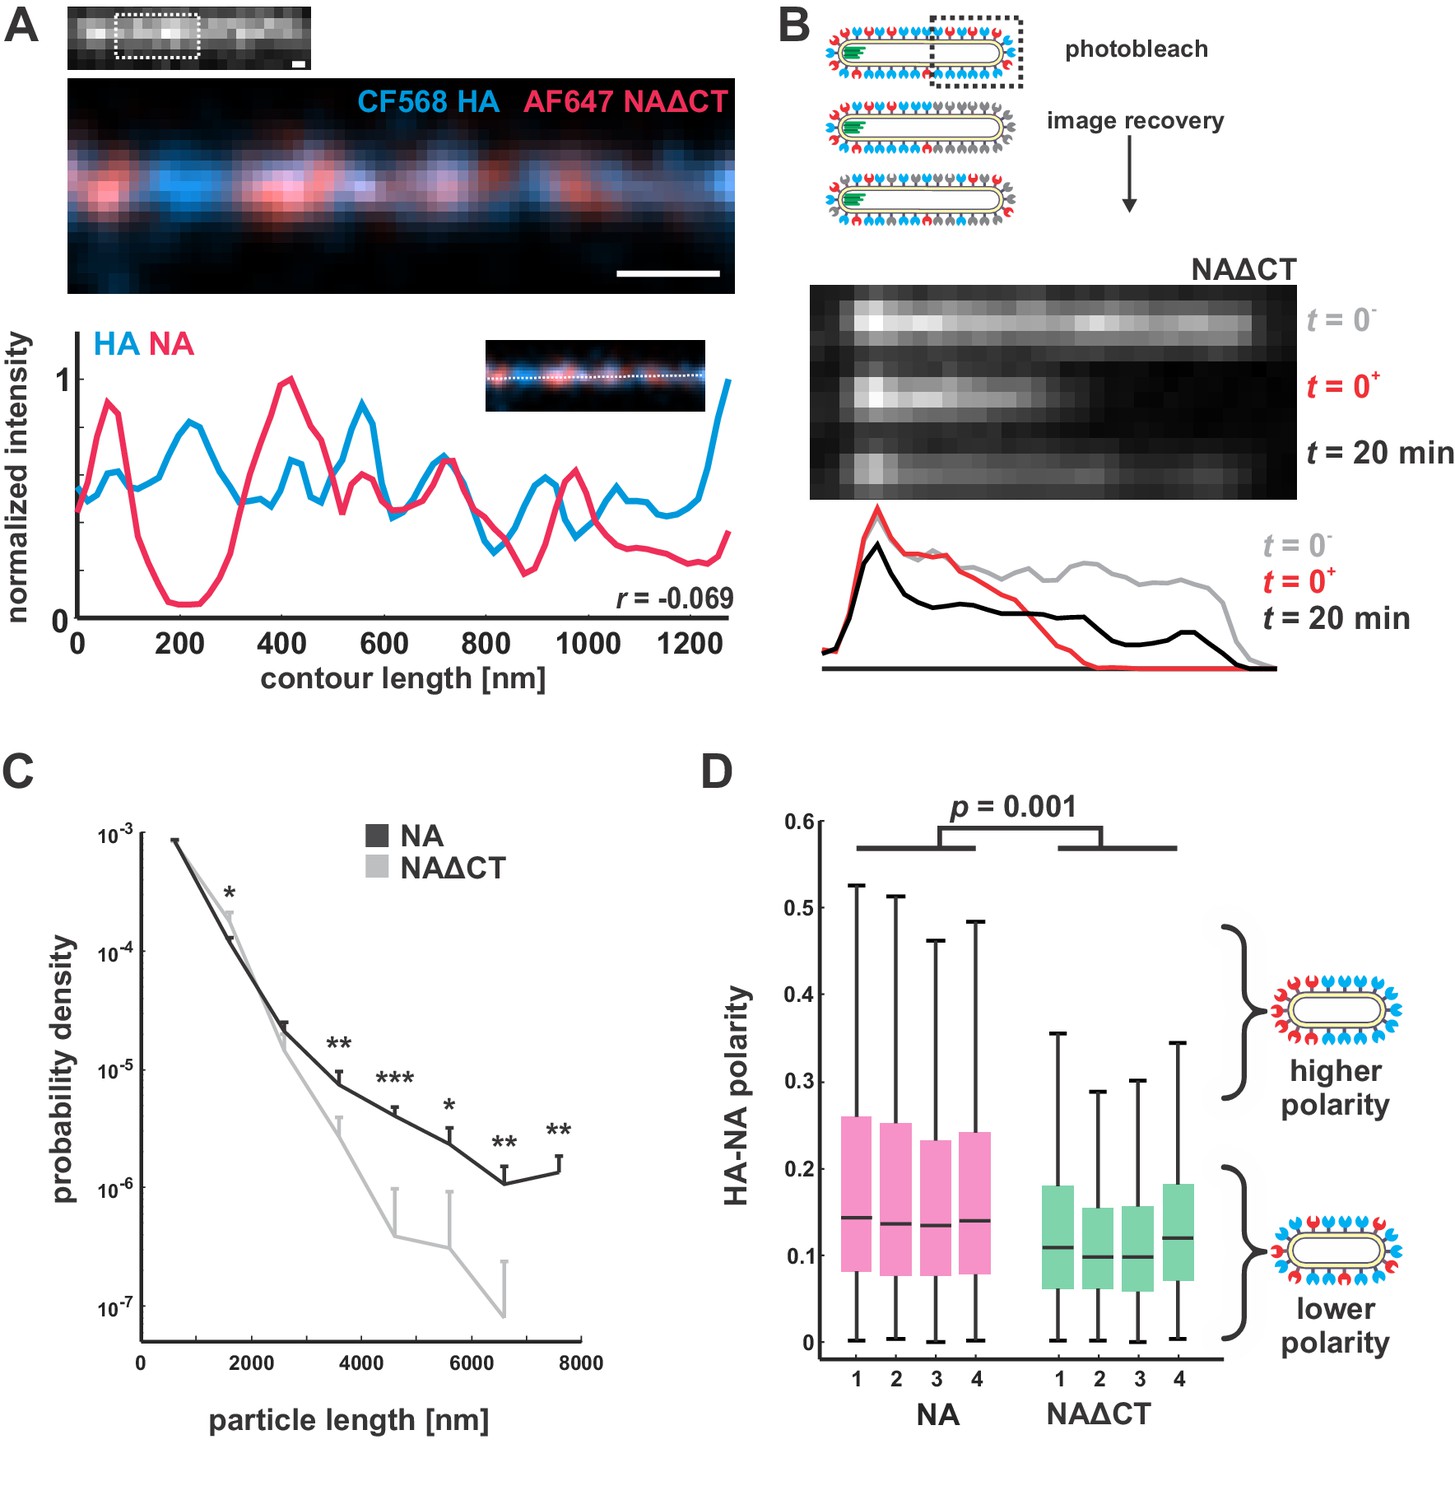
Characterization of NAΔCT virus organization and dynamics in the viral membrane.
(A) STORM imaging of NAΔCT reveals a clustered distribution of HA and NA on the surface of filamentous viruses, similar to the nanometer-scale organization of wildtype virus (scale bar = 200 nm). (B) In contrast to viruses with wildtype NA, photobleaching of NAΔCT on filamentous viruses shows partial recovery on the timescale of several minutes, indicating that the enzyme is at least partially mobile. Results are representative of recovery for n = 8 bleached viruses. (C) Particle length distributions for viruses with wildtype NA and NAΔCT, showing similar proportions of particles for lengths below ~ 3 μm. Viruses with wildtype NA produce a significantly higher proportion of particles larger than 3 μm. Plots show the mean and standard deviation for four biological replicates (*: p<0.05; **: p<0.01; ***: p<0.001, determined from a two-sample t-test). (D) Distributions of HA-NA polarity in wildtype and NAΔCT viruses. Boxes show median values and 25th-75th percentile ranges for each of four biological replicates; P-value is determined from a two-sample t-test.
Figure 3—figure supplement 3
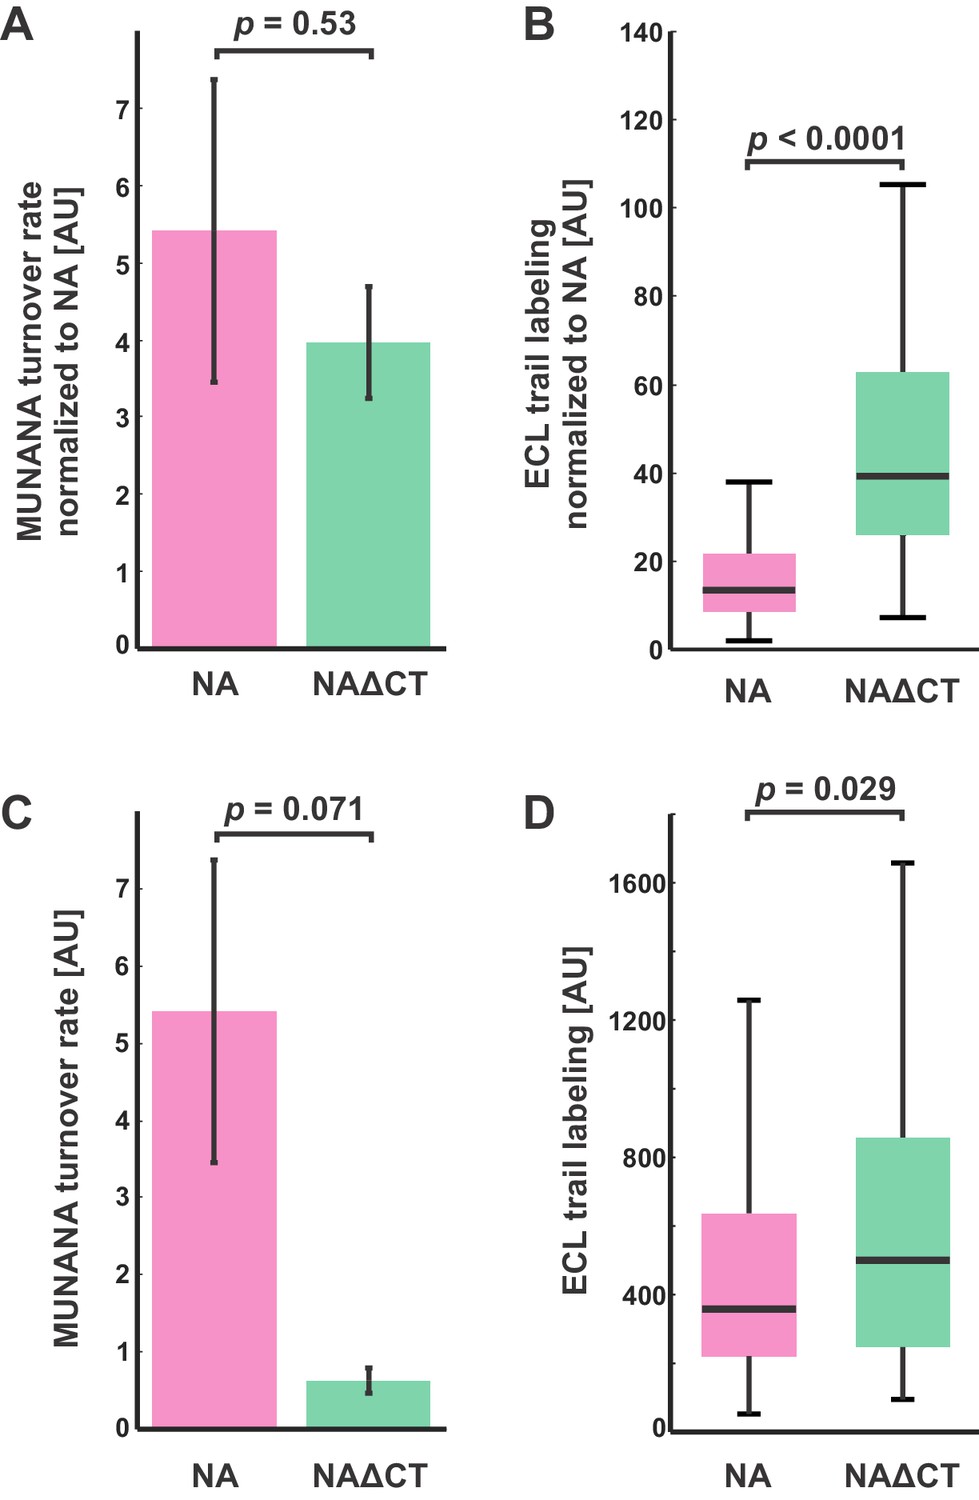
Comparison of NA activities for soluble and immobilized substrates.
(A) Enzymatic activity (measured using MUNANA) for intact virus samples with wildtype and NAΔCT, normalized by relative NA content (determined by imaging fluorescently labeled virus). Rates of MUNANA turnover per molecule of NA do not change significantly when the cytoplasmic tail of NA is deleted. Quantification shows the mean and standard error for three biological replicates; p-value determined by a two-sample t-test. (B) Evaluating the NA-activity of individual viruses against immobilized substrates: viruses bound to fetuin-functionalized coverslips were incubated for 30 min before labeling with fluorescent ECL to quantify cleavage of sialic acid. Normalizing by NA content (measured by imaging fluorescently-labeled NA) shows a significant increase in the activity of NAΔCT relative to NA(wt) for immobilized substrates. Boxes indicate the median and 25th / 75th percentile measured from two biological replicates with a total of 198 viruses (NA wildtype) and 130 viruses (NAΔCT); p-value determined using a two-sample KS test. (C) and (D) show quantification of the same data, without normalizing for NA abundance for the entire sample (in C) or for individual viruses (in D).
Figure 3—figure supplement 4
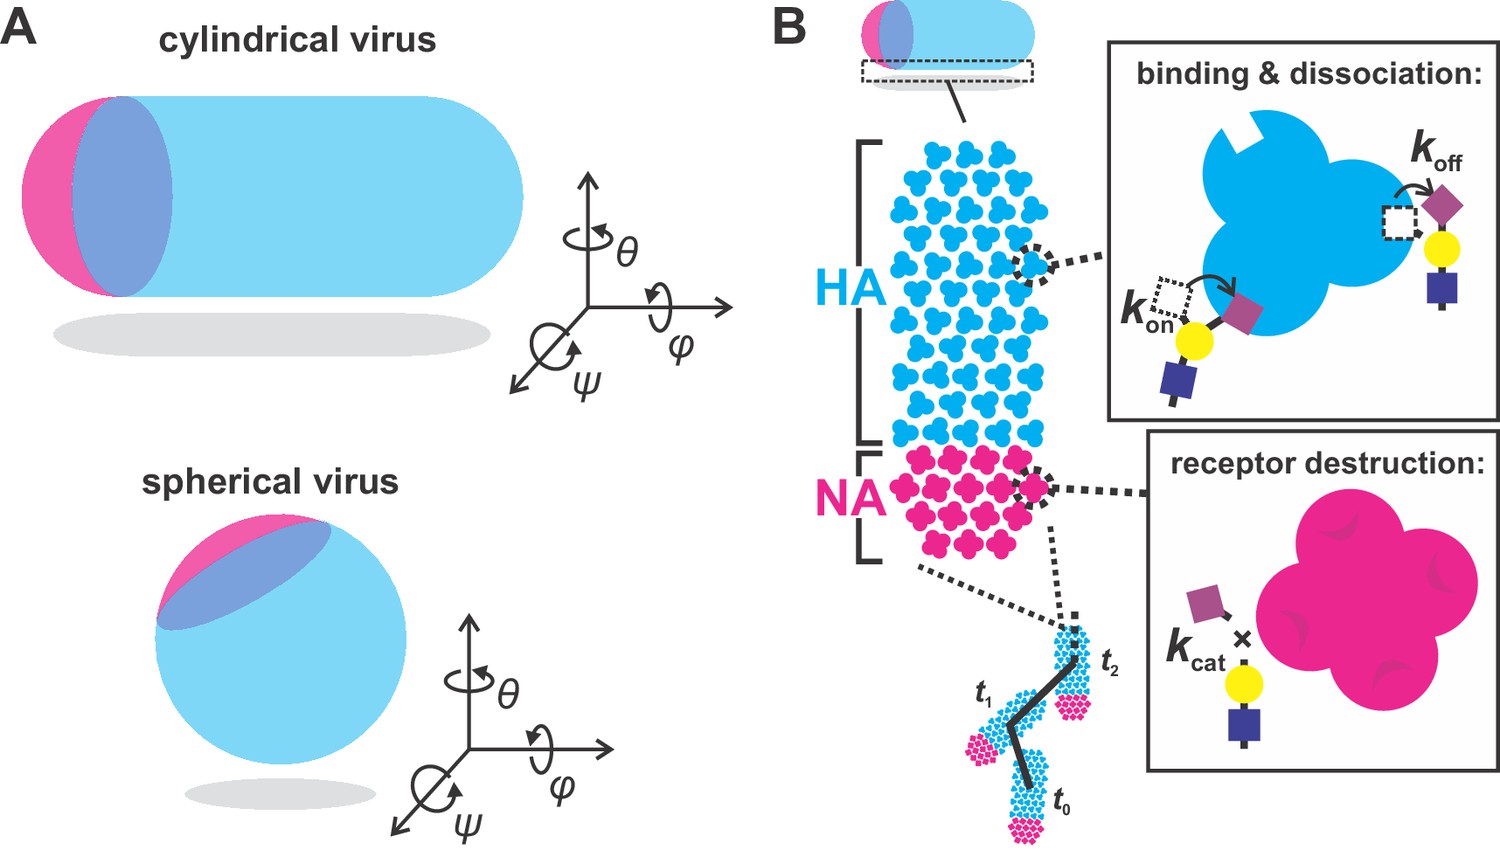
simulation scheme.
(A) Orientation of cylindrical (left) and spherical (right) viral particles on flat surfaces. Of the three rotational degrees of freedom, only rotations in θ are considered in our simulations of cylindrical particles. Rotations in ψ (which reduce the number of possible HA-SA interactions) are not observed experimentally. Rotations in φ likely occur, but do not appreciably change the number and location of HA and NA molecules proximal to the surface. Unlike cylindrical particles, spherical particles would be expected to rotate about θ, φ, and ψ, leading to variations in the number of NAs proximal to the surface over time which would tend to randomize the virus’s direction of motion. As a result, spherical particles are not included in simulations. (B) Model for virus binding and diffusion accounting for multivalent adhesion of HA, turnover of proximal substrates by NA, and thermal fluctuations constrained by the position of bound HA-SA pairs. The virus is modeled as a lattice of HA and NA whose distributions are specified. Viruses interact with uniform distributions of sialic acid on a two-dimensional surface. HAs within a 7.5 nm radius of sialic acid can probabilistically bind, while NAs within the same radius can probabilistically cleave. Once bound, virus position and bearing can change only if it does not displace any bound HA-SA pairs beyond the specified binding radius (7.5 nm in these simulations).
Figure 3—figure supplement 5

Virus organization, sialic acid distributions, and virus trajectories in one- and two-dimensional simulations.
(A) Polarized distributions of NA (top) result in sialic acid distributions (middle) that decrease abruptly within a few tens of nanometers of the NA cluster. While most HAs sample from uniform distributions of sialic acid, those close to the NA cluster have a higher probability of binding to sialic acid that is offset from the HA in the positive direction. This results in a persistent bias in the direction of virus diffusion (bottom). (B) and (C) Similar to (A), but with two different types of symmetric NA distributions. In both cases, symmetric distributions of sialic acid (middle) result in symmetric random walks (bottom). In the one-dimensional case shown here, although the probability of positive or negative displacements are initially equal, once a displacement direction is established, the virus will tend to continue in the established direction. (D) Results of two-dimensional simulations with varying organizations of NA on the virus’s surface. Although localizing NA to one of the virus’s poles (‘polar’ configuration) produces consistent oriented motion, introducing separation between HA-rich and NA-rich regions with the same NA localization (‘gapped’ configuration) eliminates this tendency, as does localizing NA to both viral poles (‘bipolar’ configuration). Having moderately polarized NA distributions also suppresses oriented motion, since this configuration (‘off-center’) creates gradients in sialic acid density that partially cancel out over the length of the virus. Finally, NA in a random, uniformly-distributed configuration results in diffusion in a random direction. Because this configuration leads to more efficient cleavage of sialic acid and thus weaker virus adhesion, these simulations were performed with a lower number of total NAs (6 vs. 16) to prevent the virus from detaching altogether.
Figure 3—figure supplement 6
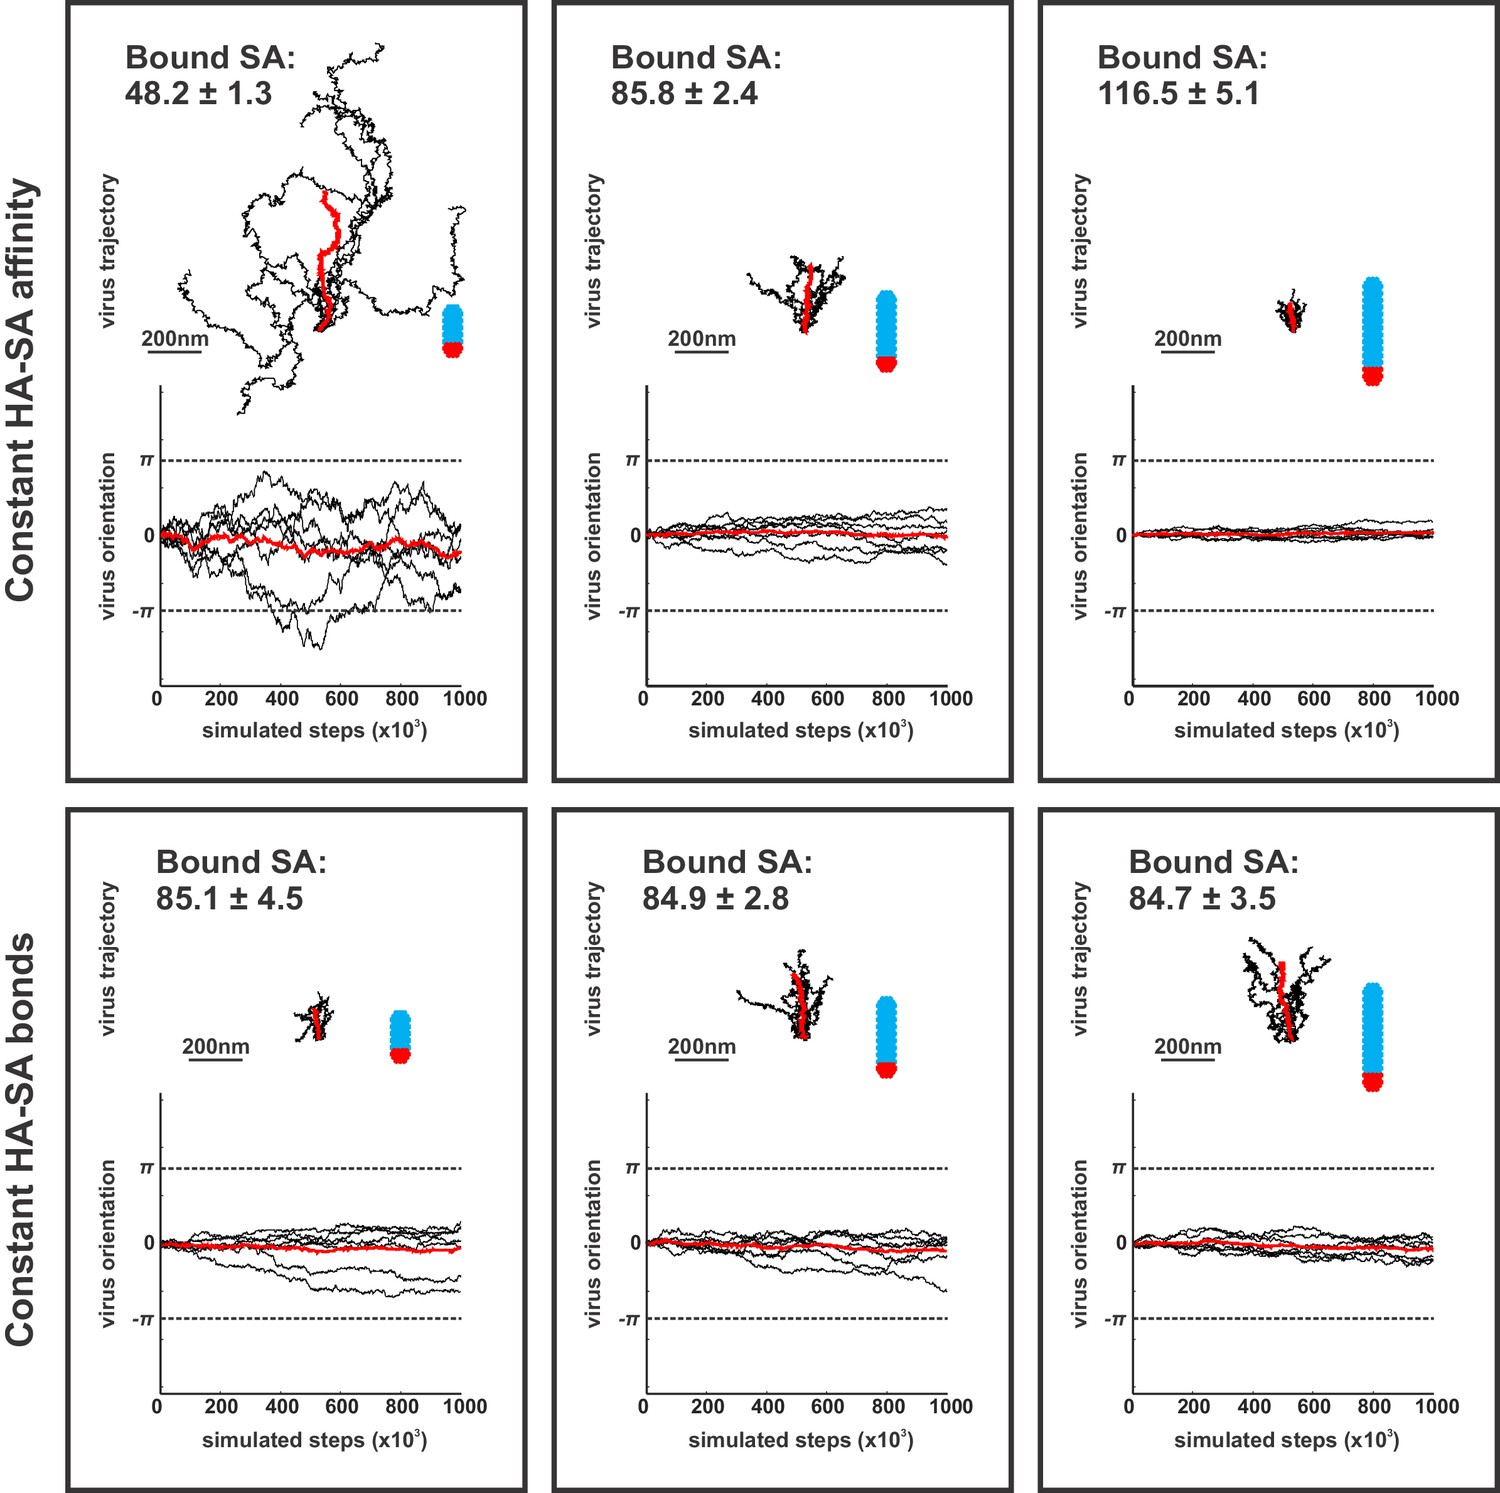
Contributions of virus morphology and binding affinity to persistent mobility.
Simulations of virus mobility for particles 185 nm, 285 nm, and 385 nm in length, corresponding to 48, 84 and 115 simulated HA trimers per particle, respectively. For a constant HA-SA binding affinity, the average number of bound SA increases proportional to the number of HAs proximal to the surface (top row; average number of bound HA-SA pairs (±S.D.) is given in the upper-right corner of each panel), resulting in substantially reduced mobility in larger particles. If binding affinity is varied (by varying the HA-SA off rate, koff) to maintain a constant number of average bound HA-SA pairs for viruses of different size, larger particles exhibit higher mobilities with greater angular persistence (bottom row). Virus trajectories and orientations are plotted from seven simulations comprised of 106 steps for each of the six conditions shown. Traces plotted in red correspond to averages across all simulations.
Figure 4 with 1 supplement
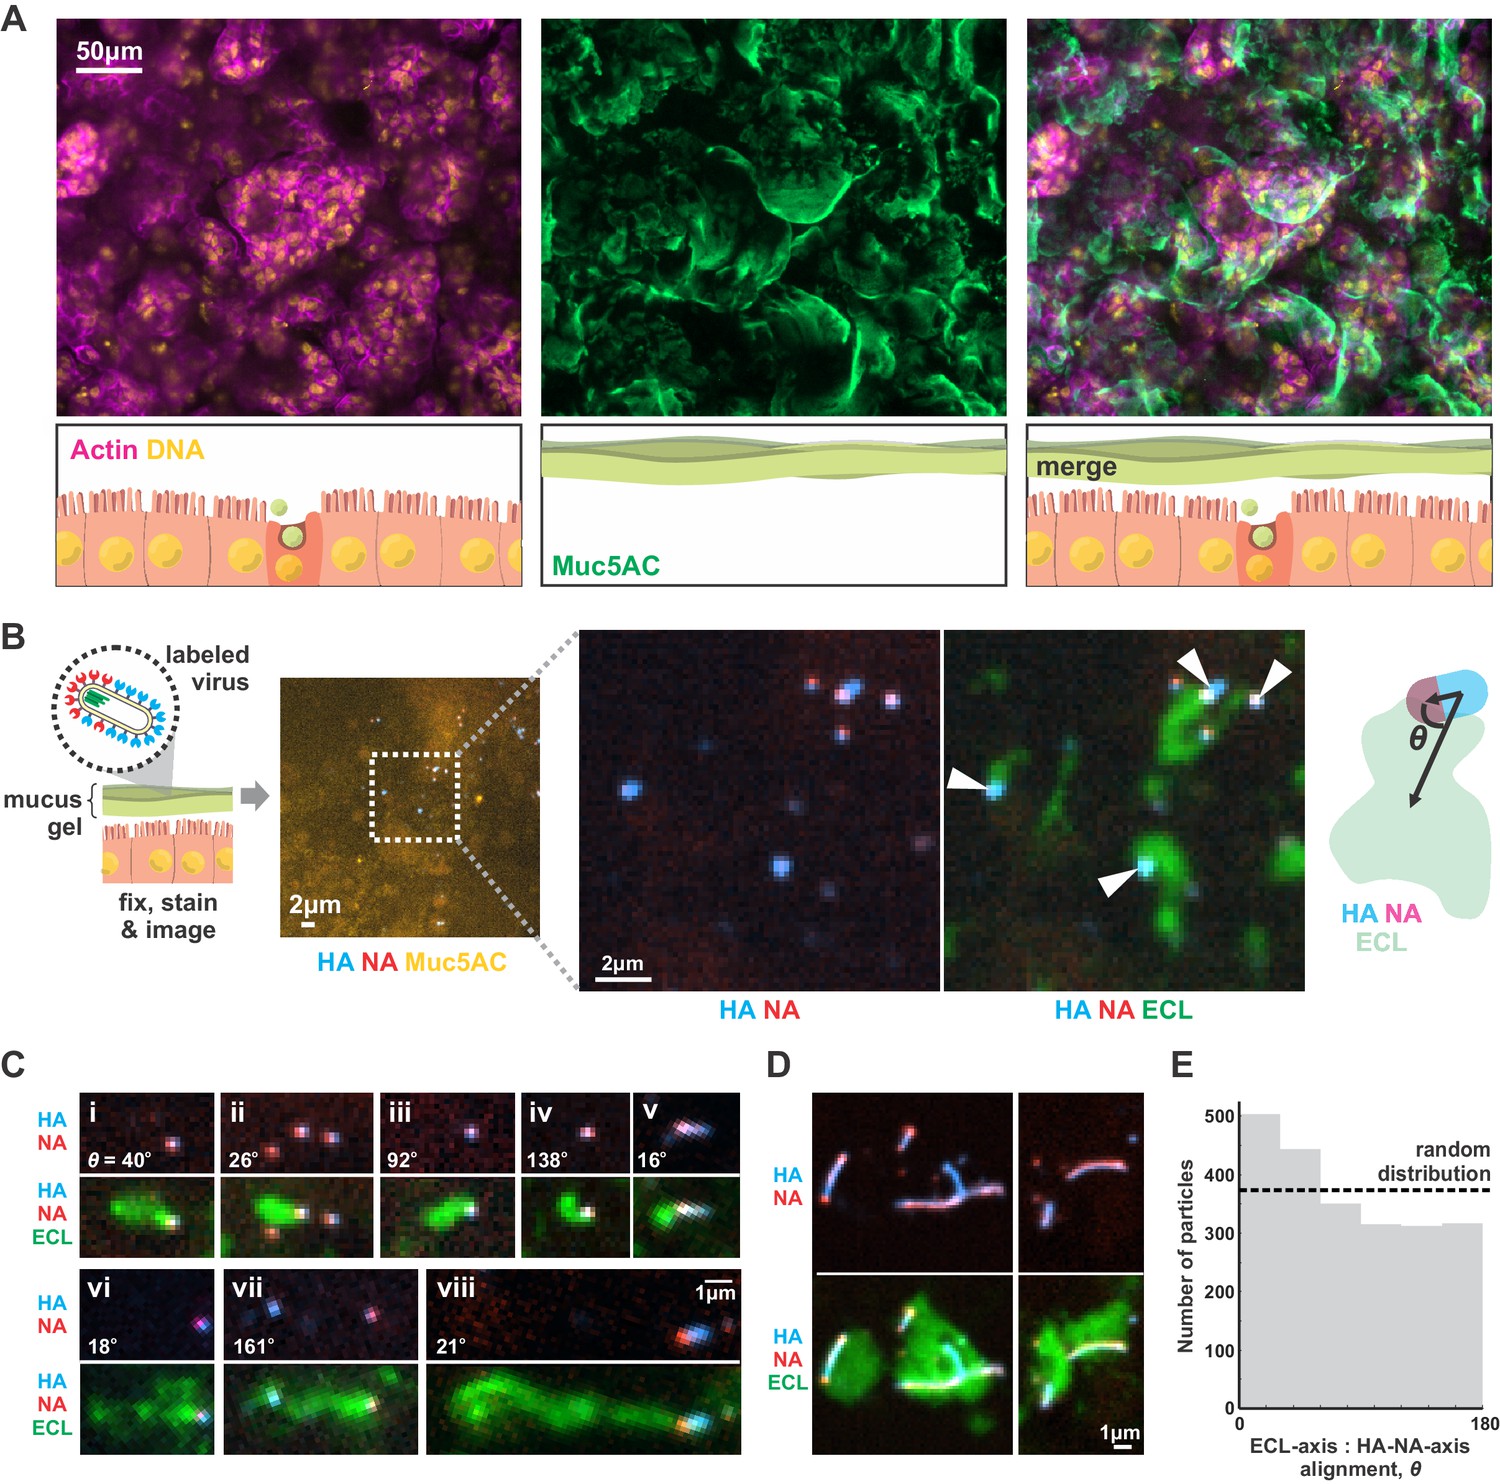
IAV exhibits persistent directional mobility in native mucus gels.
(A) Calu-3 cells cultured at an air-liquid interface for ~10 days partially differentiate, secreting gel-forming mucins (visualized with an antibody against Muc5AC). (B) Labeled virus (fluorescent HA and NA) added to the mucosal surface bind and diffuse. Labeling with ECL reveals distinct tracks trailing up to several microns behind viruses (indicated with white arrows). The angle θ characterizes the alignment between the HA-NA axis of the virus and the displacement from the centroid of ECL labeling. (C) Panels (i-viii) of registered viruses showing ECL trails. Where polarized distributions of NA on the virus are visible (i, v, vi, viii), ECL labeling is most prominent trailing from the NA-rich pole. Calculated values of the angle θ are given in the lower left of each panel. (D) Larger filamentous virions with NA broadly distributed across their surfaces clear large patches of sialic acid on the mucosal surface. Images in B, C, and D are a representative sampling from three biological replicates. (E) Orientation of virus HA-NA axes with ECL displacement vectors (the angle θ defined schematically in B). The distribution shows alignments for 2242 virus particles with non-overlapping ECL tracks, pooled from three biological replicates. Dashed line indicates the expected level for a uniform random distribution of alignments. See also Figure 4—source data 1.
-
Figure 4—source data 1
Matlab source data and code for Figure 4E.
- https://doi.org/10.7554/eLife.43764.022
Figure 4—figure supplement 1
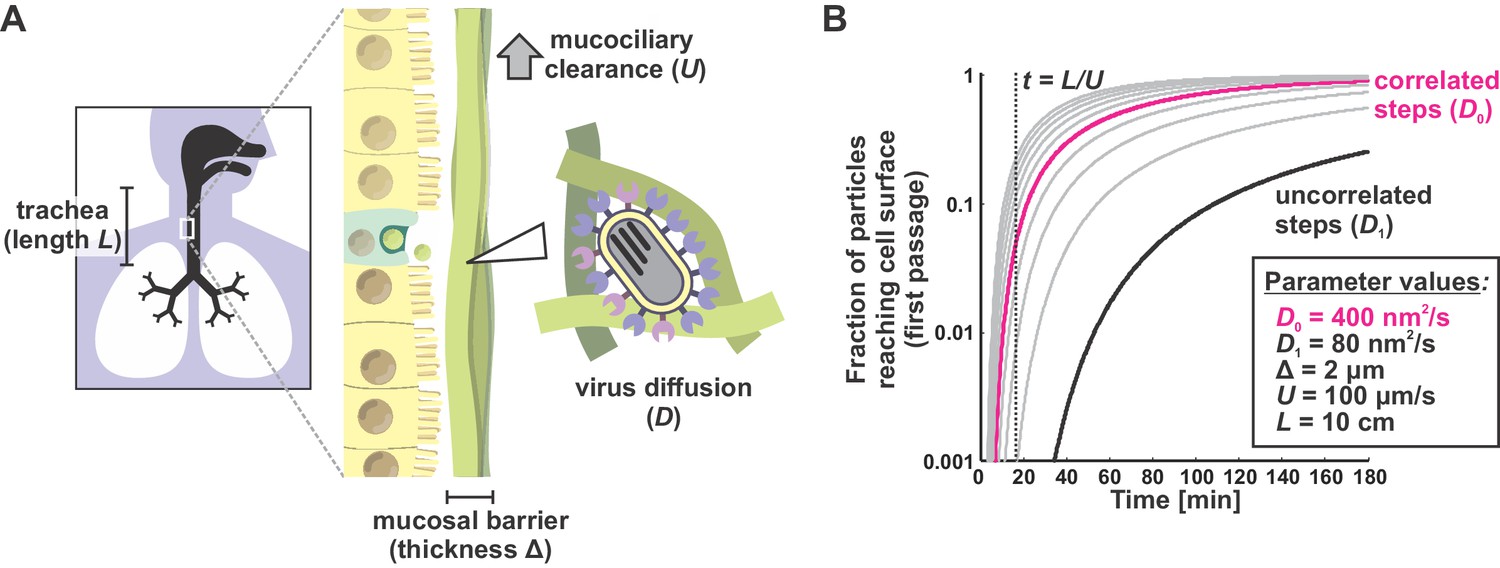
A first passage model for virus transport in mucus.
(A) Viruses entering the trachea (e.g. as aerosolized respiratory droplets) bind to the mucosal barrier. The probability of a particle infecting the underlying epithelium depends on the relative rates of virus diffusion (with a characteristic time of ~Δ2/Dvirus) and mucociliary clearance (with a characteristic time of ~ L/U). (B) Solutions to the first passage problem illustrated in panel (A) for different virus diffusion coefficients. Each curve plots the solution to Equations (6) and (7) with a different virus diffusion coefficient, starting from 80 nm2/s (black curve) and increasing by intervals of 80 nm2/s (gray or magenta curves). Black and magenta curves correspond to diffusion coefficients measured from Figure 3B with correlated (magenta) or uncorrelated (black) steps. The inset box shows physiological estimates of other parameters used to solve the first-passage problem.
Author response image 1
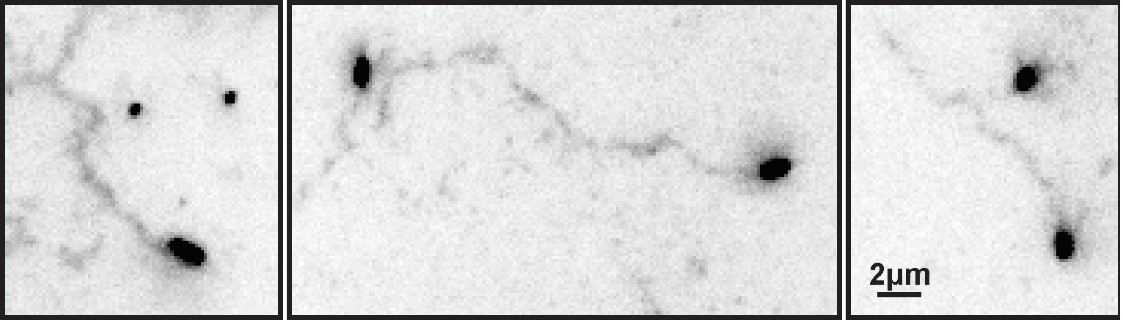
ECL tracks from unlabeled virus.
Filamentous viruses unmodified by fluorophores leave persistent trails of cleaved sialic acid (detected by labeling with ECL and displayed here with inverted contrast) similar to those left by fluorescently labeled viruses (Fig. 2B in the revised manuscript).
Videos
Video 1
Montage of IAV particles acquired using total internal reflectance microscopy at 30 s intervals.
Labeled HA is shown in blue and labeled NA is shown in red. Panels are shown at equivalent scales.
Video 2
Simulation of a filamentous virus ~ 250 nm in length with a polarized distribution of HA (blue) and NA (red) on its surface bound to a surface coated with sialic acid (green).
https://doi.org/10.7554/eLife.43764.018
Video 3
Simulations of polarized filamentous viruses on surfaces with freely-diffusing sialic acid (green).
Simulations correspond to DSA = 10−7 μm2/s, DSA = 10−5 μm2/s, and DSA = 10−1 μm2/s, as plotted in Figure 3E.
Tables
Key resources table
| Reagent type (species) or resource | Designation | Source or reference | Identifiers | Additional information |
|---|---|---|---|---|
| Cell line (C. familiaris) | MDCK-II | UC Berkeley Cell Culture Facility | https://bds.berkeley.edu/facilities/cell-culture | |
| Cell line (H. sapiens) | Calu-3 | UC Berkeley Cell Culture Facility | https://bds.berkeley.edu/facilities/cell-culture | |
| Cell line (H. sapiens) | HEK293T | UC Berkeley Cell Culture Facility | https://bds.berkeley.edu/facilities/cell-culture | |
| Antibody | anti-Muc5AC | Thermo Fisher | RRID:AB_10978001, Cat. #: MA5-12178 | IF (1:400) |
| Antibody (lectin) | FITC-labeled Erythrina cristagalli lectin (ECL) | Vector | RRID:AB_2336437, Cat. #: FL-1141 | IF (1:1000) |
| Recombinant DNA reagent | pcDNA3.1+vHA(G5) | (Vahey and Fletcher, 2019) | ||
| Recombinant DNA reagent | pcDNA3.1+vHA | (Vahey and Fletcher, 2019) | ||
| Recombinant DNA reagent | pcDNA3.1+vNA(ybbR) | (Vahey and Fletcher, 2019) | ||
| Recombinant DNA reagent | pcDNA3.1+vNAΔCT(ybbR) | This paper | Vector shown schematically in Figure 3—figure supplement 1A | |
| Recombinant DNA reagent | pcDNA3.1+vNA | (Vahey and Fletcher, 2019) | ||
| Recombinant DNA reagent | pcDNA3.1+vNP(FlAsH) | (Vahey and Fletcher, 2019) | ||
| Recombinant DNA reagent | pcDNA3.1+vNP | (Vahey and Fletcher, 2019) | ||
| Recombinant DNA reagent | pcDNA3.1+vM (Ud M1) | (Vahey and Fletcher, 2019) | ||
| Recombinant DNA reagent | pcDNA3.1+vN | (Vahey and Fletcher, 2019) | ||
| Recombinant DNA reagent | pcDNA3.1+vPA | (Vahey and Fletcher, 2019) | ||
| Recombinant DNA reagent | pcDNA3.1+vPB1 | (Vahey and Fletcher, 2019) | ||
| Recombinant DNA reagent | pcDNA3.1+vPB2 | (Vahey and Fletcher, 2019) | ||
| Peptide, recombinant protein | Streptavidin | Thermo Fisher | Cat. #: 434302 | |
| Peptide, recombinant protein | Neuraminidase from Clostridium perfringens | Sigma | Cat. #: N2876 | |
| Peptide, recombinant protein | Fetuin from fetal bovine serum | Sigma | Cat. #: F3004 | |
| Peptide, recombinant protein | CLPETGG peptide | Genscript | ||
| Chemical compound, drug | Alexa Fluor 555 maleimide | Thermo Fisher | Cat. #: A20346 | |
| Chemical compound, drug | Alexa Fluor 647 maleimide | Thermo Fisher | Cat. #: A20347 | |
| Chemical compound, drug | CF568 maleimide | Biotium | Cat. #: 92024 | |
| Chemical compound, drug | FlAsH-EDT2 | Toronto Research Chemicals | Cat. #: F335200 | |
| Software | Matlab | Mathworks |
Additional files
-
Source code 1
Matlab code for modeling the diffusion of virus particles bound to sialic acid on two-dimensional surfaces.
The folder ‘Immobile SA’ simulates the case where sialic acid is stationary on the surface, while the folder ‘Mobile SA’ simulates the case where sialic acid is able to freely diffuse (unless bound by the virus). The function run_simulations.m can be used to launch simulations in both folders. More information is contained in the documentation of each function.
- https://doi.org/10.7554/eLife.43764.023
-
Transparent reporting form
- https://doi.org/10.7554/eLife.43764.024
Download links
A two-part list of links to download the article, or parts of the article, in various formats.
Downloads (link to download the article as PDF)
Open citations (links to open the citations from this article in various online reference manager services)
Cite this article (links to download the citations from this article in formats compatible with various reference manager tools)
Influenza A virus surface proteins are organized to help penetrate host mucus
eLife 8:e43764.
https://doi.org/10.7554/eLife.43764


