ParB dynamics and the critical role of the CTD in DNA condensation unveiled by combined force-fluorescence measurements
- Centro Nacional de Biotecnología, Consejo Superior de Investigaciones Científicas, Spain
- University of Bristol, United Kingdom
Figures
Figure 1
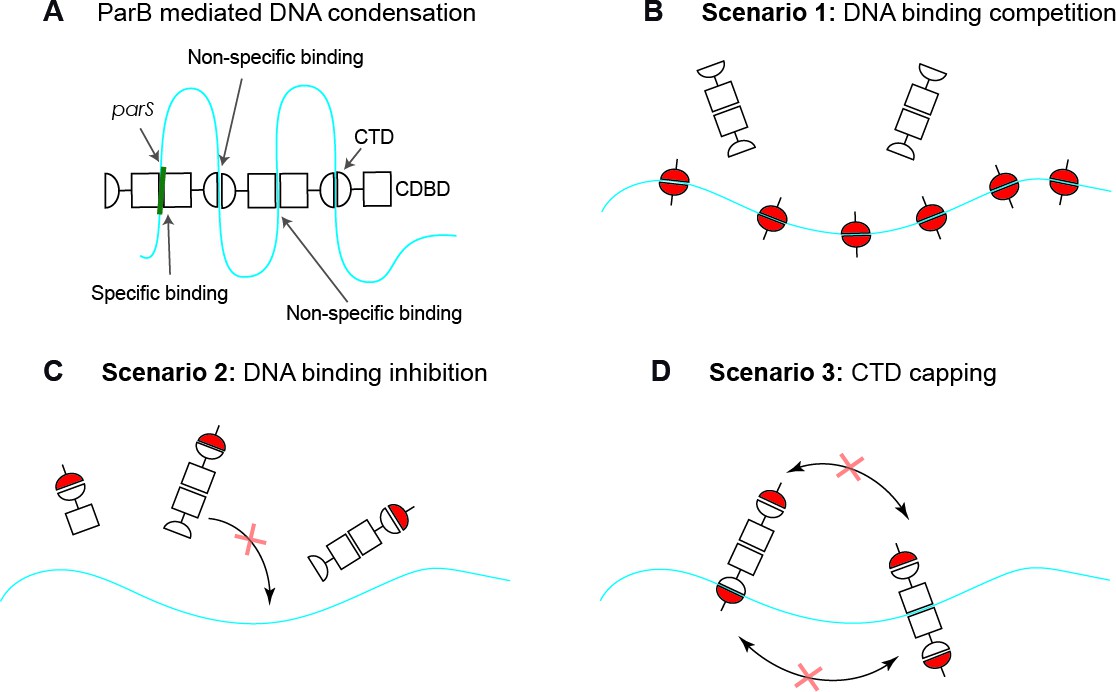
Possible scenarios for CTD-induced decondensation of ParB-DNA networks.
(A) Model for ParB network formation and condensation via ParB-DNA and ParB-ParB interactions. ParB monomers comprise a central DNA-binding domain (CDBD) with specific and possibly non-specific DNA-binding activities and a carboxy-terminal domain (CTD) with non-specific DNA-binding capacity. The amino terminal domain (NTD) is not represented on the scheme for clarity. (B) In scenario 1, the CTD can bind dsDNA competing for the DNA-binding sites, displacing full length ParB and therefore de-condensing the DNA. (C) In scenario 2, the CTD can exchange with full length ParB forming heterodimers in free solution that are inactive so can no longer exchange with the ParB-DNA network. (D) In scenario 3, the CTD forms heterooligomers with DNA-bound ParB which retain DNA-binding activity but are not able to condense DNA because bridging interactions are ‘capped’ by the CTD. Possible scenarios for CTD-induced decondensation of ParB-DNA networks.
Figure 2 with 2 supplements

Combined lateral MT and TIRF microscopy to study ParB-DNA interactions.
(A) Cartoon of the MT-TIRF setup used to visualise ParB-DNA interactions at the single-molecule level with controlled external force. A magnet pulls laterally on the distal end of a DNA molecule which is anchored to the coverslip. Fluorescently labelled ParBAF is excited in TIRF mode using 488 nm laser light and the emitted light is collected by an EM-CCD (Madariaga-Marcos et al., 2018). (B) TIRF image showing a laterally stretched DNA molecule under a force of 1 pN and in the presence of 500 nM ParBAF. Beads showed fluorescence due to additional binding of DNA molecules, which are further labelled by non-specifically bound ParBAF proteins. (C) Intensity of several DNA molecules (n = 15) in the presence of 500 nM ParBAF as a function of time. Even though the integrated intensity changes from molecule to molecule, intensity remains constant for more than 100 s, suggesting a dynamic and fast exchange between DNA-bound ParBAF and free ParBAF in the media. (D) Kymograph from the same experimental data shown in (B) highlighting changes in intensity along the DNA molecule through the entire experiment supporting the continuous exchange of the protein. Kymographs varied from molecule to molecule. All experiments were conducted in ParB reaction buffer supplemented with 4 mM Mg2+.
-
Figure 2—source data 1
Fluorescence intensity of 15 DNA molecules in the presence of 500 nM ParBAF as a function of time.
- https://doi.org/10.7554/eLife.43812.006
Figure 2—figure supplement 1
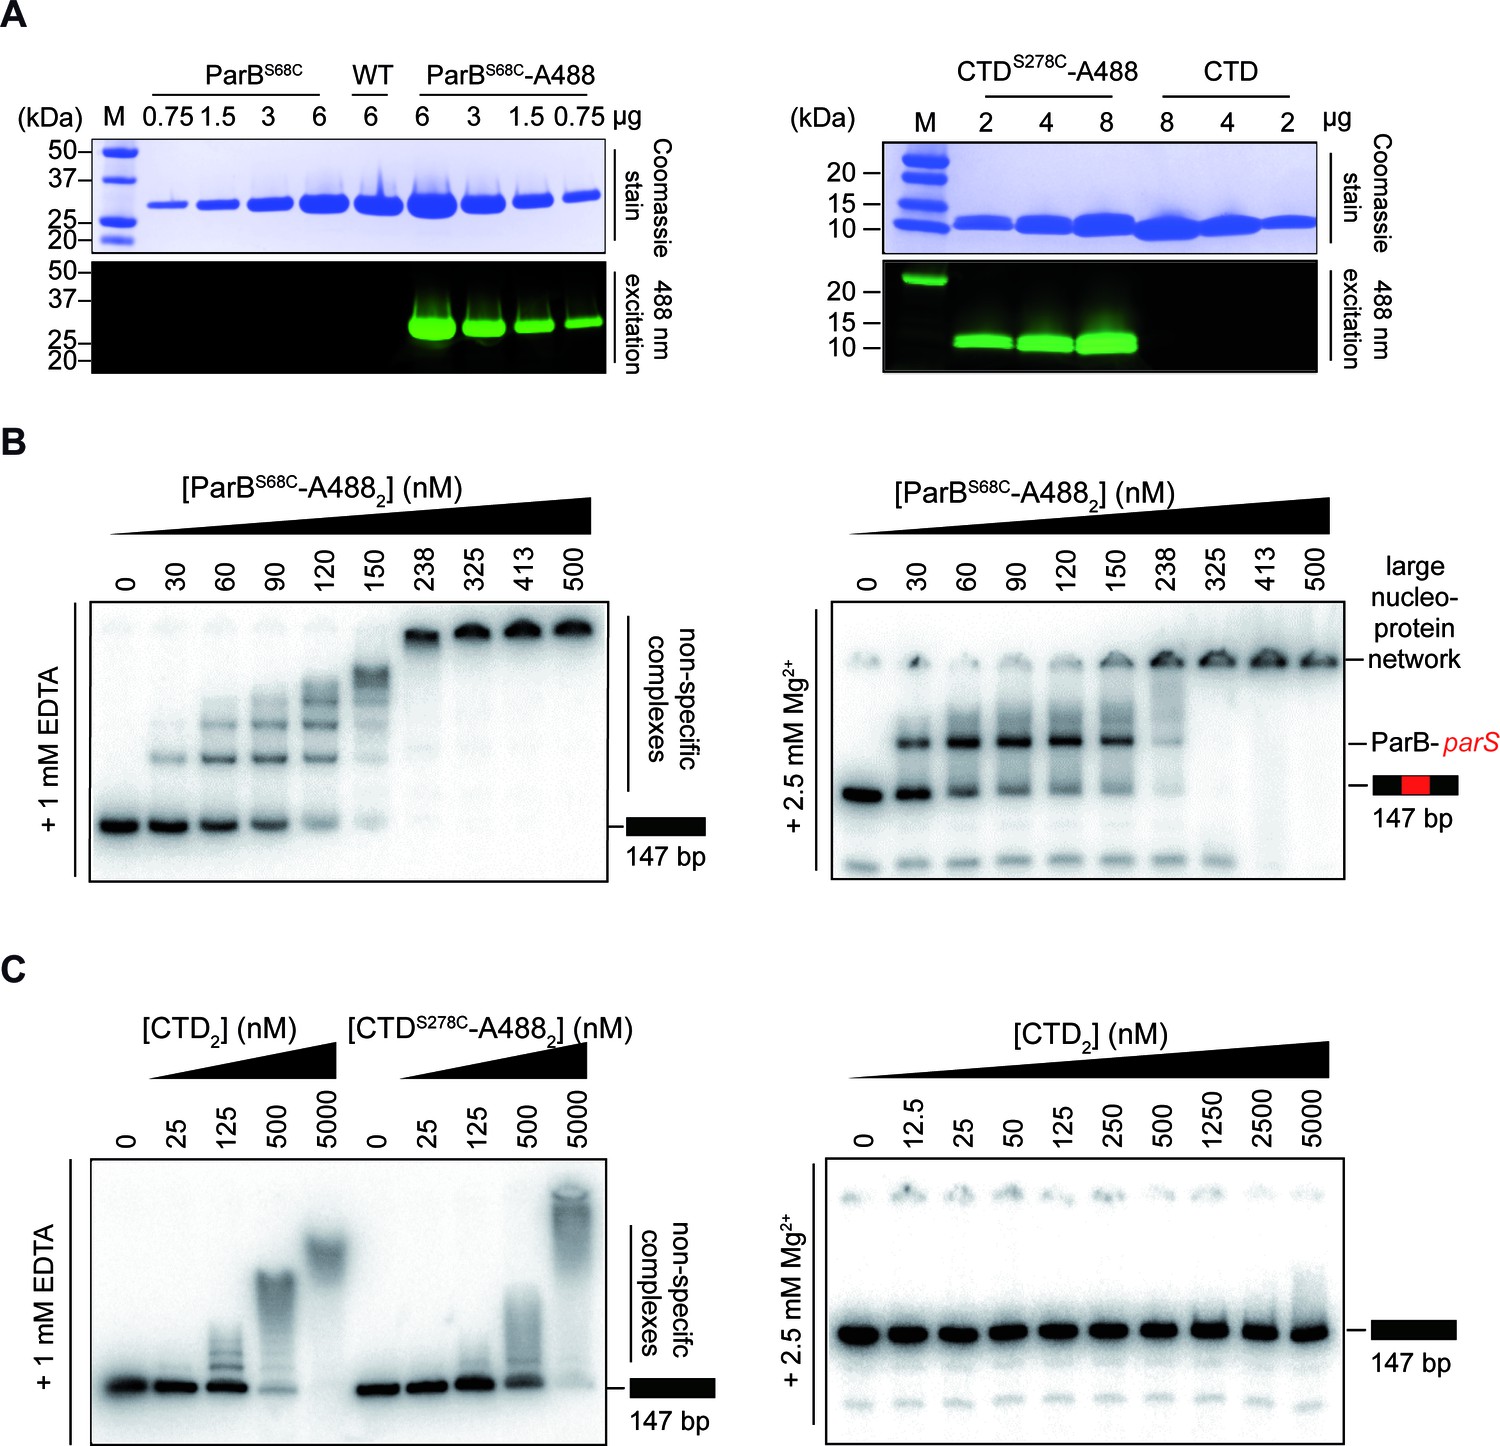
Purification and activity assays of ParBAF and CTDAF.
(A) ParBAF and CTDAF labelling efficiency. (B) ParBAF had non-specific (in TBE) and parS specific (in TBM) DNA-binding activity equivalent to that of wild-type ParB, as measured in an EMSA, in EDTA and Mg2+ containing buffers, respectively (Taylor et al., 2015; Fisher et al., 2017). (C) CTDAF had qualitatively similar DNA-binding activity to the wild-type truncated protein CTD. Right gel shows that the CTD was only capable of binding DNA in an EDTA–containing buffer.
Figure 2—figure supplement 2
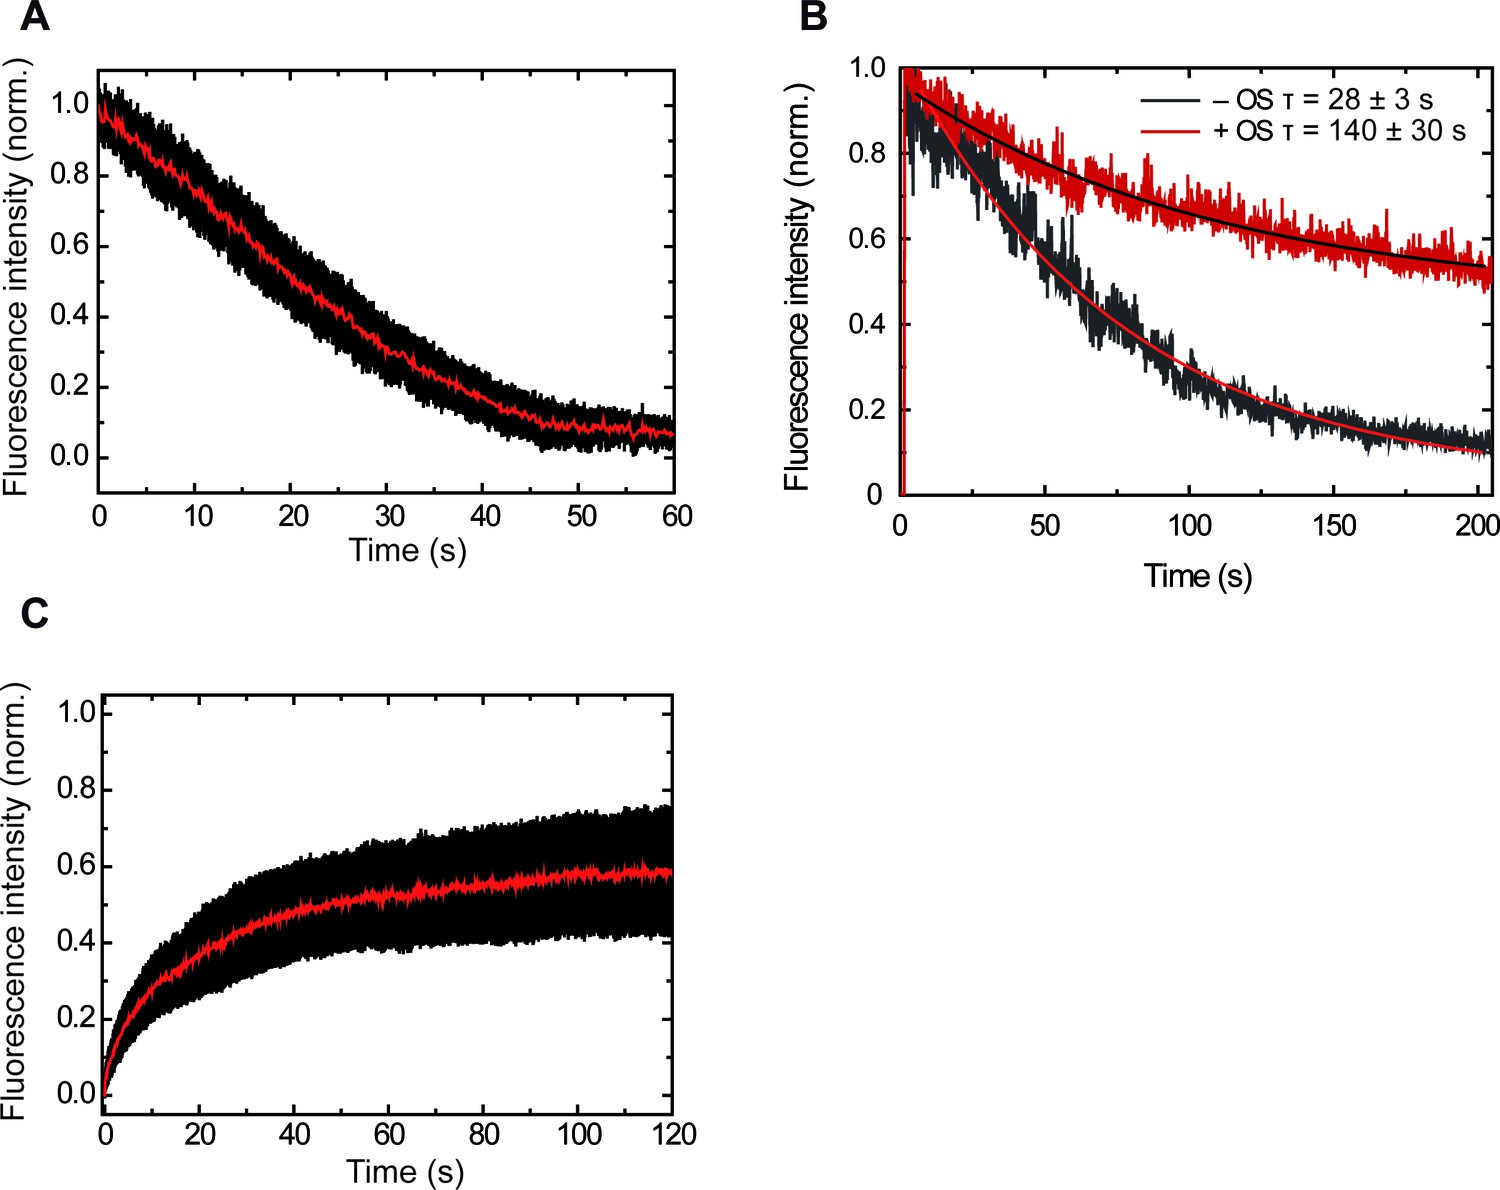
Control experiments showing increasing intensity due to ParBAF binding and constant intensity due to protein exchange.
(A) Averaged decrease of intensity due to introduction of protein-free buffer (n = 26). (B) Representative traces of intensity decay of formaldehyde crosslinked ParBAF in the presence and absence of an oxygen scavenger system. The oxygen scavenger contributes to a longer lifetime of the ParBAF complex. From measurements on several molecules we found average half times of 28 ± 3 s and 140 ± 30 s (mean sem) in the absence and presence of the oxygen scavenger system, respectively. (C) Average intensity recovery of DNA molecules (n = 23) by the introduction of 250 nM ParBAF after photobleaching. Intensity recovery is consistent with a fast protein exchange with the media (Video 4).
Figure 3 with 2 supplements
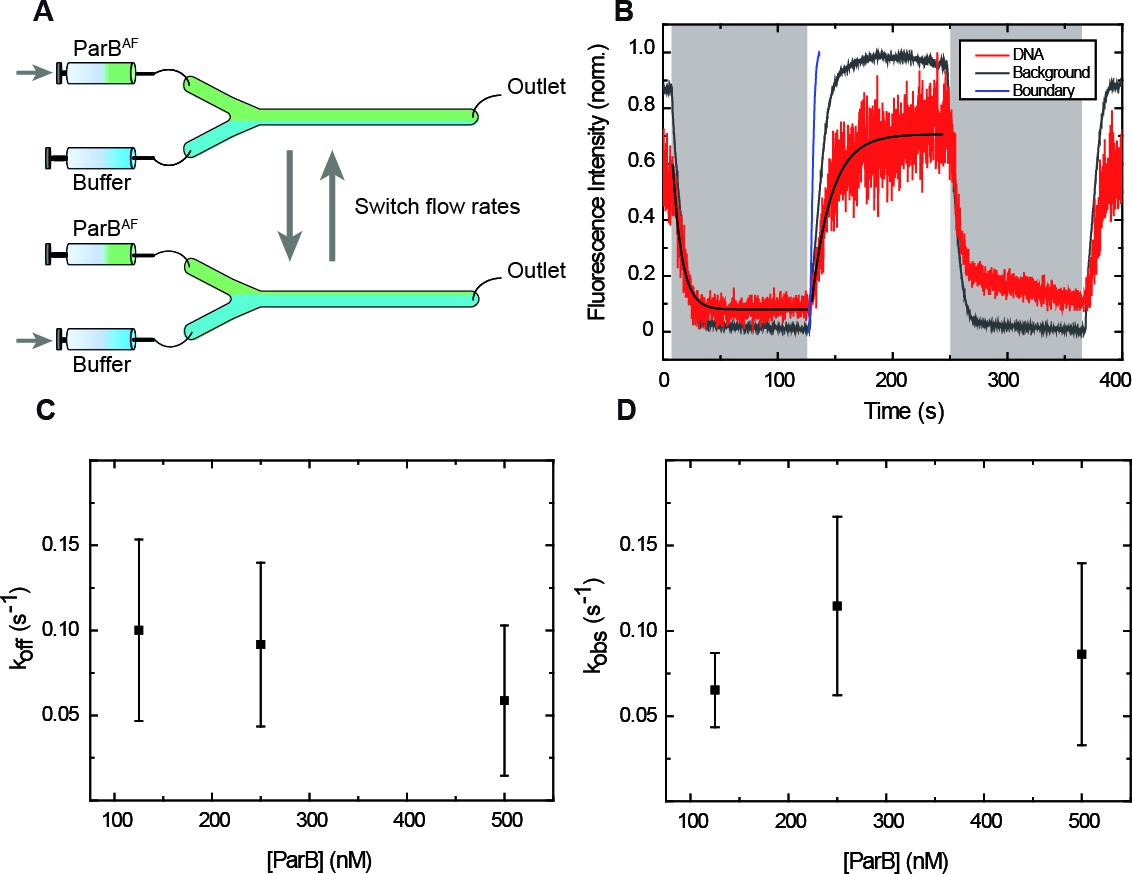
ParB binding and unbinding kinetics.
(A) Scheme of the multilaminar flow system employed to fast-exchange of buffers. The fluid cell contains two inlets and a single outlet. Switching the velocities of both channels shifts the boundary of laminar flows resulting in the fast exchange of buffers. (B) Normalised integrated fluorescence intensity for a representative DNA molecule in a laminar-flow experiment with 250 nM ParBAF as a function of time (red) and for an equivalent background area (gray). Buffer injection (shadowed area) is correlated with decreasing intensity. Best fit curves to obtain (Equation 3) and (Equation 2) are shown. Boundary exchange with fluorescein is also shown for comparative purposes (Figure 3—figure supplement 1D). (C) Unbinding rate measured at different initial ParB concentrations, obtained from fitting individual curves as shown in B, and then averaged at different concentrations. The values obtained are in the order of values published before (Song et al., 2016). (D) Observed binding rate measured at different ParB concentrations, calculated as . Errors are SD. (n ~ 15-30 molecules). All experiments were conducted in ParB reaction buffer supplemented with 4 mM Mg2+.
-
Figure 3—source data 1
Normalised integrated fluorescence intensity for a representative DNA molecule in a laminar-flow experiment with 250 nM ParBAF as a function of time.
- https://doi.org/10.7554/eLife.43812.014
Figure 3—figure supplement 1
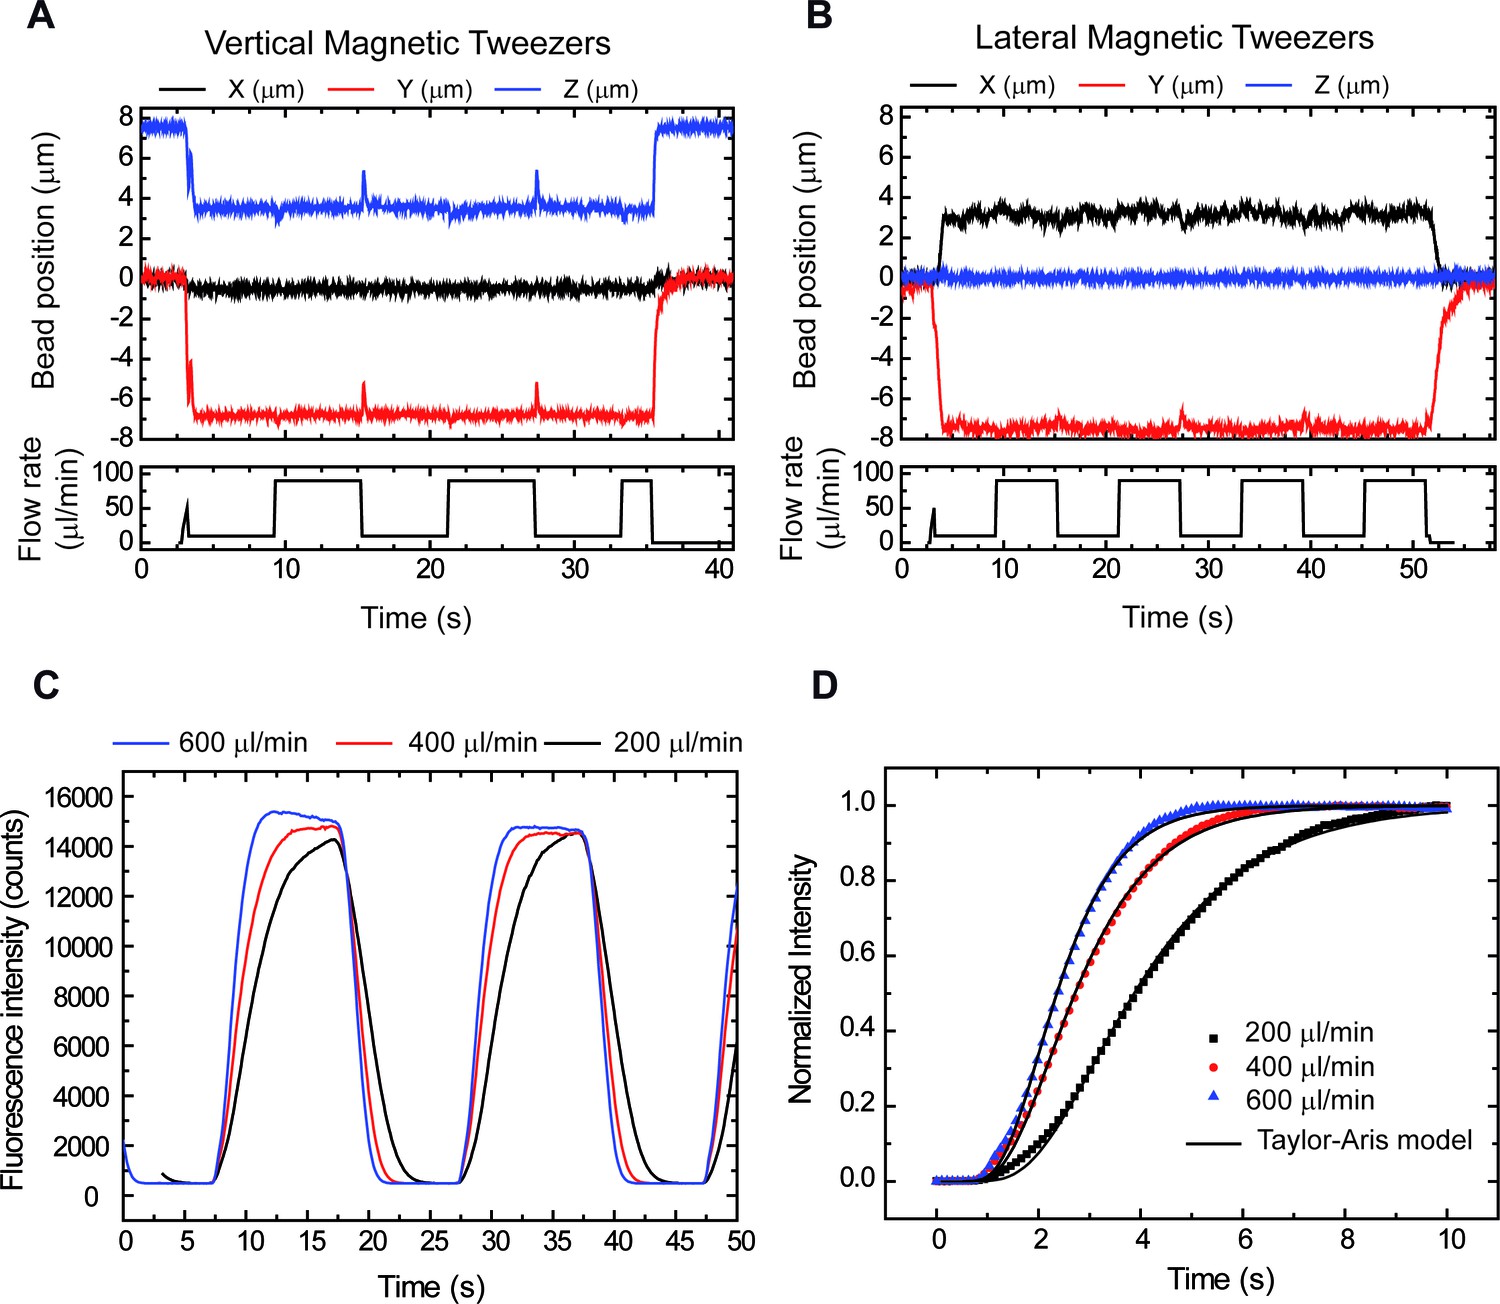
Correct performance of the syringes demonstrated by tracking DNA tethers and boundary shift fluorescence measurements.
(A) Vertical Magnetic Tweezers. (B) Lateral Magnetic Tweezers. Peaks in Y and Z (vertical) and X and Y (lateral) correlate with changes in flow, showing a correct performance by computer controlled syringes. Peaks are asymmetric due to differences in syringe volumes (10 ml and 1 ml). (C) Cycles of buffer/fluorophore exchange at three different flow rates showing that exchange rates range from 3 to 6.5 s (90% total intensity). (D) Data were well fitted to the Taylor-Aris model consistent with a change of boundary as described in Niman et al. (2013).
Figure 3—figure supplement 2
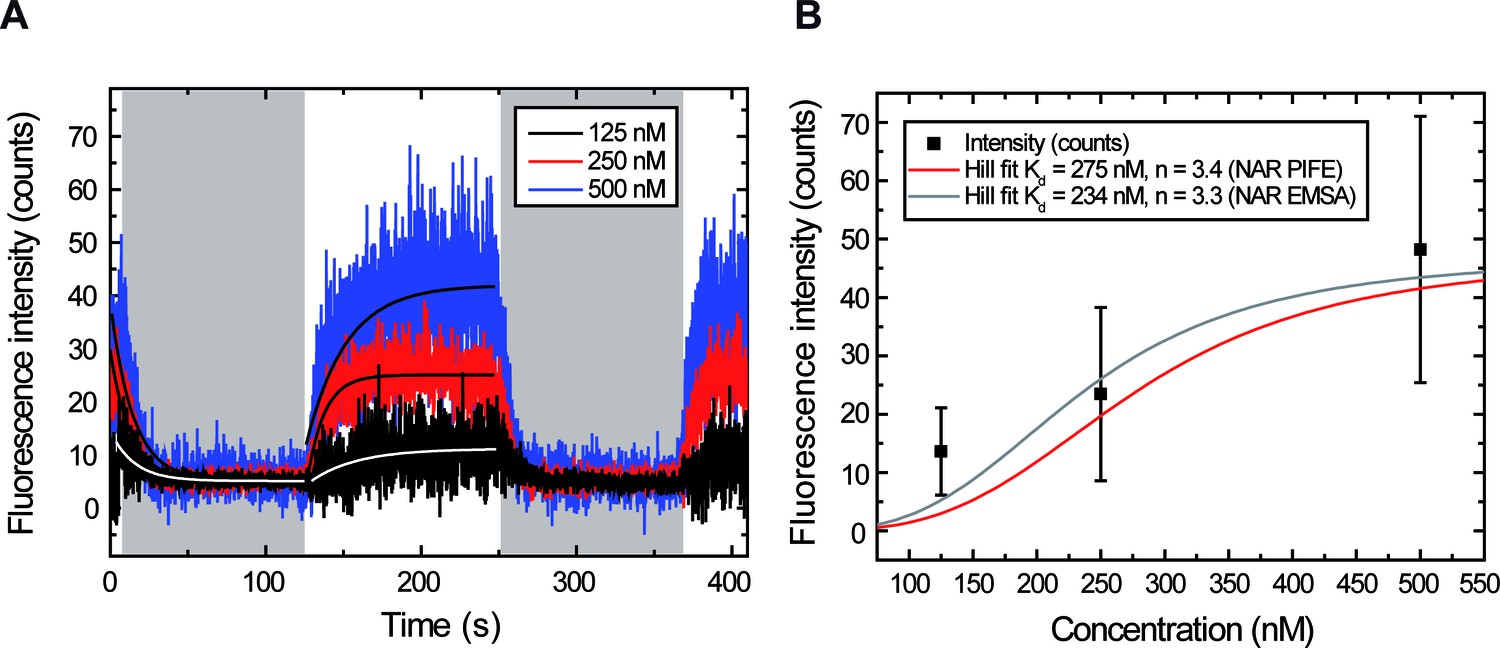
Measuring and for different ParBAF concentrations.
(A) Representative integrated fluorescence intensity for a DNA molecule in a laminar-flow experiment, as a function of time, coated with 125, 250 or 500 nM ParBAF. Protein injection correlates with increasing fluorescence intensity along the DNA tether, while protein unbinding correlates with decreasing intensity (shadowed area). Best-fit curves to obtain (Equation 3) and (Equation 2) are shown. (B) Plot of intensities obtained at equilibrium (plateaus in Figure 3—figure supplement 2) for different ParB concentrations. The Hill plot using values from Taylor et al. (2015) is shown as reference.
Figure 4 with 2 supplements
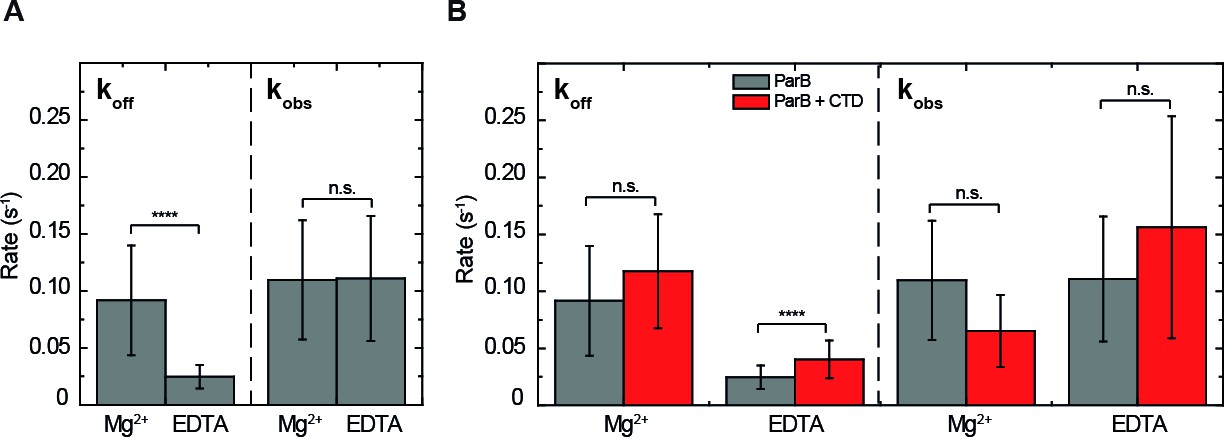
ParB binding kinetics in the presence and absence of Mg2+and the effect of the free CTD.
(A) Unbinding rate and observed binding rate values for 250 nM ParBAF. We observed a reduction in (slower unbinding) in the case of EDTA but no significant difference was observed in values. (B) Unbinding rate and observed binding rate values for 250 nM ParBAF in the presence (red) and absence (gray) of 2.5 µM CTD, in Mg2+– or EDTA–containing buffer. We report faster unbinding in the presence of the CTD in EDTA. No effect of the CTD in the unbinding rate was observed in Mg2+ buffer, according to Student’s t-test. No significant difference was observed in values in the presence or absence of the CTD in both Mg2+ and EDTA conditions. All errors are SD. (n ~ 12-28 molecules). Data were accounted for statistical differences following a Student's t-test (see Table 1 for p-values and Table 2 for p-values).
Figure 4—figure supplement 1
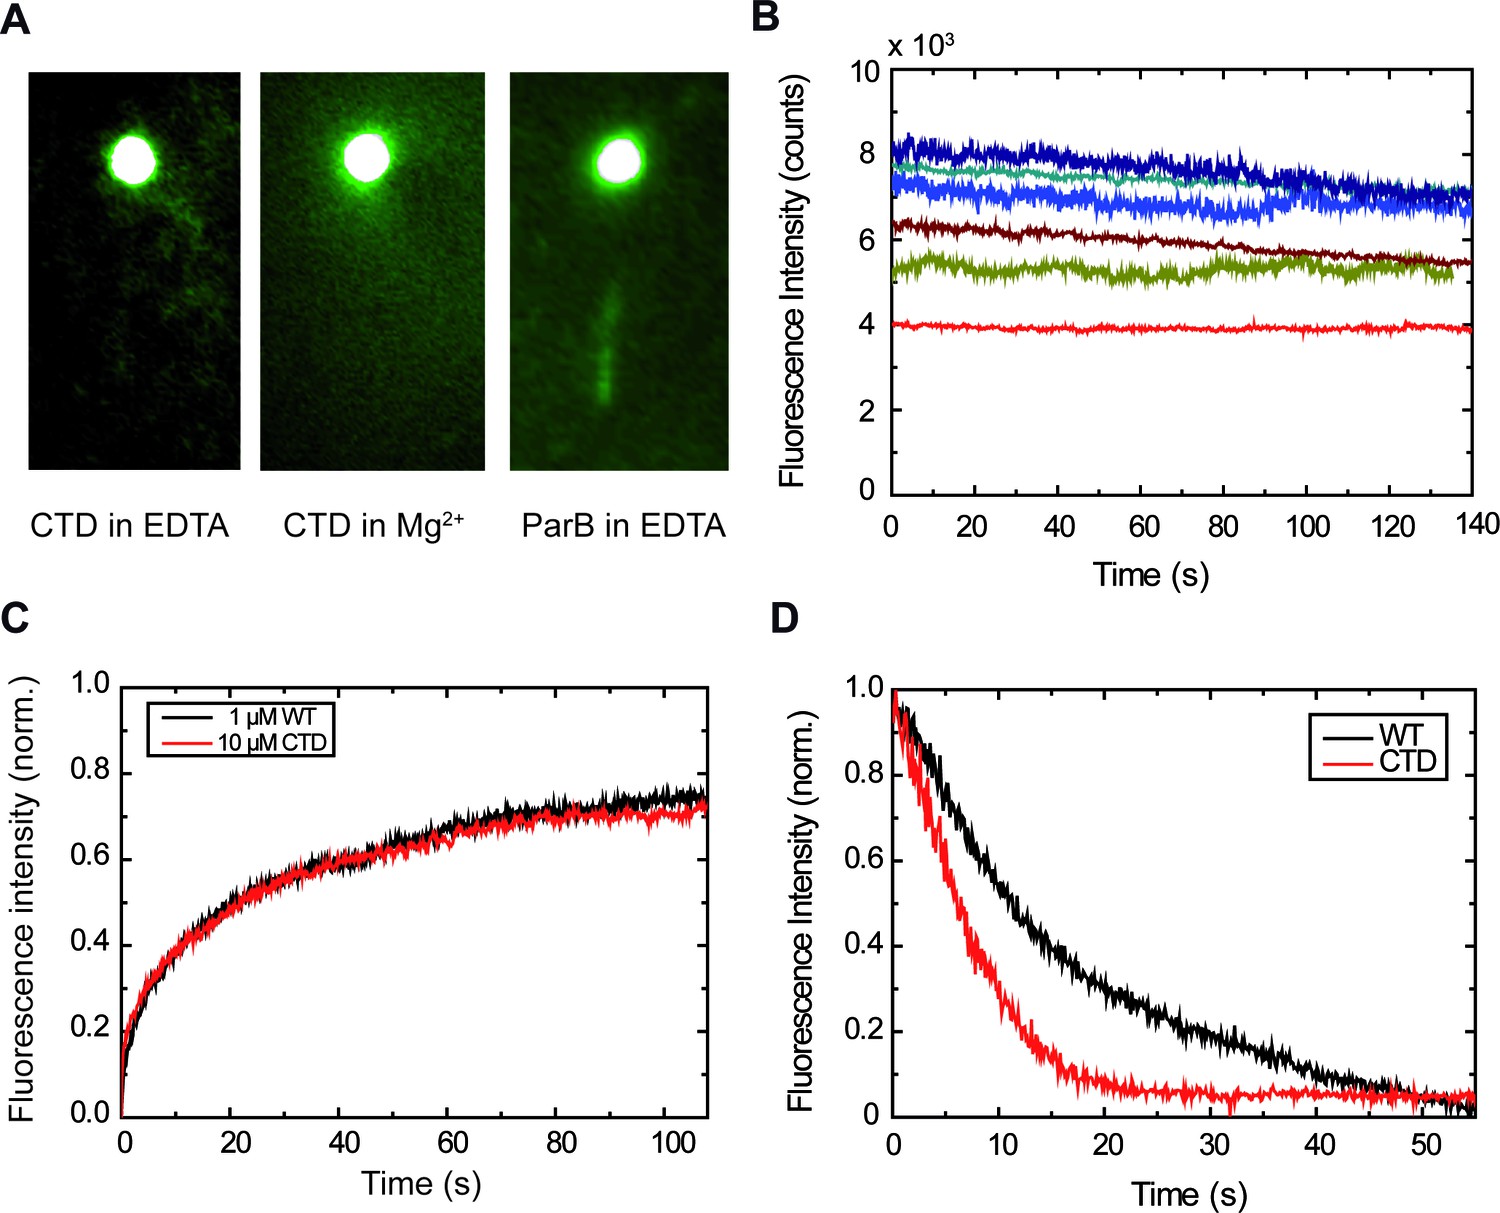
The CTD is capable of binding DNA.
(A) This DNA molecule is visible due to binding by 10 µM CTDAF in buffer supplemented with EDTA, but not with Mg2+. ParBAF complexes are also visible in buffer supplemented with EDTA. (B) Fluorescence intensity traces of CTDAF showing protein exchange, similar to the full-length ParB protein. Differences in bead mobility affect the measured fluorescence signal. (C) Comparison of FRAP experiments. At such high concentrations (≥ 1 μM), there is no noticeable difference between ParBAF and CTDAF. (D) Dissociation experiments of ParBAF and CTDAF flowing protein-free EDTA buffer. Both ParBAF and CTDAF dissociate from DNA, but CTDAF unbinds ~2.3 fold faster than ParB (i.e., has a higher ).
Figure 4—figure supplement 2
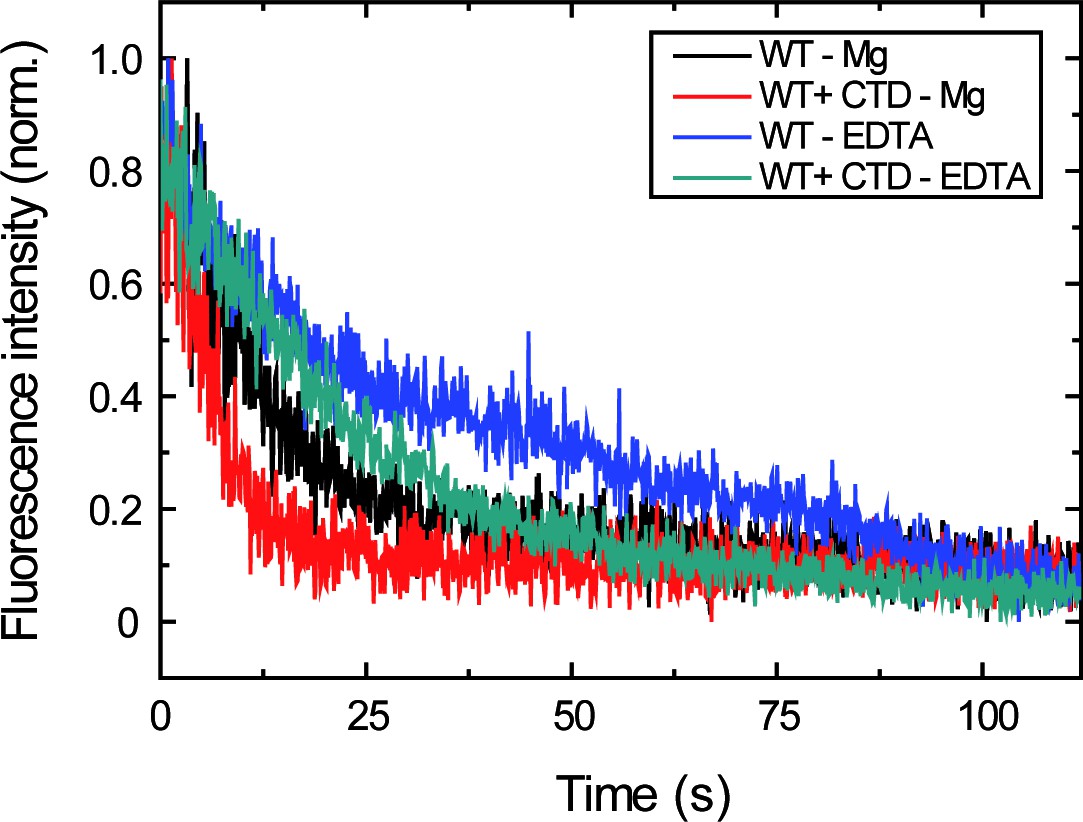
Measuring the effect of the CTD on the dissociation rate in EDTA and Mg2+ buffer conditions.
Representative traces of normalised fluorescence intensity as a function of time for data shown in Figure 4B. Protein binding and unbinding were cyclically measured as described before (Figure 2B) and unbinding traces were fit to Equation 3 to obtain values. The different decay trend under EDTA and Mg2+ conditions, and both in the presence or absence of the CTD, can be appreciated.
Figure 5
Competition of the CTD in ParB binding and unbinding kinetics, and effects in condensation.
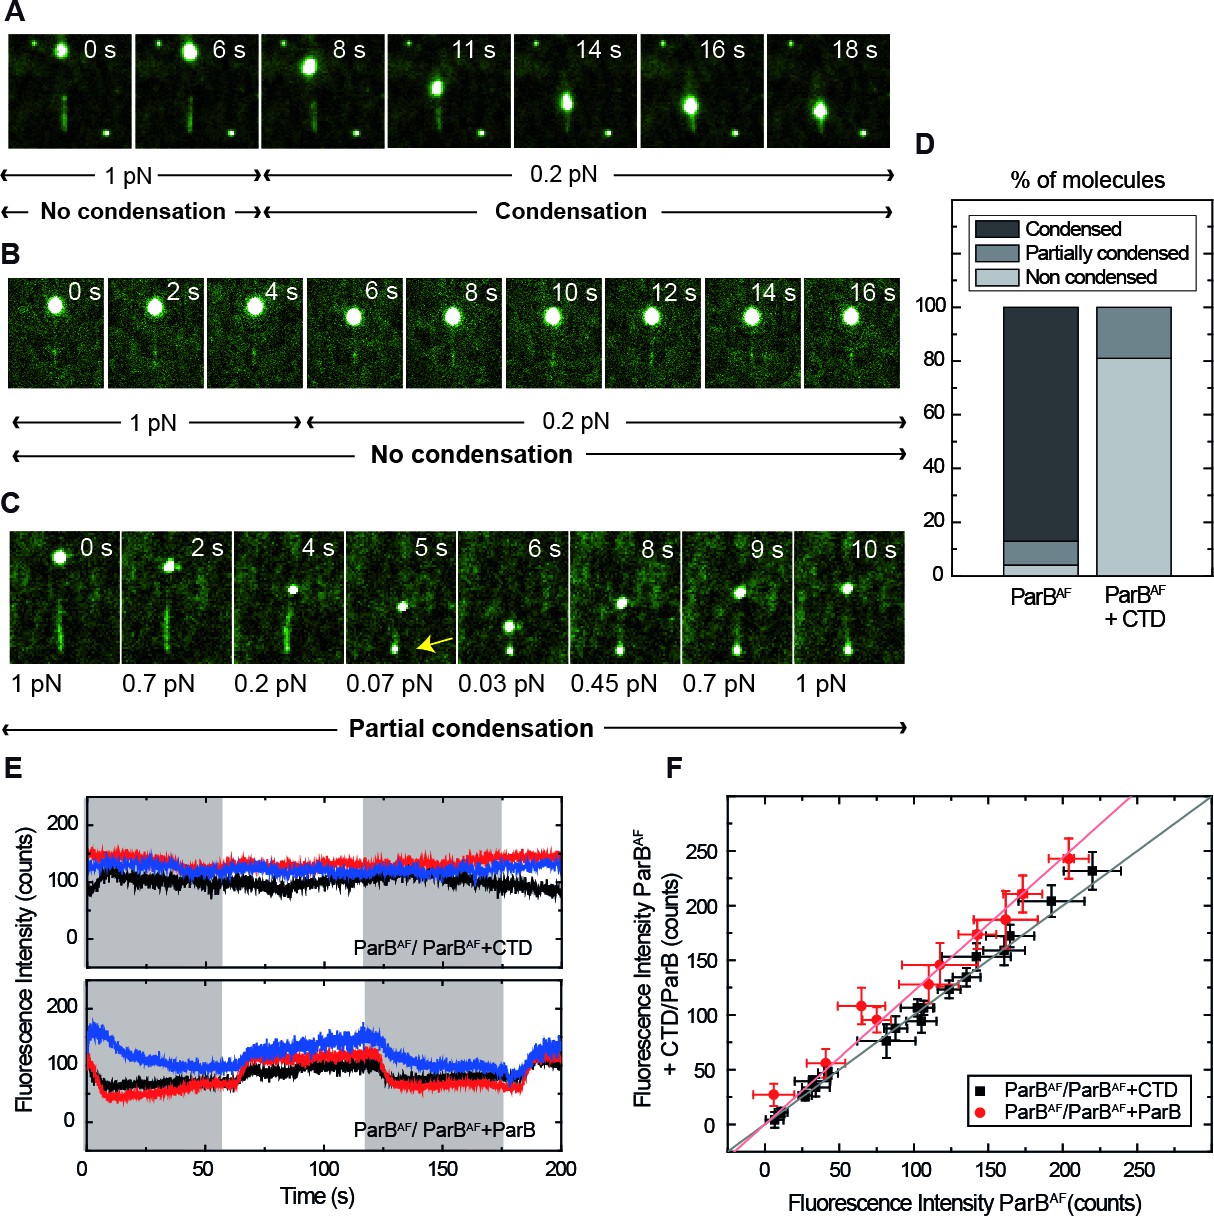
(A) Visualisation of condensation of a single DNA molecule induced by 250 nM ParBAF binding. The volume of the bead causes the DNA to be slightly tilted with respect to the surface such that emission of fluorescence is limited by the penetration depth of the excitation field. The DNA does not condense while held at non-permissive force of 1 pN. However, as in conventional magnetic tweezers experiments, at a permissive force of 0.2 pN a progressive reduction of the DNA length is observed. (B) Condensation experiment as in Figure 5A but in the presence of 2.5 μM non-fluorescent CTD showing that at a constant force of 0.2 pN, ParB is not able to condense to the inhibition of the CTD. Co-incubation with the CTD does not inhibit ParB binding to DNA, as indicated by clearly visible fluorescence filaments. (C) Condensation experiment as in Figure 5B. The CTD inhibits ParB-dependent DNA condensation, even at forces as low as 0.07 pN. Note that some residual condensation was observed at very low forces, visible at the anchoring point (arrow) as shown by the bright dot. (D) Percentage of DNA molecules that were condensed (more than 90% extension reduction), partially condensed or not condensed by ParBAF (less than 10% extension reduction), in the presence (n = 47) or absence of an excess of the CTD (n = 36). (E) Integrated fluorescence intensity in a laminar flow experiment. Intensity remains constant throughout the cycles of ParBAF and ParBAF + CTD (shadowed area), indicating that the excess of CTD is not competing for the binding sites on the DNA, but rather ‘capping’ the DNA-bound ParBAF. Intensity changes when alternating ParBAF with a combination of ParBAF and unlabelled ParB (shadowed areas). (F) Integrated intensity of ParBAF plotted versus the integrated intensity of ParBAF + CTD or ParBAF + ParB. ParBAF + CTD shows a slope of 1.00 ± 0.02 corresponding to unchanged intensity, while ParBAF + ParB shows a slope of 1.23 ± 0.02. (n ~ 10–16 molecules). All experiments were conducted in ParB reaction buffer supplemented with 4 mM Mg2+.
-
Figure 5—source data 1
Integrated fluorescence intensity for 3 molecules throughout the cycles of ParBAF and ParBAF +CTD (constant intensity) or ParBAF and ParBAF +unlabelled ParB (intensity changes).
- https://doi.org/10.7554/eLife.43812.023
Author response image 1
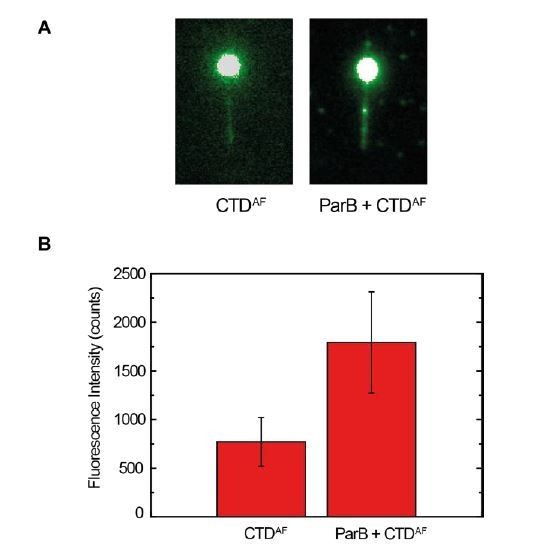
CTDAF binds to full-length ParB bound to DNA.
(A) Fluorescence signal of CTDAF crosslinked with formaldehyde in Mg2+ conditions in the absence of ParB (left) and in the presence of ParB (right). (B) Quantification of fluorescence signal in both experiments. This experiment supports the model of CTDAF dimers dissociate to bind to ParB proteins bound to DNA (Scenario 3, Figure 1D).
Author response image 2
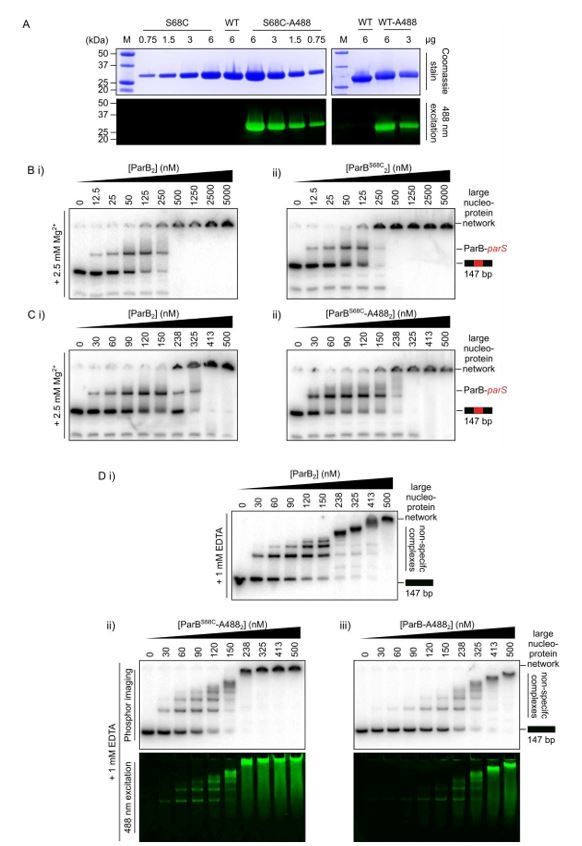
Preparation of functional fluorescently labelled ParB.
(A) SDS-PAGE of finally purified ParBS68C and wild type ParB, selectively and non-selectively, respectively, conjugated to Alexa 488. (B-D) Representative TBM- and TBE-EMSAs to assess the activity of the fluorophore-labelled proteins. Wild-type-like specific and non-specific DNA-binding activity is retained. In-gel detection of the fluorescent protein corresponds to the pattern of nucleoprotein complexes.
Author response image 3
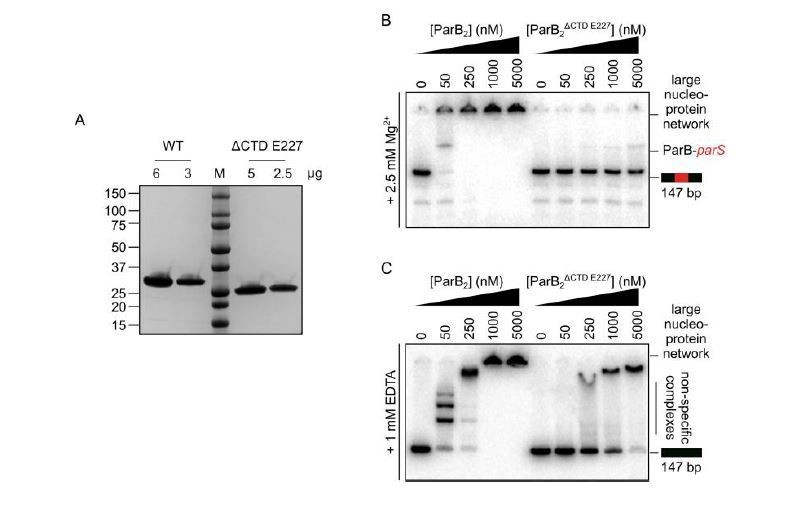
The CTD of ParB is required for the correct folding of the N-terminal and/or central DNA-binding domains.
(A) SDS-PAGE of wild-type ParB and ParBΔCTD E227. 2-6 µg of each was loaded as indicated. (B-C) Representative TBM- and TBE- EMSAs for ParBΔCTD E227 monitoring binding of parS-containing or non-specific 147 bp DNA.
Author response image 4

Author response image 5
Author response image 6
Author response image 7
Videos
Video 1
Movie showing that ParBAF binding increases the intensity along a DNA molecule.
Flow rate of 250 µl/min. Movie is 5X accelerated.
Video 2
Movie showing that intensity remains constant when imaging a ParBAF coated DNA molecule (250 nM).
Movie is 5X accelerated.
Video 3
Movie showing that the intensity of DNA coated with 250 nM ParBAF decays flowing buffer (250 µl/min).
Movie is 5X accelerated.
Video 4
Movie showing that the intensity of DNA coated with 250 nM ParBAF is recovered in FRAP experiment.
Movie is 5X accelerated.
Video 5
Movie showing the laminar flow switching assay.
250 nM ParBAF binding increases intensity along a DNA molecule and unbinding decreases it (total flow rate 200 µl/min). Movie is 5X accelerated.
Video 6
Movie showing that intensity remains constant when imaging 10 µM CTDAF, similar to ParBAF.
Movie is 5X accelerated.
Video 7
Movie showing that 250 nM ParBAF is able to condense DNA under permissive forces.
Movie is 5X accelerated.
Video 8
Movie showing that 250 nM ParBAF does not decondense upon force increase, contrary to ParB in previously published magnetic tweezers assays.
Movie is 5X accelerated.
Video 9
Movie showing that 250 nM ParBAF in the presence of an excess of CTD (2.5 µM) is not able to condense DNA.
Movie is 5X accelerated.
Video 10
Movie showing that 250 nM ParBAF in the presence of an excess of CTD (2.5 µM) is not able to condense DNA even in the absence of magnetic force.
Movie is 5X accelerated.
Video 11
Movie showing that a bright dot sometimes appears at the anchoring point of a DNA molecule in the presence of 250 nM ParBAF.
Movie is 5X accelerated.
Tables
Table 1
Student’s t-test p-values for values.
https://doi.org/10.7554/eLife.43812.019| WT - Mg2+ | WT + CTD Mg2+ | WT - EDTA | WT + CTD - EDTA | |
|---|---|---|---|---|
| WT – Mg2+ | 1 | 0.1235 | 5E-4 | 0.0019 |
| WT + CTD Mg2+ | 1 | 0 | 0 | |
| WT - EDTA | 1 | 6E-5 | ||
| WT + CTD - EDTA | 1 |
Table 2
Student’s t-test p-values for values.
https://doi.org/10.7554/eLife.43812.020| WT - Mg2+ | WT + CTD Mg2+ | WT - EDTA | WT + CTD - EDTA | |
|---|---|---|---|---|
| WT - Mg2+ | 1 | 0.079 | 0.9542 | 0.1139 |
| WT + CTD Mg2+ | 1 | 0.0243 | 0.0103 | |
| WT - EDTA | 1 | 0.1129 | ||
| WT + CTD - EDTA | 1 |
Additional files
-
Source code 1
Custom-written ImageJ script to assemble movies including a time stamp based on individual frames.
- https://doi.org/10.7554/eLife.43812.029
-
Transparent reporting form
- https://doi.org/10.7554/eLife.43812.030
Download links
A two-part list of links to download the article, or parts of the article, in various formats.
Downloads (link to download the article as PDF)
Open citations (links to open the citations from this article in various online reference manager services)
Cite this article (links to download the citations from this article in formats compatible with various reference manager tools)
ParB dynamics and the critical role of the CTD in DNA condensation unveiled by combined force-fluorescence measurements
eLife 8:e43812.
https://doi.org/10.7554/eLife.43812


