Low wnt/β-catenin signaling determines leaky vessels in the subfornical organ and affects water homeostasis in mice
- University Hospital, Goethe University Frankfurt, Germany
- Université libre de Bruxelles, Belgium
- Max-Planck-Institute for Molecular Biomedicine, University of Münster, Faculty of Medicine, Germany
- Kyoto University, Japan
- Excellence Cluster Cardio-Pulmonary systems (ECCPS), Partner site Frankfurt, Germany
- German Cancer Consortium (DKTK), Partner Site Frankfurt/Mainz, Germany
- German Center for Cardiovascular Research (DZHK), Partner site Frankfurt/Mainz, Germany
- German Cancer Research Center (DKFZ), Germany
- Walloon Excellence in Life Sciences and Biotechnology (WELBIO), Belgium
Figures
Figure 1 with 2 supplements
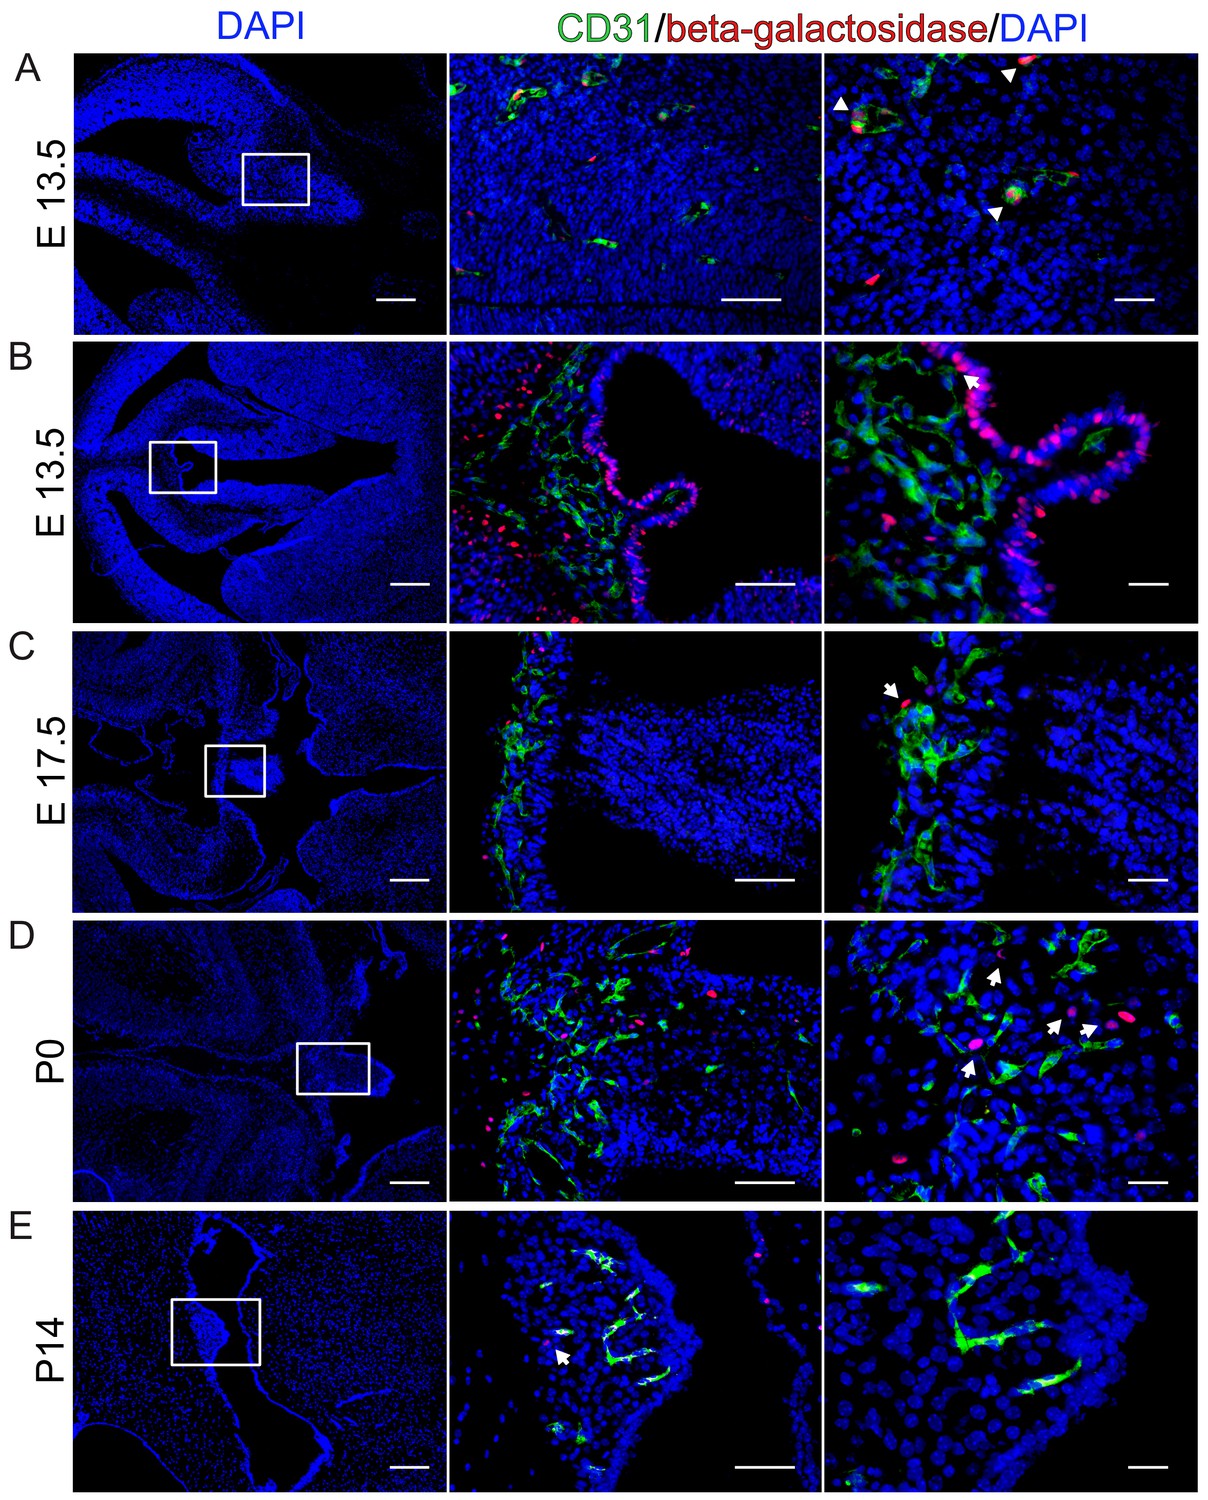
β-Catenin signaling is undetectable at different developmental stages in BAT-gal reporter mice.
(A) Endothelial reporter gene expression, indicating β-catenin activity is detectable in cortical endothelial cells at E13.5 (arrowheads). (B–E) No β-catenin signaling could be detected in ECs at developmental stages E13.5, E17.5, P0 and P14 within the SFO. Arrows point to β-galactosidase positive nuclei. Scale bar: left (200 µm), middle (50 µm) and right column (20 µm).
Figure 1—figure supplement 1
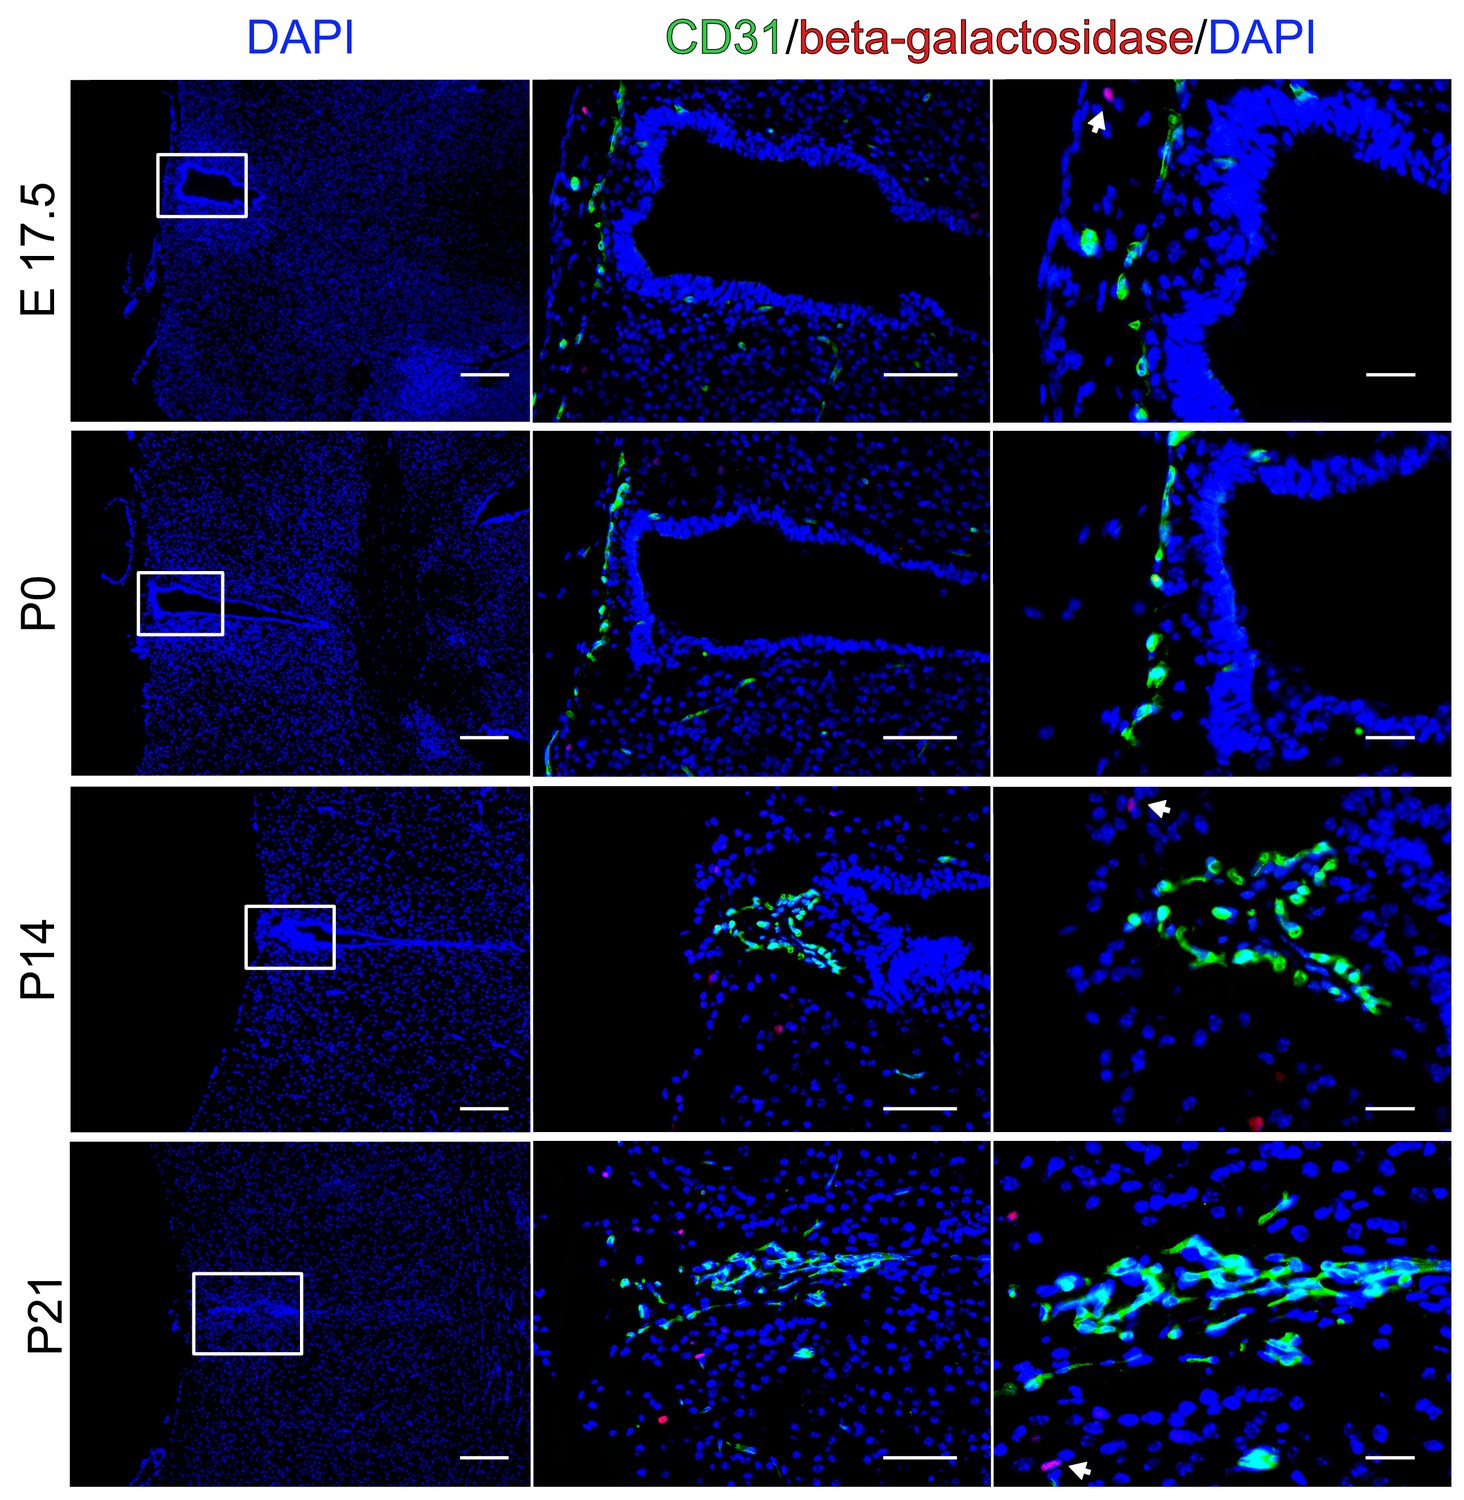
No endothelial β-catenin signaling in the organum vasculosum of the lamina terminalis (OVLT) during development.
OVLT from E17.5 - P21 of BAT-gal reporter mice. Arrows point to β-galactosidase-positive nuclei in non-endothelial cells. Scale bar: left (200 µm), middle (50 µm), right column (20 µm).
Figure 1—figure supplement 2

No β-catenin activity in endothelial cells of the pineal gland (PI) during development.
Pineal gland (PI) of BAT-gal reporter mice in the developmental stages E17.5 and P0. Arrows point to β-galactosidase-positive nuclei in non-endothelial cells. Scale bar: left (200 µm), middle (50 µm), right column (20 µm).
Figure 2
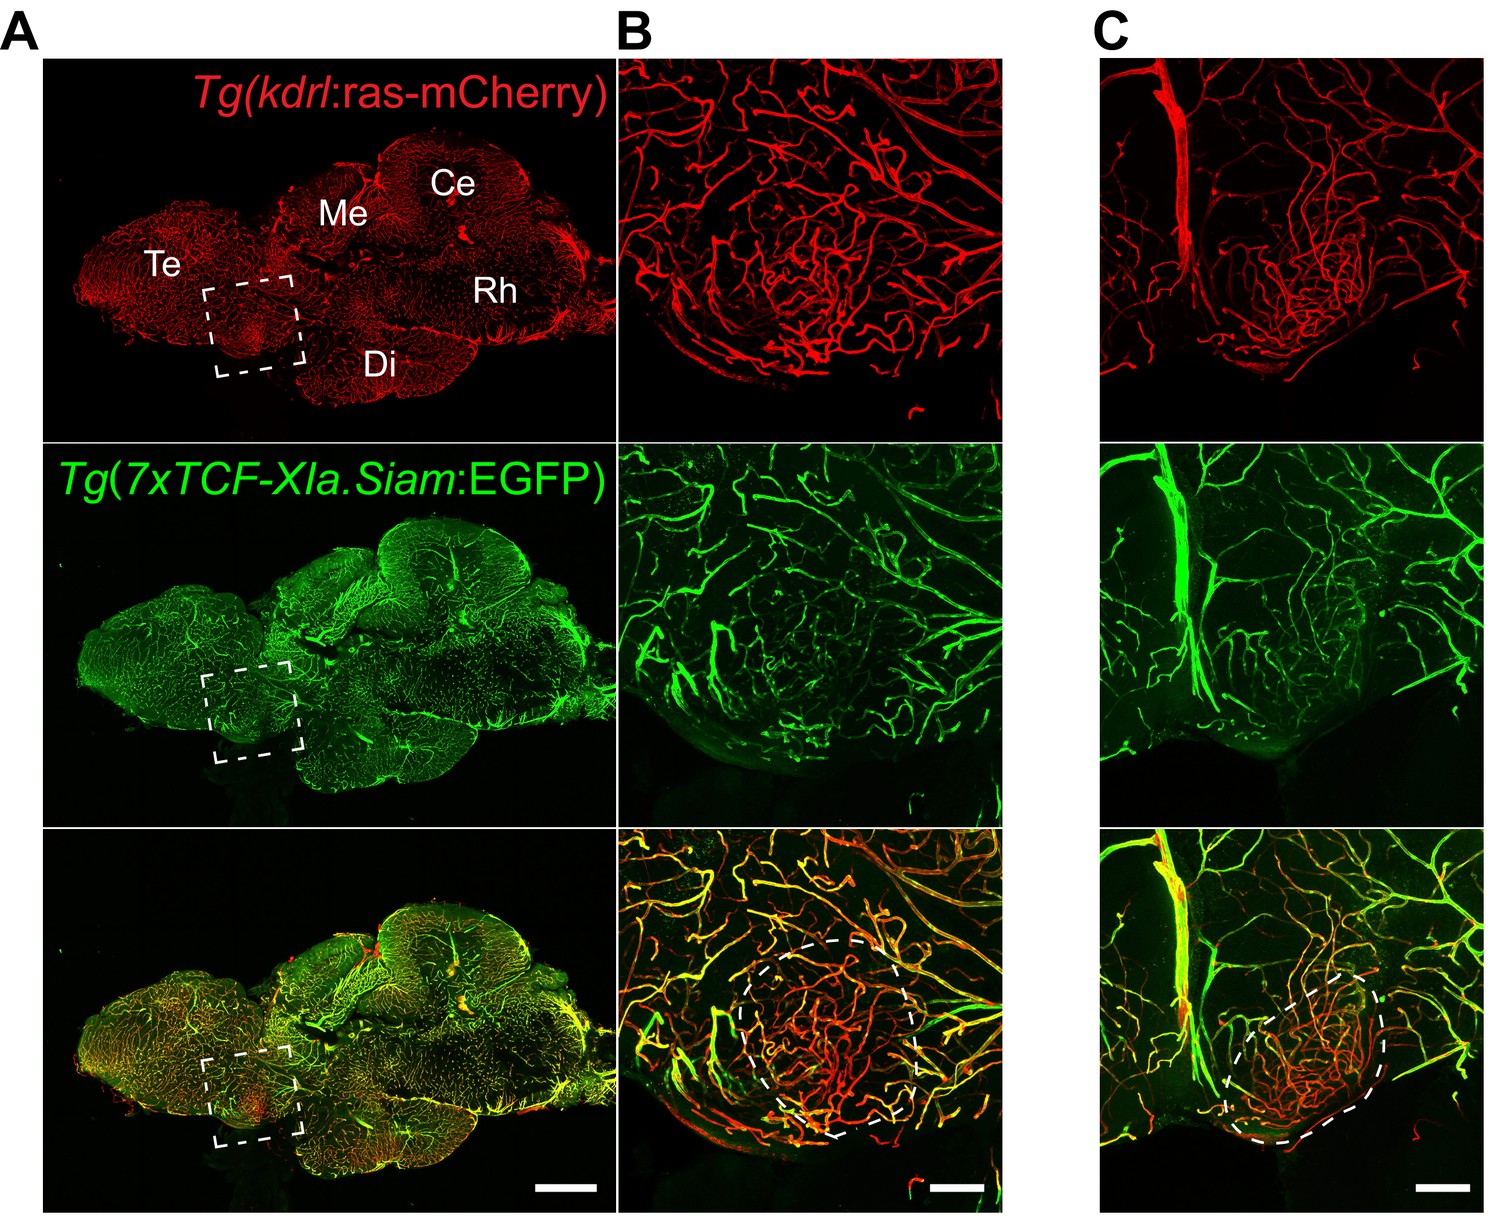
Low Wnt/β-catenin signaling in the adult zebrafish OVLT.
(A) Midline sagittal section of an adult Tg(kdrl:ras-mCherry):Tg(7xTCF-Xia.Siam:EGFP) zebrafish brain. The OVLT-containing area, anatomically-defined following Jeong et al. (2008), is boxed in white. (B) Higher magnification view of (A). The dense and tortuous OVLT endothelium (red) exbibits low Wnt-reporter activity (green) compared to the surrounding vessels. (C) Same as (B) in another individual. Scale bars: (A) 500 μm, (B) and (C) 100 μm; Te, Telencephalon; Me, Mesencephalon; Di, Diencephalon; Ce, Cerebellum; Rh, Rhombencephalon.
Figure 3 with 1 supplement
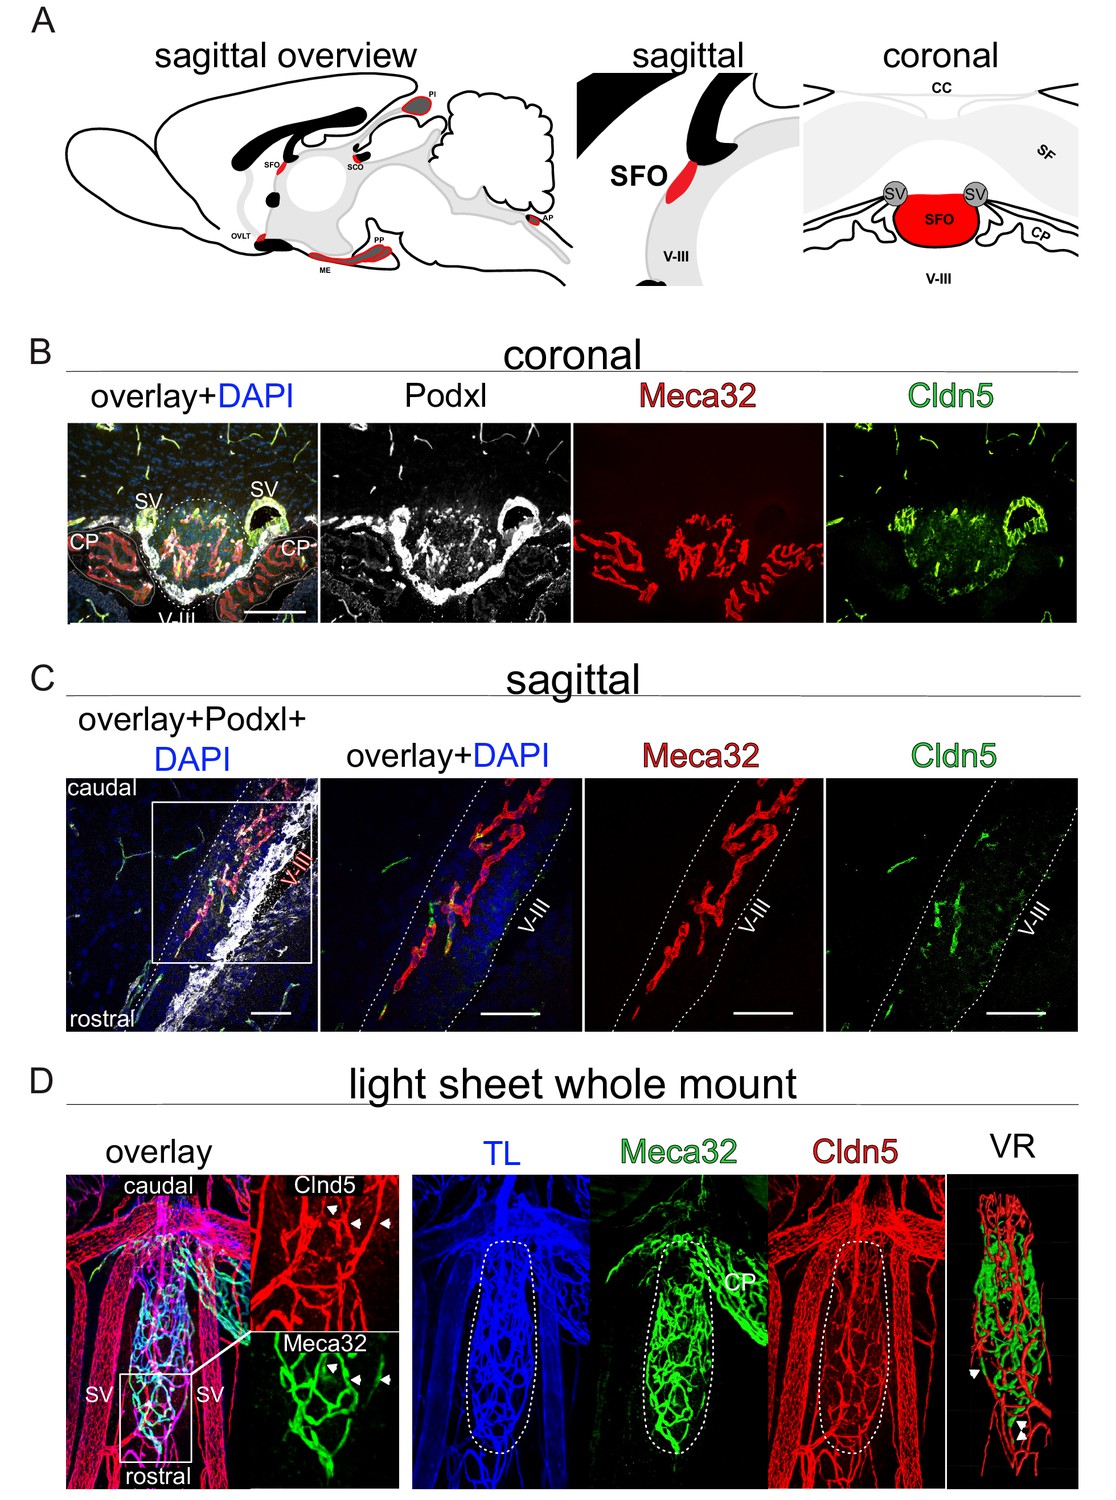
Heterogeneous barrier phenotype in vessels of the adult wild type subfornical organ (SFO).
(A) Sagittal scheme of all circumventricular organs (CVOs) (left overview), the SFO in detail (middle sagittal, right coronal) provide an orientation. (B) Heterogenous barrier phenotype in coronal fluorescence images, (C) sagittal confocal projections of the rostral SFO tip and (D) light sheet projections of whole mount SFO samples with leaky MECA32+ and tight Cldn5+ vessels. Scale bars: (B) 100 µm, (D) first picture 50 µm and following 20 µm. SFO, Subfornical organ; OVLT, organum vasculosum of lamina terminalis; ME, median eminence; PP, posterior pituitary; SCO, subcommisural organ; PI, pinal organ; AP, area postrema; SV, septal veins; V-III, third ventricle; CP, choroid plexus; CC, corpus callosum; SF, septofimbrial nucleus; TL, tomato lectin; VR, volume rendering.
Figure 3—figure supplement 1
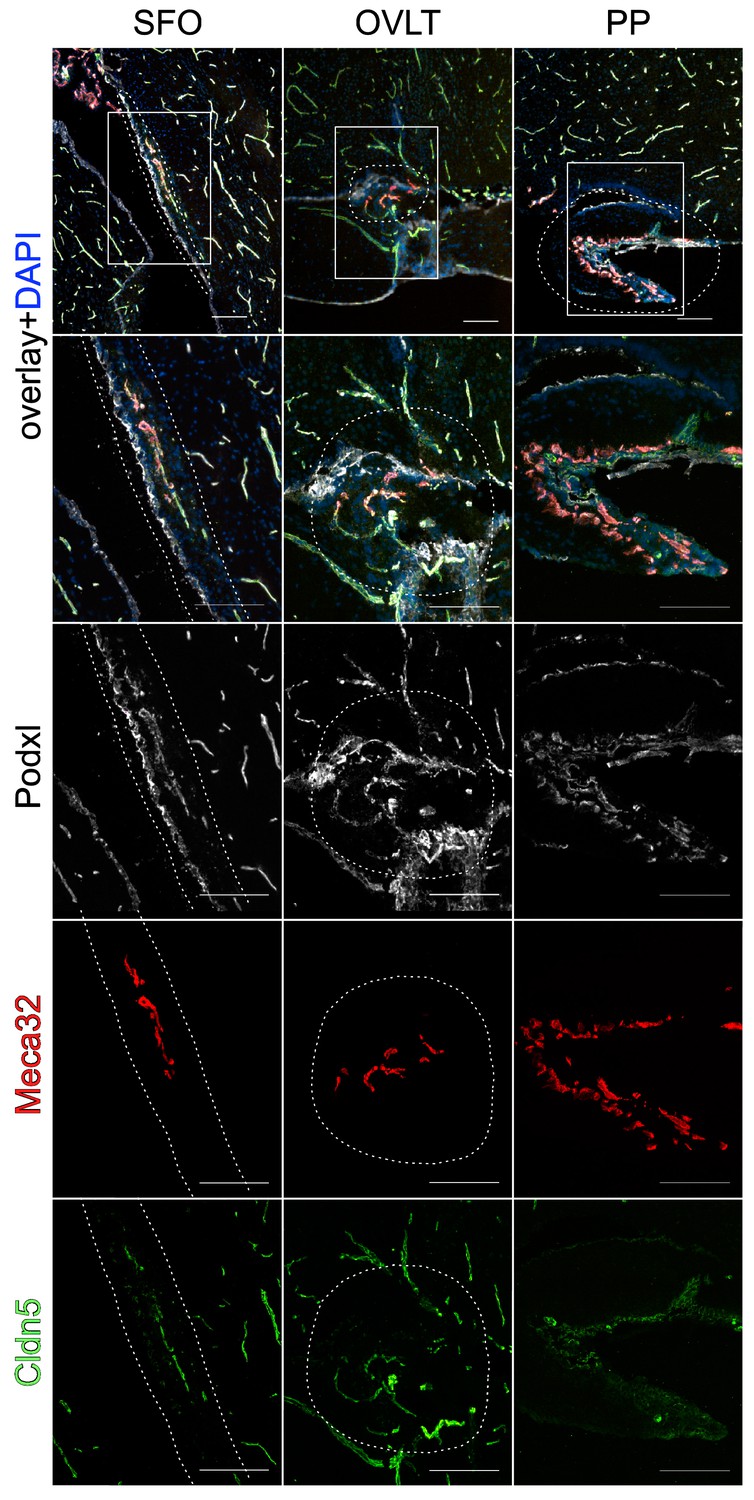
Vessel heterogeneity in sensory circumventricular organs (CVOs) involved in water homeostasis.
Plvap/Meca32- and Cldn5-positive ECs in vessels of the SFO, OVLT and PP, demonstrating vessels heterogeneity. Scale bar: left (200 µm), middle (50 µm), right column (20 µm).
Figure 4 with 3 supplements
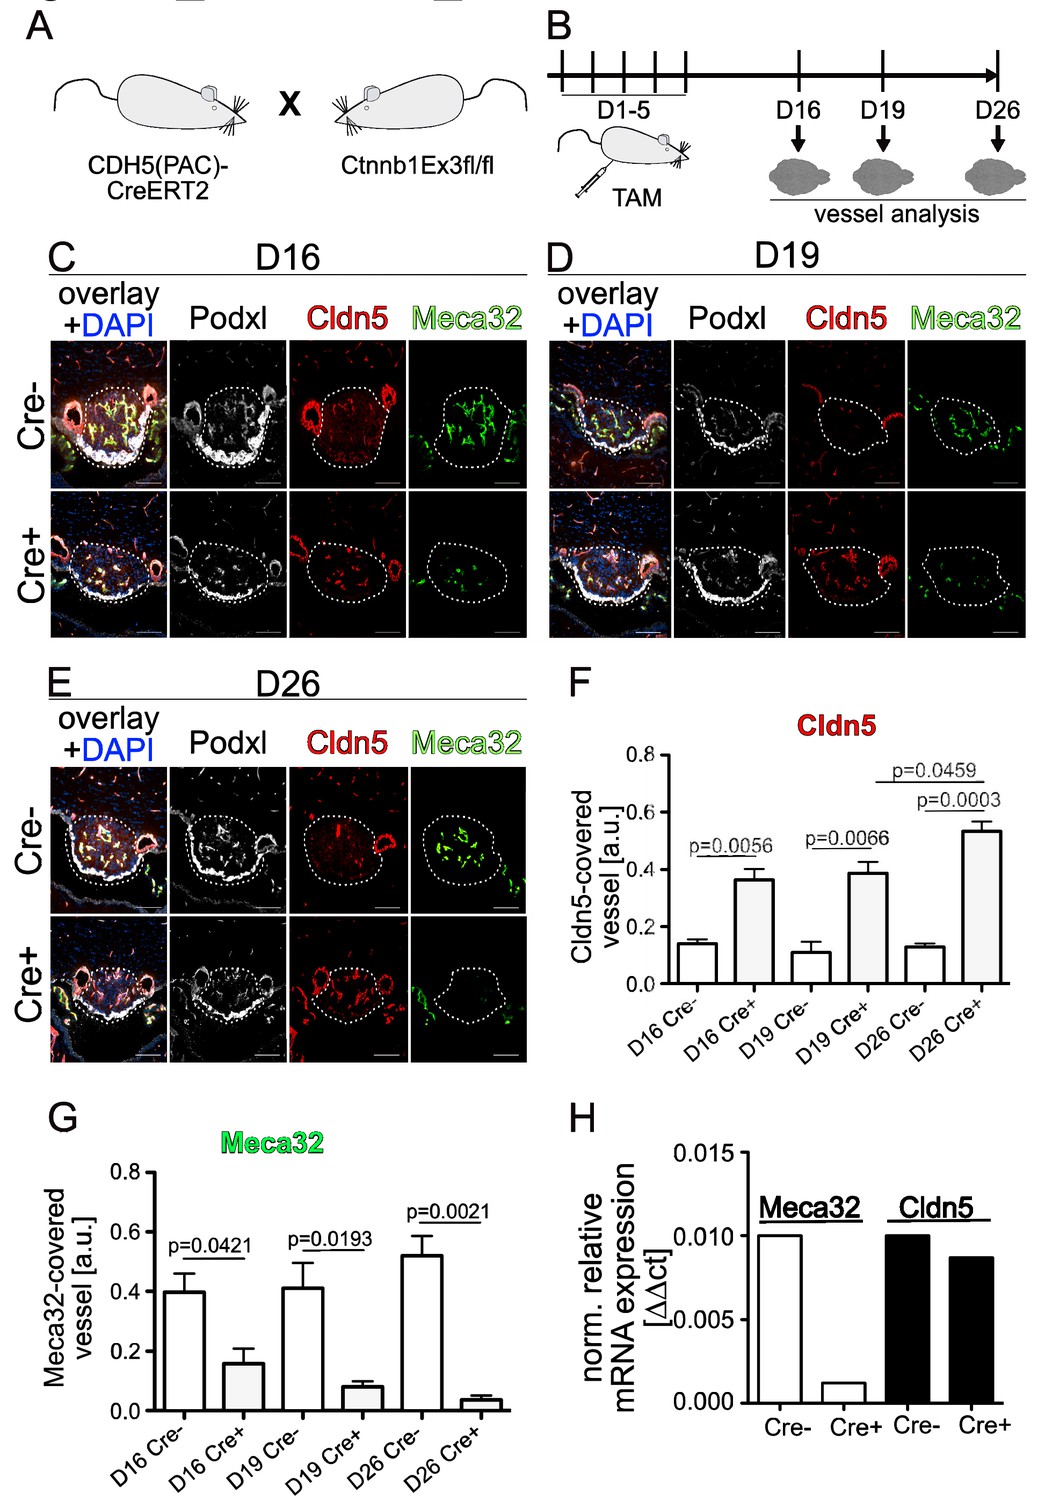
Endothelial-specific β-catenin GOF tightens the vasculature of the subfornical organ (SFO).
(A) Mouse model and (B) schedule of endothelial-specific β-catenin GOF induction by tamoxifen (TAM) . Coronal view of the subfornical organ (SFO) (C) 16 , (D) 19 and (E) 26 days after the first TAM injection. (F) Quantification for Cldn5 and (G) Meca32-covered vessel area within the SFO (n = 3 per group). (H) Relative mRNA expression of SFO whole mount tissue (n = 1 of pooled samples (Cre- = 18 mice, Cre+ = 17 mice)). Scale bars: (C–E) 100 µm; error bars show ±SEM.
-
Figure 4—source data 1
Quantification of endodthelial-specific β-catenin GOF-mediated vessel tightening in the vasculature of the subfornical organ (SFO) of Cdh5(PAC)-CreERT2:Ctnnb1Ex3fl/wt mice.
- https://doi.org/10.7554/eLife.43818.016
-
Figure 4—source data 2
Quantification of Meca32 and Cldn5 mRNA expression by qRT-PCR in the vasculature of the subfornical organ (SFO) of Cdh5(PAC)-CreERT2:Ctnnb1Ex3fl/wt mice.
- https://doi.org/10.7554/eLife.43818.017
Figure 4—figure supplement 1

Tightening of subfornical organ (SFO) vessels at early postnatal stages.
(A) Cre recombinase of Cdh5(PAC)-CreERT2:Ctnnb1Ex3fl/fl was induced by tamoxifen injection (TAM) from P0 to P3. Analysis of Cldn5 and Plvap/Meca32 at P6 (A) and P14 (B) and the resulting quantification (for P6) of marker area normalized to Cdh5 area (C) (n = 3; a.u., arbitrary units). Scale bar 100 µm; error bars show ±SEM.
-
Figure 4—figure supplement 1—source data 1
Quantification of subfornical organ (SFO) vessel tightening at early postnatal stages.
- https://doi.org/10.7554/eLife.43818.012
Figure 4—figure supplement 2
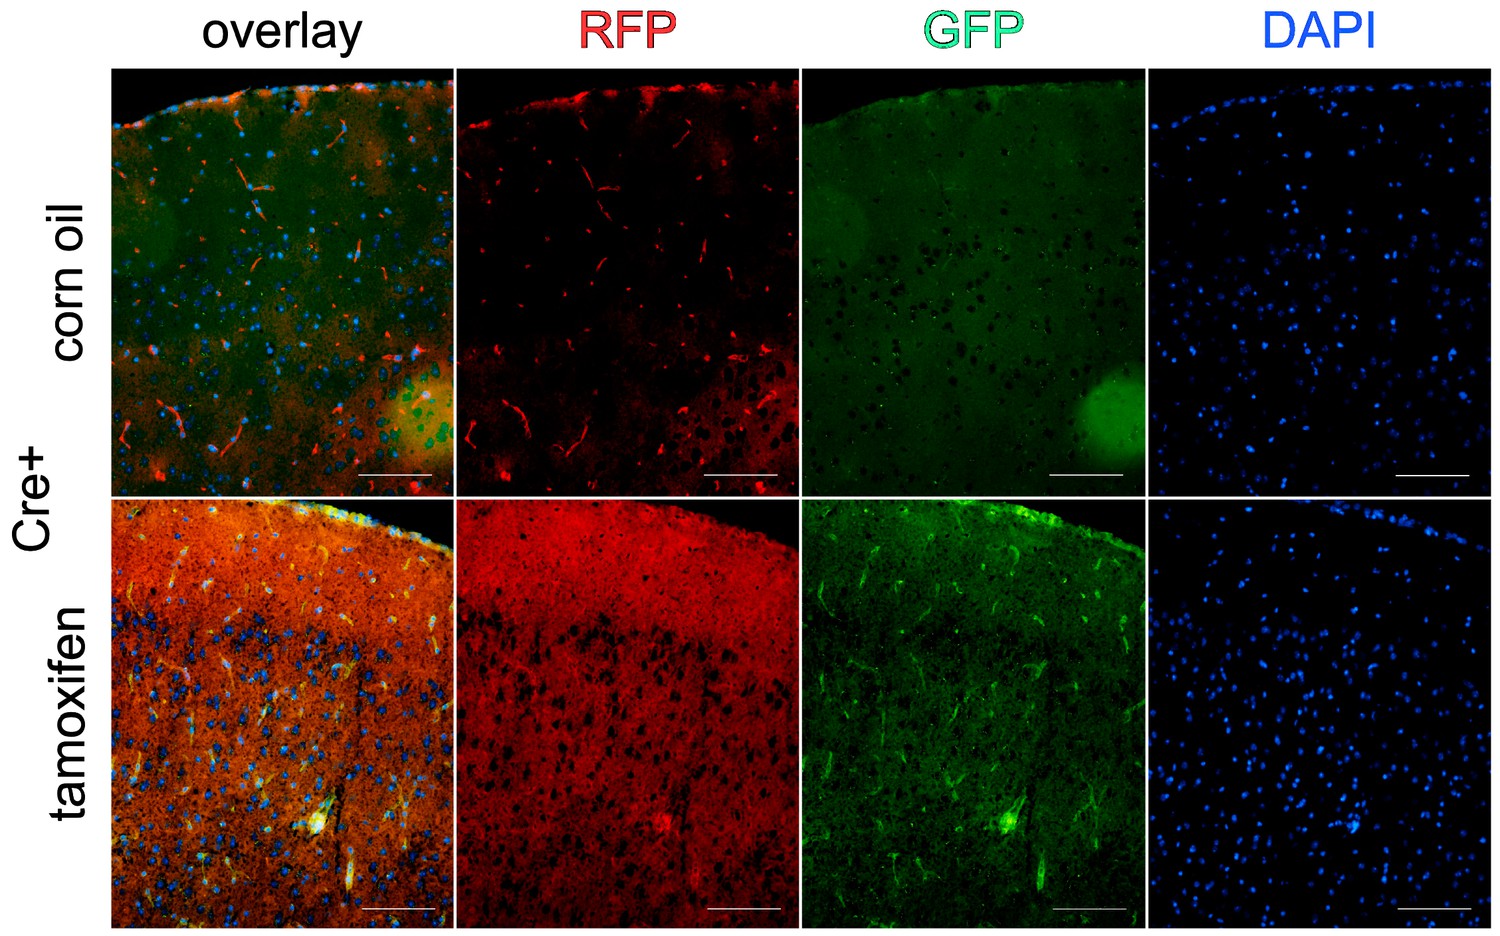
Recombination of Cdh5(PAC)-CreERT2 in brain vasculature.
Cdh5(PAC)-CreERT2:mTmGfl/wt mice either injected with tamoxifen or corn oil were analyzed for recombination. Scale bar 100 µm.
Figure 4—figure supplement 3
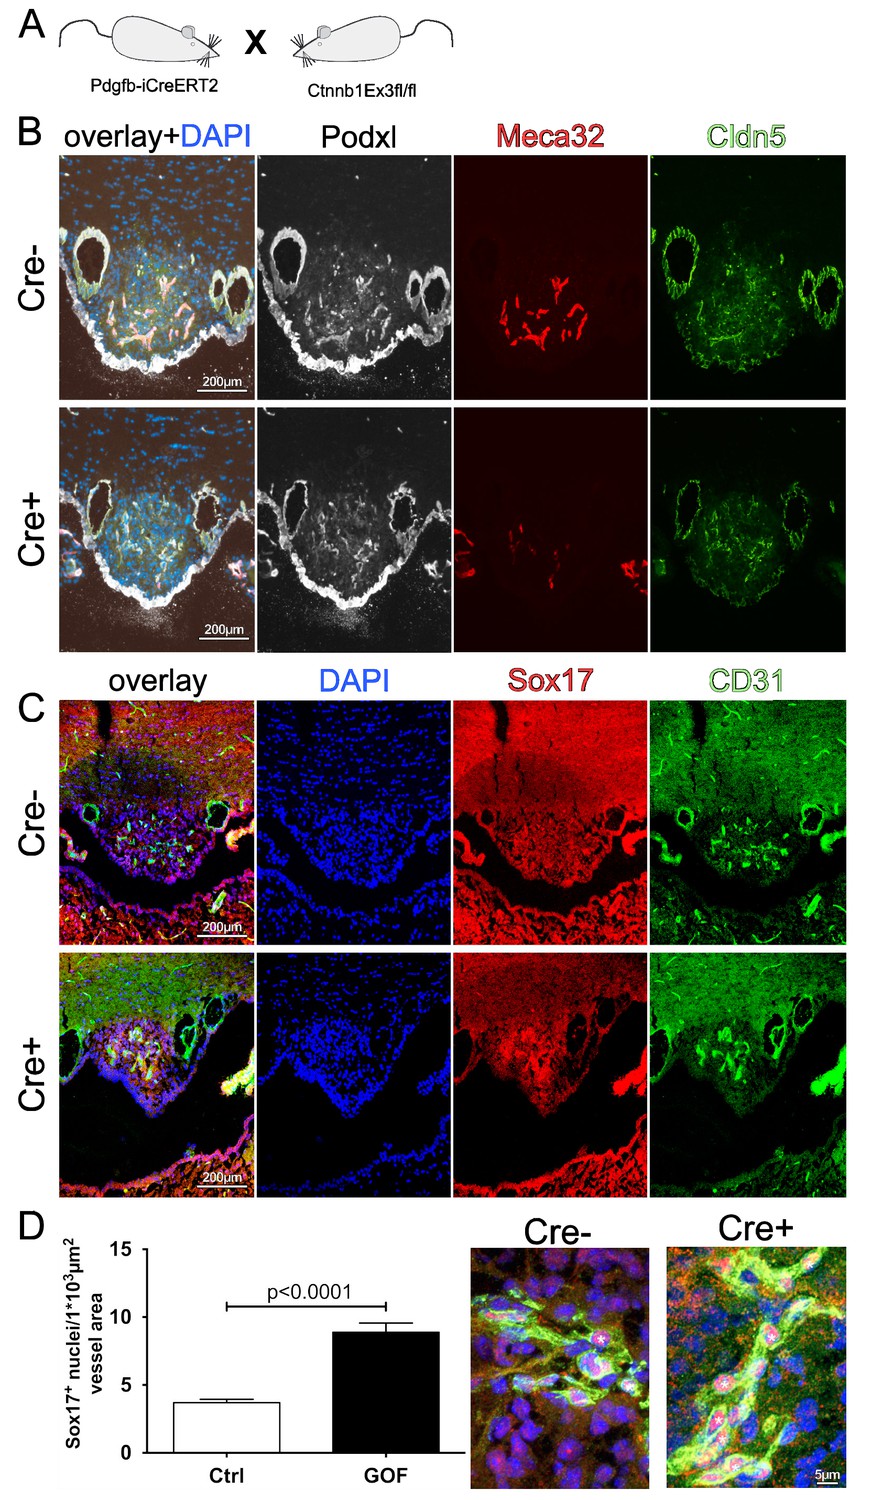
Pdgfb-iCreERT2:Ctnnb1fl/wt show tightening of subfornical organ (SFO) vasculature.
(A) Scheme of used mouse lines. (B) Adult SFO from control (Cre-) and β-catenin GOF (Cre+) mice (C). Overview of Sox17 induction in Cre- and Cre+ mice in the SFO. (D) Quantification (n = 3) and a higher magnification of confocal Sox17 staining. Asterisks indicate positive Sox17 staining in endothelial cells. Scale bar 100 µm; error bars show ±SEM.
-
Figure 4—figure supplement 3—source data 1
Quantification of subfornical organ (SFO) vessel tightening in Pdgfb-iCreERT2:Ctnnb1Ex3fl/wt mice.
- https://doi.org/10.7554/eLife.43818.015
Figure 5 with 1 supplement
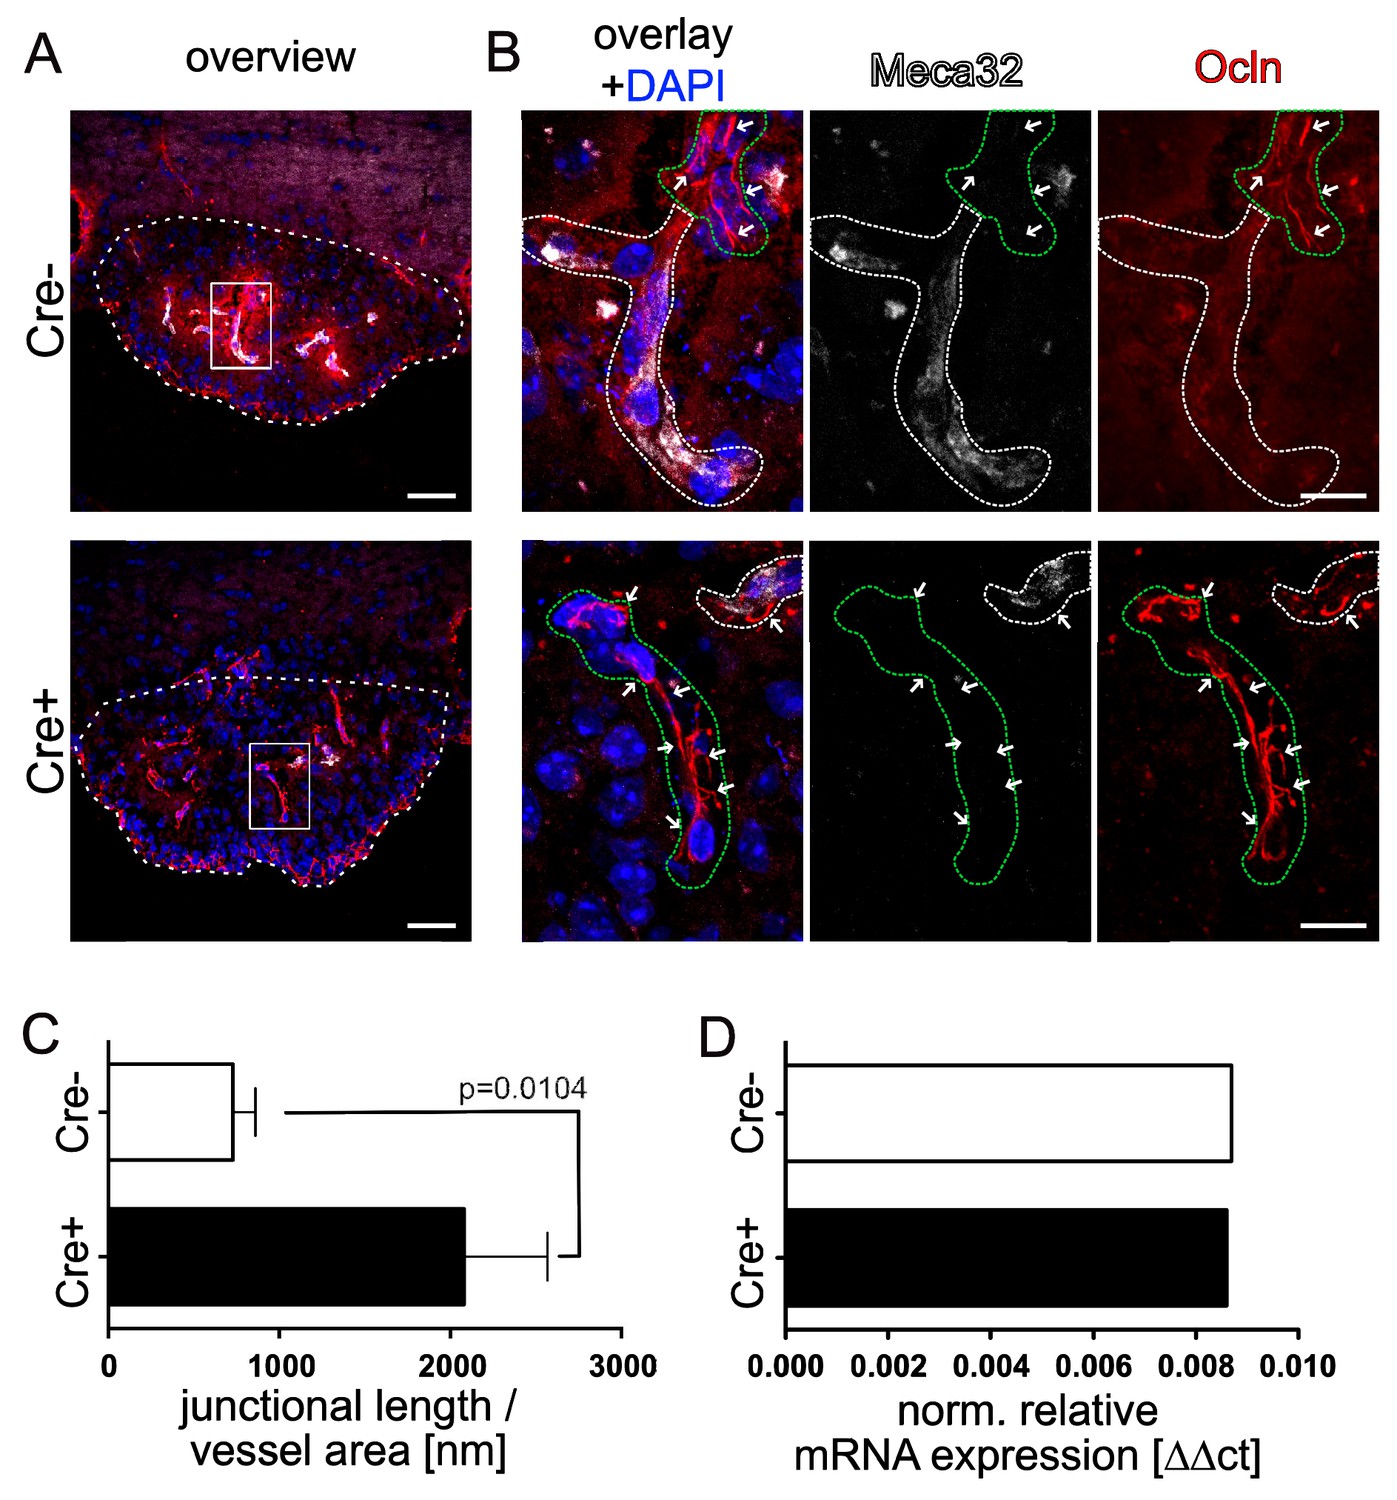
Endothelial-specific β-catenin GOF leads to increased occludin localization at cell-cell junctions in the vasculature of the subfornical organ (SFO).
(A) Coronal view of the subfornical organ (SFO) 26 days after the first TAM injection; dashed line demarcates the SFO. (B) Higher magnification of an SFO vessel indicated by the rectangular inset in A, white dashed lines show Meca32+, green dashed lines show Meca32 vessels, arrows indicate junctional Ocln staining. (C) Quantification for Ocln junctional length normalized to the vessel area within the SFO (n = 3 per group). (D) Relative mRNA expression of SFO whole mount tissue (n = 1 of pooled samples (Cre-=18 mice, Cre+=17 mice)) . Scale bars: (A) 50 µm, (B) 10 µm; error bars show ±SEM.
-
Figure 5—source data 1
Quantification of occludin localization at cell-cell junctions in the vasculature of the subfornical organ (SFO) in Cdh5(PAC)-CreERT2:Ctnnb1Ex3fl/wt mice.
- https://doi.org/10.7554/eLife.43818.020
-
Figure 5—source data 2
Quantification of occludin mRNA expressionby qRT-PCR in the vasculature of the subfornical organ (SFO) in Cdh5(PAC)-CreERT2:Ctnnb1Ex3fl/wt mice.
- https://doi.org/10.7554/eLife.43818.021
Figure 5—figure supplement 1
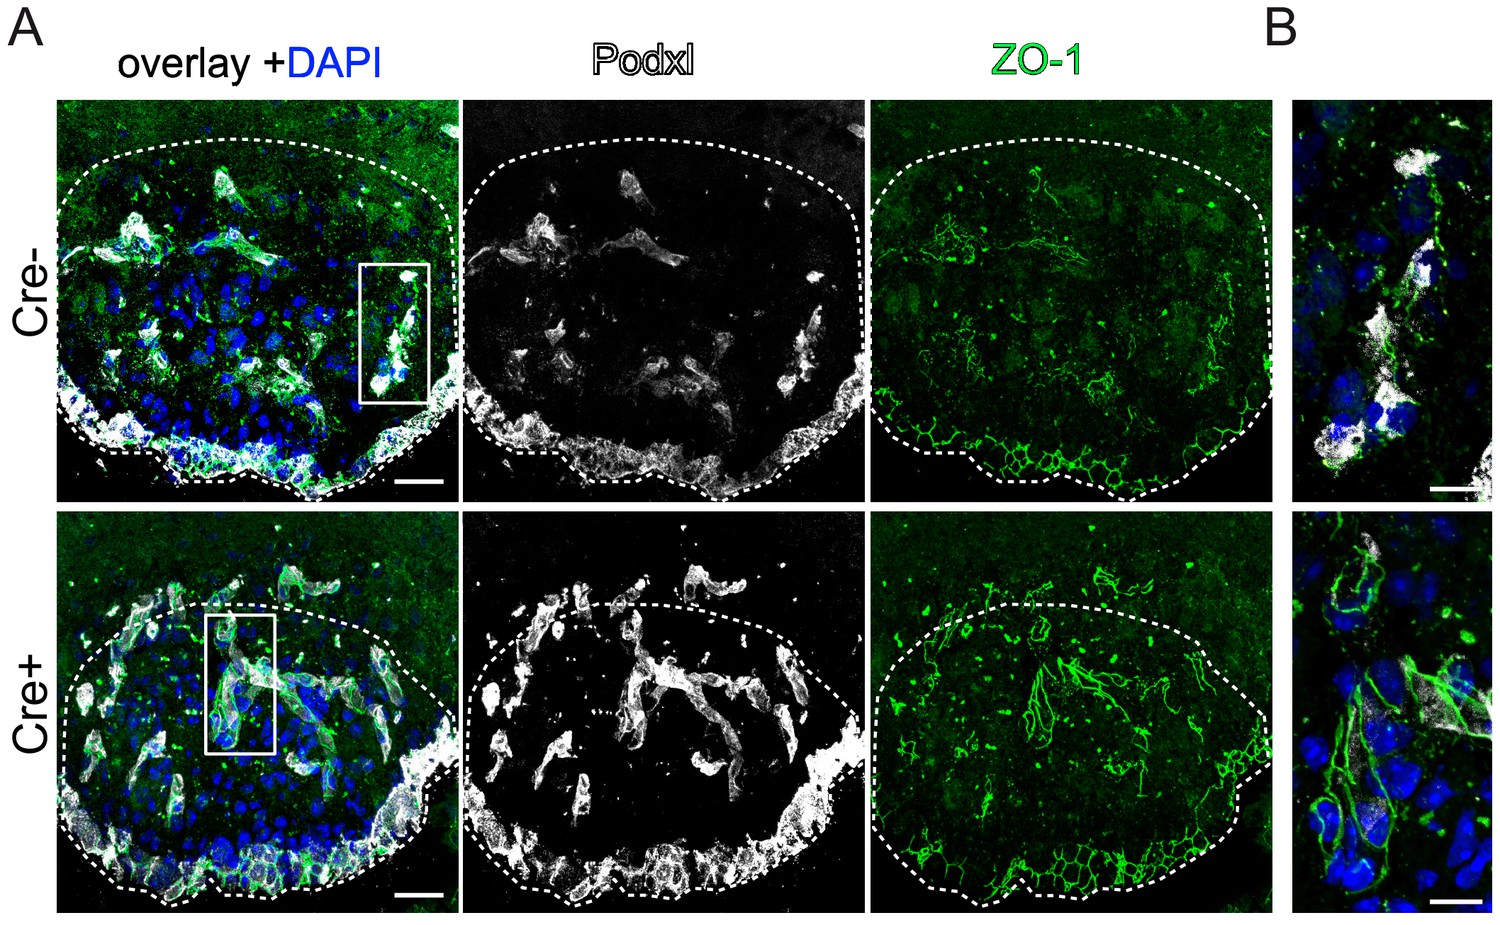
Endothelial-specific β-catenin GOF did not lead to an evident increase in ZO-1 localization at cell-cell junctions in the vasculature of the subfornical organ (SFO).
Coronal view of the subfornical organ (SFO) 26 days after the first TAM injection stained for podocalyxin as a vascular/luminal marker, ZO-1 and DAPI (A). Higher magnification of an SFO vessel indicated by the rectangular inset in A (B). Dashed line demarcates the SFO. Scale bars: 25 µm (A), 10 µm (B).
Figure 6
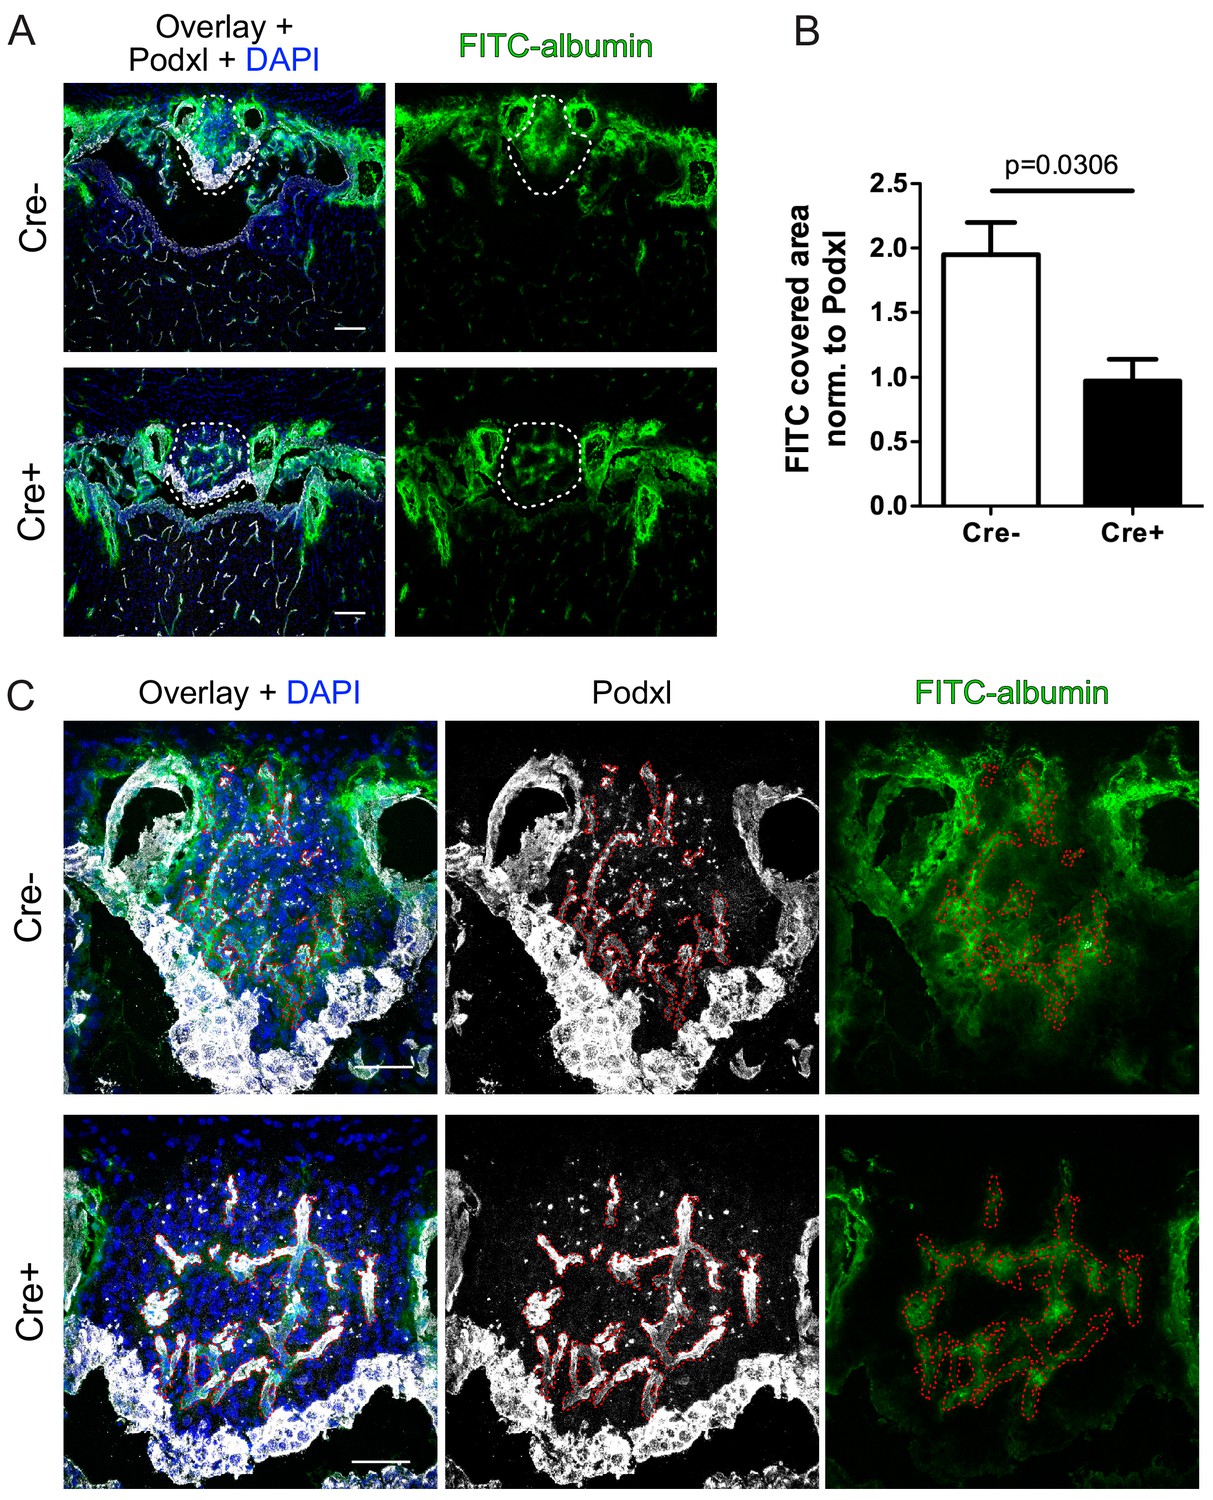
Reduction of vascular permeability by endothelial specific β-catenin gain-of-function (GOF).
(A) Overview and (C) high magnification shows leakage of FITC labelled albumin within the SFO of Cre- and Cre+ mice. Dashed lines indicate SFO (A) or vessel outline (C). (B) Quantification of FITC-positive SFO area normalized to the vessel area (Cre- = 4 mice, Cre+ = 3 mice). Scale bars: (A) 100 µm; (C) 50 µm; error bars show ±SEM.
-
Figure 6—source data 1
Quantification of FITC-BSA extravasation in the vasculature of the subfornical organ (SFO) in Cdh5(PAC)-CreERT2:Ctnnb1Ex3fl/wt mice.
- https://doi.org/10.7554/eLife.43818.023
Figure 7 with 2 supplements

Tightening of vessels in the subfornical organ (SFO) on cellular level.
(A) Semithin sections of SFO of endothelial-specific β-catenin GOF (Cre+) and controls (Cre-). Electron microscopic picture of Cre- (B), (C), left column) and Cre+ (B), (C), right column). Black arrow heads indicate fenestrations, with arrows endothelial junctions, asterisks show vesicles. AC, astrocyte; EC, endothelial cell; L, lumen; PC, pericyte. (D) Number of fenestrations are quantified in three vessel sections per animal (n = 4). Error bars show ±SEM.
-
Figure 7—source data 1
Quantification of endothelial fenestrations in the vasculature of the subfornical organ (SFO) in Cdh5(PAC)-CreERT2:Ctnnb1Ex3fl/wt mice.
- https://doi.org/10.7554/eLife.43818.027
Figure 7—figure supplement 1
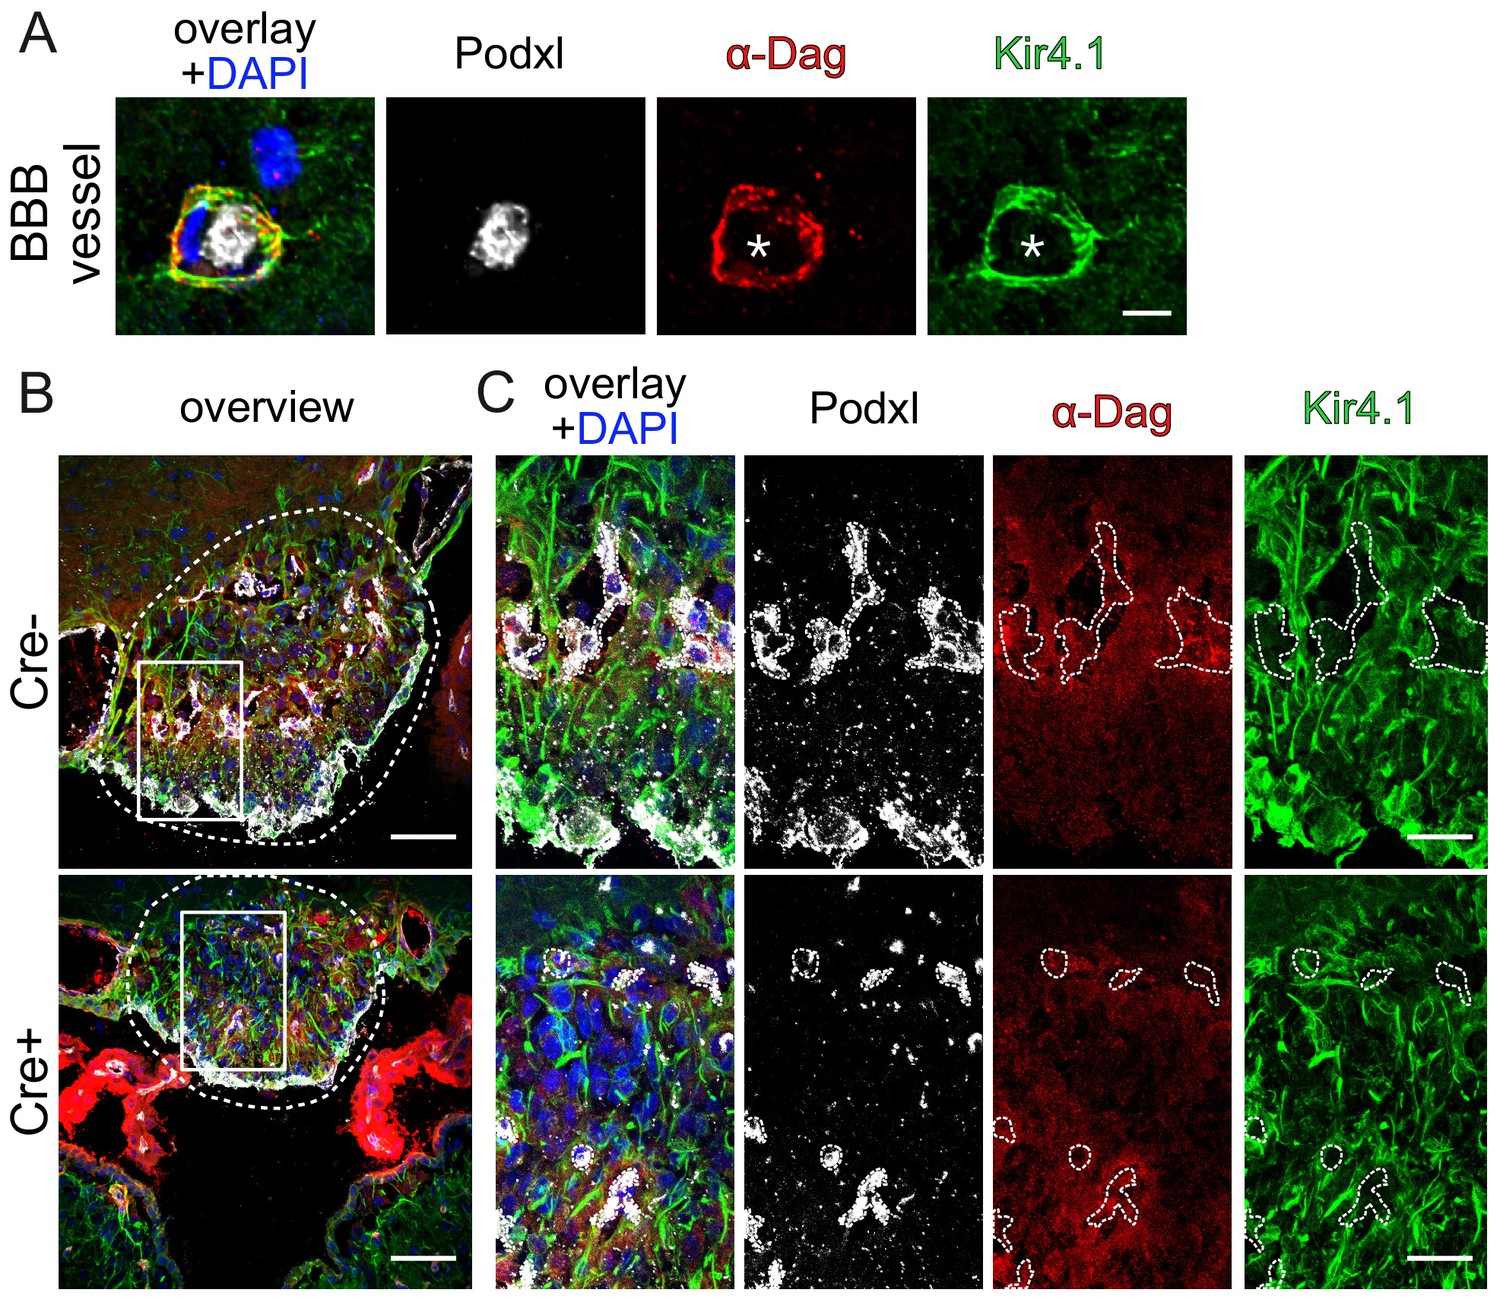
Endothelial β-catenin GOF does not affect astrocytic endfoot polarization of α-dystroglycan (α-Dag) and Kir4.1 within the subfornical organ (SFO).
Striatal BBB-vessel showing a polarized distribution of α-Dag and Kir4.1 in AC endfeet. Lumen is stained by Podxl (asterisk) (A). Coronal overview of the subfornical organ (SFO) (B); rectangular inset demarcates area for higher magnification in (C). Dashed lines outline SFO vessels. Scale bar show 2 µm (A), 50 µm (B), 10 µm (C).
Figure 7—figure supplement 2
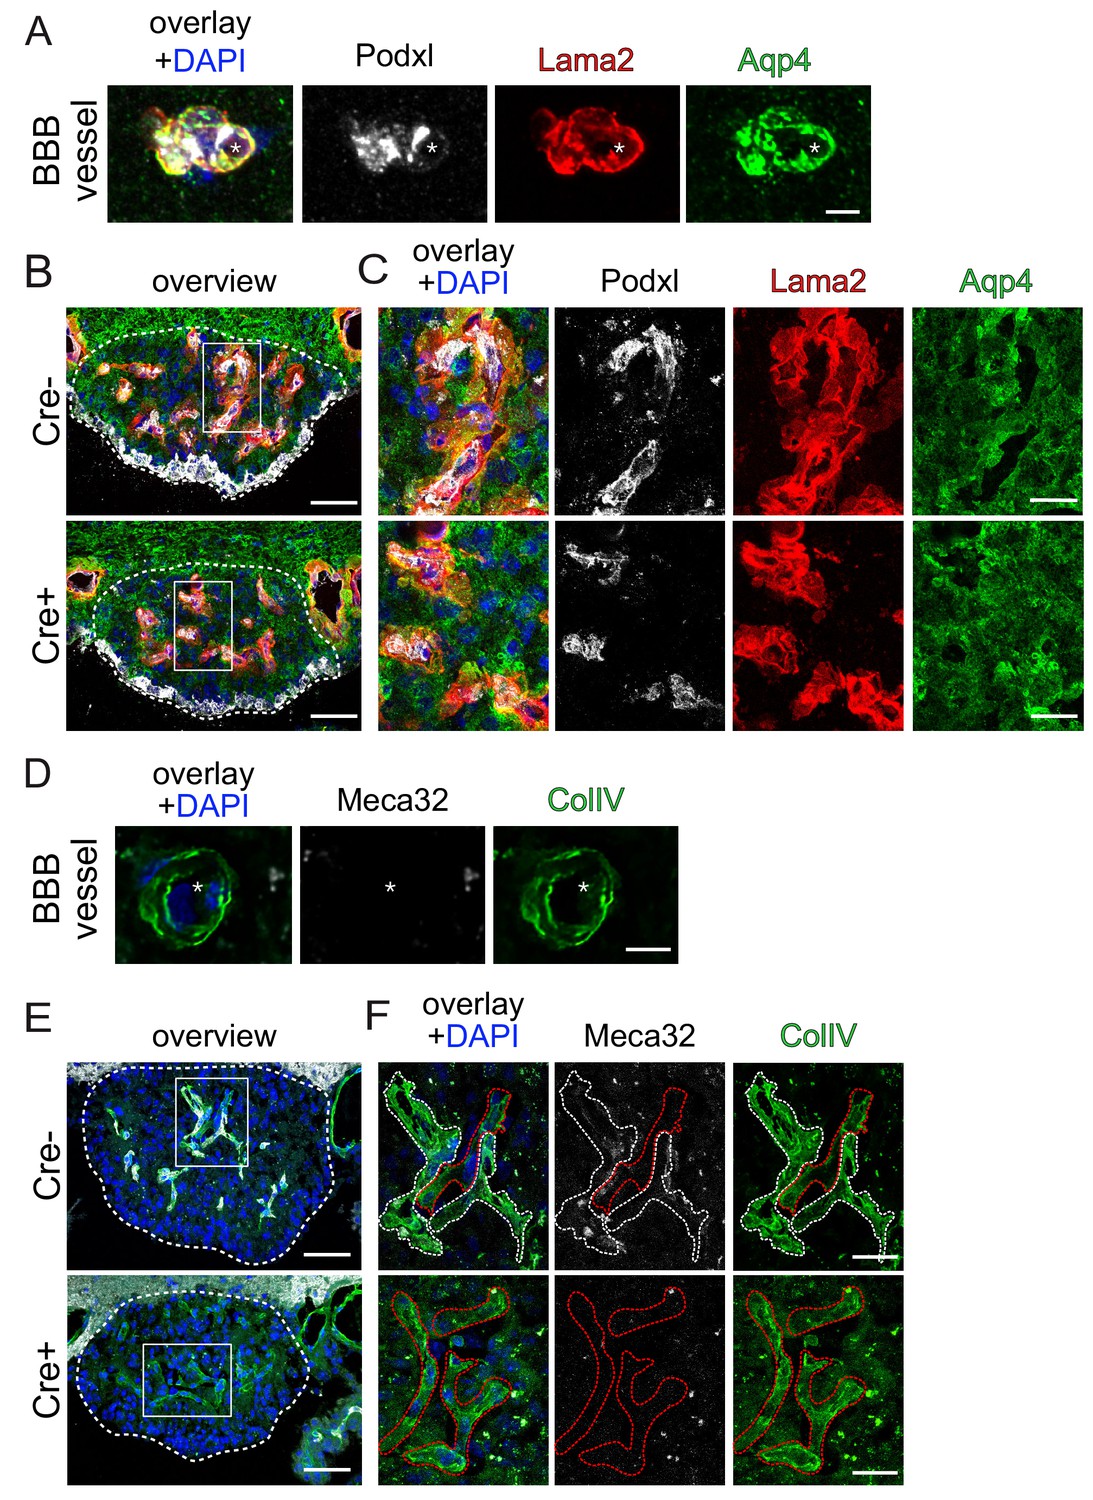
Endothelial β-catenin GOF does not affect the ECM of astrocytic endfeet and ECs within the subfornical organ (SFO).
Striatal BBB-vessel showing a polarized distribution of Lama2 and Aqp4 in AC endfeet. Lumen is stained by Podxl (asterisk) (A). Coronal overview of the subfornical organ (SFO) (B); rectangular inset demarcates area for higher magnification in (C). Striatal BBB-vessel showing a polarized distribution of ColIV (green) but no Meca32 (white) in ECs (D). Coronal overview SFO, rectangular inset demarcates area for higher magnification in F (E); white dashed lines show Meca32+, red dashed lines show Meca32 vessels (F). Dashed lines outline SFO vessels; scale bars show 2 µm (A), 50 µm (B), 10 µm (C), 2.5 µm (D), 50 µm (E), 10 µm (F).
Figure 8 with 1 supplement
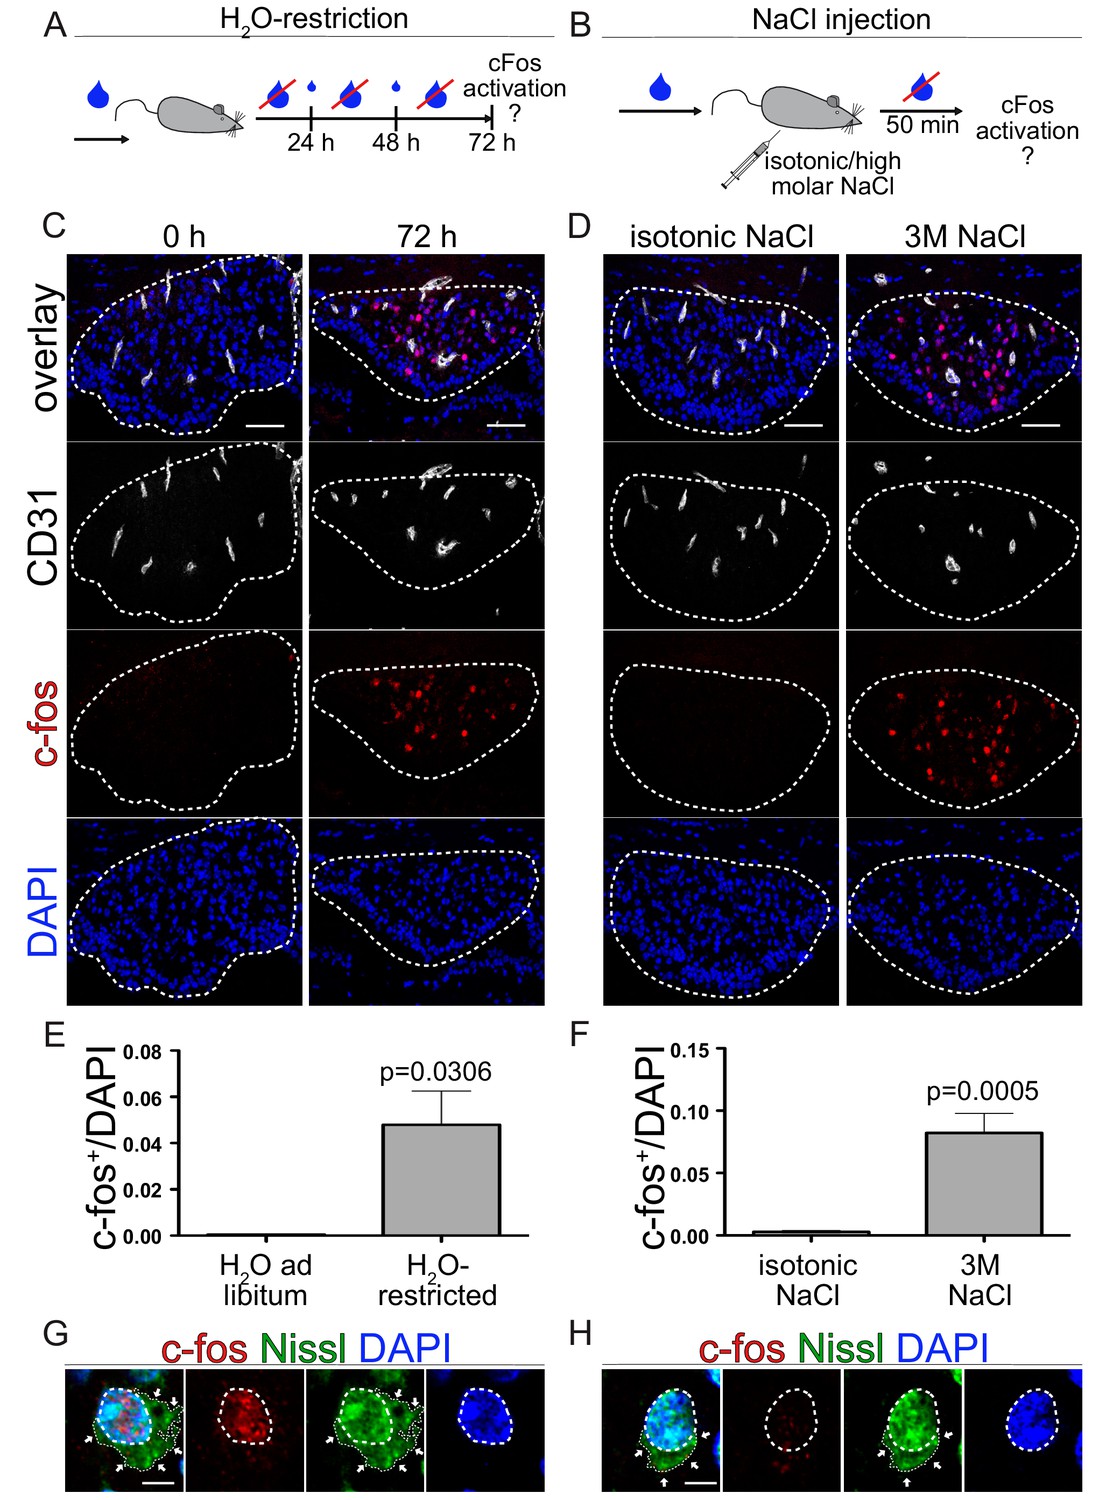
Neuronal activation via thirst induction in wild type animals.
(A) Schedule of water restriction paradigm. Small blue droplets represent a restricted amount of water in a 24 hrs cycle according to the bodyweight (BW). (C) c-fos activation in the SFO of mice with water ad libitum and animals restricted for 72 hrs. (E) quantification of c-fos positive/DAPI nuclei in the SFO (n = 3). (B) Experimental setting of hyperosmolar sodium chloride injection. Animals get either isotonic (0.15 M) or 3 M sodium chloride intraperitoneally injection (150 µl/20 g mouse). c-fos analysis 50 min after NaCl injection (D) and quantification (F) (n = 6). Dashed lines indicate Nissl flounders confirming neuronal idendity of c-fos+ (G) and c-fos- (H) cells. Scale bars: (C), (D) 50 µm, (G), (H) 2 µm; error bars show ±SEM.
-
Figure 8—source data 1
Quantification of dose dependent neuronal activity in the subfornical organ (SFO) upon hyper-osmolar sodium chloride injection.
- https://doi.org/10.7554/eLife.43818.031
Figure 8—figure supplement 1
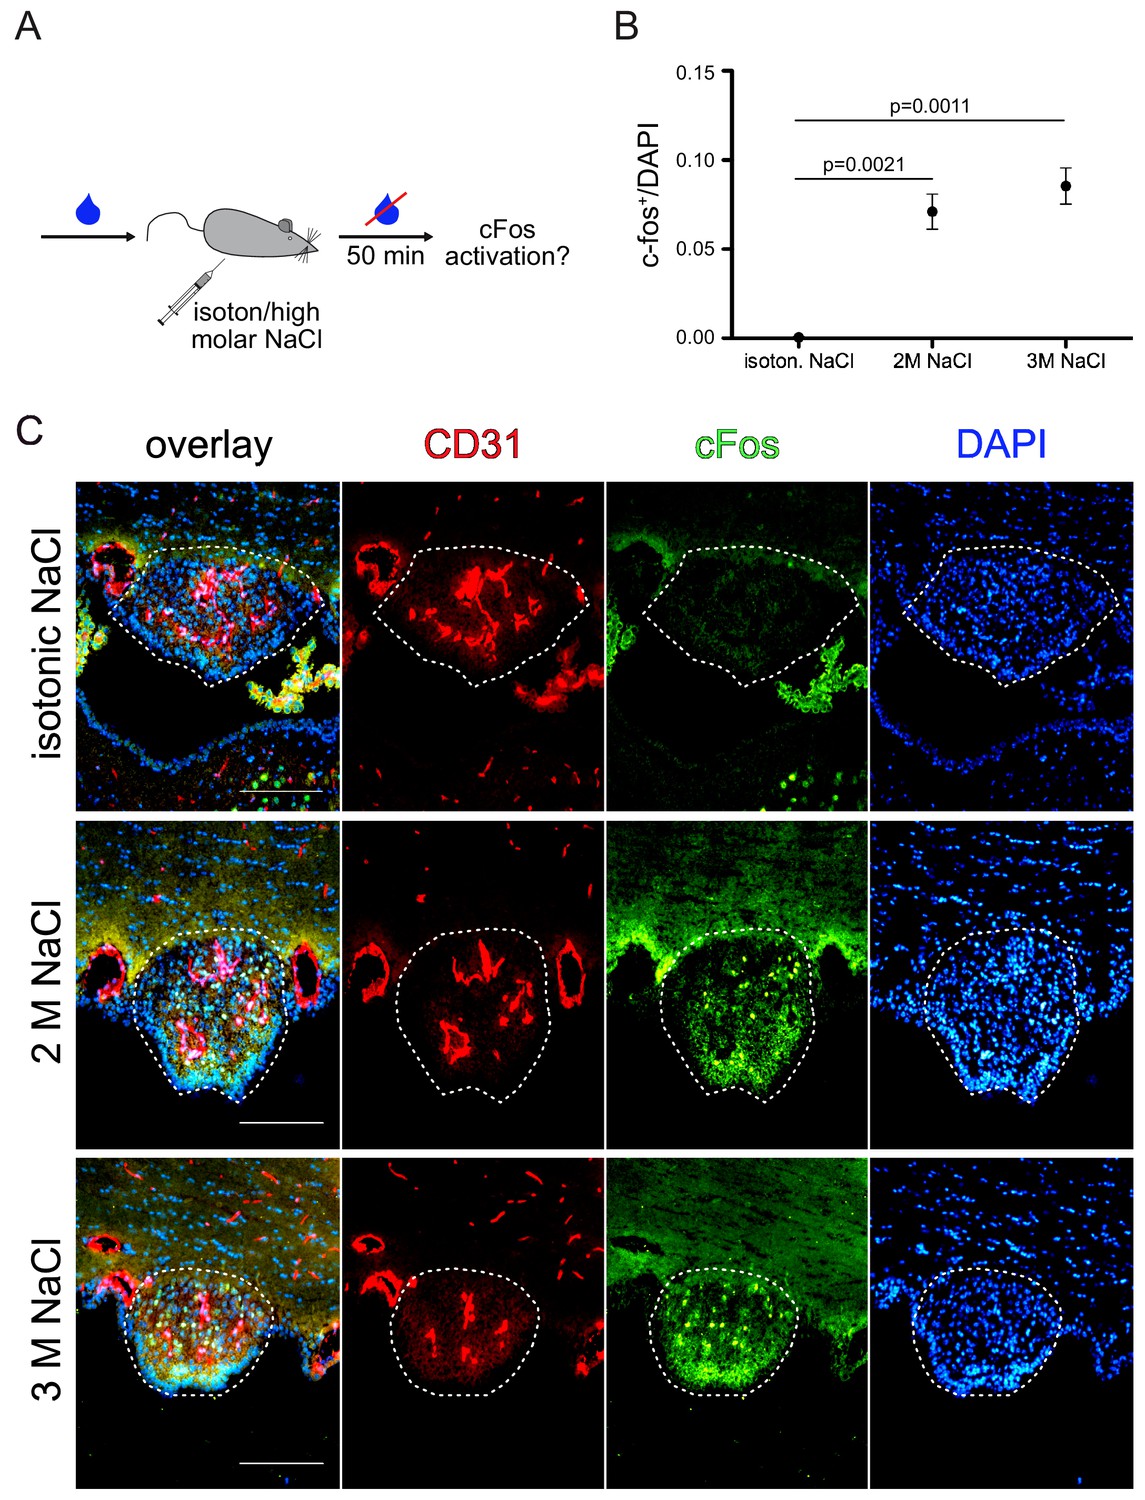
Dose dependent neuronal activity upon sodium chloride injection.
Experimental setting of hyperosmolar sodium chloride injection (A). Animals received i.p. injections (150 µl/20 g mouse) of either isotonic (0.15 M), 2 M or 3 M sodium chloride solution. After 50 min in the absence of water, the SFO was analyzed for c-fos (C) and quantified (B) (n = 3 per group). Raw data are presented in the additional source data file. Scale bars: 100 µm; error bars show ±SEM.
-
Figure 8—figure supplement 1—source data 1
Quantification of neuronal activation in the subfornical organ (SFO) via thirst induction in wild type mice.
- https://doi.org/10.7554/eLife.43818.030
Figure 9
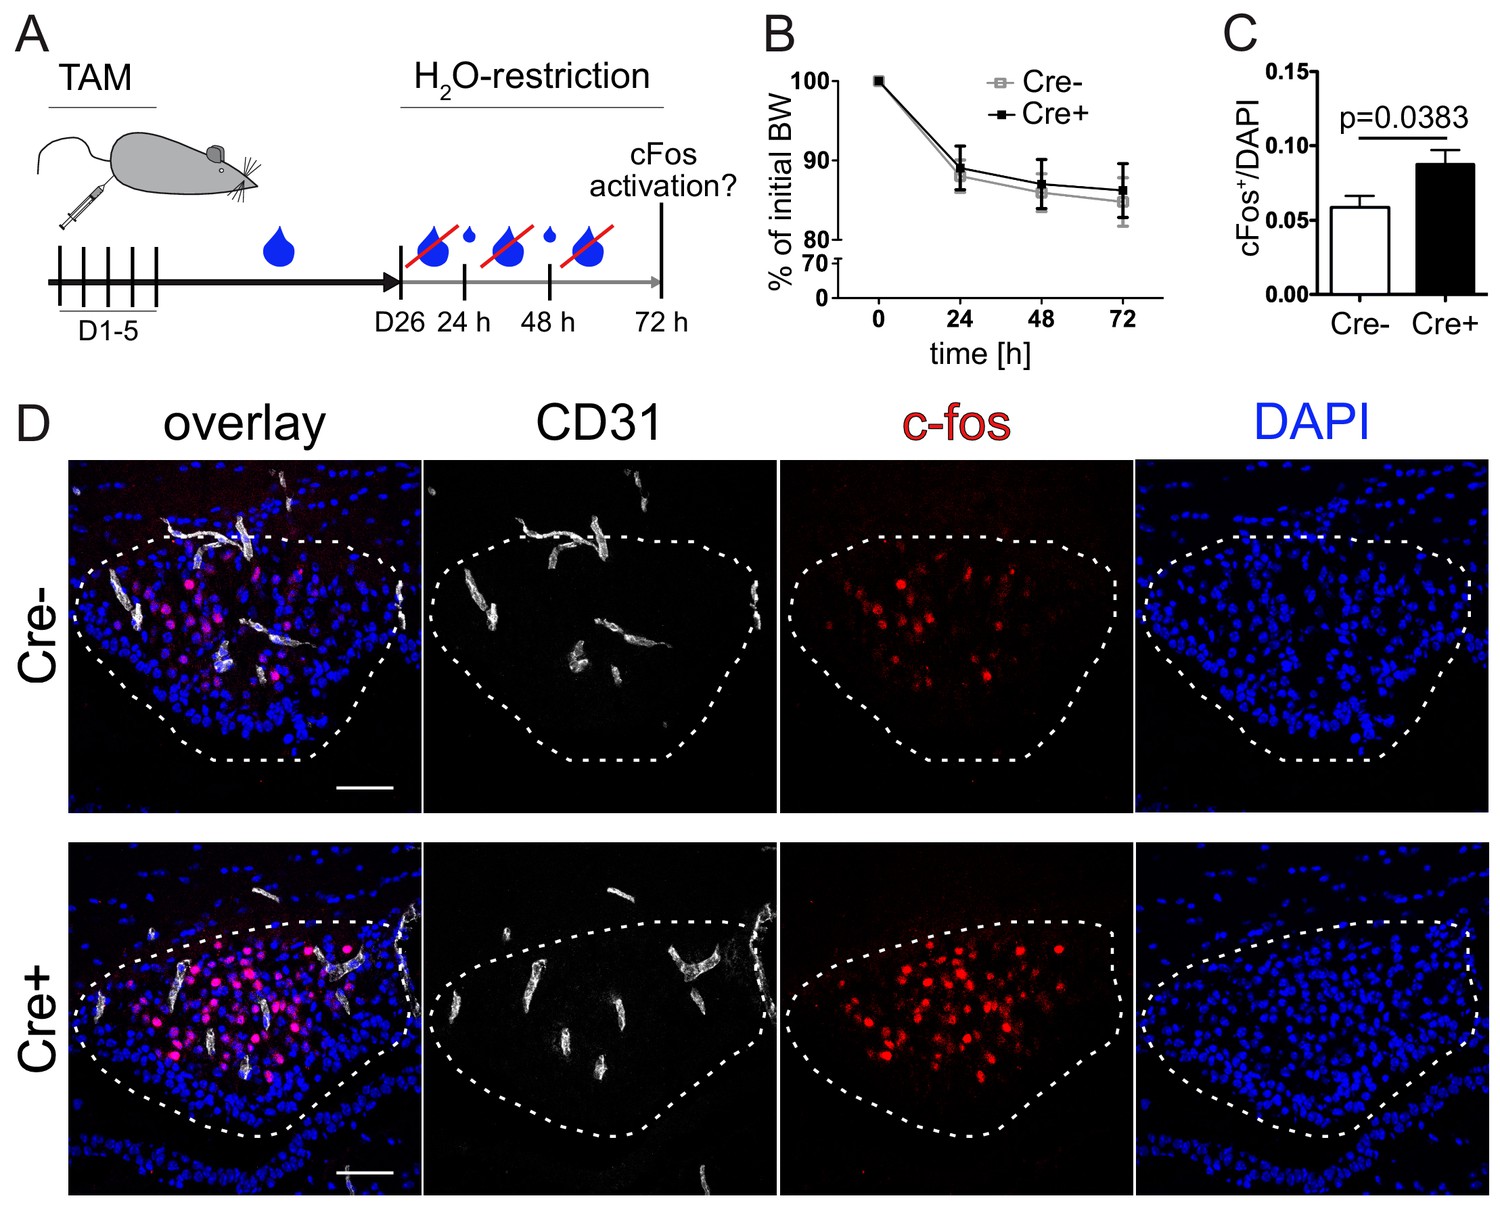
Vascular tightening effects increased neuronal activity in the subfornical organ (SFO) under thirst conditions.
(A) Experimental setup of water restriction in β-catenin GOF and control mice after tamoxifen (TAM) injection. (B) Monitoring of BW for GOF and control mice under water restriction. (D) c-fos activation (dashed lines indicate the SFO) and (C) quantification of c-fos positive/DAPI nuclei in the SFO (n(Cre-) = 9, n(Cre+) = 8). Scale bars show 50 µm; error bars show ±SEM.
-
Figure 9—source data 1
Quantification of neuronal activity in the subfornical organ (SFO) under thirst conditions in Cdh5(PAC)-CreERT2:Ctnnb1Ex3fl/wt mice.
- https://doi.org/10.7554/eLife.43818.033
Author response image 1
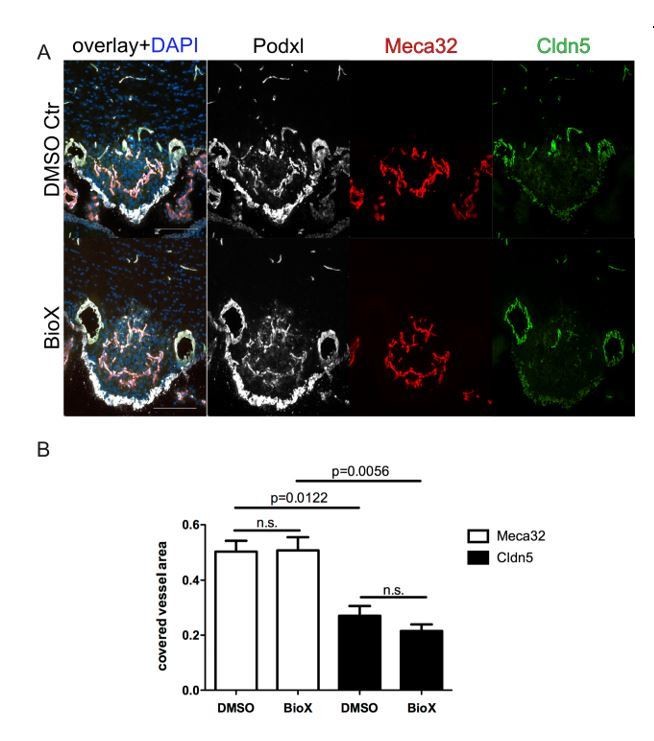
8 week-old female C57Bl6 mice were treated by i.p. injections of 1mg/kg BIO-X/DMSO every third day for 21 days.
For the final 72 hours, mice were water-deprived and subsequently sacrificed and analyzed for Meca32 as well as for Cldn5 (n=10). Representative immunofluorescent images (A). Quantification of Meca32- and Cldn5-covered vessel area within the SFO (B). Error bars show ± SEM. Scale bars represent 100 µm.
Author response image 2
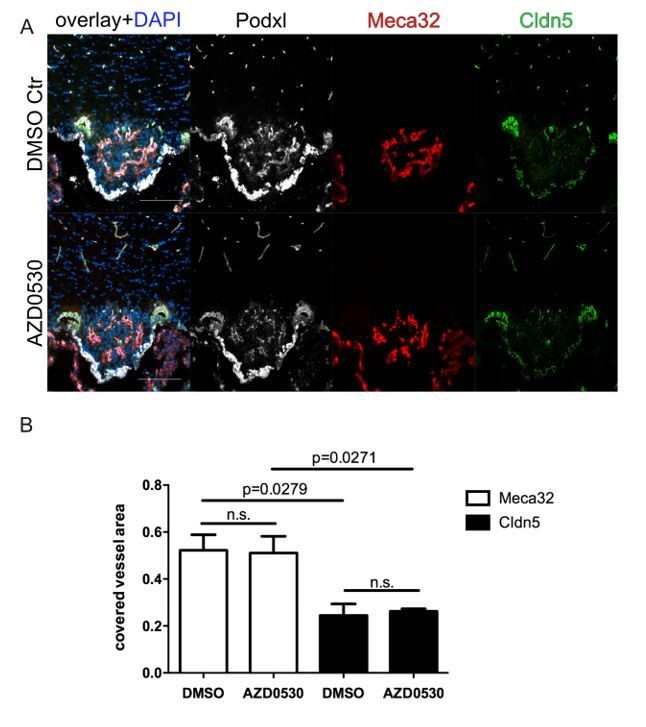
8 week-old female C57Bl6 mice were mice were daily treated with 25mg/kg AZD0530 Scr-inhibitor by oral gavage for 7 days.
For the final 72 h, mice were water-deprived and subsequently sacrificed and analyzed for Meca32 as well as for Cldn5 (n=10). Representative immunofluorescent images (A). Quantification of Meca32- and Cldn5-covered vessel area within the SFO (B). Error bars show ± SEM. Scale bars represent 100 µm.
Author response image 3
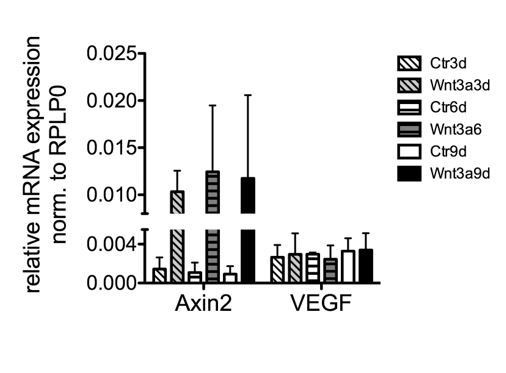
pMBMECs were isolated and cultivated as previously published (Ziegler et al., 2016; Liebner et al., 2008), and after one passage stimulated for 9 days with 150mM recombinant mouse Wnt3a (#315-20, Peprotech).
Total RNA was harvested (n=2), converted into cDNA and subjected to qRT-PCR analysis.
Author response image 4
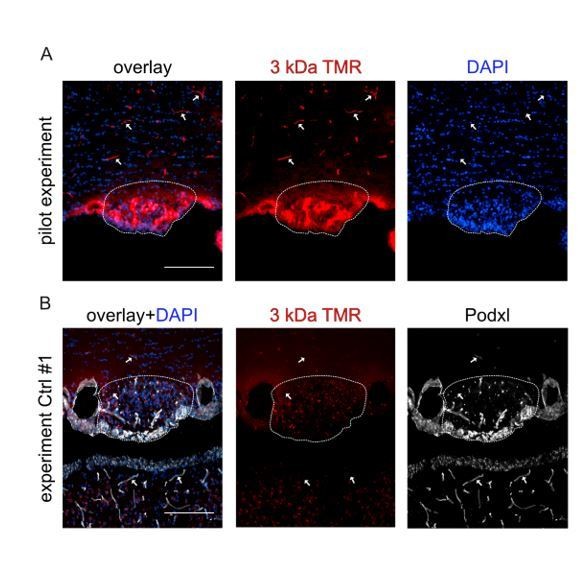
3 kDa TMR-dextran tracer was injected iv (150µl of a 2mM solution in PBS) into C56Bl6 WT mice for the pilot experiment (A), or iv into Ctrl and GOF mice in case of the real experiment (B).
In the pilot experiment vessels were nicely filled and labeled by 3 kDa TMR-dextran (arrows). In the SFO (dashed line) tracer extravasation was visible. In the experiment with Ctrl and GOF mice, the tracer was not visible in the vessel lumen, although successful iv injection was confirmed by the larger tracer (FITC-BSA, main Figure 6).
Author response image 5
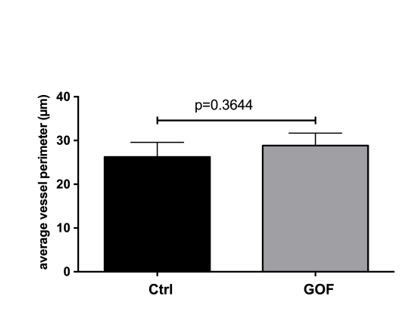
TEM images of SFO vessels taken from βcatenin control and GOF mice (26d after TAM injection) were analysed for vessels perimeter by measuring the perimeter of vessel using the polygon tool in ImageJ.
In total 14 and 10 vessels were analysed for control and GOF, respectively. n=3; unpaired student t test was applied.
Videos
Video 1
Heterogeneous barrier phenotype in vessels of the adult wild type subfornical organ (SFO).
Video of a cleared whole mount preparation of the SFO and neighboring tissue, stained for Cldn5 (red), Meca32/Plvap (green) and i.v.-injected tomato-lectin-Alexa649 (blue) as a general vessel marker. Volume rendering demarcates SFO vessels.
Tables
Key resources table
| Reagent type (species) or resource | Designation | Source or reference | Identifiers | Additional information |
|---|---|---|---|---|
| Strain, strainbackground (Mus musculus) | Wild-type mice | ENVIGO, The Netherlands | C57BL/6J | |
| Strain, strainbackground (Mus musculus) | Cdh5-cre mice | Ralf H. Adams, Max-Planck-Institute for Molecular Biomedicine, Münster, Germany | Cdh5(PAC)-CreERT2 | |
| Strain, strainbackground (Mus musculus) | Pdgfb-cre mice | Marcus Fruttiger (University College London, London, UK | PDGFB-iCreERT2 | |
| Strain, strainbackground (Mus musculus) | β-Catenin exon3-floxed mice | M. Mark Taketo, Kyoto University, Japan | Ctnnb1Ex3fl/fl | |
| Strain, strainbackground (Mus musculus) | Wnt/β-catenin reporter mice | Stefano Piccolo (University of Padua, Padova,Italy) | B6.Cg-Tg(BAT-lacZ)3Picc/J | |
| Strain, strainbackground (Mus musculus) | Cre-reporter mice | Liqun Luo, Stanford University | STOCK Gt(ROSA)26Sortm4(ACTB-tdTomato,-EGFP)Luo/J | |
| Strain, strainbackground (Danio rerio) | Vessel reporter fish | D.Y.R. Stainier, Max-Planck-Institute for Heart and Lung Research, Bad Nauheim, Germany | Tg(kdrl:Hsa.HRAS-mCherry)s896 | |
| Strain, strainbackground (Danio rerio) | Wnt/β-catenin reporter fish | Francesco Argenton (University of Padua, Padova,Italy) | Tg(7xTCF-Xla.Siam:GFP)ia4 | |
| Antibody | Anti-aquaporin 4 (Aqp4; rabbit, polyclonal) | EMD Millipore | AB 2218, RRID: AB_11210366 | 1:200 PFA fixation |
| Antibody | Anti-β-galactosidase (βGal; rabbit, polyclonal) | MP Biomedicals | #55978 | 1:1000 PFA |
| Antibody | Anti-PECAM/CD31 (rat, monoclonal) | BD Pharmingen | #553370, RRID: AB_394816 | 1:100 PFA |
| Antibody | Anti-Cdh5/VE-Cadherin (goat, polyclonal) | Santa-Cruz Biotechnology | sc-6458, RRID: AB_2077955 | 1:50 PFA/ MetOH |
| Antibody | c-fos (H-125) (rabbit, polyclonal) | Santa-Cruz Biotechnology | sc-7202, RRID: AB_2106765 | 1:1000 PFA |
| Antibody | Anti-claudin-5/Cldn5 (rabbit, polyclonal) | Thermo Fisher Scientific | #341600 | 1:200 PFA/ MetOH |
| Antibody | Anti-Collagen IV (rabbit, polyclonal) | BioRad | #2150–1470, RRID: AB_2082660 | 1:300 PFA |
| Antibody | Anti-α-dystroglycan/α-Dag (mouse, monoclonal) | Novus-Biologicals | NBP1-49634, RRID: AB_11015510 | 1:50 PFA* |
| Antibody | Anti-Kir4.1 (rabbit, polyclonal) | Alomone labs | APC-035, RRID: AB_2040120 | 1:200 PFA* |
| Antibody | Anti-Laminin α 2/Lama2 (rat, monoclonal) | Abcam | ab11576, RRID: AB_298180 | 1:200 MetOH |
| Antibody | Anti-occludin (mouse, monoclonal) | Thermo Fisher (Invitrogen) | #33–1500, RRID: AB_2533101 | 1:100 PFA* |
| Antibody | Anti-Plvap/Meca32 (rat, monoclonal) | BD Pharmingen | #553849, RRID: AB_395086 | 1:100 PFA/ MetOH |
| Antibody | Anti-podocalyxin/Podxl (goat, polyclonal) | R and D Systems | AF1556, RRID: AB_354858 | 1:100 PFA/ MetOH |
| Antibody | Anti-Sox17 (goat, polyclonal) | R and D Systems | AF1924, RRID: AB_355060 | 1:100 PFA |
| Antibody | Anti-ZO-1 (rabbit, polyclonal) | Thermo Fisher (Invitrogen) | #40–2300, RRID: AB_2533457 | 1:100 MetOH |
| Antibody | Anti-goat IgG DyLight 550-conjugated (donkey, polyclonal) | Thermo Fisher Scientific | SA5-10087, RRID: AB_2556667 | 1:500 PFA/ MetOH |
| Antibody | Anti-goat IgG DyLight 650- conjugated (donkey, polyclonal) | Thermo Fisher Scientific | SA5-10089, RRID: AB_2556669 | 1:500 PFA/ MetOH |
| Antibody | Anti-rabbit IgG DyLight 488-conjugated (donkey, polyclonal) | Thermo Fisher Scientific | SA5-10038, RRID: AB_2556618 | 1:500 PFA/ MetOH |
| Antibody | Anti-rabbit IgG DyLight 550-conjugated (donkey, polyclonal) | Thermo Fisher Scientific | SA5-10039, RRID: AB_2556619 | 1:500 PFA/ MetOH |
| Antibody | Anti-rat IgG DyLight 550-conjugated (donkey, polyclonal) | Thermo Fisher Scientific | SA5-10027, RRID: AB_2556607 | 1:500 PFA/ MetOH |
| Other | DAPI | Molecular Biological Technology (Mo Bi Tec) | D-1306 | 300 µM (1:800) |
| Other | NeuroTraceTMGreen Fluorescent Nissl Stain | Thermo Fisher Scientific | N21480 | 1:300 PFA |
| Other | Tissue-Tek O.C.T. | Sakura Finetek Europe | 4583 | |
| Other | qPCR SYBR Green Fluorescein Mix | Thermo Fisher Scientific | AB-1219 | |
| Chemicalcompound | Tricaine methanesulfonate (MS-222) | Sigma-Aldrich | E10521 | |
| Chemical compound | TAM | Sigma-Aldrich | T5648 | |
| Chemicalcompound | FITC-albumin | Sigma-Aldrich | #A9771 | |
| Chemicalcompound | tomato lectin Alexa 649 | Vector laboratories | (#DL-1178 | |
| Chemicalcompound | ethylcinnamate (ECi),) | Sigma-Aldrich | (#112372 | |
| Chemicalcompound | AR6 Buffer | Perkin Elmer | (#AR600250ML | |
| Commercial kit | RNeasy plus Micro kit | Qiagen | #74034 | |
| Commercial kit | RevertAidTM H minus first strand cDNA synthesis kit | Thermo Fisher Scientific | #K1632 | |
| Commercial kit | RNeasy Mini kit | Quiagen | #74104 |
Table 1
Documentation of water provided to mice according to their body weight in the water restriction paradigm
https://doi.org/10.7554/eLife.43818.034| Bodyweight (BW) | Offered water [ml] |
|---|---|
| BW > 84% | 1.1 |
| 84% > BW > 83% | 1.2 |
| 83% > BW > 82% | 1.3 |
| 82% > BW > 81% | 1.4 |
| 81% > BW | 1.5 |
Table 2
List of primers used for real time PCR.
https://doi.org/10.7554/eLife.43818.035| Primer for | Sequence 5'−3’ sense | Sequence 5’−3’ antisense |
|---|---|---|
| qmm_Cldn5 | TGTCGTGCGTGGTGCAGAGT | TGCTACCCGTGCCTTAACTGG |
| qmm_Meca32 | CTTCATCGCCGCTATCATCCT | CCTTGGAGCACACTGCCTTCT |
| qmm_Rplp0 | GTGTTTGACAACGGCAGCATT | TCTCCACAGACAATGCCAGGA |
| qmm_Ocln | GTGAATGGCAAGCGATCATACC | TGCCTGAAGTCATCCACACTCA |
Additional files
-
Transparent reporting form
- https://doi.org/10.7554/eLife.43818.036
Download links
A two-part list of links to download the article, or parts of the article, in various formats.
Downloads (link to download the article as PDF)
Open citations (links to open the citations from this article in various online reference manager services)
Cite this article (links to download the citations from this article in formats compatible with various reference manager tools)
Low wnt/β-catenin signaling determines leaky vessels in the subfornical organ and affects water homeostasis in mice
eLife 8:e43818.
https://doi.org/10.7554/eLife.43818


