Anillin facilitates septin assembly to prevent pathological outfoldings of central nervous system myelin
- Max Planck Institute of Experimental Medicine, Germany
- Center for Nanoscale Microscopy and Molecular Physiology of the Brain, Germany
- Martin-Luther-University Halle-Wittenberg, Germany
Figures
Figure 1 with 1 supplement

Co-distribution of anillin with myelin septins.
(A) Immunoblotting of myelin purified from the brains of wild type mice at P75 compared to brain lysates indicates that anillin (ANLN) is enriched in myelin similar to septin 8 variant 1 (SEPT8_v1). The same amount of protein was loaded. The myelin marker MOG and the axonal marker TUJ1 served as controls. Blot shows n = 2 mice per genotype representative of n = 3 mice per genotype. (B–C) Immunofluorescent signal of ANLN (green in B) and SEPT7 (green in C) extends longitudinally along axons identified by neurofilament-labelling (red in B–C). Additional ANLN-immunopositive puncta (asterisks in B) were not evidently associated with filamentous structures (arrowheads in B,C). The panels show maximal projections of confocal stacks and 3-dimensional reconstructions of longitudinally sectioned spinal cord of P75 WT mice. Images representative of three mice. (D) Immunoblotting of myelin purified from the brains of wild-type mice at P15, P18, P21 and P24 indicates that the abundance of ANLN in myelin increases with maturation. Myelin septins (SEPT2, SEPT4, SEPT7, SEPT8) and MAG served as control. Blot shows n = 1 mouse per timepoint. (E) Immunolabelling of longitudinally sectioned WT optic nerves detects ANLN (red) in proximity to SEPT8 (green); co-labeled structures (arrowheads) were seen occasionally at P21 and frequently at P28 but not at P15. TUJ1 served as axonal marker. Images representative of three experiments.
Figure 1—figure supplement 1
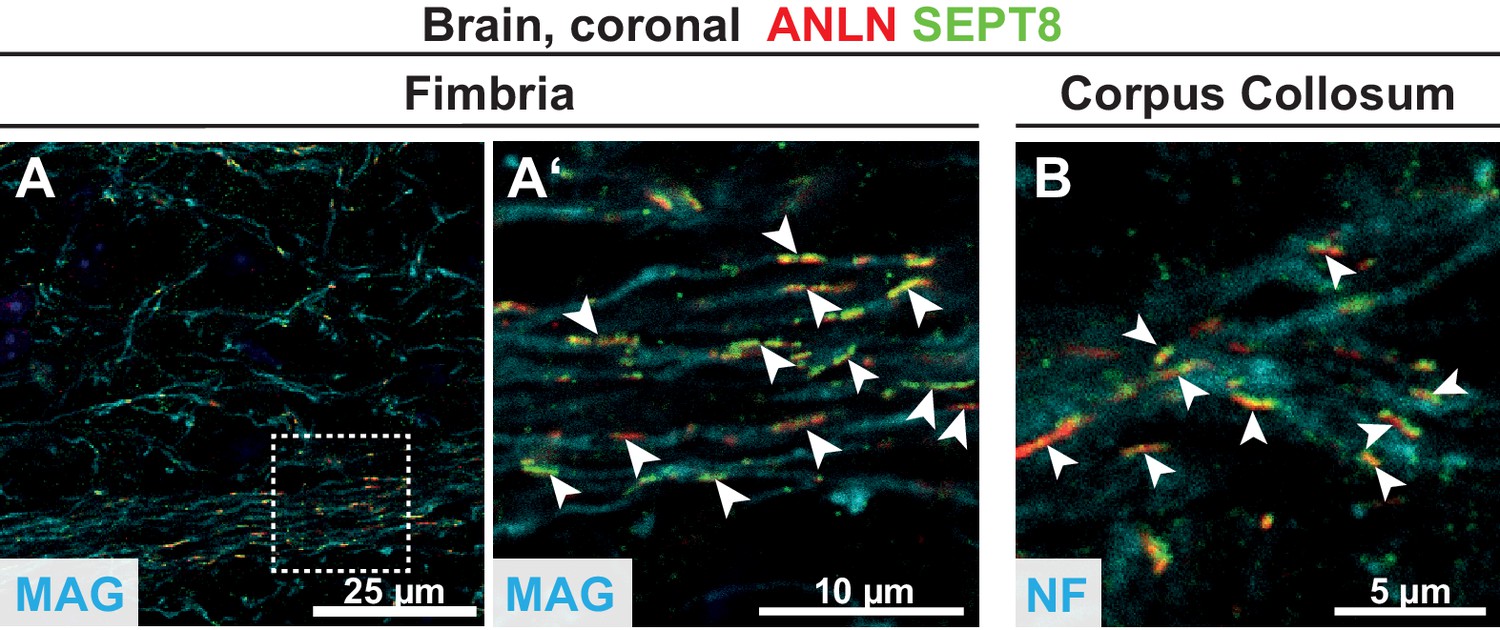
Co-labeling of ANLN and SEPT8 in various white matter tracts.
(A–B) Immunolabelling of coronal brain sections of WT mice at P75 detects ANLN (red) and SEPT8 (green) filaments (arrowheads) in the indicated white matter tracts. (A–A’) shows labelling in the fimbria. (A’), enlargement of the dashed square in (A). (B) shows labelling in the corpus callosum. MAG or neurofilaments (NF) were co-labelled as control. Images representative of three experiments.
Figure 2 with 3 supplements
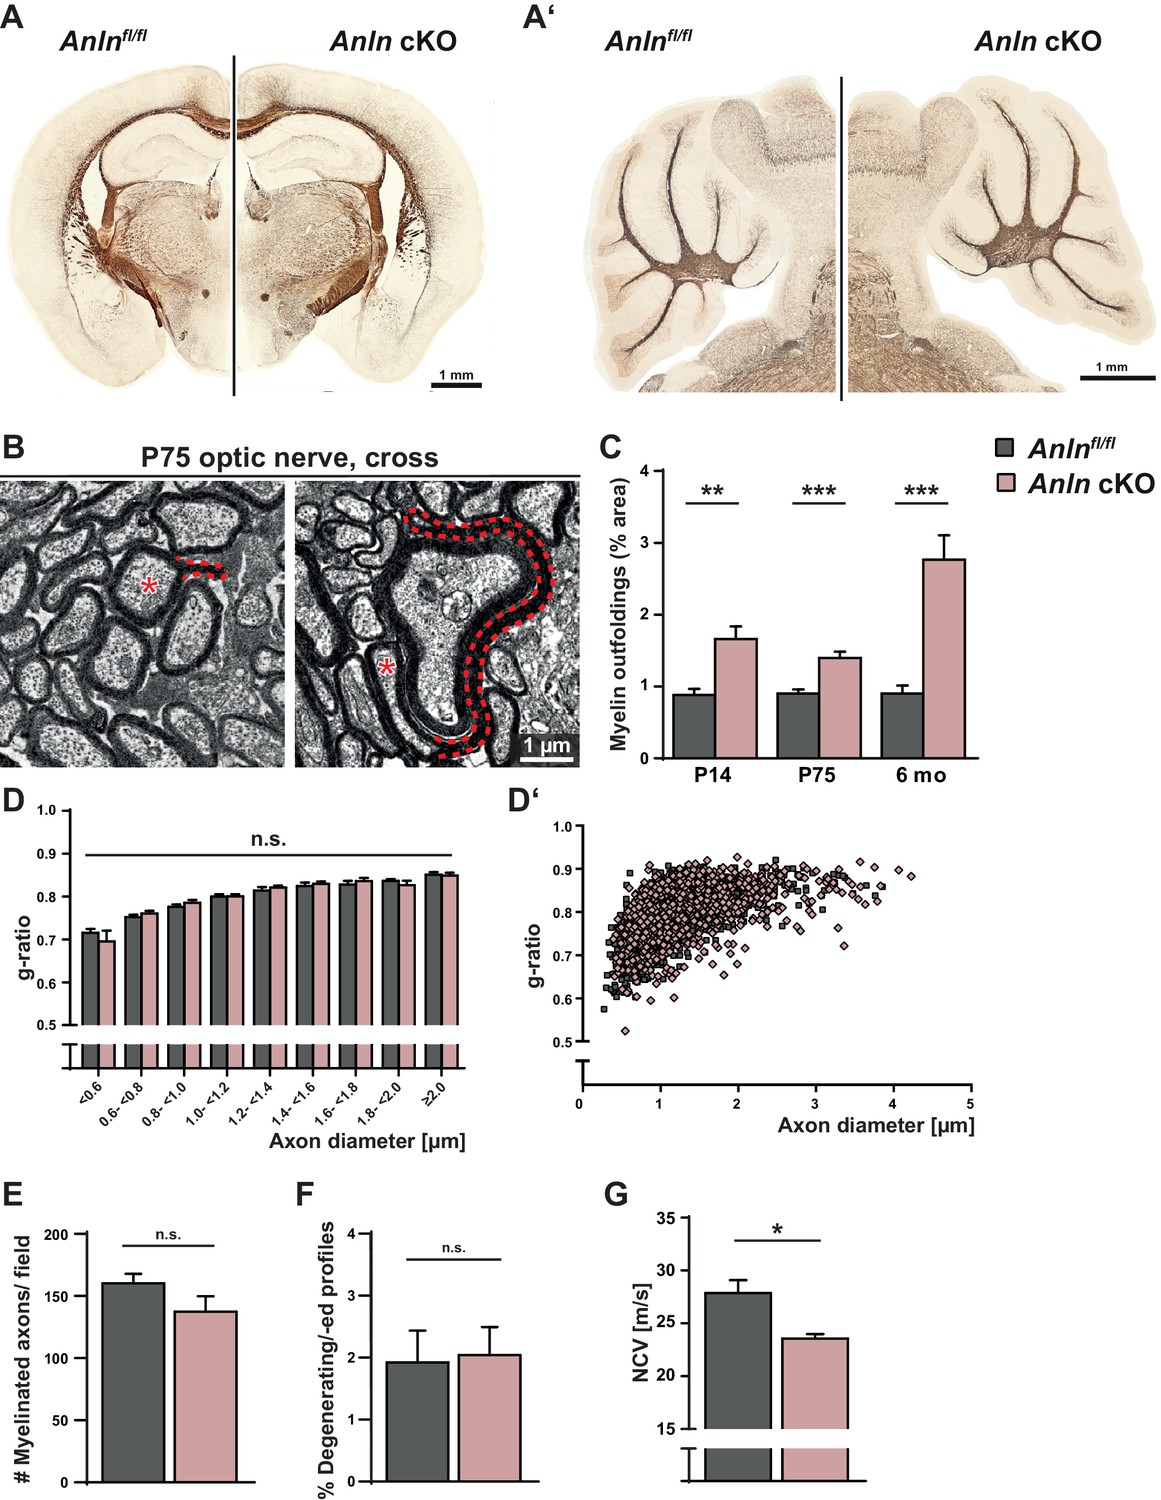
Myelin outfoldings and reduced nerve conduction velocity in mice lacking oligodendroglial expression of ANLN.
(A–A’) Silver impregnation (in brown) visualizes myelinated fiber tracts in mice lacking ANLN from myelinating cells (Anlnfl/fl;CnpCre/WT-mice; Anln cKO) and in control mice (Anlnfl/fl) at P75. (A) displays coronal brain sections; A’) shows sagittal sections through the cerebellum. Images representative of three mice per genotype. For generation and validation of Anln cKO mice see Figure 2—figure supplement 1. (B) Electron micrographs of optic nerves exemplify myelin outfoldings at P75. Stippled lines highlight myelin outfoldings; associated axons are marked with asterisks. (C) Quantitative evaluation of electron micrographs of optic nerves reveals progressive emergence of myelin outfoldings in adult Anlnfl/fl;CnpCre/WT mice (Anln cKO). Mean +/SEM. n = 4–6 mice per genotype and age; two-tailed unpaired t-test P14 p=0.0076; P75 p=0.0009; 6mo p=0.0007. (D,D‘) g-ratio analysis of electron micrographs of optic nerves at six mo indicates normal myelin sheath thickness in Anln cKO mice. Mean +/SEM. Not significant according to two-way ANOVA (p=0.9279). (E) Quantitative evaluation of electron micrographs of optic nerves at six mo reveals a normal frequency of myelinated axons in Anln cKO mice. Mean +/SEM. n = 4–5 mice per genotype; not significant (n.s.) according to two-tailed unpaired t-test (p=0.1827). (F) Quantitative evaluation of electron micrographs of optic nerves at six mo indicates that there is no increased frequency of degenerating/degenerated axons in Anln cKO mice. Mean +/SEM. n = 4–5 mice per genotype; not significant (n.s.) according to two-tailed unpaired t-test (p=0.8664). For immunohistochemical assessment of neuropathology see Figure 2—figure supplement 2. (G) Electrophysiological measurement reveals reduced nerve conduction velocity in the spinal cord of Anln cKO compared to control (Anlnfl/fl) mice at six mo. Mean +/SEM. n = 7–11 mice per genotype; two-tailed unpaired t-test (p=0.0149). For assessment of density and dimensions of the nodes of Ranvier see Figure 2—figure supplement 3.
Figure 2—figure supplement 1
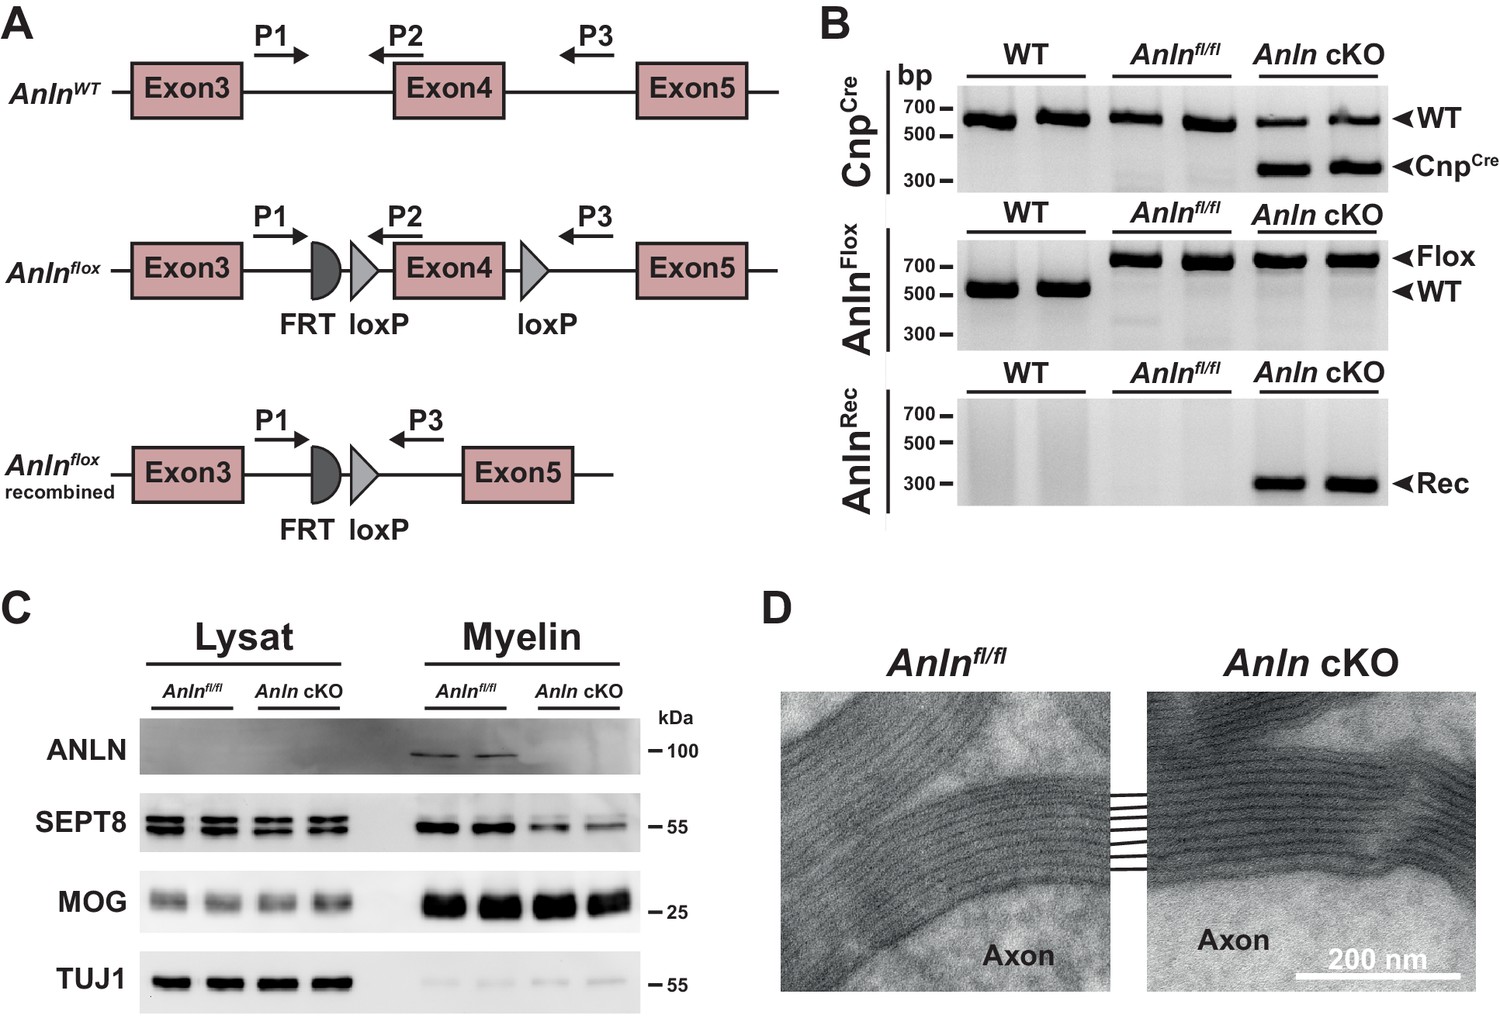
Generation of mice lacking expression of ANLN from myelinating oligodendrocytes (Anln cKO mice).
(A) Scheme of the wild type (WT) Anln gene and the engineered Anln allele before and after recombination. Exon 4 of the Anlnflox-allele is flanked by loxP-sites (floxed) for Cre-mediated recombination. Positions of PCR primers (P1, P2, P3) are indicated. (B) Genotyping PCR of DNA isolated from mouse tail tips identifies the indicated alleles. Gel shows n = 2 mice per genotype. (C) Immunoblot analysis of brain lysates and myelin purified from P75 control (Anlnfl/fl) and Anlnfl/fl;CnpCre/WT (Anln cKO) mice. Note that ANLN is only detectable in myelin purified from the brains of control mice. Note that the abundance of SEPT8 is reduced in myelin purified from Anln cKO compared to control mice. MOG and TUJ1 were detected as controls. Blot shows n = 2 mice per genotype. (D) Electron micrographs of optic nerves at eight mo indicates unaltered myelin periodicity and compaction in Anln cKO mice. Representative of three mice per genotype.
Figure 2—figure supplement 2
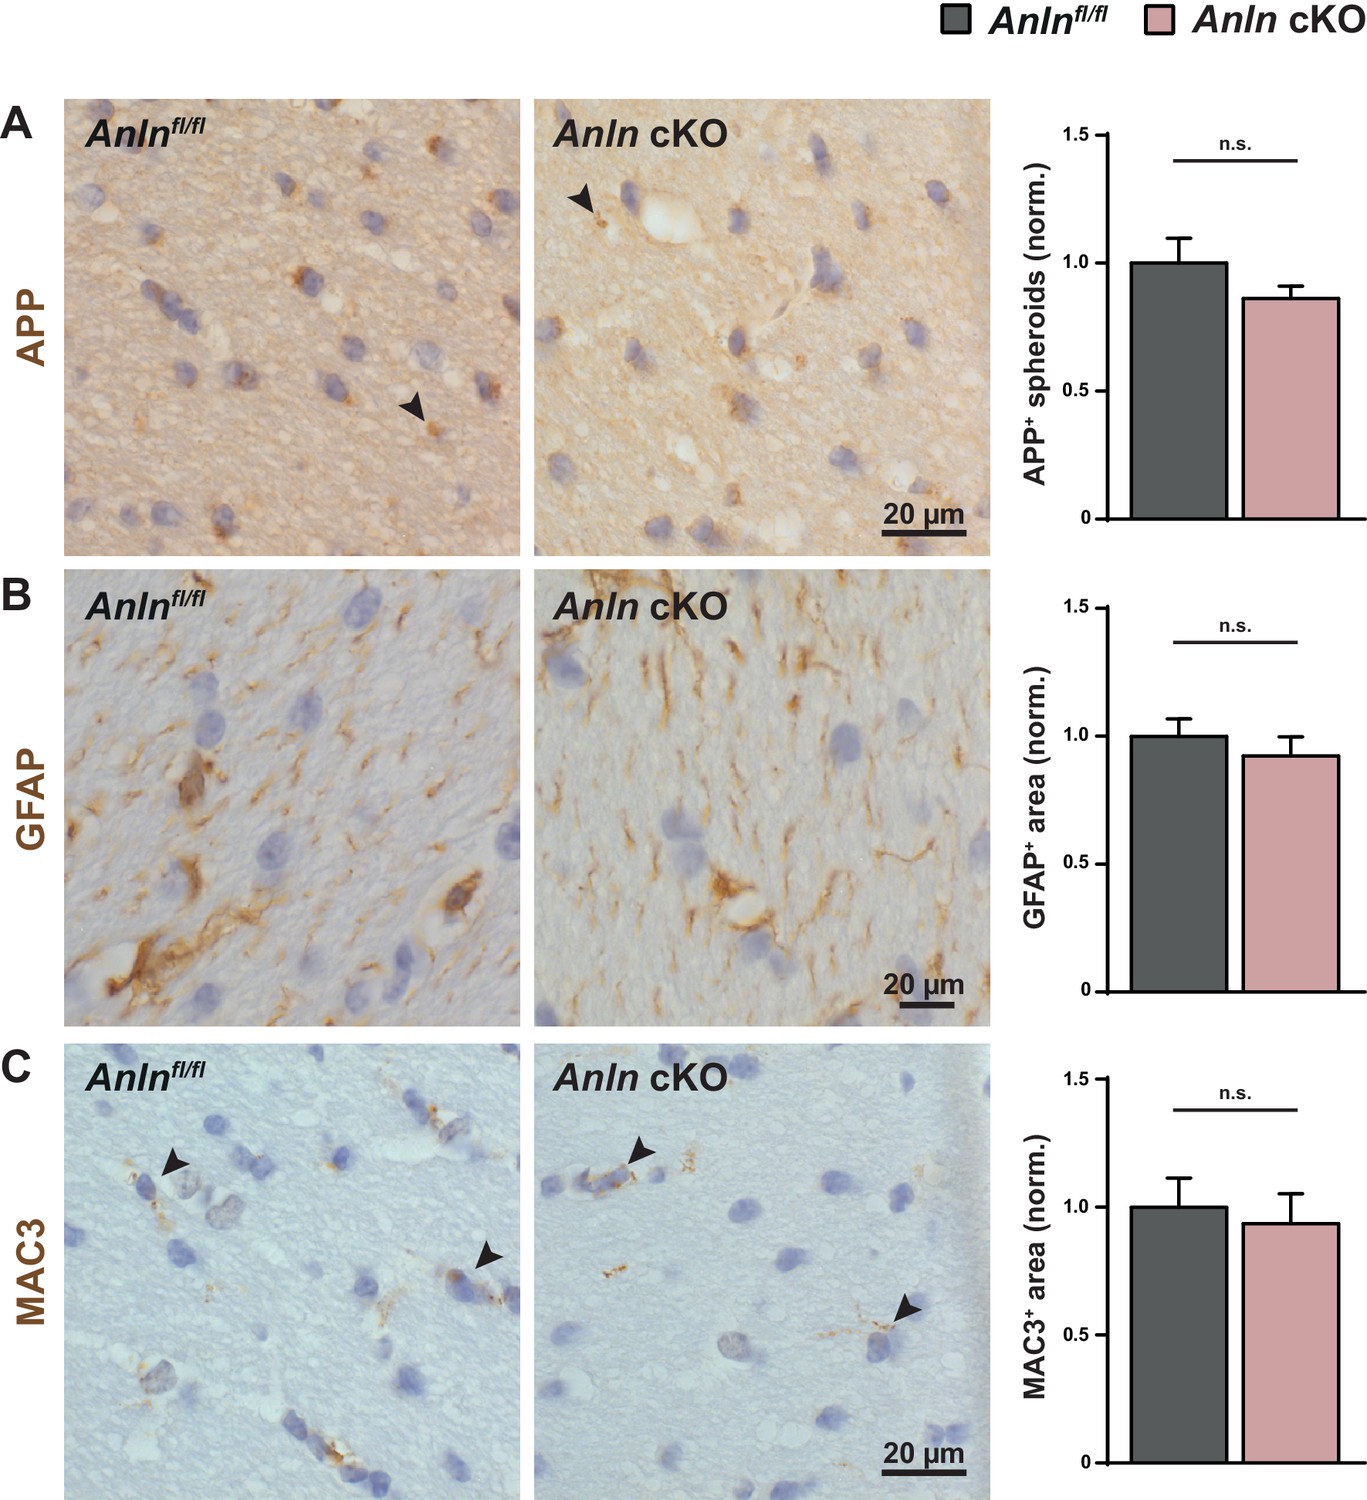
ANLN deficiency in oligodendrocytes does not cause axonopathy, astrogliosis or microgliosis.
(A–C) Immunohistochemical analysis of APP-immunopositive axonal spheroids (arrowheads in A), GFAP-immunopositive astrocytes (B) and MAC3-immunopositive microglia (arrowheads in C) in the white matter (hippocampal fimbria) of control (Anlnfl/fl) and Anlnfl/fl;CnpCre/WT mice (Anln cKO) at P75 and genotype-dependent quantification. (A) Frequency of occurrence of APP immunopositive spheroids not significant (n.s.) according to unpaired two-tailed t-test; n = 5 mice per genotype; p=0.2418. (B) Relative area of GFAP-immunopositivity not significant (n.s.) according to unpaired two-tailed t-test; n = 5 mice per genotype; p=0.4704. (C) Relative area of MAC3-immunopositivity not significant (n.s.) according to unpaired two-tailed t-test; n = 5 mice per genotype; p=0.7047.
Figure 2—figure supplement 3
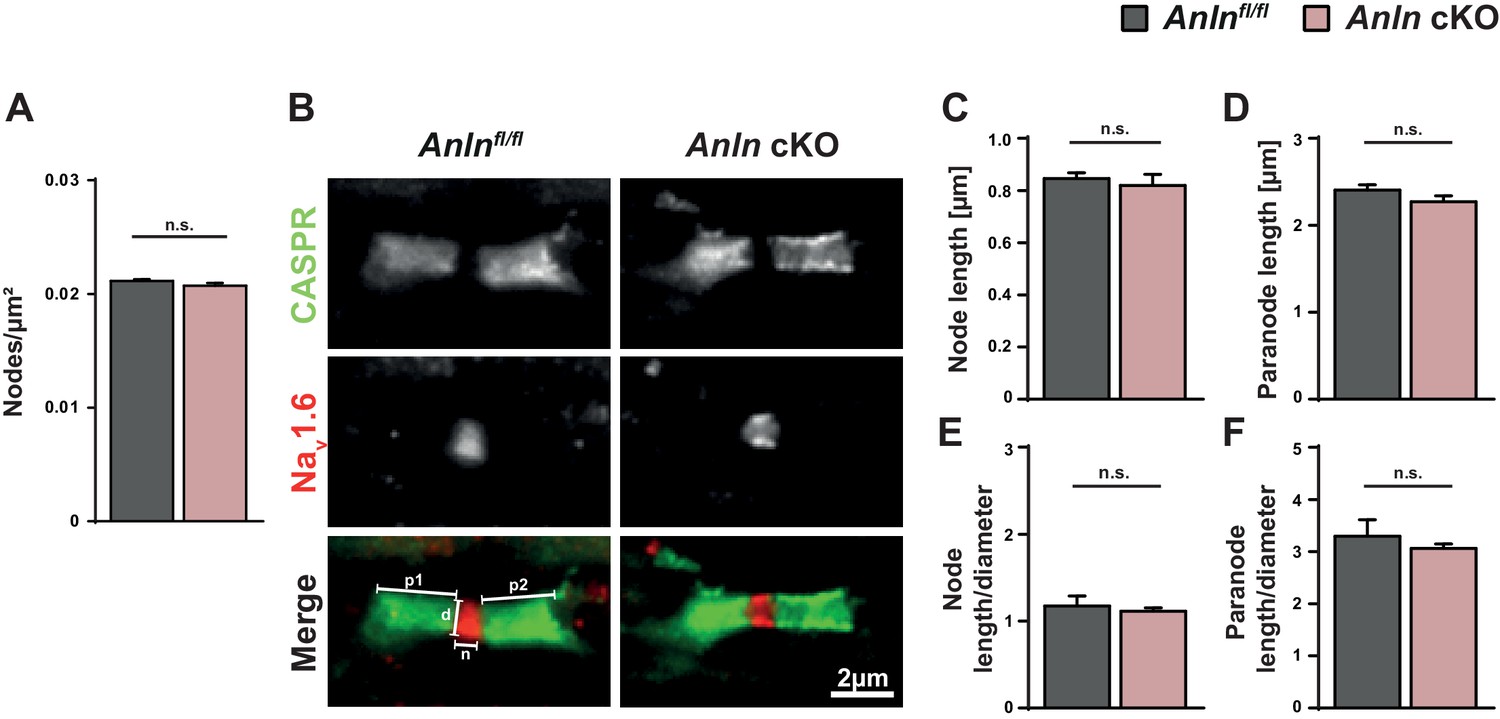
ANLN deficiency in oligodendrocytes does not cause alterations of density or structure of nodes of Ranvier.
(A) Genotype-dependent quantification of the density of nodes of Ranvier on longitudinal spinal cord sections of control (Anlnfl/fl) and Anln cKO mice at P75 based on immunohistochemical analysis detecting the sodium channel Nav1.6 as a marker. not significant (n.s.) according to unpaired two-tailed t-test; n = 4 mice per genotype; p=0.1985. (B–F) Immunohistochemical detection of the nodal marker Nav1.6 (red) and the paranodal marker CASPR (green) on longitudinal spinal cord sections of control (Anlnfl/fl) and Anln cKO mice at P75. Parameters measured for quantifications displayed in (C–F) are indicated in the merge of the control (in B). p1/p2 = paranode length; d = axonal diameter at node; n = node length. (C) Genotype-dependent quantification of node length. Not significant (n.s.) according to unpaired two-tailed t-test; n = 4–5 mice per genotype; p=0.6324. (D) Genotype-dependent quantification of paranode length. Not significant (n.s.) according to unpaired two-tailed t-test; n = 4–5 mice per genotype; p=0.1927. (E) Ratio of node length and axonal diameter. Not significant (n.s.) according to unpaired two-tailed t-test; n = 4–5 mice per genotype; p=0.5966. (F) Ratio of paranode length and axonal diameter. Not significant (n.s.) according to unpaired two-tailed t-test; n = 4–5 mice per genotype; p=0.4603.
Figure 3 with 1 supplement
Myelin composition in mice lacking oligodendroglial expression of ANLN.
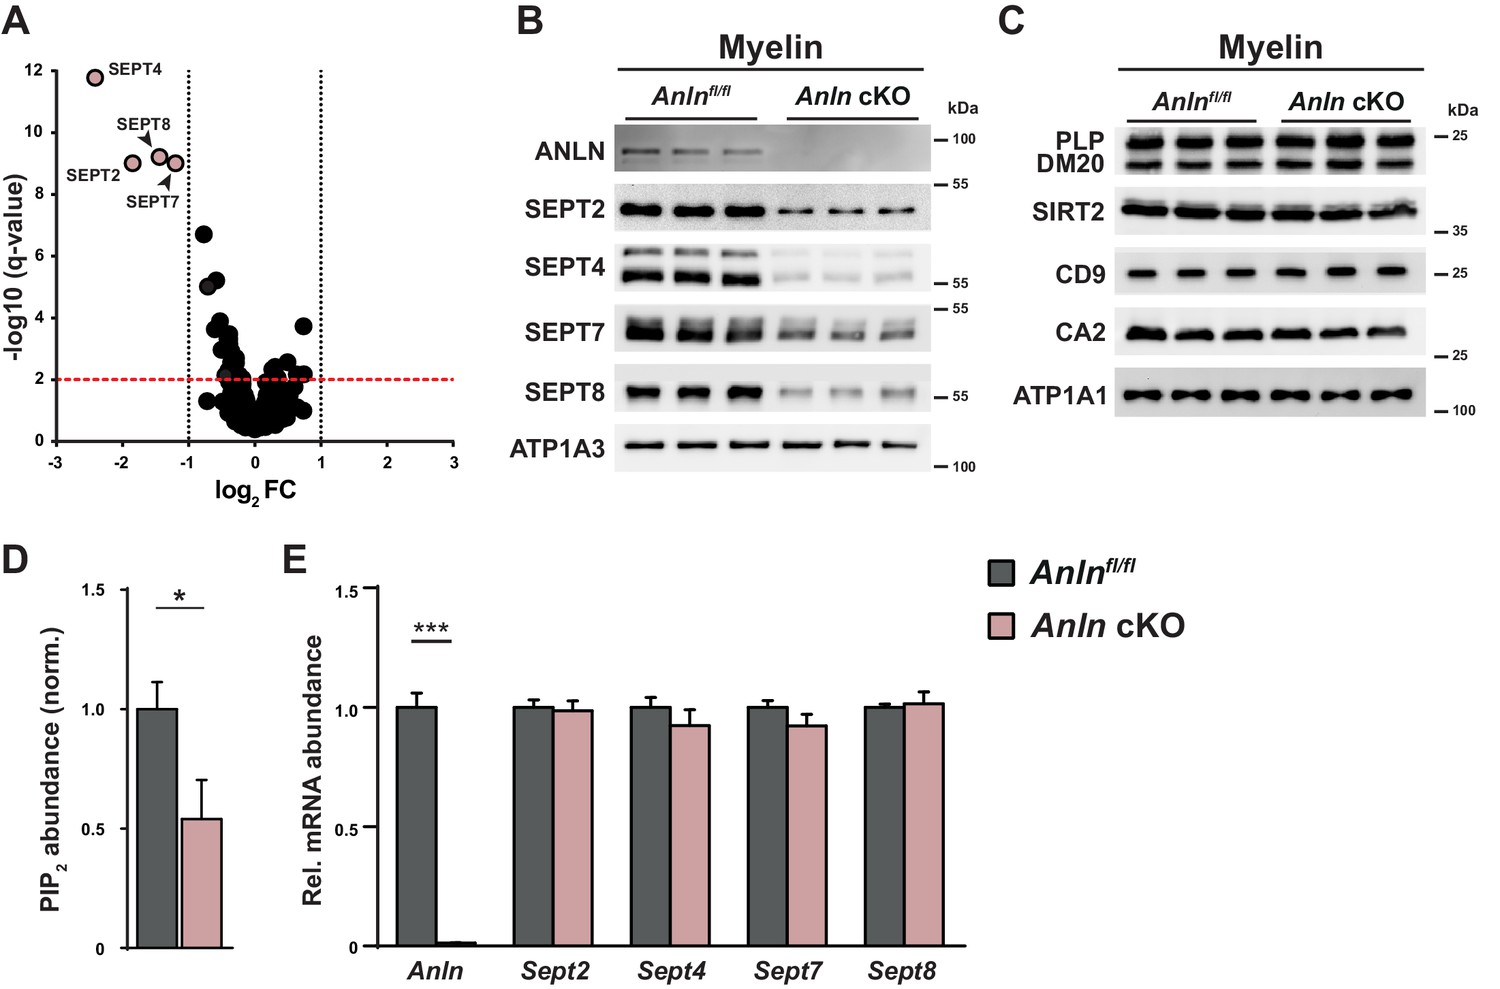
(A) Volcano plot summarizing genotype-dependent quantitative myelin proteome analysis. Data points represent quantified proteins in myelin purified at P75 from the brains of Anln cKO compared to Anlnfl/fl mice (n = 3 mice per genotype). Data points are plotted as log2-transformed fold-change (FC) on the x-axis against the −log10-transformed q-value on the y-axis. The horizontal red dashed line indicates a q-value of q = 0.01; the vertical black dashed lines mark the ±1 log2 fold-change threshold indicating a halved or doubled abundance of a protein in myelin, respectively. Data points representing myelin septin monomers (SEPT2, SEPT4, SEPT7, SEPT8) are highlighted in light red color with protein names given; note that their abundance is strongly reduced in Anln cKO compared to Anlnfl/fl myelin. Also note that ANLN is not represented because it was not detected in Anln cKO myelin. For bar graphs showing genotype-dependent comparison of the abundance of individual proteins in myelin see Figure 3—figure supplement 1A–D. For the original dataset and exact q-values see Figure 3—source data 1. (B) Immunoblotting validates the lack of anillin (ANLN) and the strong reduction of septins (SEPT2, SEPT4, SEPT7, SEPT8) in myelin purified from the brains of Anln cKO-mice. ATPase Na+/K + transporting subunit alpha 3 (ATP1A3) was detected as control. Blot shows n = 3 mice per genotype. (C) Immunoblotting indicates that the abundance of classical myelin proteins (PLP/DM20, SIRT2, CD9, CA2) is unaltered in myelin purified from the brains of Anln cKO-mice. ATP1A1 served as control. Blot shows n = 3 mice per genotype. (D) Genotype-dependent quantitative assessment of PtdIns(4,5)P2 (PIP2)–levels in myelin purified from the brains of Anln cKO-mice compared to controls (Anlnfl/fl) at P75. Mean +/SEM. n = 6 mice per genotype; two-tailed unpaired t-test; PtdIns(4,5)P2p=0.0435. (E) qRT-PCR to determine the abundance of mRNAs encoding anillin and myelin septins in the white matter (corpus callosum) of control (Anlnfl/fl) versus Anln cKO-mice. Note that Anln mRNA was virtually undetectable in Anln cKO-mice while the abundances of Sept2, Sept4, Sept7 and Sept8 mRNAs were unaltered. Mean +/SEM. n = 6 mice per genotype; two-way ANOVA; Anln p<0.0001, Sept2 p>0.9999, Sept4 p>0.9999, Sept7 p>0.9999, Sept8 p>0.9999.
-
Figure 3—source data 1
Label-free quantification of proteins in myelin purified from the brains of Anln cKO and control mice Tryptic peptides derived from two technical replicates (replicate digestion) per biological replicate (n = 3 mice per genotype) were analyzed by LC-MS (12 runs in total).
Proteins (FDR < 1%; two peptides/protein) and peptides (FDR < 1%;≥6 amino acids) were identified by database search against the UniprotKB/SwissProt mouse database using PLGS. Data were post-processed with the software package ISOQuant to calculate absolute in-sample amounts for each detected protein based on the TOP3 approach. Reported abundance values are defined as the relative amount of each protein in respect to the sum over all detected proteins (ppm: parts per million (w/w) of total protein). The typical contaminant proteins trypsin and keratins were filtered. One technical replicate of a control sample was identified as outlier based on its low correlation coefficient of ≤0.76 (all other runs ≥ 0.95) and thus excluded from analysis.
- https://doi.org/10.7554/eLife.43888.010
Figure 3—figure supplement 1
Genotype-dependent quantification of selected proteins according to myelin proteome analysis.
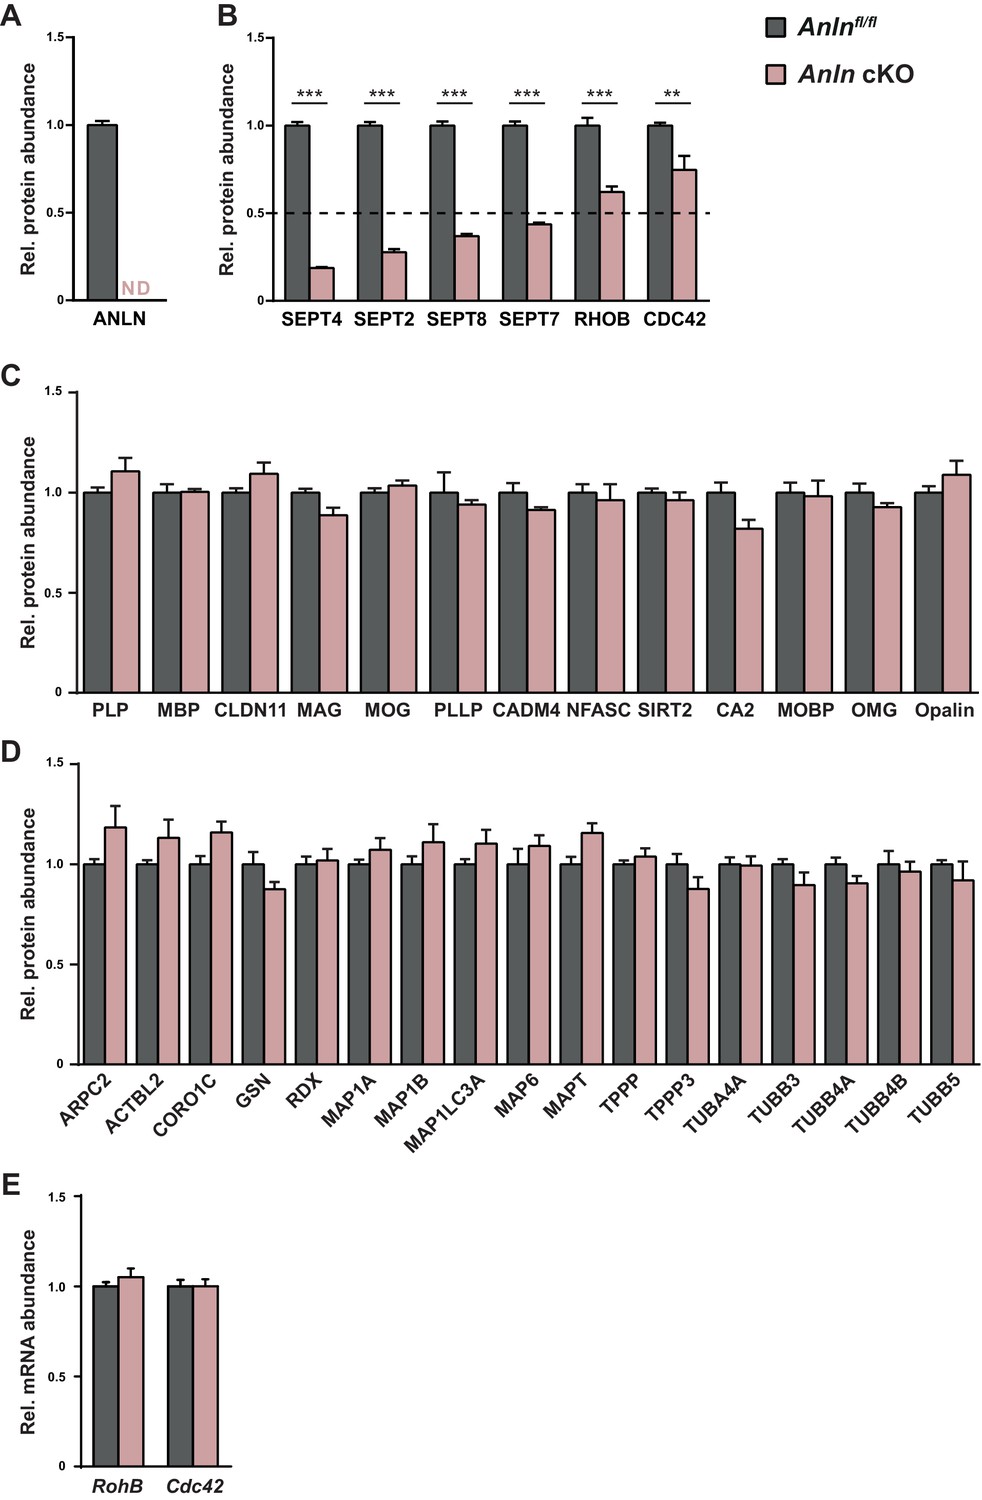
(A) Differential myelin proteome analysis indicates that ANLN is readily identified in myelin purified from the brains of control mice at P75 but undetectable in Anlnfl/fl;CnpCre/WT (Anln cKO)-myelin. Mean +/SEM; n = 3 mice per genotype. (B) Differential myelin proteome analysis reveals that the abundance of myelin septins (SEPT2, SEPT4, SEPT7, SEPT8) is diminished in myelin purified from Anln cKO-mice at P75 compared to Anlnfl/fl mice. The abundance of the putative septin-associated proteins RHOB and CDC42 is also significantly reduced in Anln cKO-myelin, although to a lesser degree. The horizontal black dashed line marks a threshold indicating halved abundance of a protein in myelin. Mean +/SEM; n = 3 mice per genotype; For q-values as calculated by R data analysis (see Materials and Methods for details) see Figure 3—source data 1. (C) Differential myelin proteome analysis indicates that the abundance of classical myelin proteins is unaltered in Anln cKO-myelin. Mean +/SEM. n = 3 mice per genotype; not significant according to q-value calculation using R (see Materials and Methods for details); for exact q-values see Figure 3—source data 1. (D) By differential myelin proteome analysis, the abundance of cytoskeletal proteins is unaltered in Anln cKO-myelin, except for myelin septins and septin-associated proteins as highlighted in (B). Mean +/SEM. n = 3 mice per genotype; not significant according to q-value calculation using R; for exact q-values see Figure 3—source data 1. (E) qRT-PCR to determine the abundance of mRNAs encoding putative septin-associated proteins RHOB and CDC42 in the white matter (corpus callosum) of control (Anlnfl/fl) versus Anln cKO-mice. Note that Rhob and Cdc42 mRNAs were unaltered in abundance. Mean +/SEM. n = 6 mice per genotype; two-way ANOVA; RhoB p>0.9999, Cdc42 p>0.9999.
Figure 4

Three-dimensional reconstruction of myelin outfoldings in Anln cKO mice.
(A–C) Focused ion beam-scanning electron microscopy (FIB-SEM) micrographs and 3D reconstruction of the plasma membrane of myelinated axonal segments (blue) and respective myelin sheaths (yellow) of representative axon/myelin-units in the optic nerve of control (Anlnfl/fl) (A,A‘) and Anln cKO (B,B‘,B‘‘,B‘‘‘) mice at 5.5 mo. Note the tight association of the myelin sheath reconstructed in A ‘with the corresponding axon (in A,A‘) over at least 10 µm in the control nerve. An individual myelin outfolding (B‘) and the corresponding axon are reconstructed over 20 µm in B,B‘. All myelin outfoldings in that same block (as in B,B‘) were reconstructed in B‘‘‘ with their corresponding axons (in B‘‘,B‘‘‘). Note that myelin outfoldings represent large sheets of compacted multilayered membrane stacks that extend considerably away from their respective myelinated axon, commonly displaying longitudinal dimensions between 10 µm and 15 µm. See Videos 1–3.
Videos
Video 1
FIB-SEM and 3D reconstruction of a normal-appearing axon/myelin-unit in a control mouse.
https://doi.org/10.7554/eLife.43888.012
Video 2
FIB-SEM and 3D reconstruction of one selected myelin outfolding in an Anln cKO mouse.
https://doi.org/10.7554/eLife.43888.013
Video 3
FIB-SEM and 3D reconstruction of multiple myelin outfoldings in one tissue block of an Anln cKO mouse.
https://doi.org/10.7554/eLife.43888.014Additional files
-
Transparent reporting form
- https://doi.org/10.7554/eLife.43888.015
Download links
A two-part list of links to download the article, or parts of the article, in various formats.
Downloads (link to download the article as PDF)
Open citations (links to open the citations from this article in various online reference manager services)
Cite this article (links to download the citations from this article in formats compatible with various reference manager tools)
Anillin facilitates septin assembly to prevent pathological outfoldings of central nervous system myelin
eLife 8:e43888.
https://doi.org/10.7554/eLife.43888


