Spatiotemporal organization of branched microtubule networks
- Princeton University, United States
Figures
Figure 1 with 3 supplements
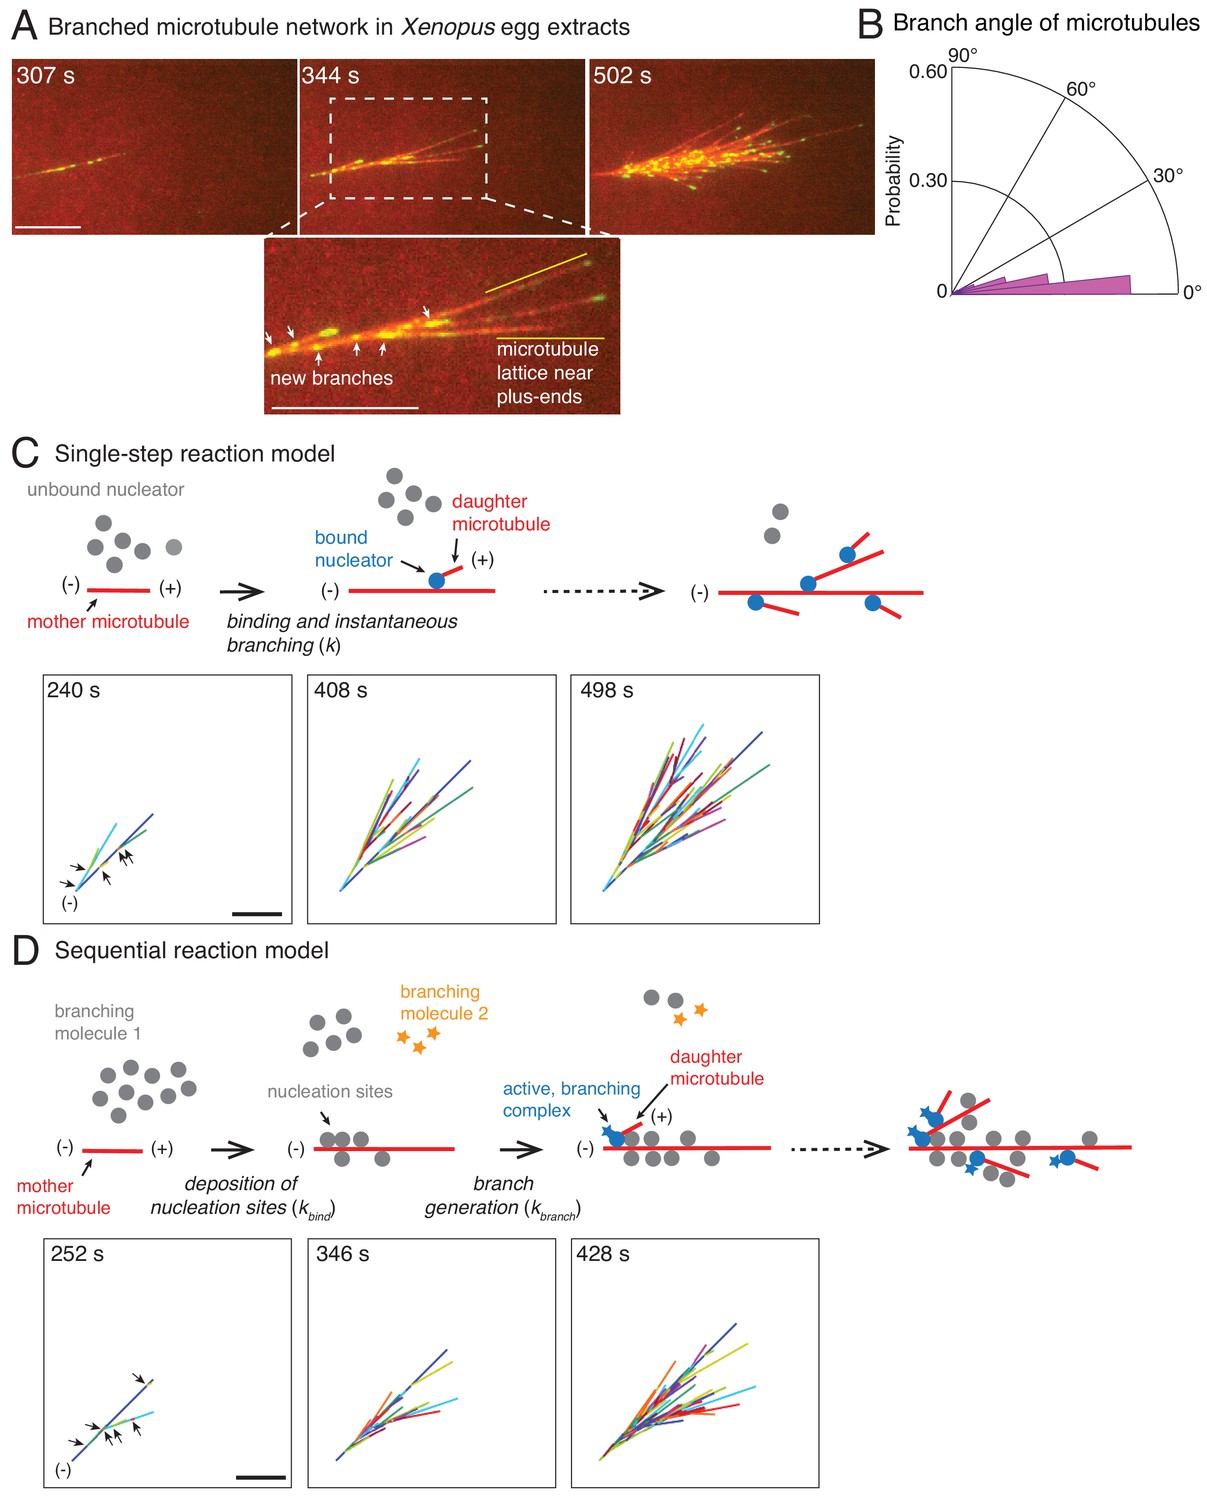
Branched microtubule networks and stochastic models for their assembly.
(A) Branched microtubule (MT) networks were generated in Xenopus egg extracts with 10 μM RanQ69L, and time-lapse is displayed for one representative branched network. MTs were labeled with Cy5-tubulin (red) and their plus-ends with EB1-mCherry (pseudo-colored as green). 0 s represents estimated nucleation of the first mother MT. Scale bar, 10 μm. The highlighted region shows that new nucleation events (marked by EB1 spots) occur near the minus-ends and exclude the lattice near the growing plus-ends. The experiment was repeated with more than ten independent egg extract preparations. (B) Angle of branching for all branching nucleation events was calculated as described in Materials and methods. Polar histogram of n = 339 measurements from 19 branched networks is plotted. The median branch angle is 0° with a standard deviation of 9°. See Figure supplements and Videos 1–2. (C) Schematic representation of biochemical scheme for the single-step model. Free, inactive nucleators (grey) bind to existing MT lattice (red) and instantaneously nucleate a new daughter MT upon this binding (blue nucleators). Recursion of this process results in branched structures. Time-lapse of a representative stochastic simulation of the model is displayed with parameters provided in Figure 1—figure supplement 3A. Individual MTs are labelled in rotating color scheme. Arrows denote the positions of nucleation sites for first five branched MTs. Scale bar, 10 μm. See Figure 1—figure supplement 3A and Video 3. (D) Biochemical scheme for the sequential model. Molecules of branching effector 1 (grey) bind to existing MT lattice (red) and deposit nucleation sites. Subsequent binding of branching effector 2 (yellow stars) results in nucleation of daughter MTs. Time-lapse of a representative stochastic simulation of the model is displayed with parameters provided in Figure 1—figure supplement 3A. Individual MTs are labelled in rotating color scheme. Arrows denote the positions of nucleation sites for first six branched MTs. Scale bar, 10 μm. See Figure 1—figure supplement 3A and Video 4.
Figure 1—figure supplement 1
Hybrid tracking of branched microtubule networks.
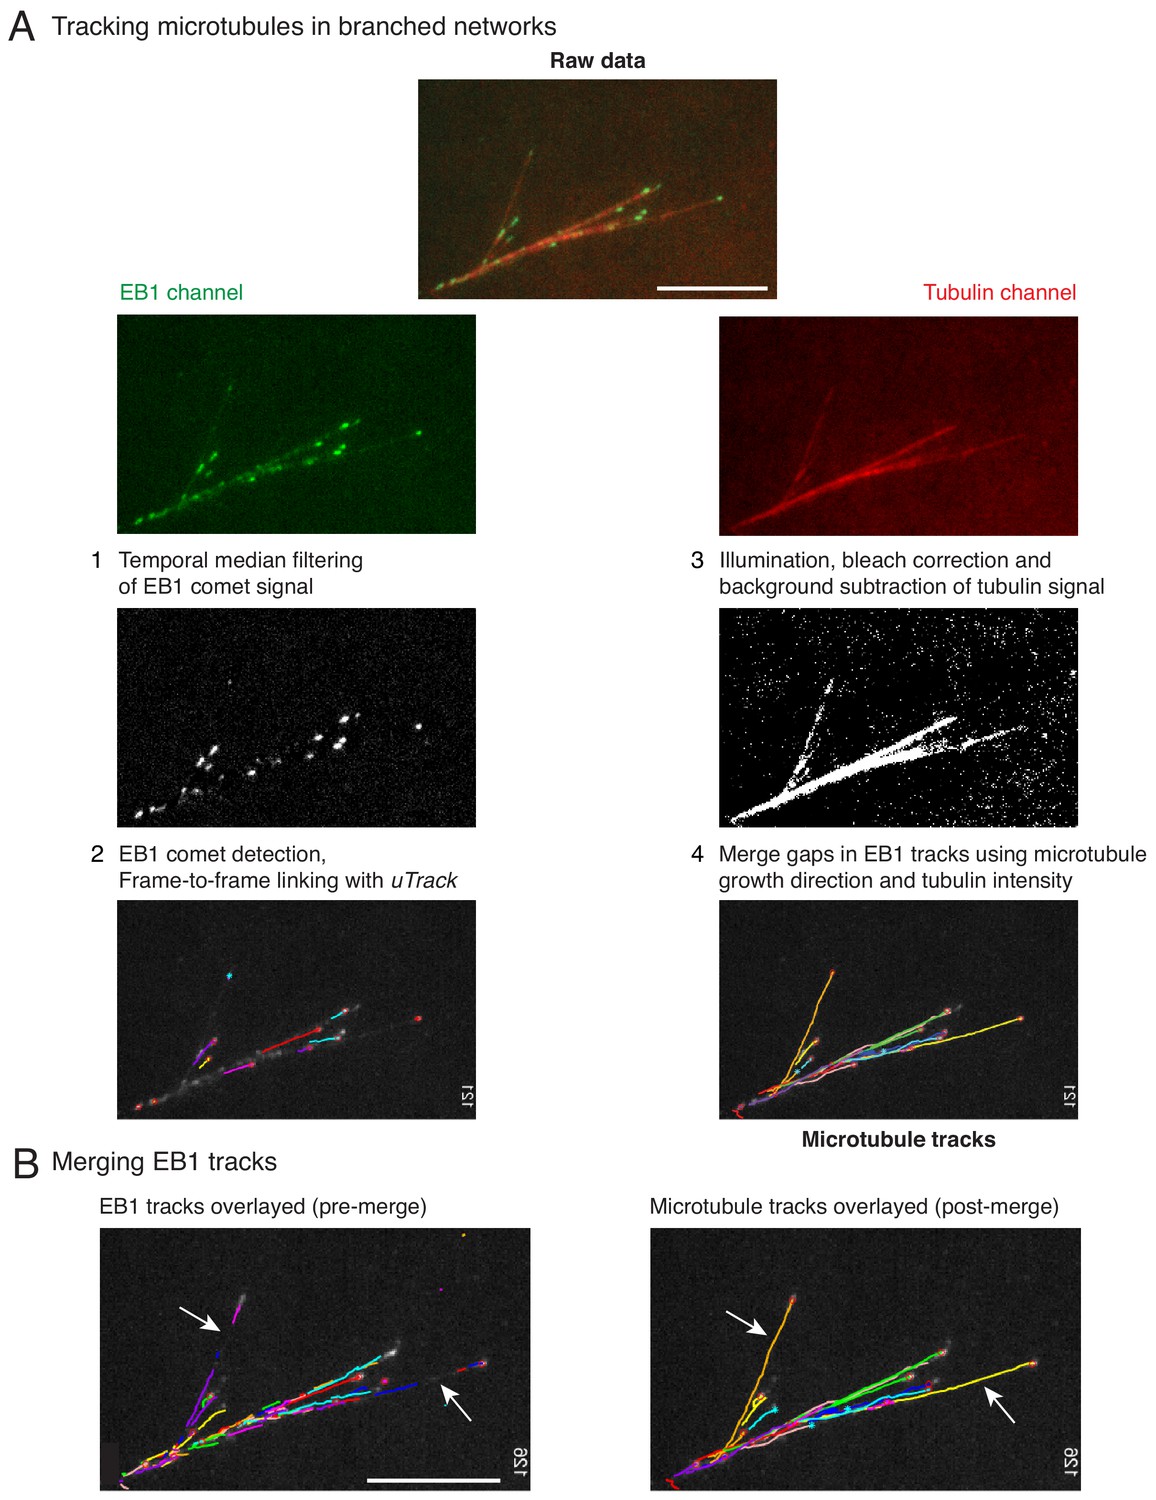
(A) Microtubules (MTs) in branched networks were tracked in the following four steps. (1) EB1 comets were pre-processed using temporal median filter, which isolates only moving particles in an image sequence. (2) Processed EB1 signal was supplied as input to comet detection and plus-tip tracking modules of uTrack, and EB1 trajectories were obtained. The EB1 trajectories do not represent the entire MT track due to gaps (white arrows, left panel in (B)), which occur when the MT plus-end undergoes pause or catastrophe. These gaps were closed by software using steps 3 and 4. (3) MT intensity was pre-processed to account for uneven illumination, bleaching and background from soluble tubulin was subtracted. (4) The EB1 gaps were closed by merging multiple EB tracks via a greedy optimization algorithm, which is based on the growth direction of the tracks, distance between the tracks as well as the MT intensity in gaps. Complete MT trajectories in the branched network were obtained (right panel in (B)). Scale bars, 10 μm. See Video 2 for tracking example, Materials and methods for detailed tracking procedure. MATLAB software for tracking is provided in Supplementary file 1 .
Figure 1—figure supplement 2

Characterization of branched microtubule networks.
(A) Schematic representation of a branched network depicting parameters measured in (B–E). (B) Growth speed of plus-ends was obtained from EB1 tracks as described in Materials and methods. Histogram of n = 1691 EB1 tracks is displayed where all data was pooled from 20 branched networks. Mean growth speed was measured as 8.3 ± 2.5 μm min−1. Analyses in (B–E) are displayed for multiple branched networks generated in one Xenopus egg extract preparation, and were repeated with at least two independent egg extract preparations. (C) Number of EB1 comets were detected individually in 11 branched networks and plotted over time. Exponential curve [a exp(kt)] was fit to data points for each network, representing autocatalytic nucleation, and displayed in different colors. (D) Length of all MTs tracked in 20 branched networks was measured over time and plotted. The central mark displays the median length (yellow), and the edges of the box represent 25th and 75th percentiles. New MTs nucleated represent the near-zero lengths at later time points. The overlaid red curve represents the mean MT length over time. (E) Probability distribution of length of all MTs between 200–250 s is plotted. Data was pooled from 20 branched networks.
Figure 1—figure supplement 3
Stochastic models of branched microtubule networks.
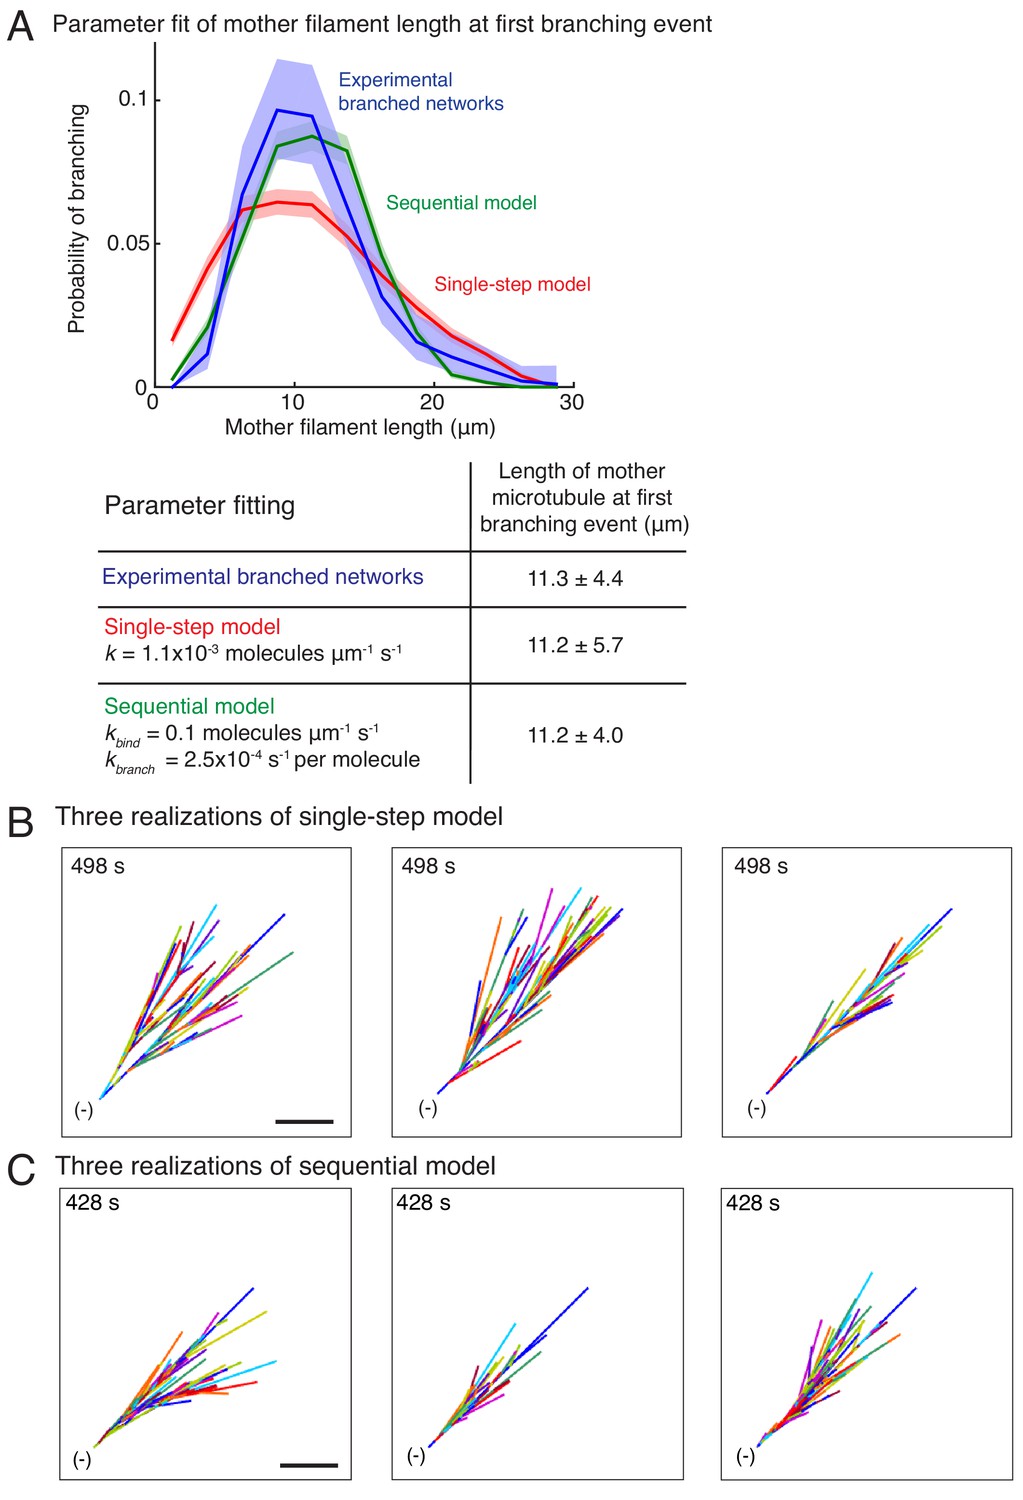
(A) Distribution of mother MT lengths at the first branching event, used for parameter estimation of the single-step model and the sequential model, is displayed. The fit parameters are tabulated below. Number of measurements: n = 381 experimental measurements, and n = 4000 measurements for each model. (B–C) Three stochastic simulations of (B) the single-step model, and (C) the sequential model are displayed using parameters in (A). Individual MTs are labelled in rotating color scheme. Scale bar, 10 μm. See Figure 1, Videos 3 and 4.
Figure 2 with 3 supplements

Nucleation profile of first branching event and spatial organization of microtubules in dense branched networks.
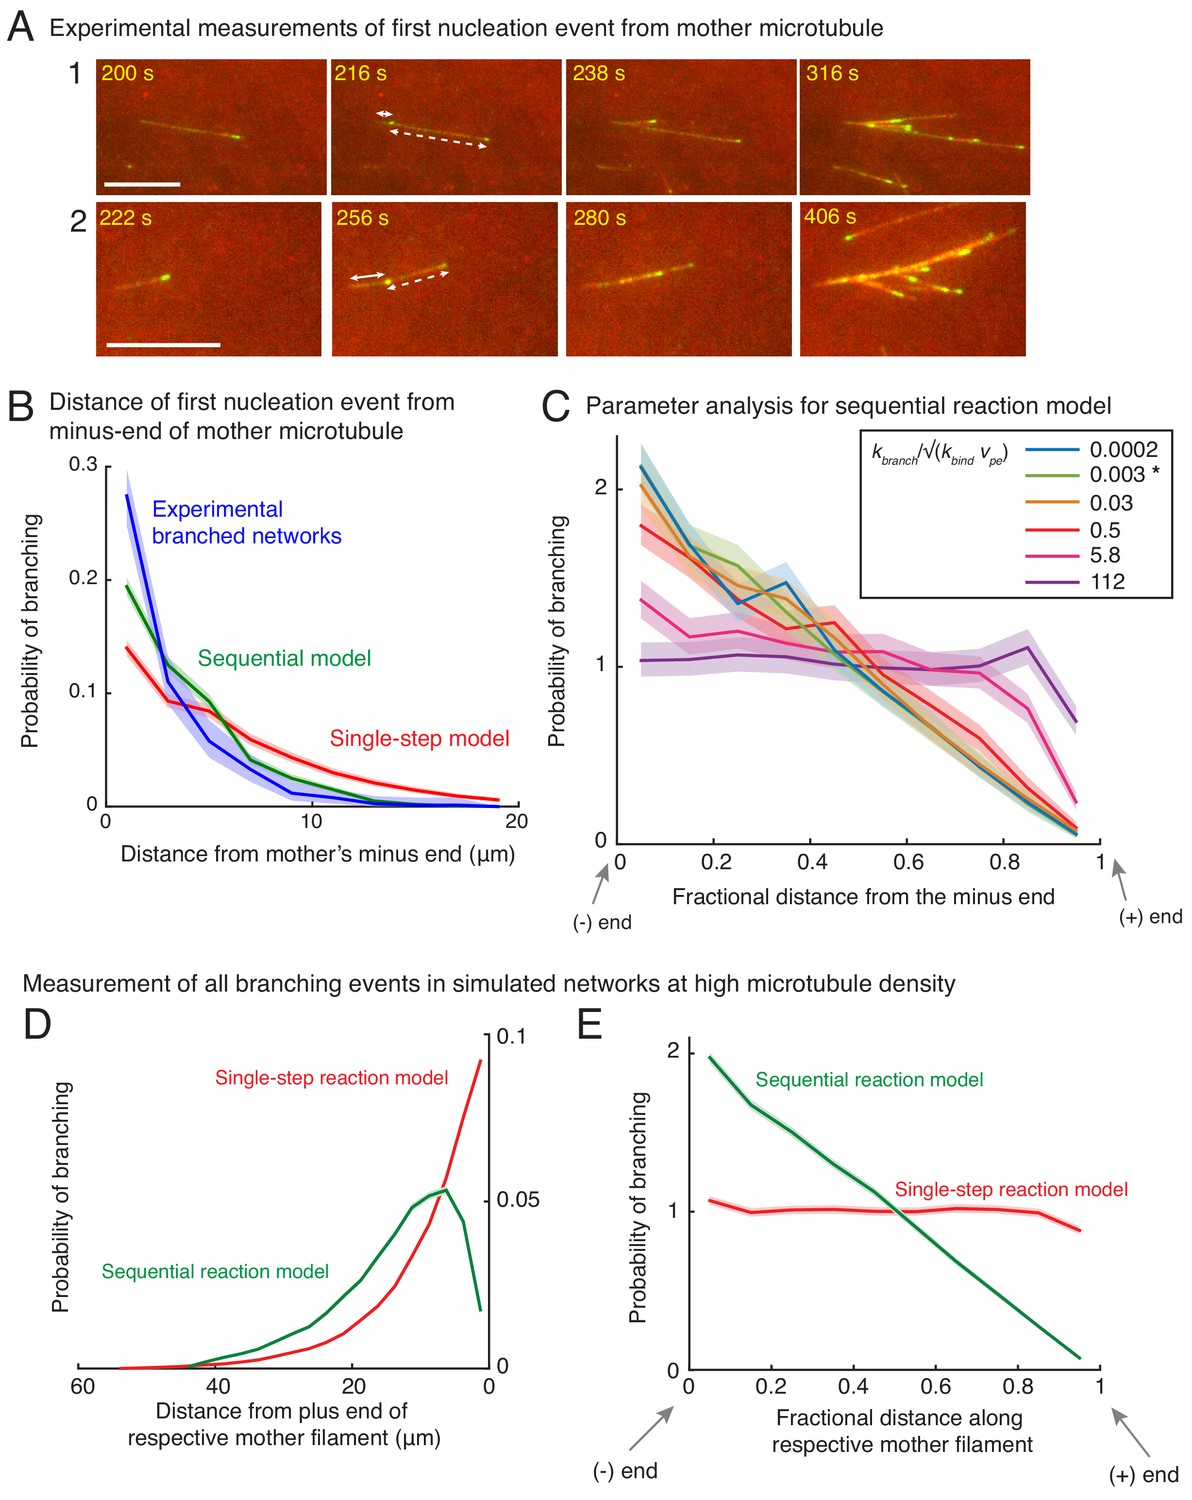
Spatial location of first branching event on a naked mother MT was recorded during the formation of individual branched MT networks, and the following distributions were measured. See Figure 2—figure supplement 1A for representative examples. (A) Distance of the nucleation site from the mother’s plus-end was measured at the time point when first branching event occurred. Rightmost (0 μm) point on the horizontal axis denotes nucleation near the mother’s plus-end. Inverted x-axis is plotted for consistency with (B). (B) Fractional distance was obtained by dividing the branching nucleation site from the mother’s minus-end by the total length of the mother MT when the first branching event occurred. Leftmost (0) point on x-axis denotes nucleation near the mother’s minus-end, while rightmost (1) represents nucleation near the mother’s plus-end. For panels (A-B), normalized probability of branching was plotted for n = 381 experimental measurements (blue), and n = 4000 each using the single-step model (red) or the sequential model (green). Shaded regions depict the 95% bootstrap confidence intervals. The experiments and analyses were performed with three independent extract preparations and all data was pooled. See also Figure 2—figure supplement 1. Spatial organization of MTs in dense branched networks. (C) Positions of minus-ends were obtained in simulated branched networks. The distances of all minus-ends were calculated from the origin (seed MT’s minus-end, panel (F)), then normalized by seed MT’s length (set to 1). The resulting probability distribution of was plotted. Data was pooled for 10–60 MTs in roughly 250 branched networks each simulated using the single-step model (red, n = 633517) and sequential model (green, n = 495794). Shaded regions depict the 95% bootstrap confidence intervals. (D) Positions of MT plus-ends were obtained in branched networks. Distances of all plus-ends were calculated from the origin (see panel (F)), normalized by the largest distance (set to 1), and the resulting probability distribution was plotted. For experimental measurements, data was pooled from 27 branched networks, each containing 10–55 EB1 comets, generated in two independent extract preparations (blue, n = 47362). For simulated networks, data was pooled from 10 to 60 MTs in 250 branched networks each simulated using the single-step model (red, n = 633517) and sequential model (green, n = 495794). Shaded regions depict the 95% bootstrap confidence intervals. See Figure 2—figure supplement 2B for the measurement procedure. (E) Tubulin intensity in branched networks was plotted against distance from the origin, normalized by the longest distance (set to 1). For experimental data, measurements were pooled for 33 branched networks (blue) observed in one Xenopus extract preparation, and analysis was repeated with three independent extract preparations. For simulations, data was pooled for 20–50 MTs in approximately 250 branched networks simulated using the single-step model (red) or the sequential model (green). Shaded regions depict the standard deviation in intensity measurements. See Figure 2—figure supplement 2A for the measurement procedure. (F) Schematic representation of MT organization in branched networks generated via the single-step model (top) or the sequential model (bottom). While the total number of MTs and their lengths is the same in the two representations, the overall distribution of plus-ends, minus-ends and MT mass is more concentrated near the origin (yellow) in the sequential model. See also Figure 2—figure supplement 3.
Figure 2—figure supplement 1
Measurement of nucleation profile and testing robustness of sequential model.
(A) Position of first branching event on a naked mother MT was recorded during the formation of individual branched networks. Two branched networks were selected in the field of view and time-lapse is displayed. Time points at 216 s and 256 s respectively show the first branching event on the naked mother marked by emergence of an EB1 comet. Growth of this new MT is displayed at times 238 s and 280 s respectively for the two networks. The position measurements were made when the EB1 comet first emerged (216 s and 256 s respectively). Distance from the mother’s minus-end is denoted by a solid line segment, and from mother’s plus-end by a dashed line segment. The fractional distance was measured dividing the solid segment length by the sum of solid and dashed segment lengths. These measurements were made for n = 381 branched networks and are plotted in (B) and Figure 2A–B. Scale bars, 10 μm. (B) Spatial location of first branching event on a naked mother MT was recorded during the formation of individual branched MT networks. The distance of the branching nucleation site from the mother’s minus-end was measured, and compared with single-step and sequential models as in Figure 2A–B. Leftmost (0 μm) point on x-axis denotes nucleation near the mother’s minus-end. Normalized probability was plotted for n = 381 experimental measurements (blue), and n = 4000 each using the single-step model (red) or the sequential model (green). Shaded regions depict the 95% bootstrap confidence intervals. The experiments and analyses were performed with three independent extract preparations and all data was pooled. (C) Robustness of sequential model was tested by varying the dimensionless ratio of the branching rate, kbranch (units: sec−1), and effective binding rate constant, √(kbind vpe) (units: sec−1). The fractional position of the first nucleation event along the mother was compared. Bias was observed for , and no bias is observed for . Spatial bias remained similar when the ratio of rates, , is decreased below 0.03. The chosen parameters for the sequential reaction model are denoted by [*] for (green curve). See Appendix 1 for derivation of the dimensionless number. (D–E) Nucleation profile for subsequent branching events. Spatial location of all branching events in a dense branched network was measured in stochastic simulations. Analogous to Figure 2A–B, the distance of branching site was measured from (D) its mother’s plus-end, Fractional distance of each branching site along its corresponding mother was measured in (E). Leftmost point on x-axis denotes nucleation near the mother’s minus-end, while the rightmost point represents nucleation near the mother’s plus-end. Normalized probability of branching was plotted for roughly 250 branched networks containing 200 MT on average. n = 49750 measurements for single-step model (red) and n = 55030 measurements for sequential model (green) were obtained. Shaded regions depict the 95% confidence intervals. Probability distributions demonstrate that the spatial bias similar to the first nucleation event (Figure 2A–B) persists over subsequent nucleation events.
Figure 2—figure supplement 2
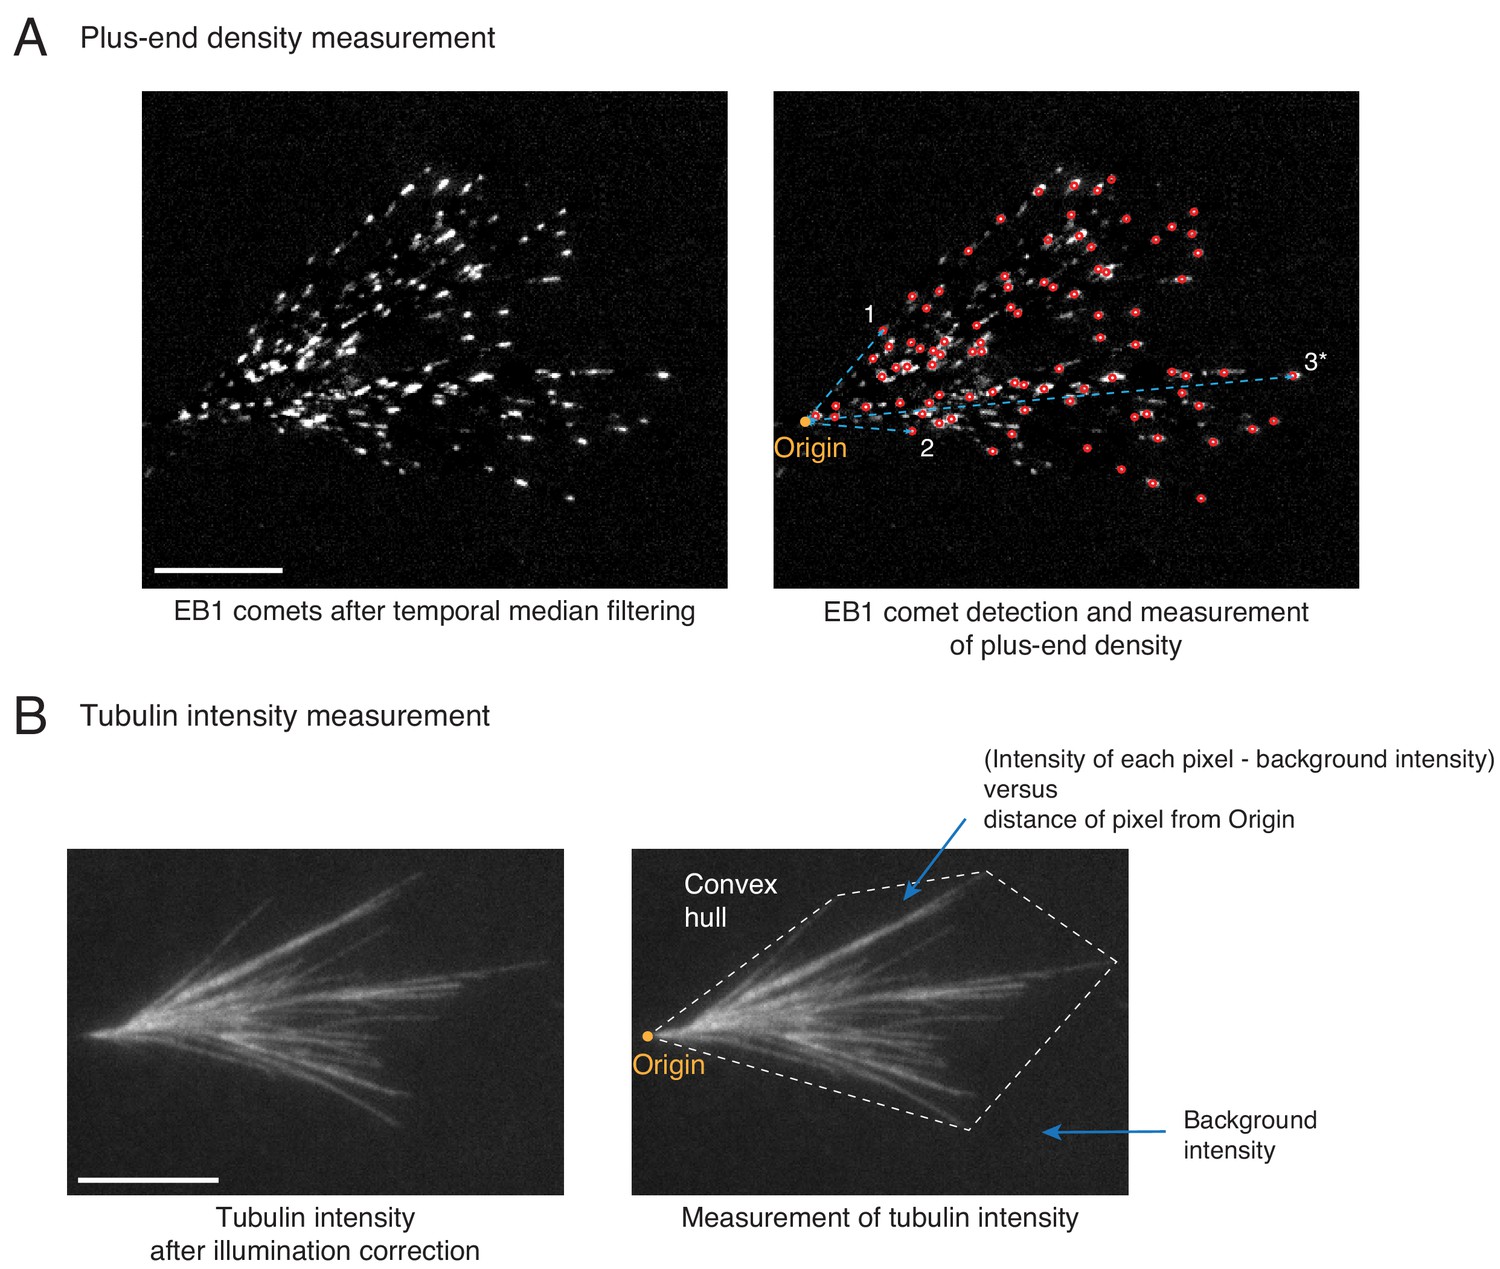
Spatial organization of microtubules in dense branched networks.
(A) Distribution of MT plus-ends was measured in dense branched networks as follows. EB1 comets were pre-processed (left panel) and detected (red circles, right panel) as described in Materials and methods. The cartesian distances of all EB1 comets from the origin (yellow, right panel) were measured. Three example measurements are illustrated with cyan line segments. All distances were normalized by the longest distance (marked 3*) for each branched network. Measurements were pooled from multiple branched networks and the probability distribution was reported in Figure 2D. Scale bar, 10 μm. (B) Tubulin intensity was measured in dense branched networks as follows. Background illumination was corrected for the tubulin intensity as described in Materials and methods. The convex hull around the branched network was generated (dashed boundary, right panel) and average intensity outside the image was subtracted. For all pixels within the convex hull, the subtracted intensity was recorded and their distances from the origin was measured. All distances were normalized by the longest distance of any vertex of the convex hull from origin for each branched network. For any specified distance, all measured intensities were pooled from multiple branched networks and reported in Figure 2D. Scale bar, 10 μm.
Figure 2—figure supplement 3
Self-similarity in the architecture of branched networks.
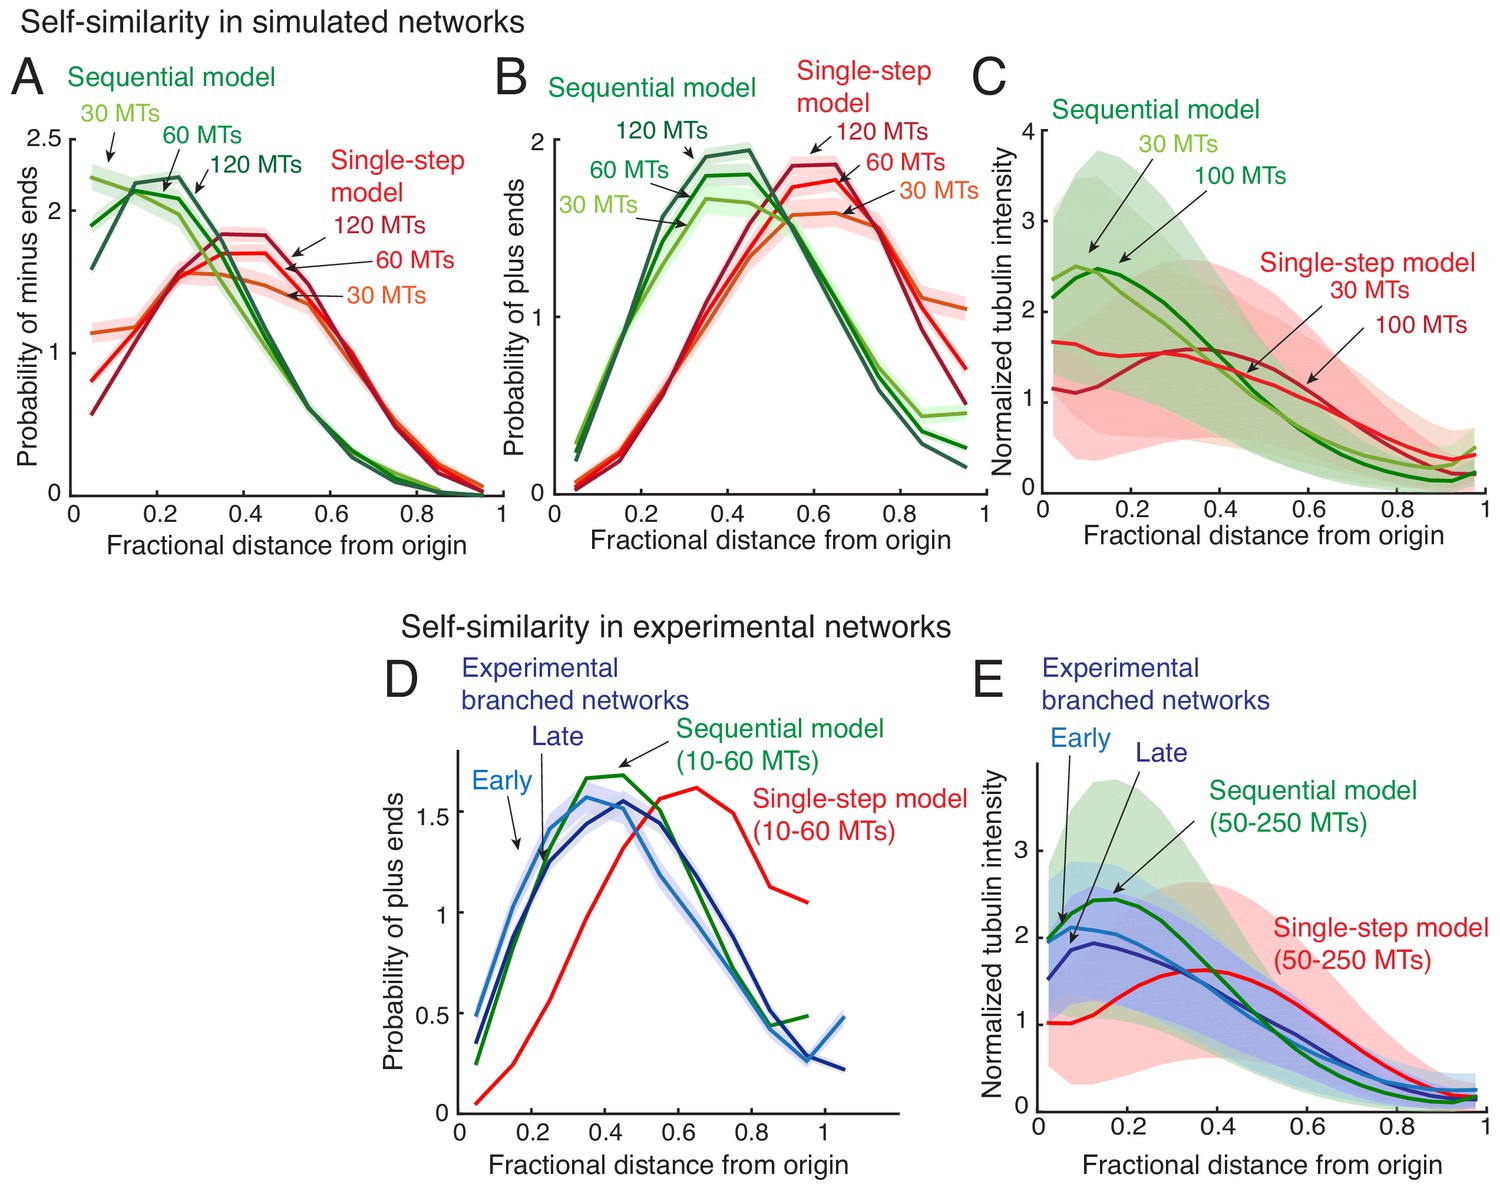
(A–B) Positions of the minus-ends were recorded in simulated branched networks. The distances of all minus-ends were calculated from the origin, normalized by seed MT’s length, and the resulting probability distribution of was plotted in (A). The distances of all plus-ends were calculated from the origin, normalized by the largest distance (set to 1), and the resulting probability distribution of was plotted in (B). Data was obtained for roughly 250 branched networks containing 30, 60 or 120 MTs. Total number of measurements for single-step model (red): 30 MTs (n = 7535), 60 MTs (n = 14234), 120 MTs (n = 22655), and for sequential model (green): 30 MTs (n = 7602), 60 MTs (n = 15189), 120 MTs (n = 28300). (C) Tubulin intensity in simulated branched networks was measured against distance from the origin, normalized by the longest distance (set to 1). Data for obtained for roughly 250 branched networks each containing 30 or 100 MTs. Shaded regions depict the standard deviation in intensity measurements. (D) Positions of plus-ends were obtained in branched networks. Distances of all plus-ends was calculated from the origin, normalized by the largest distance (set to 1), and the resulting probability distribution of was plotted. For experiments, 17 branched networks generated were imaged over time and their plus-end distribution was measured when each network contained 10–30 EB1 comets (cyan, n = 8624), and 35–55 EB1 comets (blue, n = 17676). For simulated networks, data was pooled for 10–60 MTs in 250 branched networks each simulated using the single-step model (red, n = 633517) and sequential model (green, n = 495794). Shaded regions depict the 95% confidence intervals. The experiments and analyses were repeated with two independent extract preparations and representative experiment was reported. See Figure 2—figure supplement 2 and Materials and methods for measurement procedure. (E) Tubulin intensity in branched networks was plotted against distance from the origin, normalized by the longest distance (set to 1). Snapshots of branched networks were imaged at early time-point (10 min, cyan), and the same networks were imaged again later (14 min, blue). All measurements were pooled for 59 branched networks generated with one Xenopus extract preparation, and the experiments and analyses were repeated with two independent extract preparations. For simulations, data was pooled for 50–250 MTs in roughly 250 branched networks each simulated using the single-step model (red) and sequential model (green). Shaded regions depict the standard deviation in intensity measurements. See Figure 2—figure supplement 2 and Materials and methods for measurement procedure.
Figure 3 with 1 supplement

Network architecture changes with varying protein concentrations as predicted by the sequential model.
(A) Branched MT networks were generated in Xenopus egg extracts with 10 μM RanQ69L for four conditions: buffer addition or control depletion, addition of 260 nM TPX2 (9.6x), partial depletion of TPX2 (20% of control), or partial depletion of augmin (20% of control). For each condition, at least 5–10 identical reactions were performed with each preparation of Xenopus extracts, and repeated with at least three independent extract preparations, except TPX2 addition was repeated with two independent extract preparations. Scale bars, 10 μm. See Figure 3—figure supplement 1. (B) Spatial location of first branching event on a naked mother MT was recorded for each condition in (A) and compared with prediction from sequential model. Distance of the branching nucleation site from the mother MT’s minus-end (top), plus-end (middle) and fractional distance of nucleation from the minus-end (bottom) were measured, resulting probability distribution was plotted. Shaded area represents 95% confidence interval. Leftmost and rightmost points on x-axis denote nucleation site near the mother’s minus-end or the plus-end respectively. The insets show the rate constants in sequential model corresponding to changes in protein concentrations: blue (1x rate constants, control reactions), green (9.6x kbind or kbranch, 9.6x TPX2 concentration), mustard and red (0.2x TPX2 and augmin concentration, respectively) compared to orange (0.2x kbind or kbranch). Number of experimental measurements: buffer or control depletion (blue, n = 283), TPX2 addition (green, n = 45), TPX2 partial depletion (yellow, n = 157), augmin partial depletion (red, n = 65). Number of simulations: n = 4000 for each condition. See Figure 3—figure supplement 1 for example measurements and parameter fit for the model. See also Figure 3—figure supplement 1.
Figure 3—figure supplement 1
Controls for varying TPX2 and augmin concentration in Xenopus egg extracts.
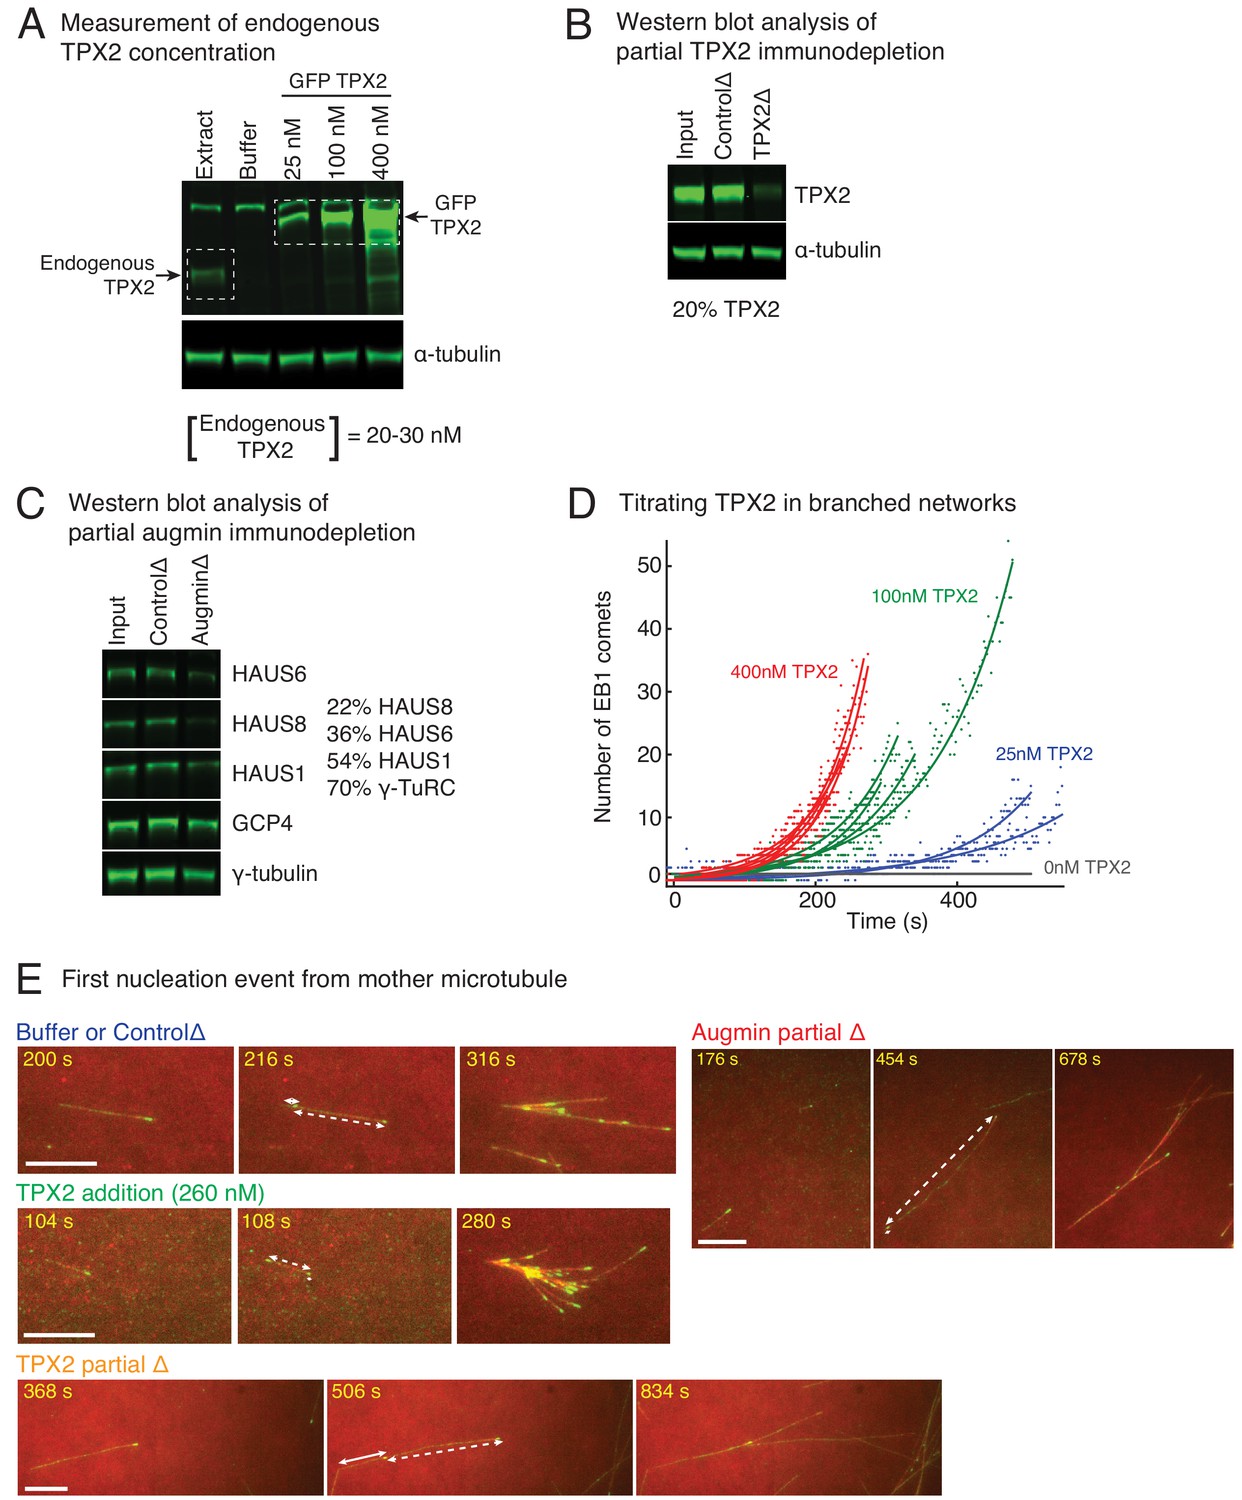
(A) Endogenous TPX2 concentration was measured using quantitative, fluorescence western blot. A series of known concentrations of recombinant GFP-TPX2 were compared with endogenous TPX2 and probed via anti-TPX2 antibody. The endogenous concentration was estimated as 20–30 nM in Xenopus egg extracts. α-tubulin was used as loading control. The experiment was repeated thrice, including different truncations of recombinant TPX2 used for the gradient. (B) Partial depletion of TPX2 from Xenopus egg extracts was assessed using quantitative, fluorescence western blot. Untreated extract (input), IgG-depleted (control) and TPX2 depleted extracts were compared and probed via anti-TPX2 antibody. α-tubulin was used as loading control. The experiment was repeated more than thrice with independent extract preparations. (C) Partial depletion of augmin from Xenopus egg extracts was assessed using quantitative, fluorescence western blot. Untreated extract (input), IgG-depleted (control) and augmin-depleted extracts were compared and probed for HAUS1, HAUS6 and HAUS8 subunits of augmin complex. Components of γ-TuRC (γ-tubulin and GCP4) were also assessed. Protein levels in augmin depletion compared to control depletion: HAUS8 (20%), HAUS6 (36%), HAUS1 (54%), γ-tubulin and GCP4 (70% each). The experiment was repeated more than thrice with independent extract preparations. (D) Branching nucleation was observed as a function of TPX2 concentration in Xenopus egg extracts. Endogenous TPX2 was depleted and recombinant GFP-TPX2 was added back at specified concentrations in the presence of 10 μM RanQ69L. Branched The number of EB1 comets observed in individual branched networks is plotted over time. Number of branched networks analyzed: 25 nM (n = 2), 100 nM (n = 4), and 400 nM TPX2 (n = 6). The measurement was used to estimate the concentration of TPX2 for addition experiments (Figure 3A), and repeated twice with independent extract preparations. (E) Position of first branching event on a naked mother MT was recorded during the formation of individual branched MT networks. Example measurement for buffer or control depletion, addition of 260 nM TPX2, partial depletion of TPX2 (20% of control), or partial depletion of augmin (20% of control) are displayed. For all networks, second displayed frame shows emergence of an EB1 comet on the naked mother. Distance from the mother’s minus-end is denoted by solid line segment, and from mother’s plus-end by dashed line segment. The fractional distance from mother’s minus-end was measured as solid segment length divided by sum of solid and dashed segment lengths. These measurements were made for multiple branched networks and plotted in Figure 3B. Scale bars, 10 μm.
Figure 4 with 2 supplements
Sequential mechanism of branching microtubule nucleation and binding rate of TPX2 to microtubules.
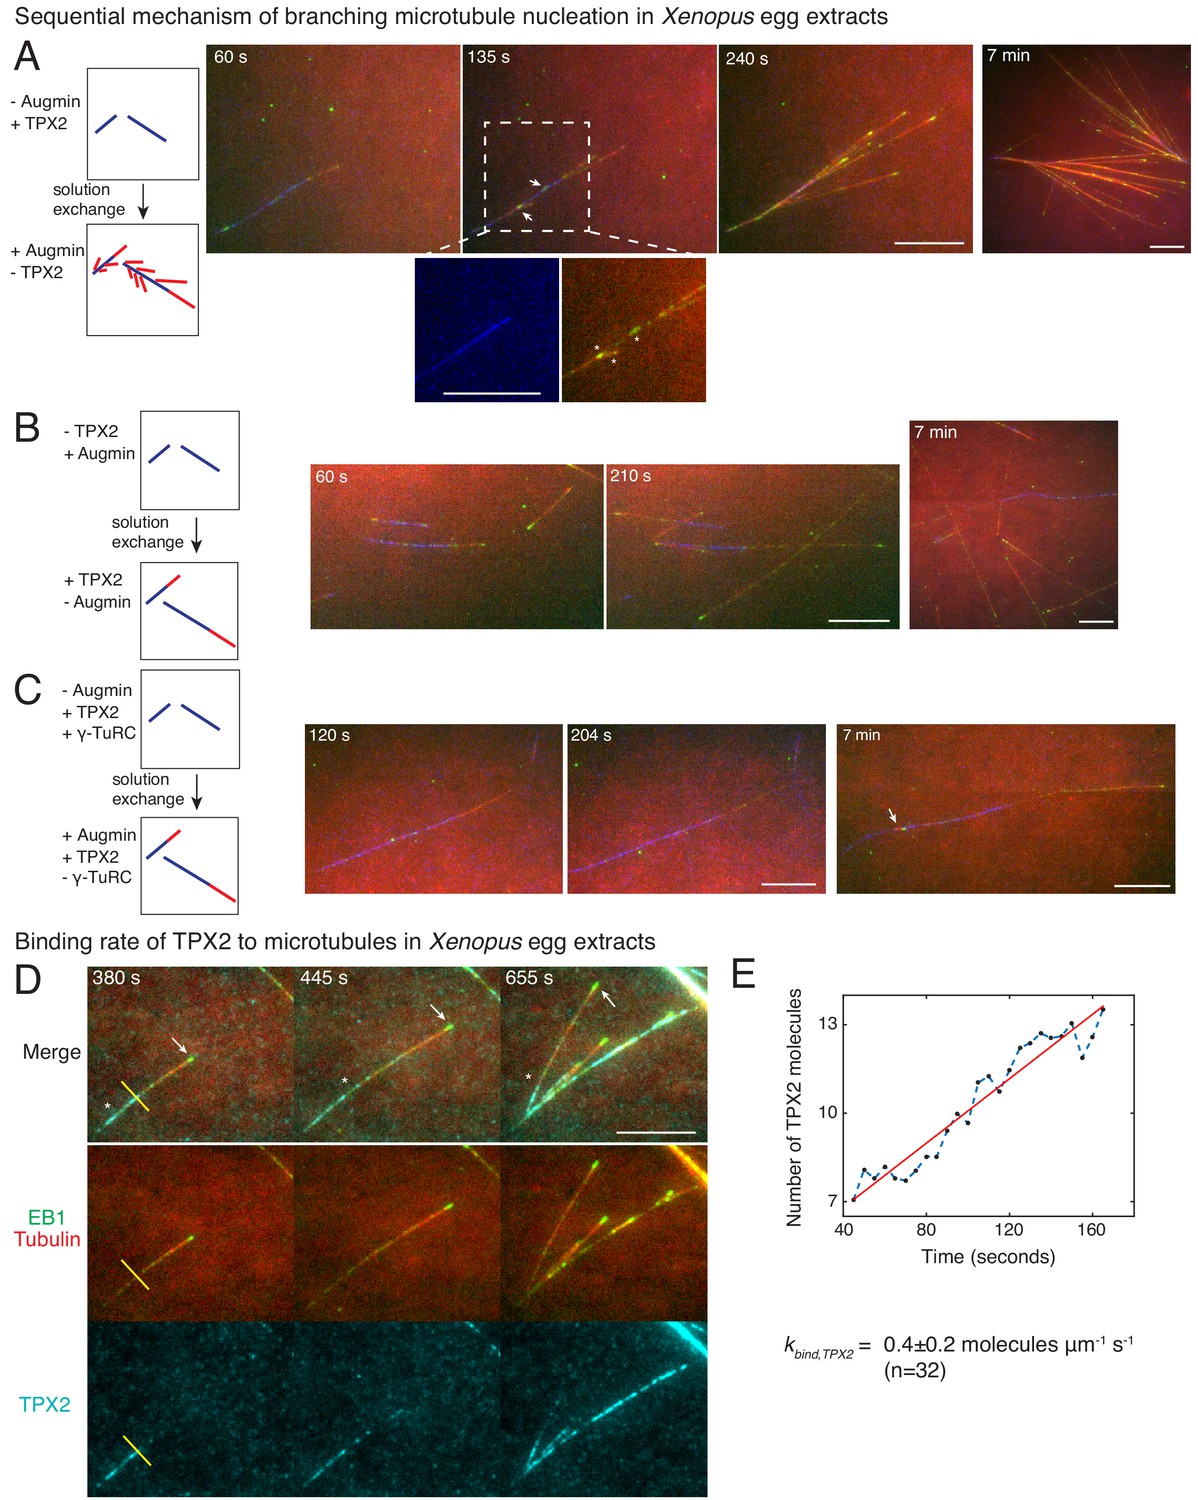
Sequential mechanism of branching MT nucleation (A-C). (A) De novo MTs (blue) were generated by performing branching reaction in augmin-depleted Xenopus egg extracts where TPX2 is present. Non MT-bound, soluble proteins were removed with buffer wash, and Xenopus egg extracts containing augmin but no TPX2 was introduced. Branched MTs (red), with their plus-ends labelled with EB1-mCherry (pseudo-colored as green), nucleated immediately from de novo MTs (blue), highlighted in the zoomed-in region. Late time point (7 min) shows formation of dense branched networks around the initial de novo MTs (blue). 0 s marks the time of extract exchange in the reaction chamber. Scale bar, 10 μm. The experiment was repeated six times with independent egg extract preparations. (B) De novo MTs (blue) were generated by performing branching reaction in Xenopus egg extracts containing augmin but no TPX2. Non MT-bound, soluble proteins were removed with buffer wash, and Xenopus egg extracts containing TPX2 but no augmin was introduced. No branching was seen, and only MT plus-ends elongated (Cy5-MTs in red and EB1-mCherry pseudo-colored as green) was observed. Late time point (7 min) depicted for comparison with (A). 0 s marks the time extract exchange in the reaction chamber. Scale bar, 10 μm. The experiment was repeated four times with independent egg extract preparations. (C) De novo MTs (blue) were generated by performing branching reaction in Xenopus egg extracts containing TPX2 and γ-TuRC but no augmin. Non MT-bound, soluble proteins were removed with buffer wash, and γ-TuRC-depleted Xenopus egg extracts containing TPX2 and augmin was introduced. At initial time points, only elongation of MT plus-ends (red with EB1-mCherry pseudo-colored as green) was observed. Rare branching events were seen at late time point (7 min), highlighted with a white arrow. 0 s marks the time extract exchange in the reaction chamber. Scale bar, 10 μm. The experiment was repeated thrice with independent extract preparations. See also Figure 4—figure supplement 1. (D-E) Endogenous TPX2 was replaced with 20–30 nM recombinant GFP-TPX2 in Xenopus egg extracts. Branched MT networks were generated with 10 μM RanQ69L, and time-lapse of TPX2 on the networks was recorded. MTs were labeled with Cy5-tubulin (red), their plus-ends with EB1 (green), and TPX2 is displayed in cyan. 0 s marks the start of the reaction. Scale bar, 10 μm. Arrows denote the plus-ends, while asterisks show TPX2’s deposition on older lattice regions near the minus-ends and no binding to newly formed plus-ends. The experiment was repeated thrice with independent egg extract preparations. TPX2’s intensity was measured over time on individual pixels (highlighted with a yellow line) corresponding to de novo MT before the first branching event occurred, normalized by single TPX2’s fluorescence and converted into number TPX2 molecules. A representative trace is shown in (E), which was fit to a straight line (red). The slope was calculated to obtain the binding rate of TPX2 as 0.4 ± 0.2 (mean ± s.d.) molecules μm−1 s−1 (n = 32 traces). A constant background noise level of 7 molecules was observed, which does not affect the calculated binding rate. The experiment was repeated thrice with independent extract preparations. See also Figure 4—figure supplement 2.
Figure 4—figure supplement 1

Control immunodepletion reactions and measurement of length of initial branched microtubules.
(A) Augmin, TPX2 or γ-TuRC were immunodepleted from Xenopus egg extracts, and western blot analysis against TPX2, γ-tubulin or HAUS1 (augmin subunit) was performed to verify depletion. Branching MT nucleation assay was performed by addition of 10 μM RanQ69L. Representative images at 12 min of the reaction show loss of branching MT nucleation upon augmin or TPX2 immunodepletion, and severe reduction in overall level of nucleation upon γ-TuRC immunodepletion. Low level of γ-TuRCs remain in egg extracts upon immunodepletion with anti-XenC antibody, resulting in rare MTs shown in inset. Scale bar, 10 μm. This analysis was repeated twice with independent egg extract preparations, and the same extracts were used for experiments shown in Figure 4A–C. (B) De novo MTs (blue) were generated by performing branching reaction in Xenopus egg extracts where no augmin is present. Non MT-bound, soluble proteins were removed with buffer wash. The reaction was observed while exchanging the solution to egg extracts containing augmin but no TPX2 at time t = 0 s. Branched MTs (red, denoted with white arrows) and their plus-ends labelled with EB1-mCherry (pseudo-colored as green), nucleated within 10–30 s from de novo MTs (blue) MT, and roughly at the same time as the elongating plus-end (yellow arrows). Scale bar, 10 μm. The experiment was repeated twice with independent egg extract preparations.
Figure 4—figure supplement 2
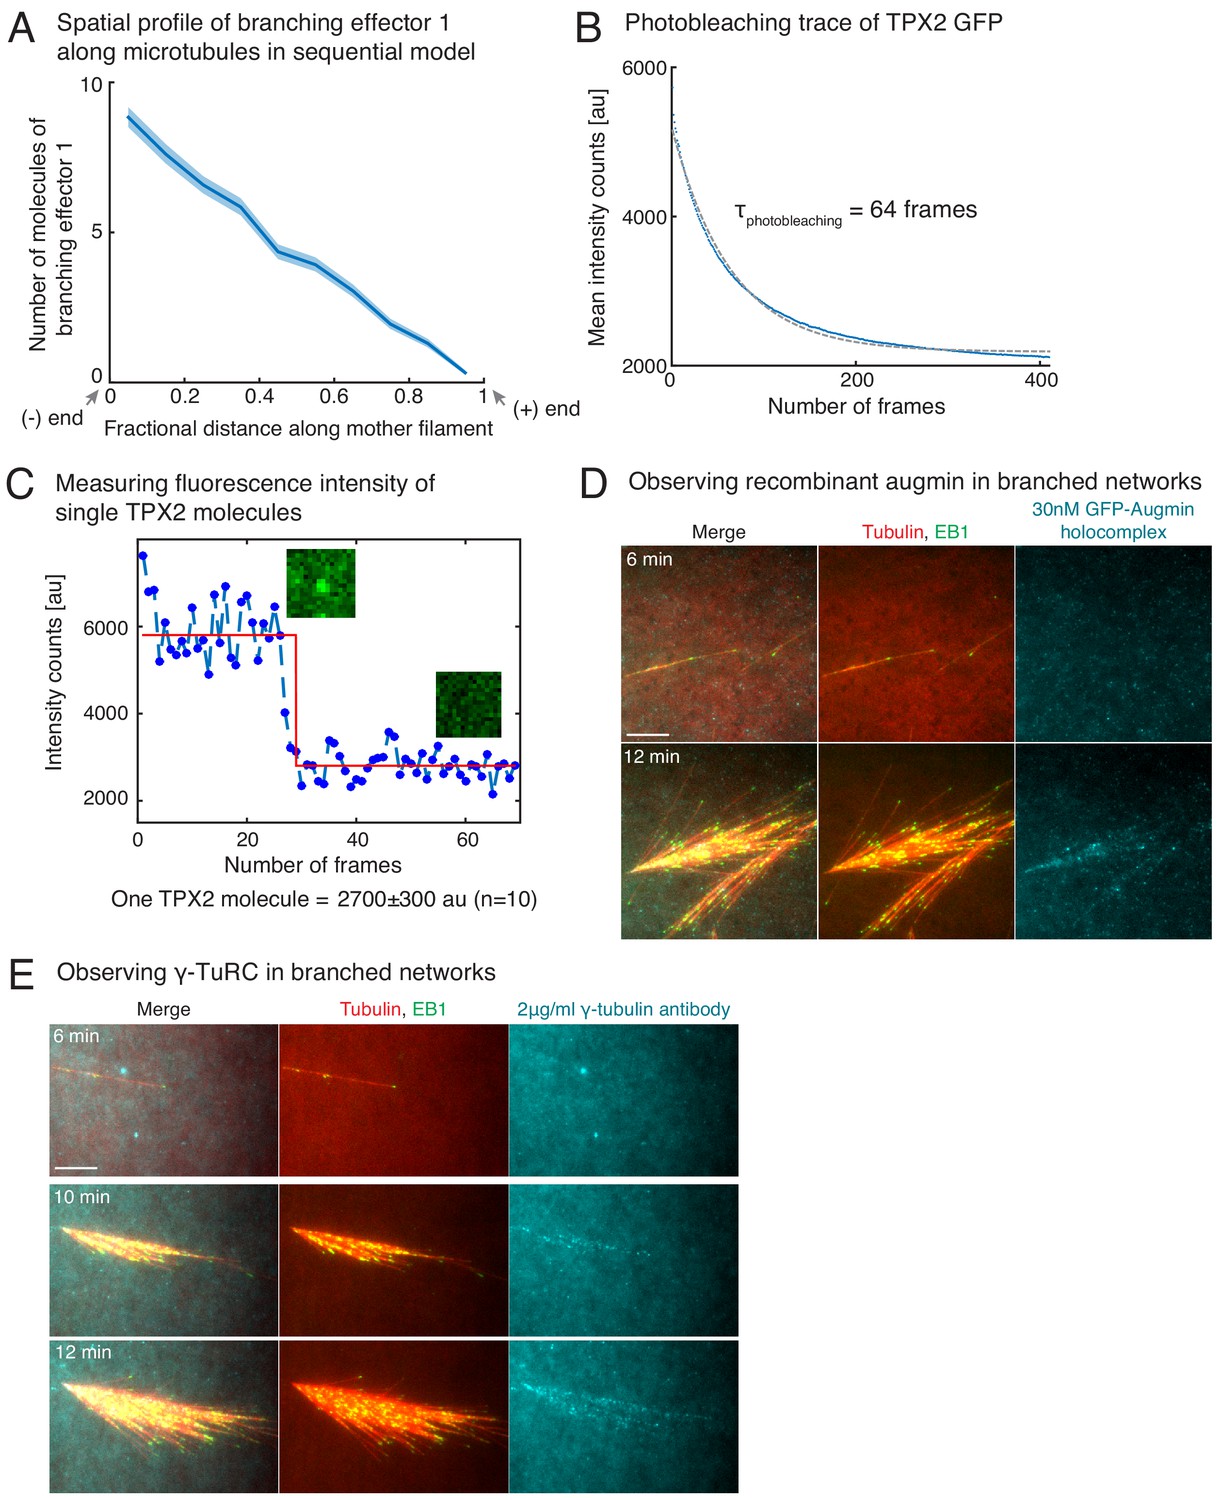
Controls for TPX2’s binding rate measurement, and visualization of augmin/γ-TuRC on branched networks.
(A) Distribution of branching effector1 in sequential model was measured along the length of mother MT at 100 s. The number of molecules is plotted after rescaling the length of mother MT to 1 (n = 250 measurements). Shaded regions depict the 95% bootstrap confidence interval. (B–C) Fluorescence photobleaching of GFP-TPX2 was performed by attaching TPX2 to untreated glass coverslips. Mean fluorescence in the field of view was plotted over time in (B) and exponential decay curve was fit to obtain the photobleaching time as 64 frames. Because this time scale is significantly longer than the number of frames used to obtain TPX2’s binding rate from intensity versus time traces in Figure 4E, the effect of fluorescence photobleaching was ignored. Photobleaching step of individual TPX2 molecules was observed to obtain the fluorescence count of a single TPX2 molecule at its center pixel. A representative trace is shown in (C, blue circles), and data was fit to Heaviside function (red curve) using MATLAB curve-fit. Fluorescence of single TPX2 molecule was measured as 2700 ± 300 au (n = 10 traces). (D–E) Observation of augmin and γ-TuRC during branched network formation. Recombinant GFP-augmin holocomplex was added at 30 nM to Xenopus egg extracts. Branched MT networks were generated with 10 μM RanQ69L, and time-lapse of augmin on the networks was recorded in (D). MTs are labeled with Cy5-tubulin (red), their plus-ends with EB1 (green), and augmin is displayed in cyan. 0 s marks the start of the reaction. Alexa-647 labelled XenC antibody against γ-TuRC was added to Xenopus egg extracts at 2 μg/ml in (E). Branched MT networks were generated with 10 μM RanQ69L, and time-lapse of γ-TuRC on the networks was recorded. MTs are labeled with Alexa-488 tubulin (pseudo-colored as red), their plus-ends with EB1 (green), and augmin is γ-TuRC in cyan. 0 s marks the start of the reaction. Both augmin and γ-TuRC are not visible on individual MTs, but appear later as more MTs nucleate in the branched networks. Scale bars, 10 μm. The experiments were repeated thrice with independent egg extract preparations.
Videos
Video 1
Assembly of branched microtubule networks in Xenopus egg extracts.
Branched microtubule (MT) networks were generated in Xenopus egg extracts with 10 μM RanQ69L, and time-lapse is displayed for one representative branched network. MTs are labeled with Cy5-tubulin (red) and their plus-ends with EB1-mCherry (pseudo-colored as green). Sodium orthovanadate was added to prevent motor-mediated MT gliding. Time-point 0 s represents the estimated nucleation time of first mother MT. Scale bar, 10 μm.
Video 2
Tracking of microtubules in branched networks.
MTs in branched networks were tracked. Branched networks (‘raw data’) were imaged in Xenopus egg extracts with fluorescently-labeled plus-tip protein EB1-mCherry (green, displayed as ‘EB1 channel’) and Cy5-labeled tubulin (‘tubulin channel’). EB1 comets were pre-processed using temporal median filter (‘filtered EB1 channel’) and tracked using comet detection and plus-tip tracking modules of uTrack (‘EB1 tracking’). Tubulin intensity was pre-processed as described in Figure 1—figure supplement 1 (‘processed tubulin channel’) and used to close the gaps in EB1 tracks using greedy optimization algorithm to obtain complete MT trajectories in the branched network (‘final tracks’). Scale bar, 10 μm. The tracking procedure is described in Figure 1—figure supplement 1 and Materials and methods section. MATLAB software for tracking is provided in Supplementary file 1 .
Video 3
Simulation of single-step reaction model.
Three stochastic simulations of branched networks using the single-step model are displayed with parameters specified in Figure 1—figure supplement 3A. Individual MTs are labelled with a rotating color scheme. Scale bar, 10 μm.
Video 4
Simulation of the sequential reaction model.
Three stochastic simulations of branched networks using sequential model are displayed with parameters specified in Figure 1—figure supplement 3A. Individual MTs are labelled with a rotating color scheme. Note that new branched MTs nucleate preferentially from older MT lattice near the network origin. Scale bar, 10 μm.
Video 5
Branched microtubule networks generated with varying augmin and TPX2 concentrations.
Branched MT networks were generated in Xenopus egg extracts with 10 μM RanQ69L for four conditions: buffer addition or control depletion, addition of 260 nM TPX2, partial depletion of TPX2 (20% of control), or partial depletion of augmin (20% of control). MTs are labeled with Cy5-tubulin (red) and their plus-ends with EB1-mCherry (pseudo-colored as green). Scale bars, 10 μm. Representative movies are displayed, where time-point 0 s represents the start of the reaction.
Video 6
Sequence of TPX2 and augmin in branching microtubule nucleation by two-color solution exchange experiments.
Left movie: De novo MTs (blue) were generated in Xenopus egg extracts containing TPX2 but no augmin first, followed by exchange to Xenopus egg extracts containing augmin but no TPX2. Branched MTs labeled with Cy5-tubulin (red) and their plus-ends with EB1-mCherry (pseudo-colored as green) nucleate immediately from initial de novo MTs (blue) formed without augmin. Right movie: De novo MTs (blue) were generated in Xenopus egg extracts containing augmin but no TPX2 first, followed by exchange to Xenopus egg extracts containing TPX2 but no augmin. No branched MTs were observed, and only elongation of plus-ends labeled with Cy5-tubulin (red) and their plus-ends with EB1-mCherry (pseudo-colored as green) was seen. Reaction was performed 10 μM RanQ69L. Representative movies are displayed, where 0 s represents the time of solution exchange. Scale bars, 10 μm.
Video 7
Sequence of γ-TuRC, TPX2 and augmin in branching microtubule nucleation by two-color solution exchange experiments.
De novo MTs (blue) were generated in Xenopus egg extracts containing TPX2 and γ-TuRC but no augmin first, followed by exchange to Xenopus egg extracts containing TPX2 and augmin but no γ-TuRC. No branched MTs were observed, and only elongation of plus-ends labeled with Cy5-tubulin (red) and their plus-ends with EB1-mCherry (pseudo-colored as green) was seen. Reaction was performed 10 μM RanQ69L. Representative movies are displayed, where 0 s represents the time of solution exchange. Scale bars, 10 μm.
Video 8
Binding of TPX2 to branched microtubule networks in Xenopus egg extracts.
Endogenous TPX2 was immunodepleted from Xenopus egg extracts and replaced with 20–30 nM recombinant GFP-TPX2. Branched MT networks were generated 10 μM RanQ69L, and TPX2’s association with MTs was observed over time (cyan). MTs are labeled with Cy5-tubulin (red) and their plus-ends with EB1-mCherry (pseudo-colored as green). TPX2 signal was observed on older MT lattice near the minus-ends, and not on the newly formed lattice near the plus-ends. Representative movie is displayed, where time 0 s represents the start of the reaction. Scale bar, 10 μm.
Additional files
-
Supplementary file 1
MATLAB-based image analysis and simulation software.
- https://doi.org/10.7554/eLife.43890.023
-
Transparent reporting form
- https://doi.org/10.7554/eLife.43890.024
Download links
A two-part list of links to download the article, or parts of the article, in various formats.
Downloads (link to download the article as PDF)
Open citations (links to open the citations from this article in various online reference manager services)
Cite this article (links to download the citations from this article in formats compatible with various reference manager tools)
Spatiotemporal organization of branched microtubule networks
eLife 8:e43890.
https://doi.org/10.7554/eLife.43890


