Decoupling sensory from decisional choice biases in perceptual decision making
- Institut d’Investigacions Biomediques August Pi i Sunyer (IDIBAPS), Spain
- Centre d’Économie de la Sorbonne (CNRS & Université Paris 1 Panthéon-Sorbonne), France
- Universitat de Barcelona, Spain
Figures
Figure 1 with 2 supplements
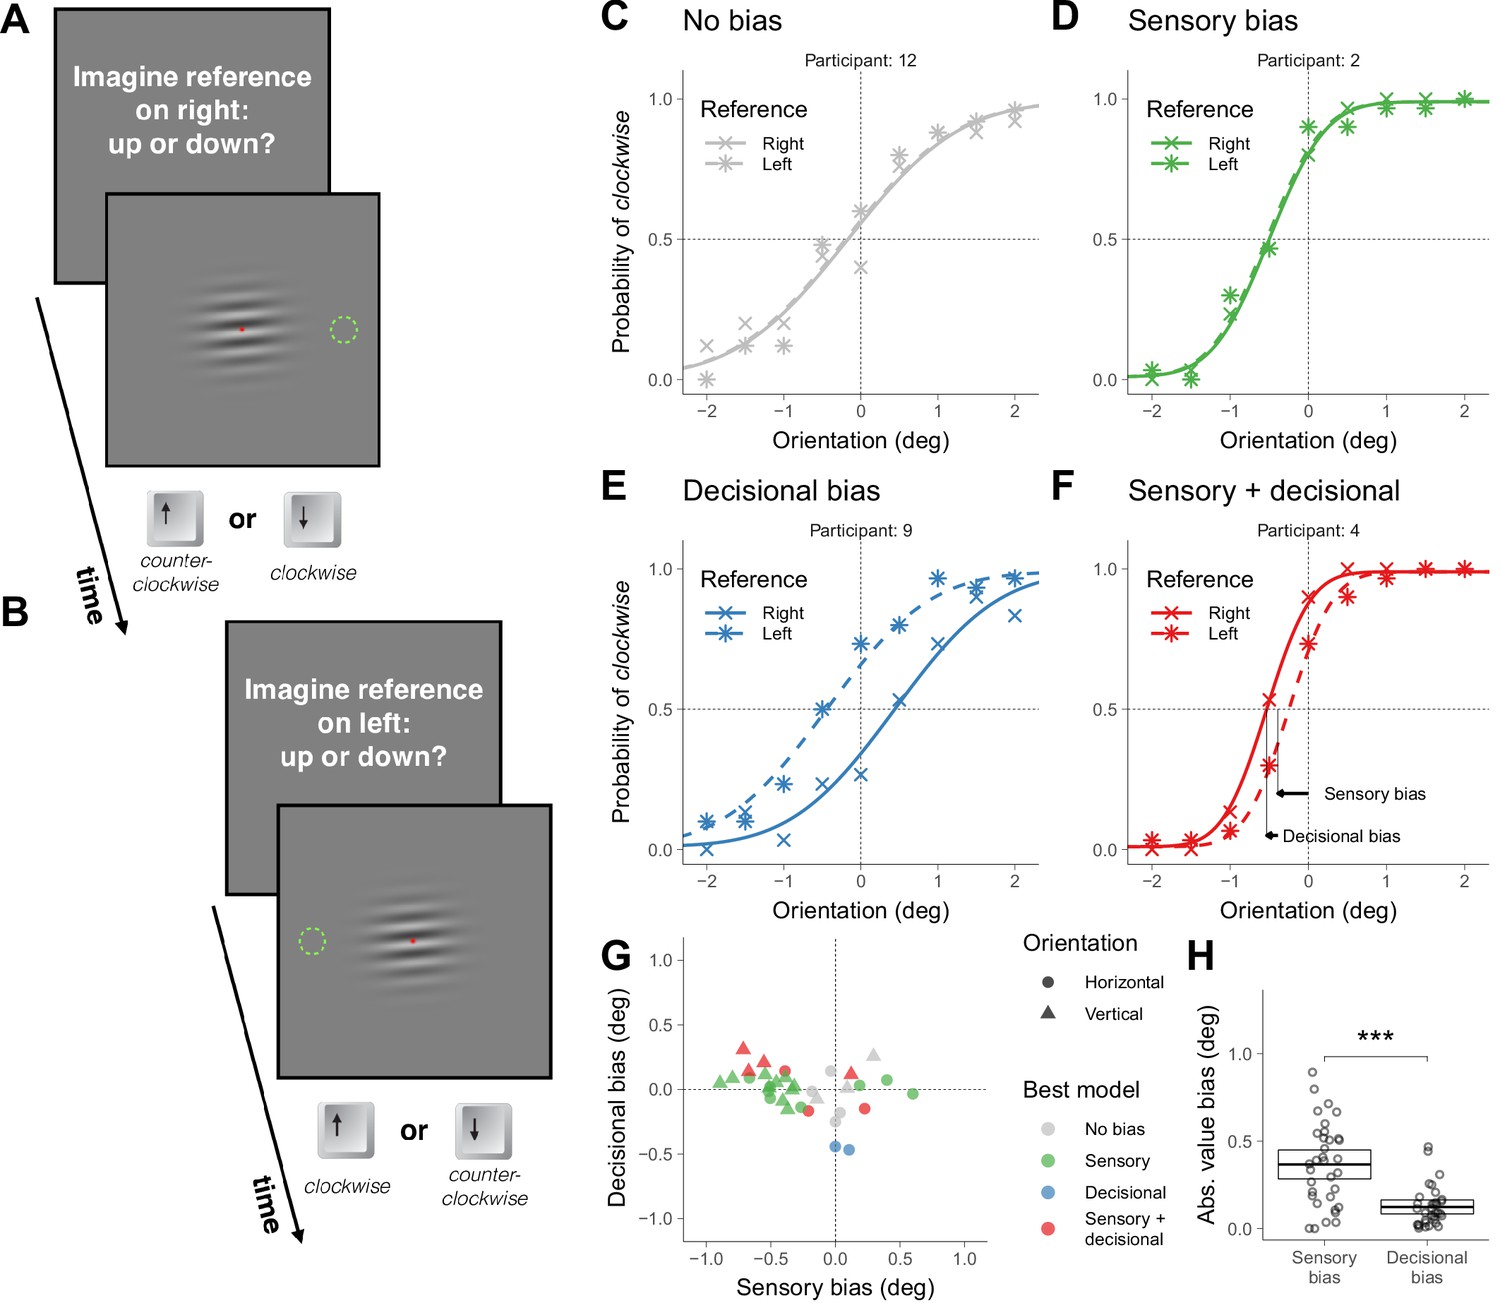
Symmetric task in Experiment 1.
(A) Illustration of a trial in which the participant was asked to imagine a reference on the right (the green dotted circumference was not displayed during the experiment; in Materials and methods we described the exact message displayed on the screen). (B) Illustration of a trial in which the participant was asked to imagine a reference on the left. (C–F) Choice behavior for four representative participants. (G) Decisional and sensory biases. For each participant, the circles correspond to the gratings presented around the horizontal orientation (Figure 1A–B) and the triangles to the gratings presented around the vertical orientation (illustrations of the stimuli not shown). The color indicates the best model assessed using likelihood ratio tests (see Materials and methods). (H) Across participants, the absolute value of the sensory and the decisional biases was significantly different (t(33) = 4.8, p=3.1×10⁻⁵). The crossbars display the mean and the 95% t-test confidence intervals.
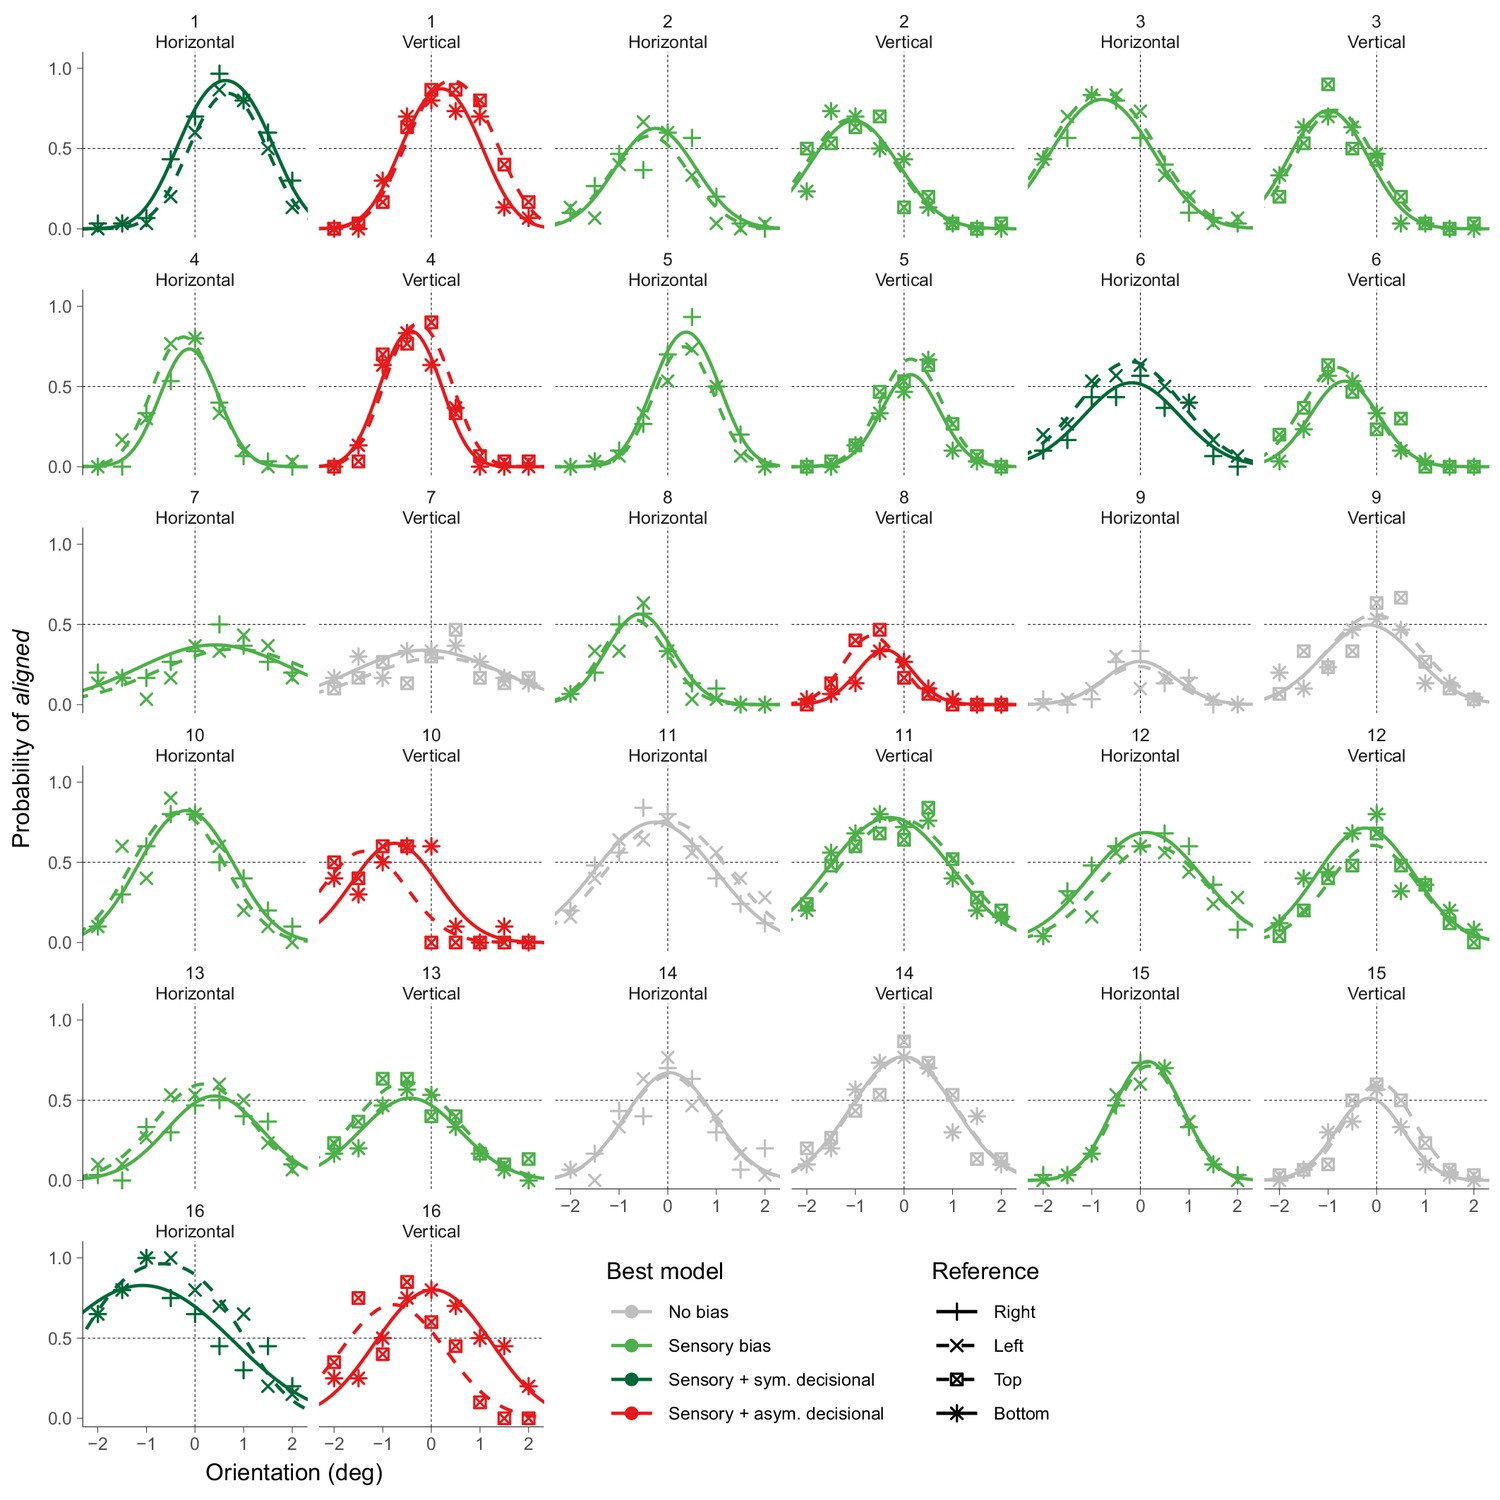
Figure 1—figure supplement 1
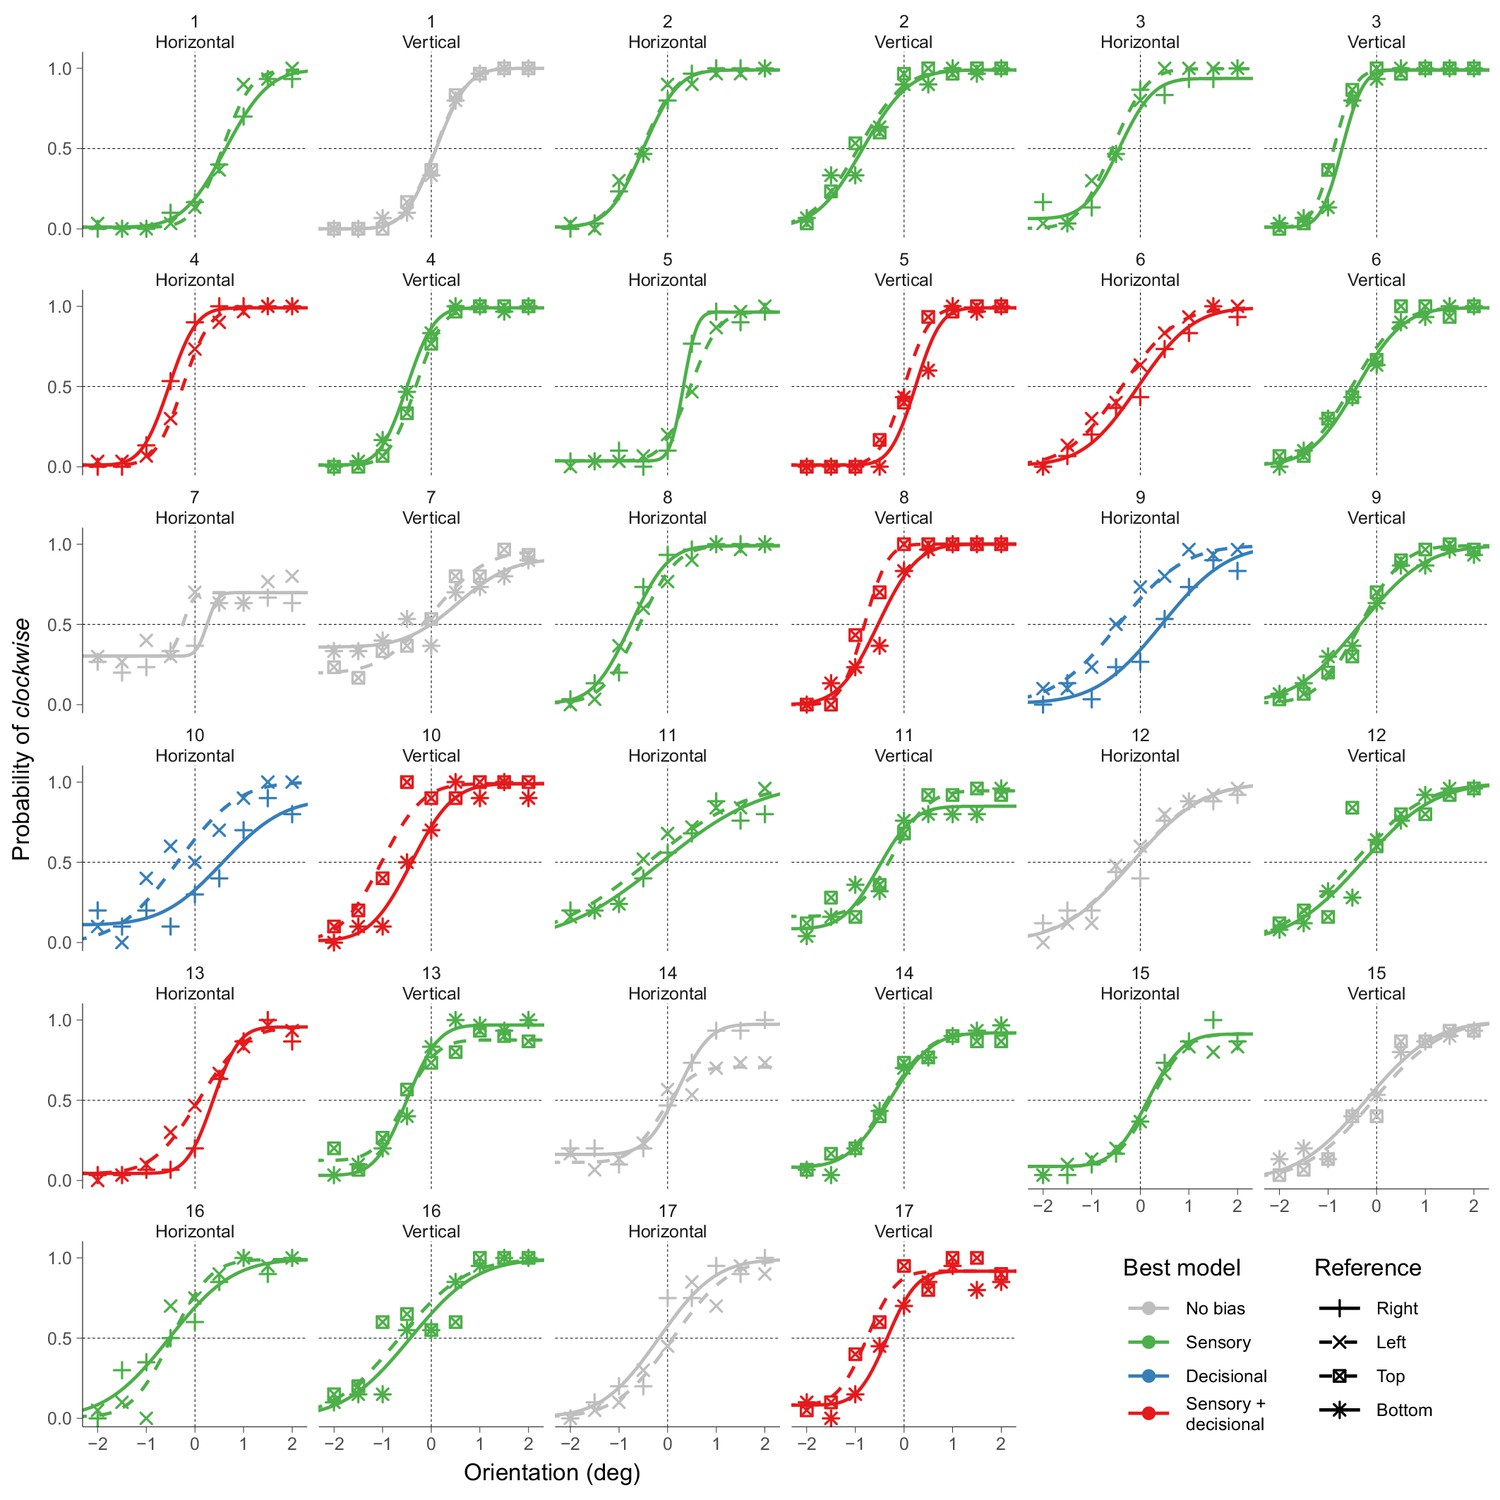
Choice behavior in the symmetric task for all participants in Experiment 1.
https://doi.org/10.7554/eLife.43994.004
Figure 1—figure supplement 2
Choice behavior in the symmetric task for all participants in Experiment 1.
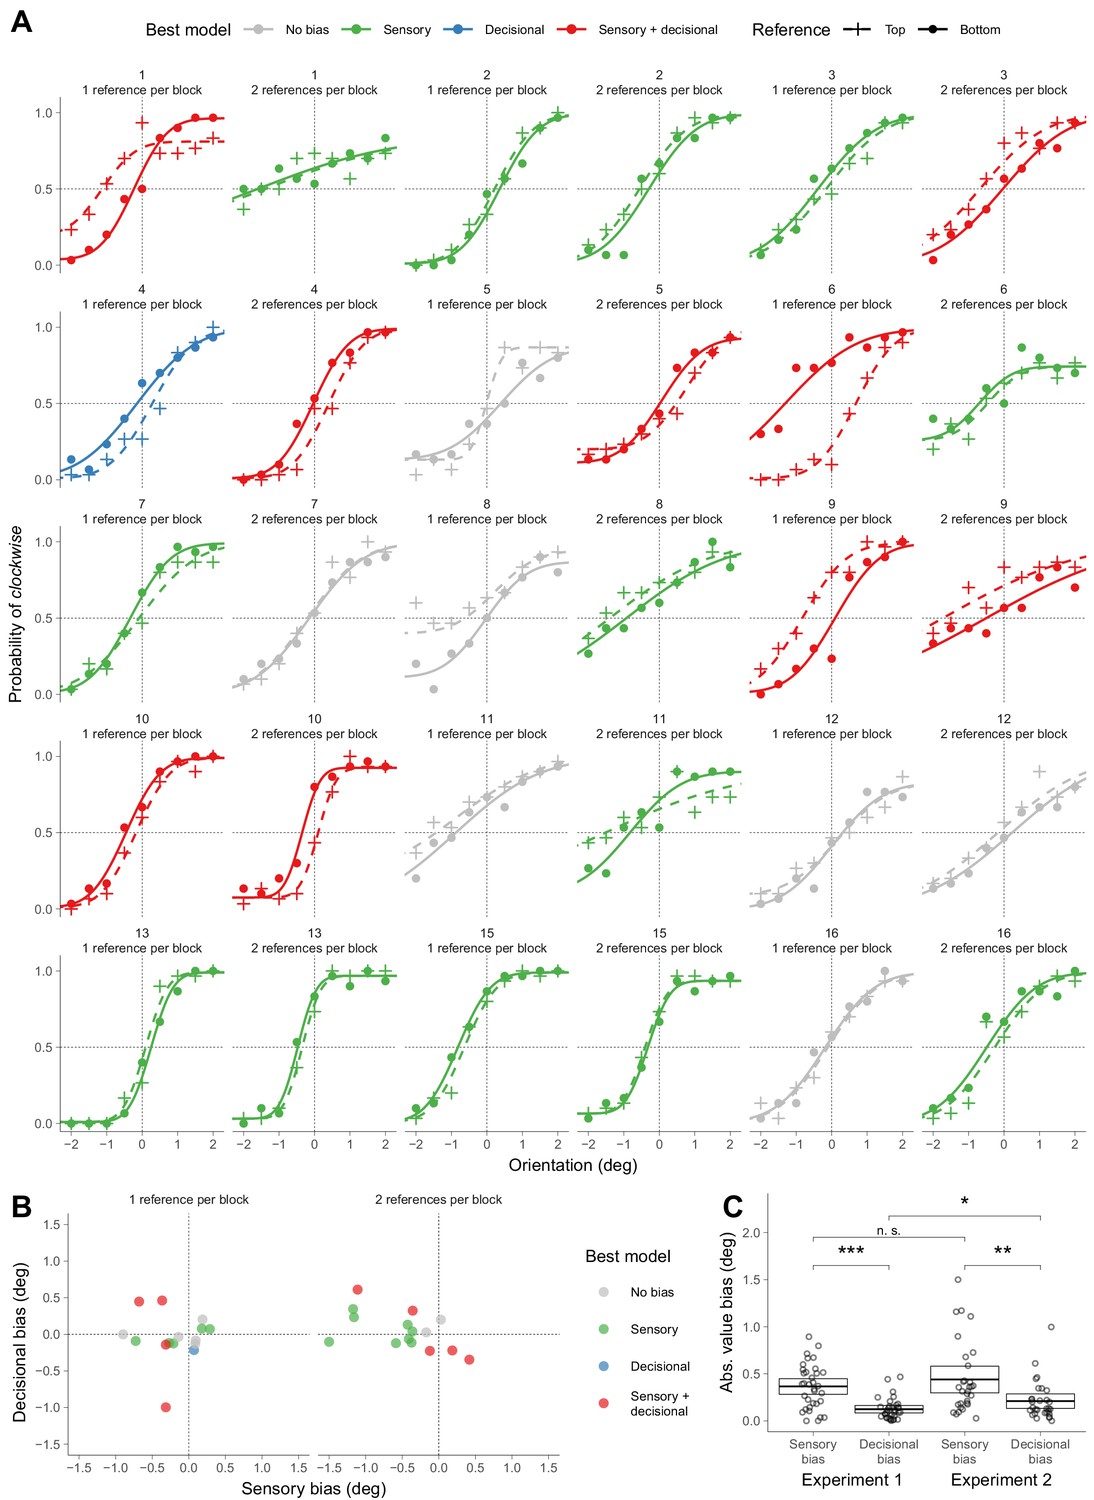
(A) Choice behavior for the one reference per block and two references per block conditions for all participants in Experiment 2. (B) Decisional and sensory biases for each participant. The color indicates the best model. (C) Across the participants of Experiment 2, a two-way repeated measures ANOVA for the absolute value of the biases indicated no significant effect of number of references per block (one reference per block or two references per block; (F(1,14) = 3.7; p=0.073), a significant effect of the type of biases (sensory or decisional; F(1,14) = 8.7; p=0.010) and no significant interaction (F(1,14) = 3.6; p=0.078). The graph shows the biases from Experiment 1 (also shown in Figure 1H) and Experiment 2 (collapsed across number of references per block). The crossbars display the mean and the 95% t-test confidence intervals. For Experiment 2, the sensory and the decisional biases is significantly different (t(29) = 3.13, p=0.0040). Across experiments, the sensory biases is not significantly different (t(47) = 0.92, p=0.3619), but the decisional biases is significantly different (t(44) = 2.0, p=0.048).
Figure 2 with 1 supplement
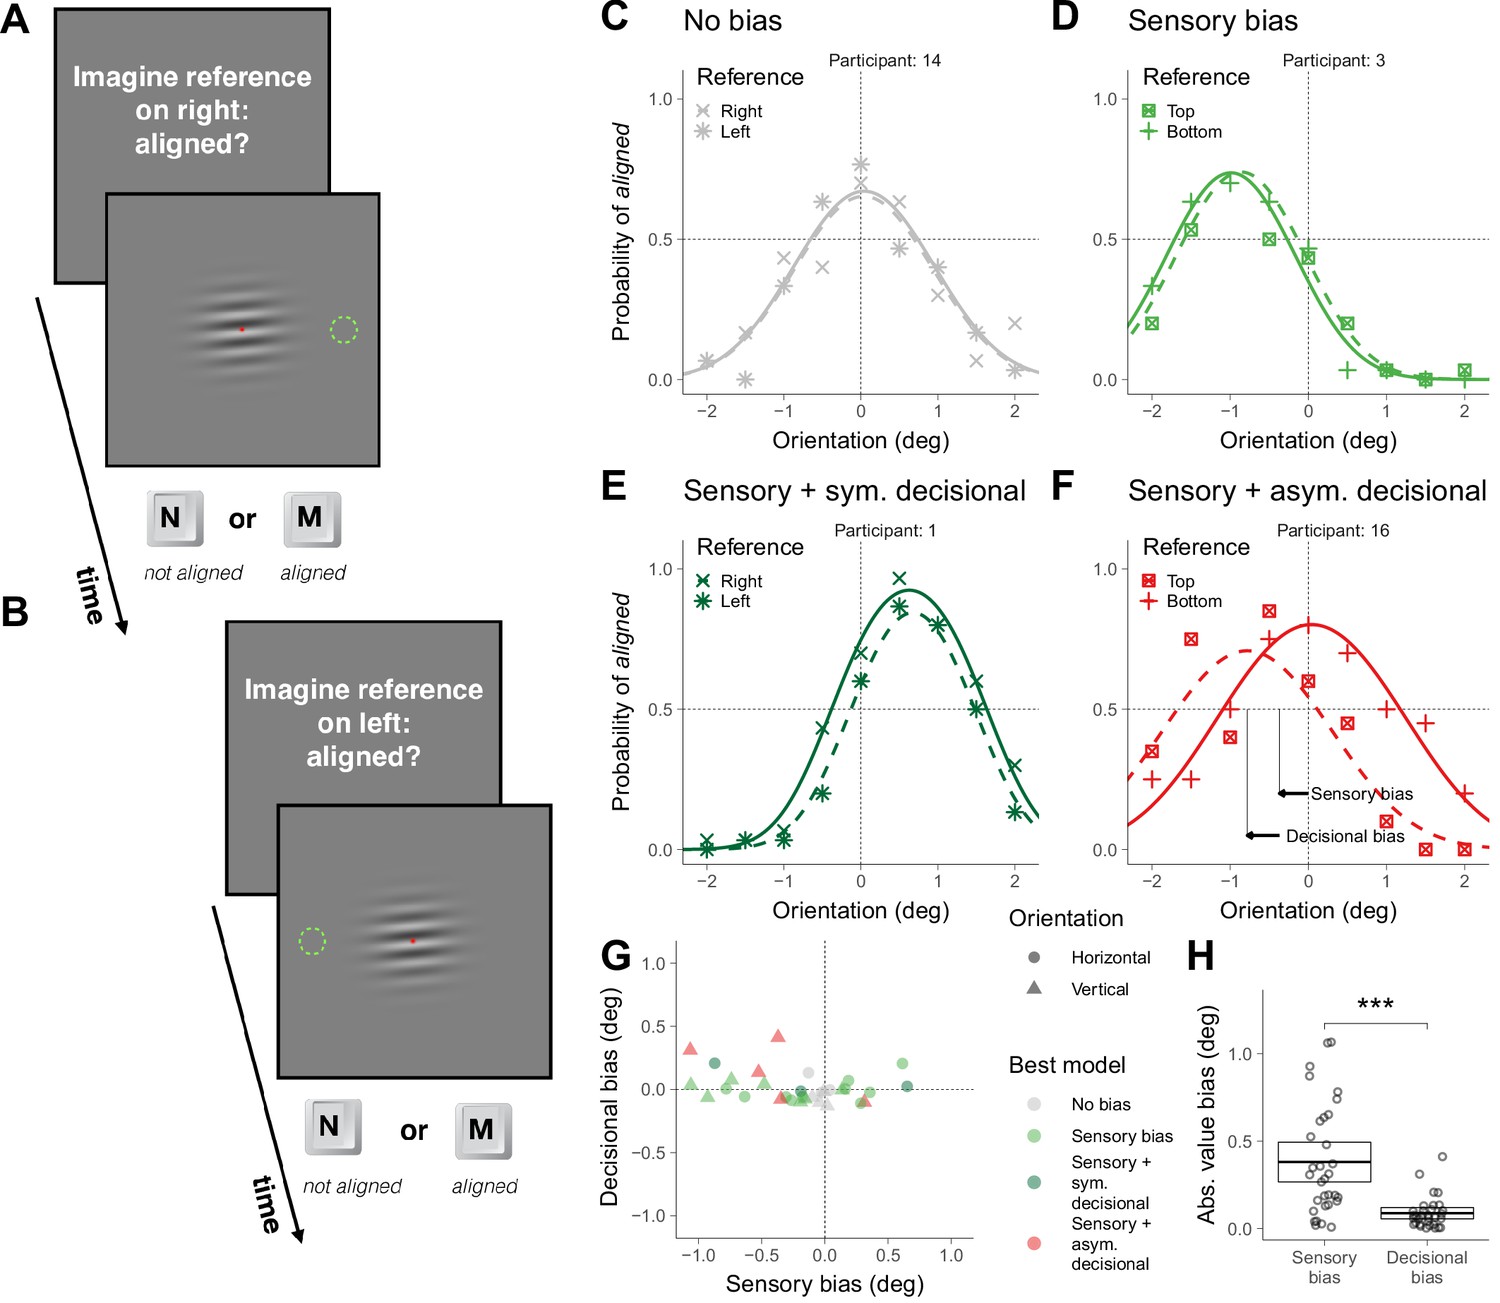
Asymmetric task in Experiment 1.
(A) Illustration of a trial in which the participant was asked to imagine a reference on the right. (B) Illustration of a trial in which the participant was asked to imagine a reference on the left. (C–F) Choice behavior for four representative participants. (G) Decisional and sensory biases. (H) Across participants, the absolute value of the sensory and the decisional biases was significantly different (t(31) = 5.4, p=6.0×10⁻⁶). The crossbars display the mean and the 95% t-test confidence intervals.
Figure 2—figure supplement 1
Choice behavior in the asymmetric task for all participants in Experiment 1.
https://doi.org/10.7554/eLife.43994.007
Figure 3

Sensory biases across tasks and orientations.
(A) Across participants, the sensory biases estimated from the symmetric task correlated with the sensory biases estimated from the asymmetric task (r(30) = 0.81, p=2.7×10⁻⁸). The color of the triangles indicates the model that best fit the data. The black line corresponds to a simple linear regression fit. To compare the symmetric and the asymmetric task with the counterparts in the temporal domain (see final paragraph of the Discussion), we also calculated the correlation of the biases across tasks using only one reference for each pair of coupled references (bottom or left; r(30) = 0.77, p=2.3×10⁻⁷). In this case, we estimated the bias for the symmetric task as the orientation for which the probability of clockwise responses was 50% and for the asymmetric task as the orientation for which the probability was maximum. (B) Across participants, the sensory biases estimated using the horizontal grating correlated with the sensory biases estimated using the vertical grating for the symmetric (r(15) = 0.67, p=0.0030) and the asymmetric task (r(15) = 0.60, p=0.015). The lines correspond to simple linear regression fits.
Additional files
-
Transparent reporting form
- https://doi.org/10.7554/eLife.43994.009
Download links
A two-part list of links to download the article, or parts of the article, in various formats.
Downloads (link to download the article as PDF)
Open citations (links to open the citations from this article in various online reference manager services)
Cite this article (links to download the citations from this article in formats compatible with various reference manager tools)
Decoupling sensory from decisional choice biases in perceptual decision making
eLife 8:e43994.
https://doi.org/10.7554/eLife.43994


