An acquired scaffolding function of the DNAJ-PKAc fusion contributes to oncogenic signaling in fibrolamellar carcinoma
- University of Washington Medical Center, United States
Figures
Figure 1 with 3 supplements
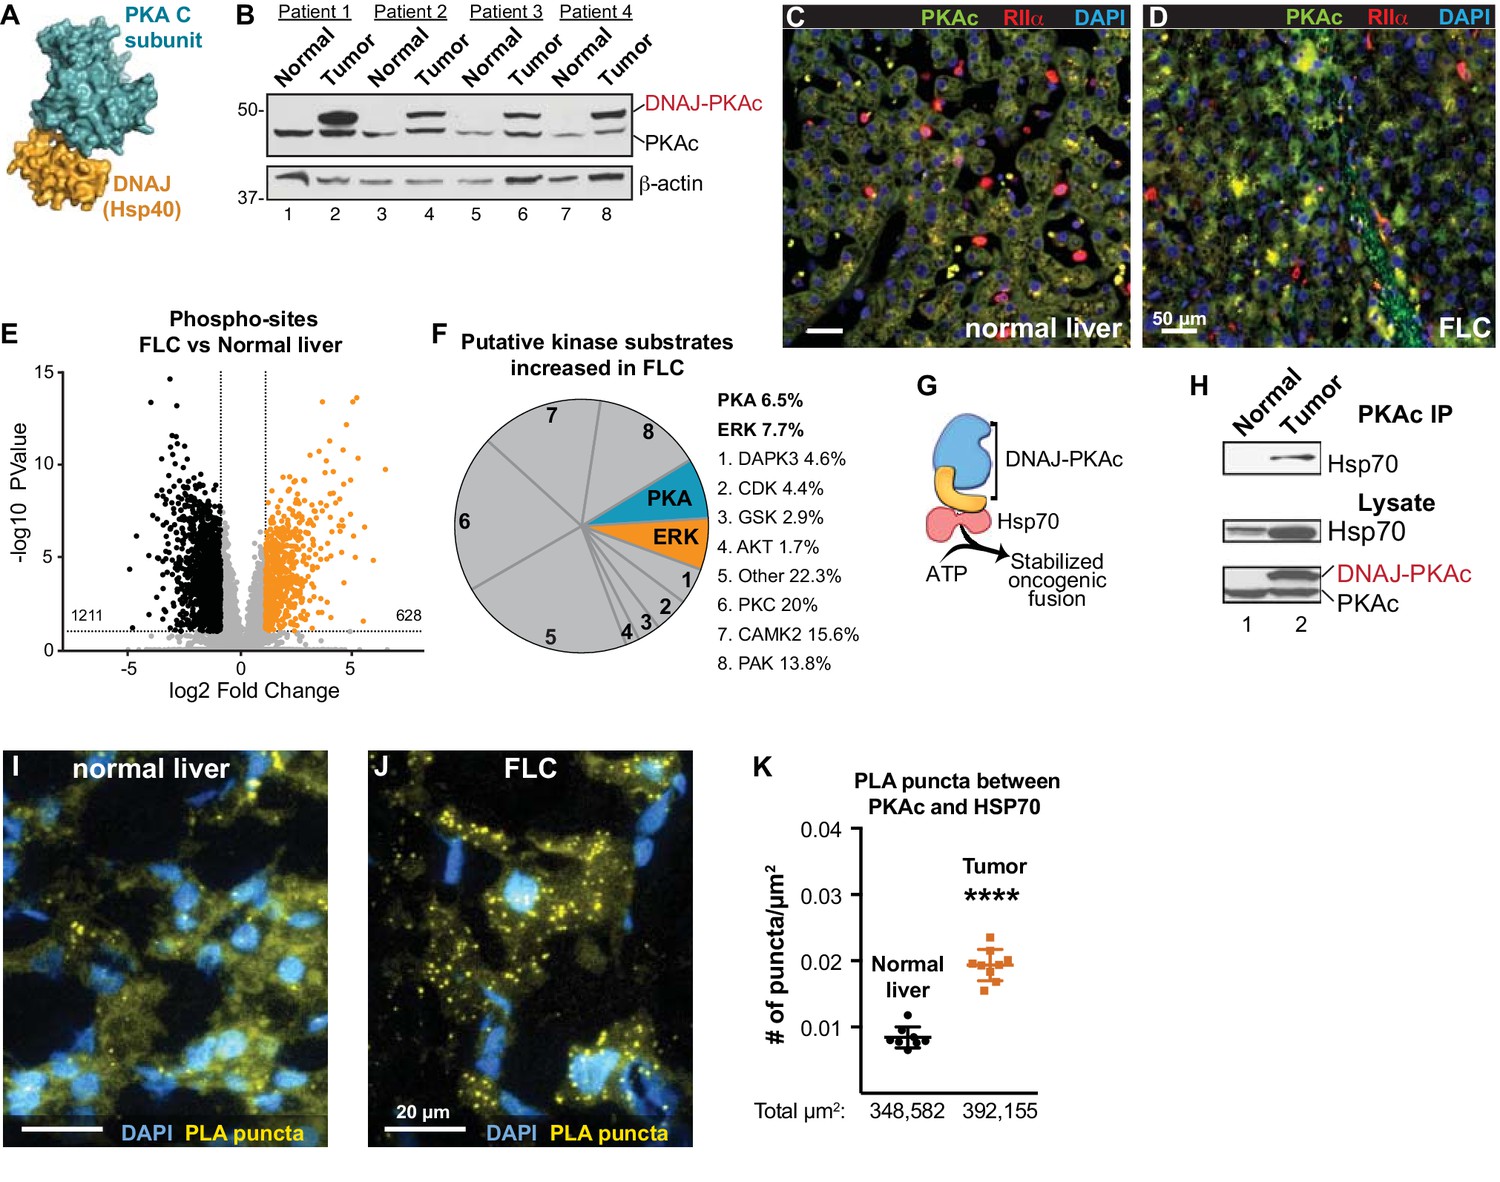
Properties of the DNAJ-PKAc fusion enzyme.
(A) Structure of the DNAJ-PKAc fusion protein (PDB ID 4WB77). The DNAJ (orange) and PKAc domains (blue) are indicated. (B) Immunoblots of paired tumor and normal adjacent liver from FLC patients probed with antibodies to PKAc (top panels) and actin loading controls (bottom panels). DNAJ-PKAc (upper band) migrates with a slower mobility than the native C subunit in SDS-PAGE. (C–D) Immunofluorescence images of normal liver (left, C) and FLC (right, D) stained with antibodies against PKAc (green), RIIα (red) and DAPI (blue). Scale bar represents 50 μm. (E–F) Phosphoproteomic profiling of FLC. Statistical significance was calculated Significant differences in phosphopeptide expression between experiments were quantified with a two-tailed two sample t-test with unequal variances and Benjamini-Hochberg correction for multiple comparisons was applied (FDR ≤ 0.05), log2 ratio >1. (E) Volcano plot showing phosphosites upregulated (orange) and downregulated (black) in FLC as compared to normal adjacent liver. (F) Pie chart of putative kinase substrates (predicted by NetworKIN) increased in FLC. 82.8% of sites identified were in the NetworKIN platform. Percentages of sites ascribed to particular kinase are listed. ‘Other’ kinases include: CK1, TTK, GRK, RSK, MAK, JNK, ROCK, P70S6K, AMPK, CLK, HIPK2, PDHK, ACTR2, ATM, DMPK, IKK, MOK, NEK4, PKD1, PKG, TGFBR2, and p38-MAPK. (G) Schematic of DNAJ-PKAc in complex with heat shock protein 70 (Hsp70, red). (H) Immunoblot detection of Hsp70 in PKAc immune complexes from FLC and normal adjacent liver lysates (top). Loading controls indicate the levels of Hsp70 (middle) and both forms of PKA (bottom). (I–J) Proximity Ligation (PLA) detection of DNAJ-PKAc/Hsp70 complexes in (I) normal liver and J) FLC sections. Yellow puncta identify Hsp70-kinase sub-complexes, DAPI (blue) marks nuclei. Scale bar represents 20 μm. (K) Amalgamated data (PLA puncta/μm2) from eight normal (black) and 9 FLC (orange) sections. Data are shown as mean ±s.d., p<0.0001 by Student’s t-test (t = 10.98, df = 15).
Figure 1—figure supplement 1
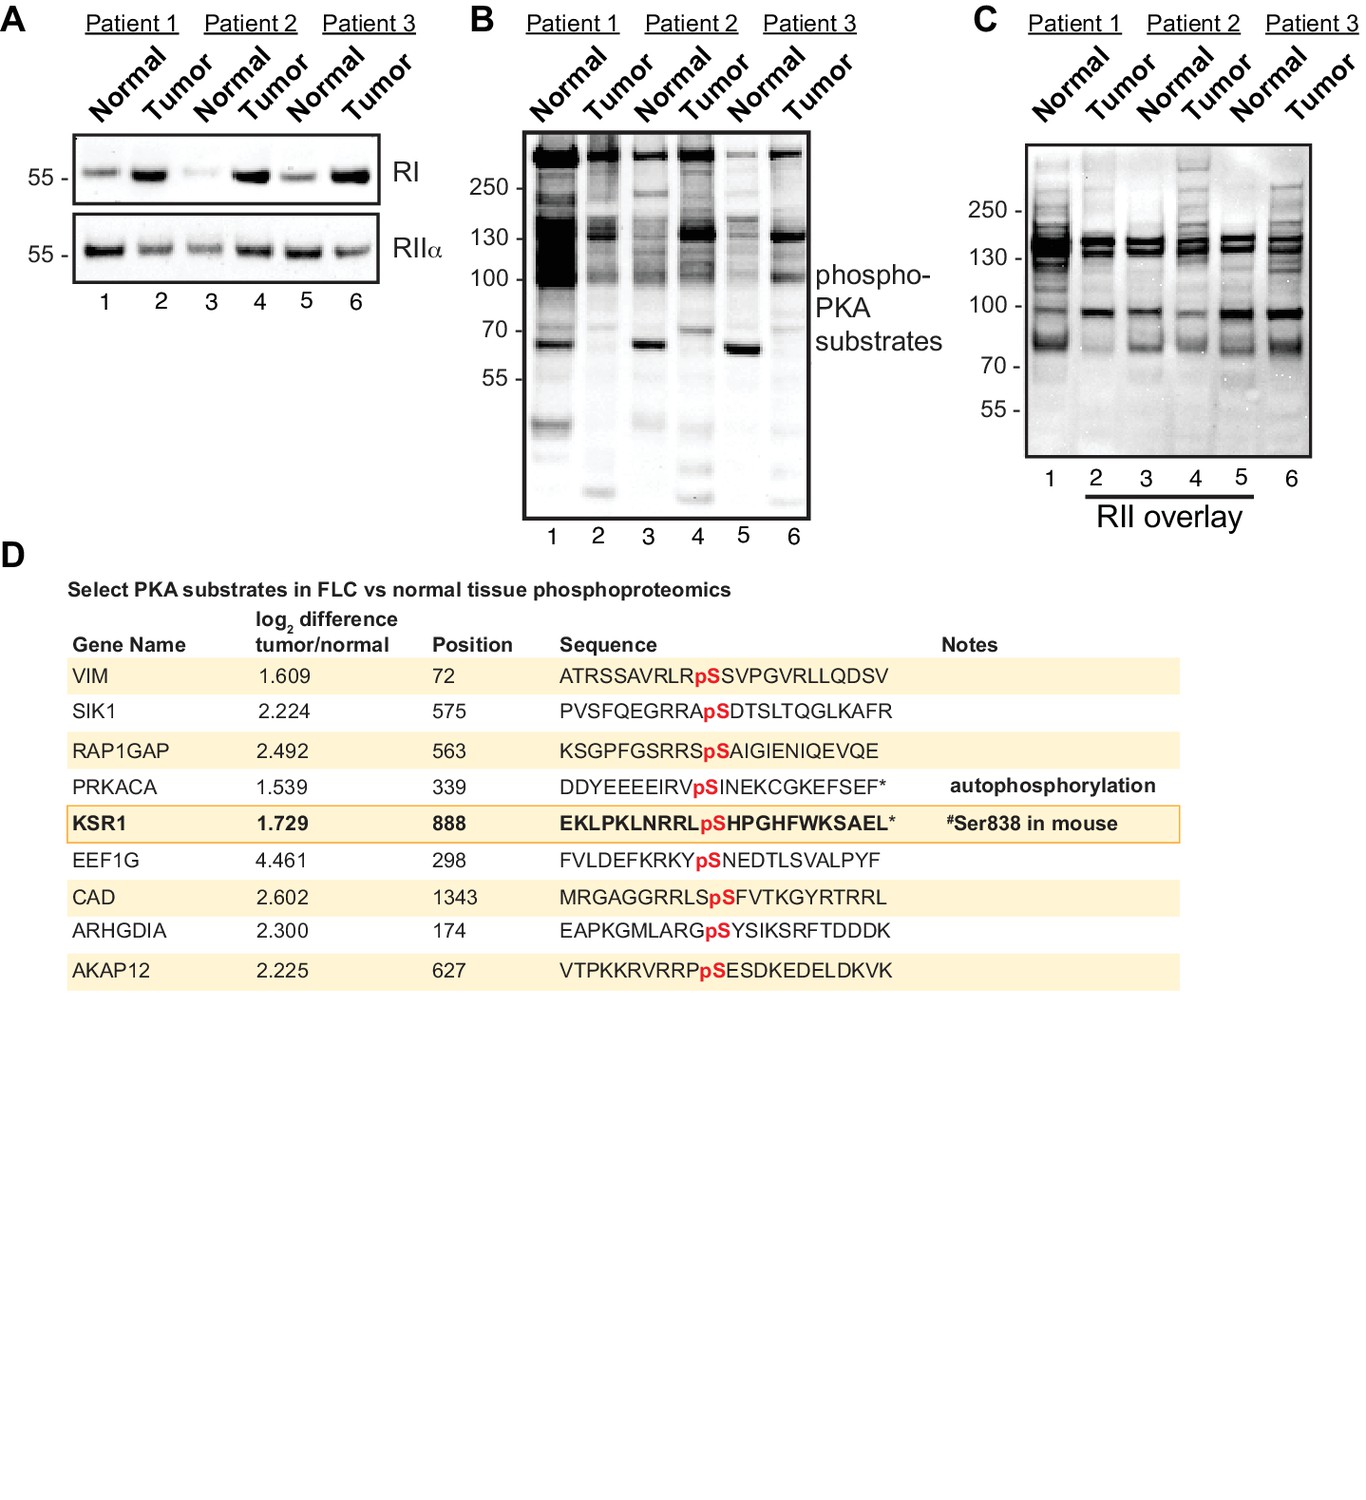
Altered PKA signaling in FLC.
(A) Immunoblots of paired normal adjacent liver and tumor from FLC patients probed with antibodies to RI (top) and RIIα (bottom). (B) Immunoblots of the same samples probed with an antibody recognizing phospho-PKA substrates (R-R-X-pS/pT). (C) RII overlay analysis to detect AKAPs in the same samples (D) List of select PKA substrates elevated in phosphoproteomic analysis of FLCs. Phosphorylated residues (red) and the scaffold protein KSR1(bold) are indicated.
Figure 1—figure supplement 2
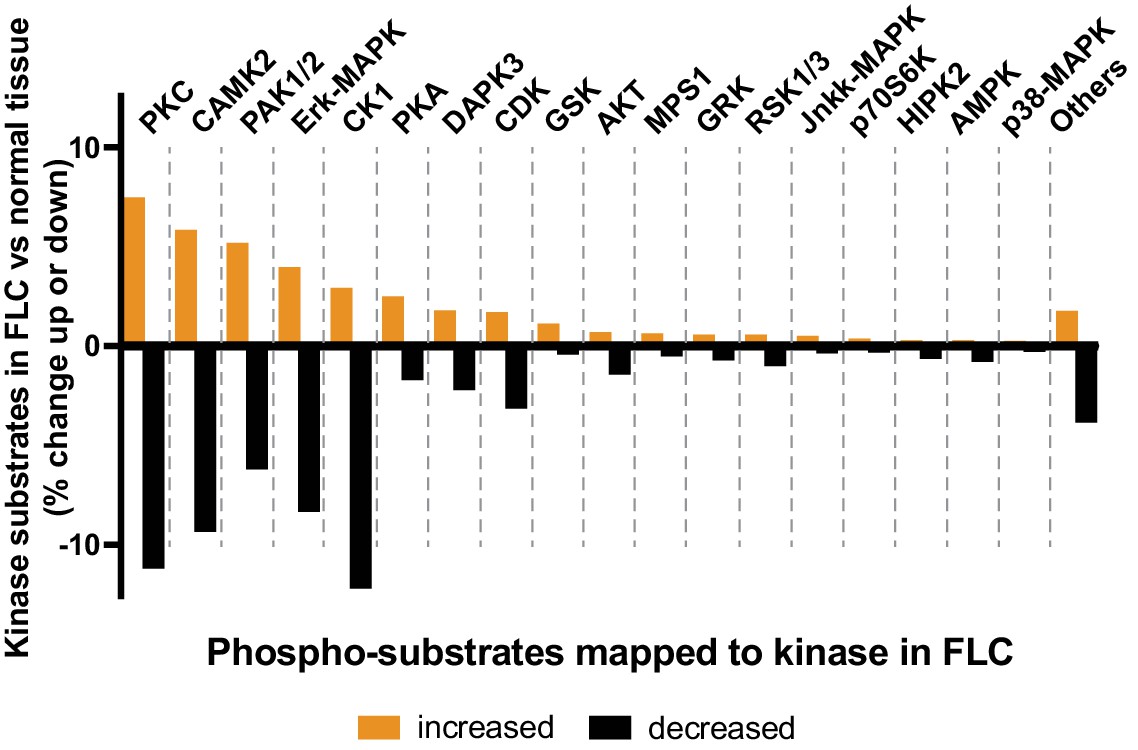
Kinase network rewiring in FLC.
Phospho-substrate analysis of phosphoproteomic data from FLCs showing a spectrum of kinases implicated in covalent modification of heterogeneous tumor tissue. Putative kinase substrates were classified using NetworKIN as described in Figure 1 and Materials adn methods. Bar graph depicts the percent change of kinase substrates elevated (orange) and attenuated (black) in FLC.
Figure 1—figure supplement 3
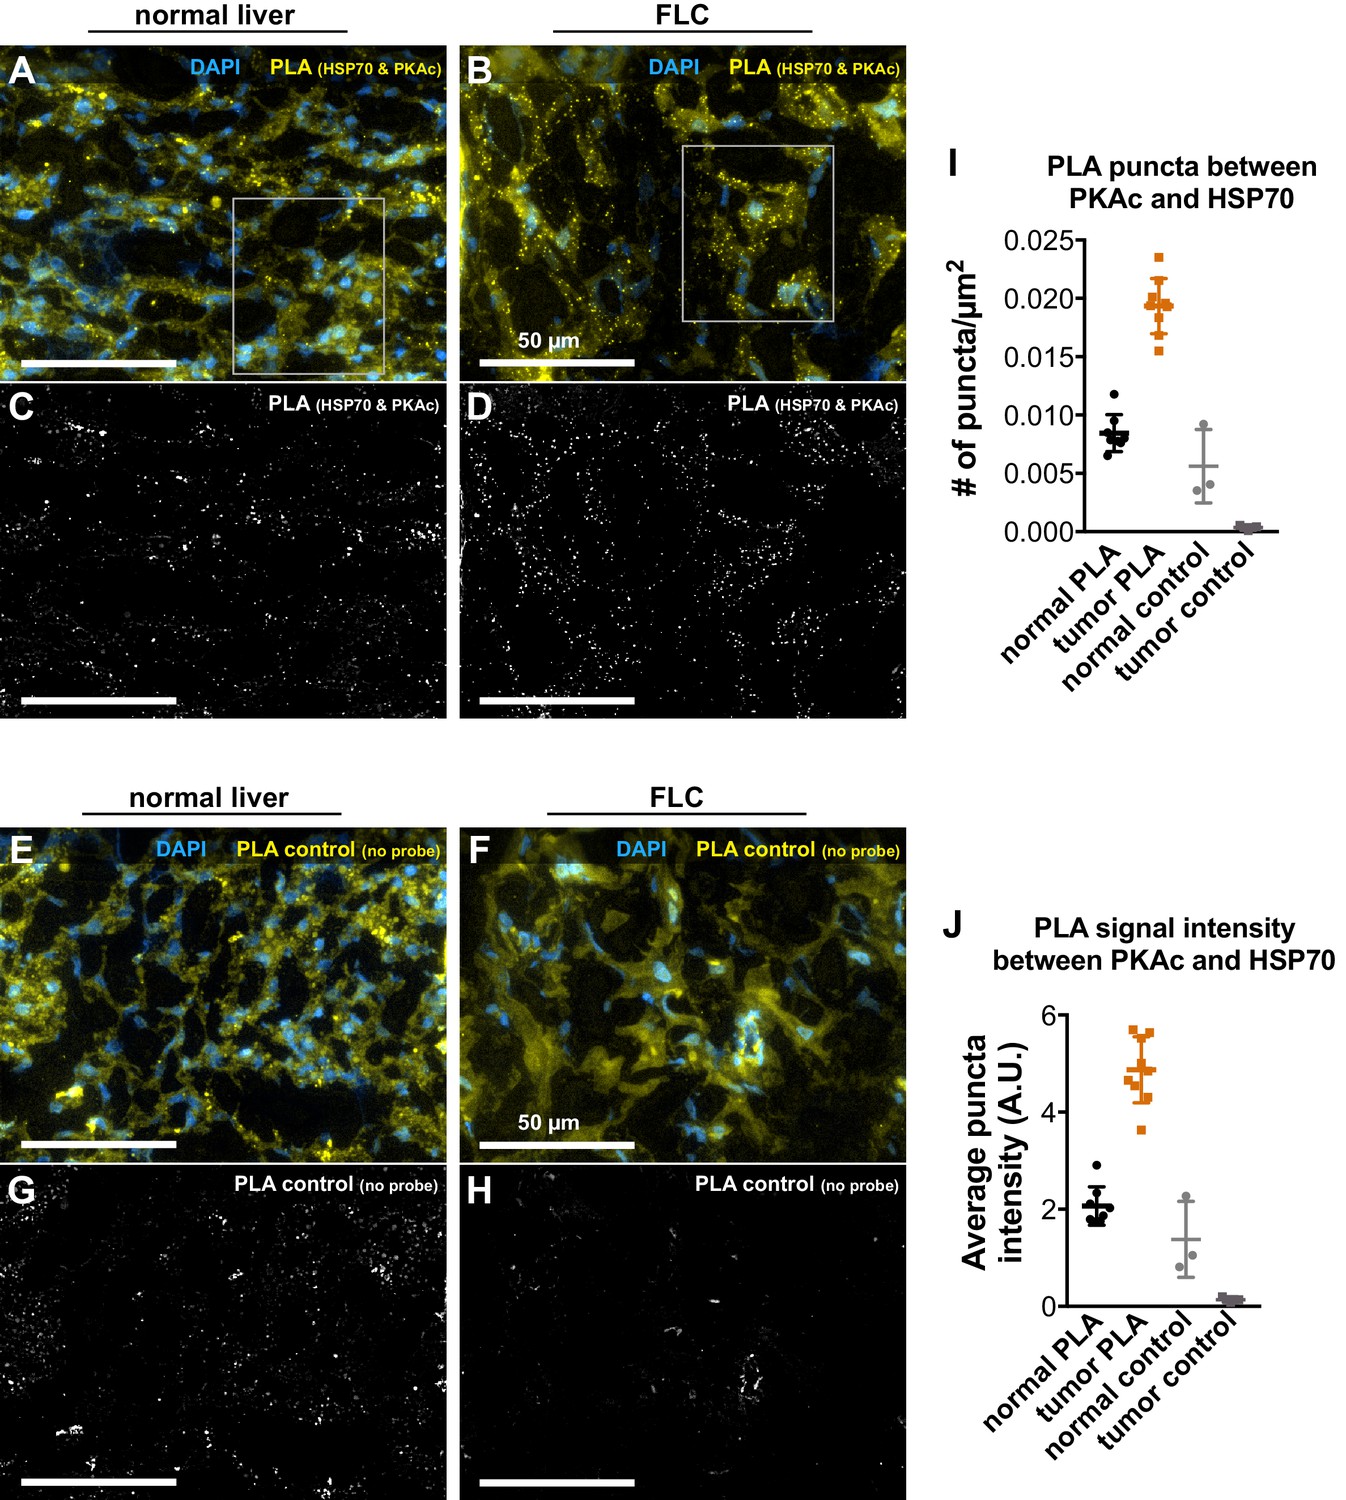
Additional Proximity Ligation (PLA) detection of Hsp70 and PKAc in patient tissue.
(A and B) Full-size source images for Figure 1I & J, gray boxes indicate area shown. PLA signal between Hsp70 and PKAc (yellow) is less prominent in normal tissue (A) than in FLC (B). Dapi (blue) marks nuclei. (C and D) Images of the PLA signals in (A and B) after removing unfocused fluorescent signal with Keyence software haze reduction. (E and F) Control images for normal liver (E) and FLC (F) where PLA cannot occur due to omission of one secondary antibody. (G and H) Yellow channel signals of control normal liver (G) and FLC (H). Note greater background fluorescence in normal liver sections vs. FLC emanating from fat deposits. Scale bars are 50 µm. (I and J) Quantification of number of PLA puncta (I) and average puncta intensity (J). Data presented as mean ±s.d. with technical replicates as individual data points. Total areas quantified were. 349 mm2,. 392 mm2,. 131 mm2, and. 131 mm2, and total puncta measured were 2,943, 7,583, 733, and 47 for normal PLA, tumor PLA, normal control, and tumor control conditions, respectively.
Figure 2 with 2 supplements
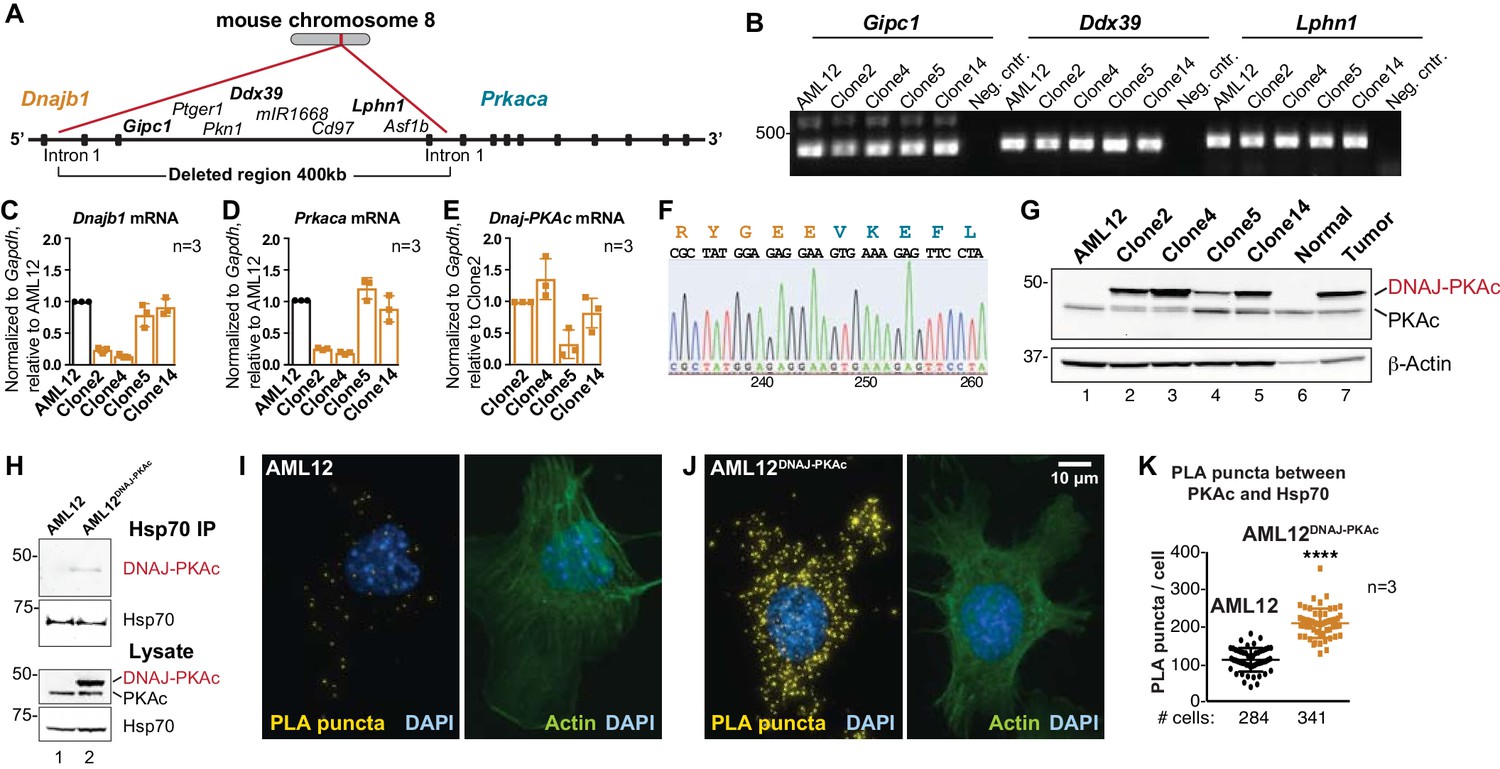
Generation and characterization of AML12DNAJ-PKAc cell lines.
(A) CRISPR-Cas9 gene editing of mouse chromosome eight in AML12 cells deleted a 400 kb region between intron 1 of the gene for Hsp40 (Dnajb1) and intron 1 of the gene for PKAc (Prkaca). (B) PCR detection of transcripts for the Gipc1, Ddx39 and Lphn1 genes encoded on the non-engineered strand of mouse chromosome 8. (C–E) Quantitative PCR detection of native mRNA transcripts in AML12 (black) and gene-edited (orange) cell lines. (C) Detection of native Dnajb1 mRNA transcripts, (D) Prkaca transcripts and (E) Dnajb1-Prkaca mRNA transcripts. Data (n = 3) is normalized to Gapdh (C–E) and relative to (C,D) wildtype AML12 or (E) clone 2. Error bars indicate mean ±s.d. (F) Amino acid sequence of the fusion protein DNAJ-PKAc is shown in orange and blue. Nucleotide sequence of the fusion gene from clone 14 AML12DNAJ-PKAc cells is shown below. (G) Immunoblot detection of both native and mutant PKAc in four clonal AML12DNAJ-PKAc cell lines. Top) DNAJ-PKAc fusion proteins (upper bands) and wildtype PKAc (lower bands) are indicated. The distribution of PKAc in wildtype AML12 cells, normal liver and FLC are included. Bottom) Actin loading control. (H) Immunoblot detection of PKA in Hsp70 immune complexes isolated from wildtype (AML12) and clone 14 AML12DNAJ-PKAc cells. Lysate loading controls indicate both forms of PKA (middle) and levels of Hsp70 (bottom). (I and J) Proximity Ligation (PLA) detection of proteins within 40–60 nm of each other in (I) AML12 and (J) AML12DNAJ-PKAc cells. Yellow puncta identify Hsp70-kinase sub-complexes. Actin stain (green) marks cytoskeleton and DAPI staining (blue) marks nuclei. (K) Box-whisker plots of Hsp70-kinase sub-complexes. Amalgamated data (PLA puncta/cell) from AML12 (black) and AML12DNAJ-PKAc (orange) cells. Number of cells analyzed over three independent experiments is indicated below each plot; data are shown as mean ±s.d., p<0.0001 by Student’s t-test (t = 14.16, df = 105).
Figure 2—figure supplement 1

Additional characterization of AML12DNAJ-PKAc cells.
(A) Immunoblot detection of PKA RIα (top panel), RIIα (mid-top panel) and RIIβ (mid-lower panel) subunits in parental AML12 cells and four clonal AML12DNAJ-PKAc cell lines. Bottom) Actin loading control. (B) The specific activity (pmol/μg/min) of basal and cAMP responsive PKA activity in wildtype AML12 (black) and clone 14 AML12DNAJ-PKAc (orange) was measured by radioactive kinase assay using Kemptide as a substrate. PKI 5–24 inhibitor peptide specifically blocked PKA activity. Representative data (mean ±s.d.) from three independent experiments. Holm-Sidak T-tests were performed. (C–F) Motile properties of AML12DNAJ-PKAc cells as measured by scratch wound. Migration of (C) AML12 and (D) clone 14 AML12DNAJ-PKAc cells. Images were collected every 45 min over 24 hr of n > 3 replicates. Time 0 (t = 0) is immediately after scratch-wounding. Transmigration through matrigel of (E) AML12 and (F) AML12DNAJ-PKAc cells. Images were taken every 45 min for 48 hr of n > 3 replicates; representative data shown. Time 0 (t = 0) is immediately after scratch-wounding. Scale bar is 300 μm.
Figure 2—figure supplement 2
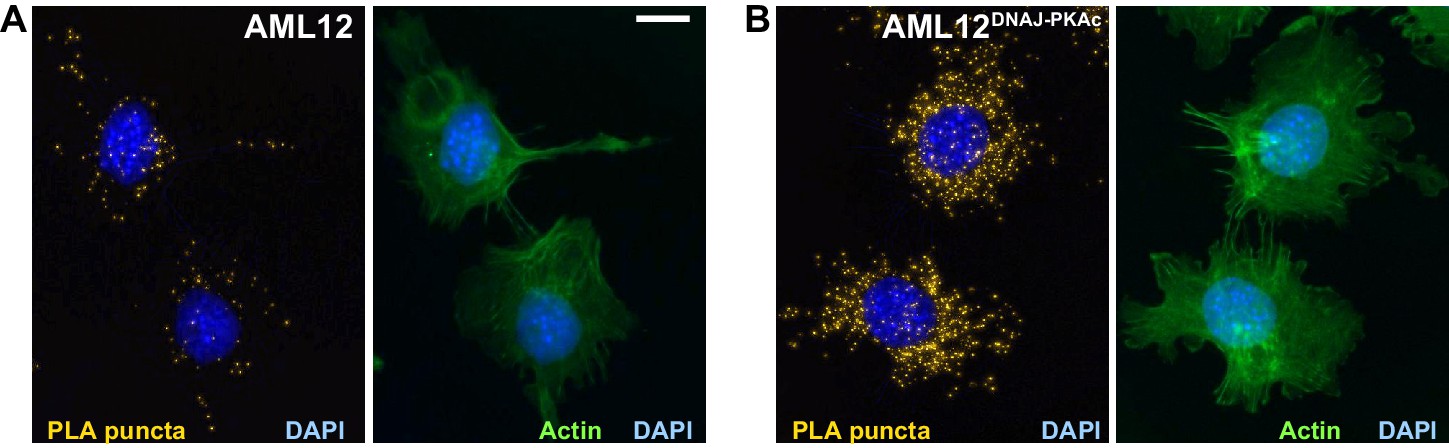
Additional Proximity Ligation (PLA) detection of Hsp70 and PKAc in (A) AML12 and (B) AML12DNAJ-PKAc cells.
Yellow puncta identify Hsp70-kinase sub-complexes. Actin stain (green) marks cytoskeleton and DAPI staining (blue) marks nuclei. These data were used for the quantification of PKA-Hsp70 puncta in Figure 2K.
Figure 3 with 1 supplement
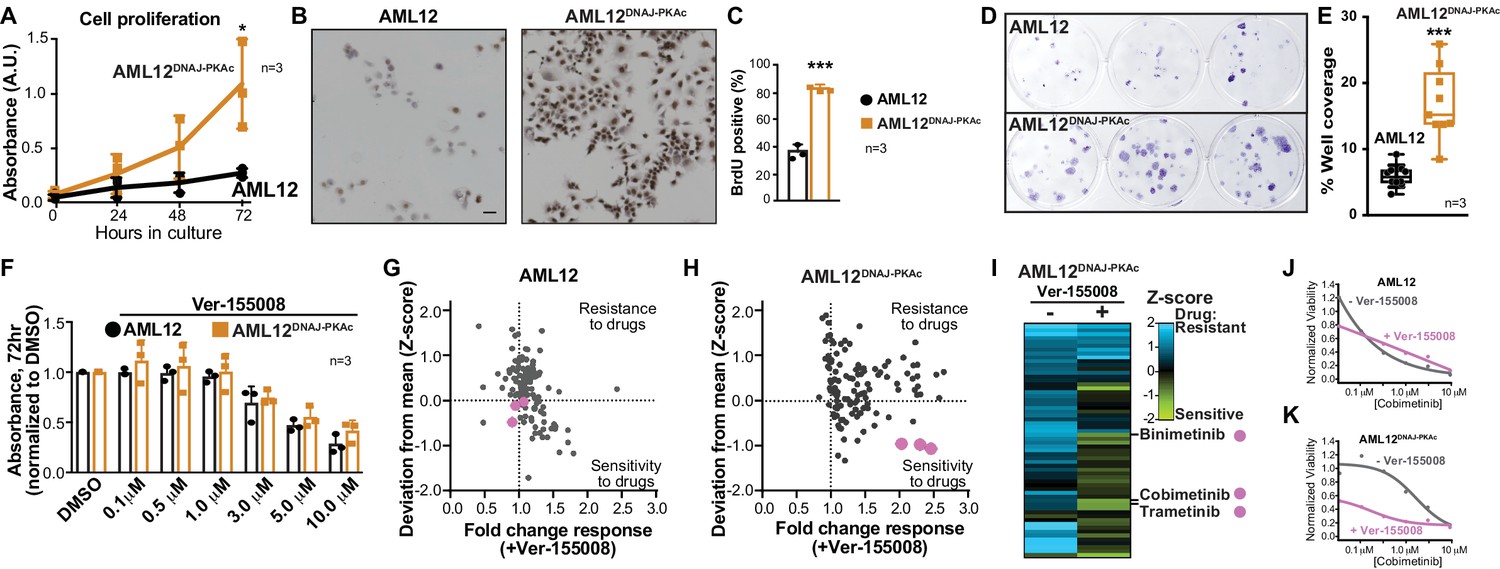
Cell proliferation analyses and combination drug sensitivity screening of AML12DNAJ-PKAc cells.
(A) Cell growth of wildtype AML12 (black) and AML12DNAJ-PKAc (orange) cells measured by MTS colorimetric assay. Absorbance (AU) was measured over a time course of 72 hr. Data are expressed as mean ±s.d. (n = 3); p=0.01 (t = 4.49, df = 6). (B) In situ incorporation of BrdU as an independent means of assessing DNA synthesis. Representative panels of wildtype (left) AML12 and (right) AML12DNAJ-PKAc cells. Scale bar represents 50 μm. (C) Percentage of BrdU positive cells presented as mean ±s.d. (n = 3); p=0.0001 (t = 14.51, df = 4). (D) Clonogenic growth of (top) AML12 and (bottom) AML12DNAJ-PKAc cells. Cells were seeded at 200 cells/well in a 12 well plate and grown for two weeks in normal growth media followed by crystal violet staining. (E) Amalgamated data charting area of growth in each well is presented as box and whiskers plot (min-max; n = 3); p<0.0001 by Student’s t-test (t = 6.14, df = 17). (F) Dose-response curves monitor the cytotoxic effects of the Hsp70 inhibitor Ver-155008 alone in AML12 (black) and AML12DNAJ-PKAc (orange) cells. Cell viability was assessed by MTS. Concentrations of drug used in each condition are indicated below each column. (G and H) Scatterplots show relative resistance or sensitivity of (G) AML12 and (H) AML12DNAJ-PKAc cells to the combination of 125 different chemotherapeutic drugs with Ver-155008. Drug combinations in the lower right quadrant are more sensitive to drug treatment than those in the upper right quadrant. Three drug combinations (pink circles) were identified for further validation, as they were more toxic to cells expressing DNAJ-PKAc than cells only expressing wildtype kinase. (I) Heat map of a subset of these data compares AML12DNAJ-PKAc cell survival with and without Ver-155008. AML12DNAJ-PKAc cells show drug resistance when treated with binimetinib, cobimetinib, or trametinib alone (left, blue) but they are more sensitive when these drugs are combined with Ver-155008 (right, green). (J and K) Analysis of (J) wildtype AML12 and (K) AML12DNAJ-PKAc cell survival. Dose-response of cobimetinib alone, (gray) or in combination with Ver-155008 (pink). Drug concentrations (μM) are indicated.
Figure 3—figure supplement 1
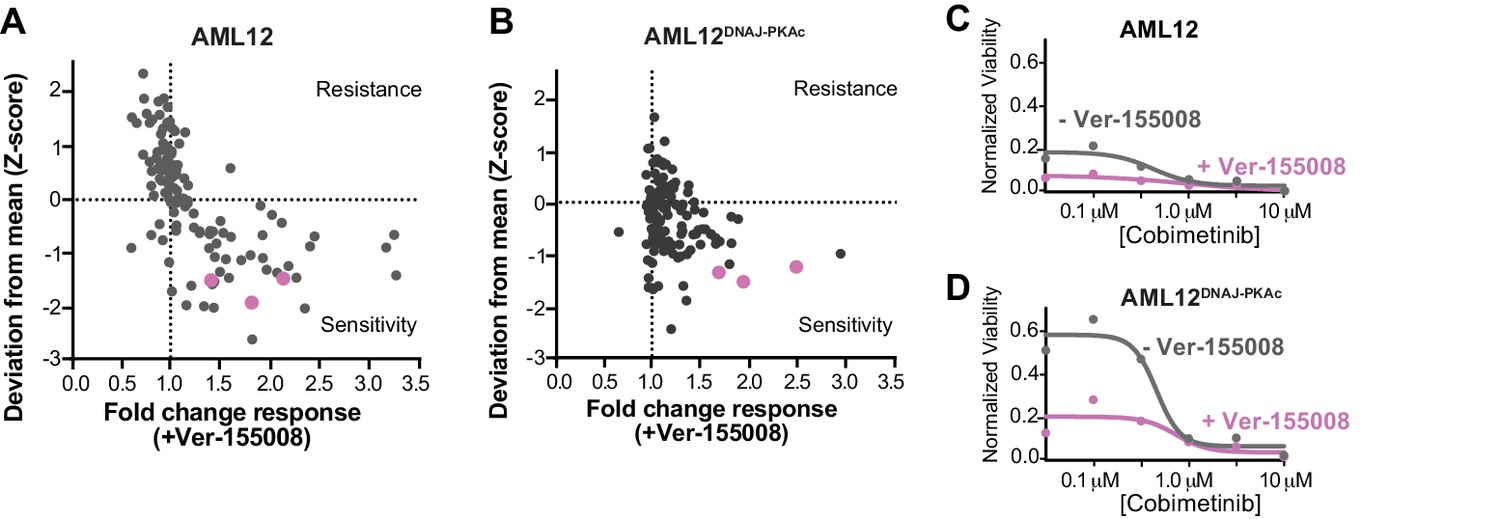
Repeat combination drug screens at lower concentrations (3 μM) of Ver-155008.
(A and B) Scatterplots show relative resistance or sensitivity of (A) AML12 and (B) AML12DNAJ-PKAc cells to the combination of 125 different chemotherapeutic drugs with Ver-155008. Drug combinations in the lower right quadrant are more sensitive to drug treatment than those in the upper right quadrant. Binimetinib, cobimetinib and trametinib are highlighted (pink circles). (C and D) Analysis of (C) wildtype AML12 and (D) AML12DNAJ-PKAc cell survival: Dose-response of the drug cobimetinib alone (gray) or in combination with Ver-155008 (pink). Drug concentrations (μM) are indicated.
Figure 4
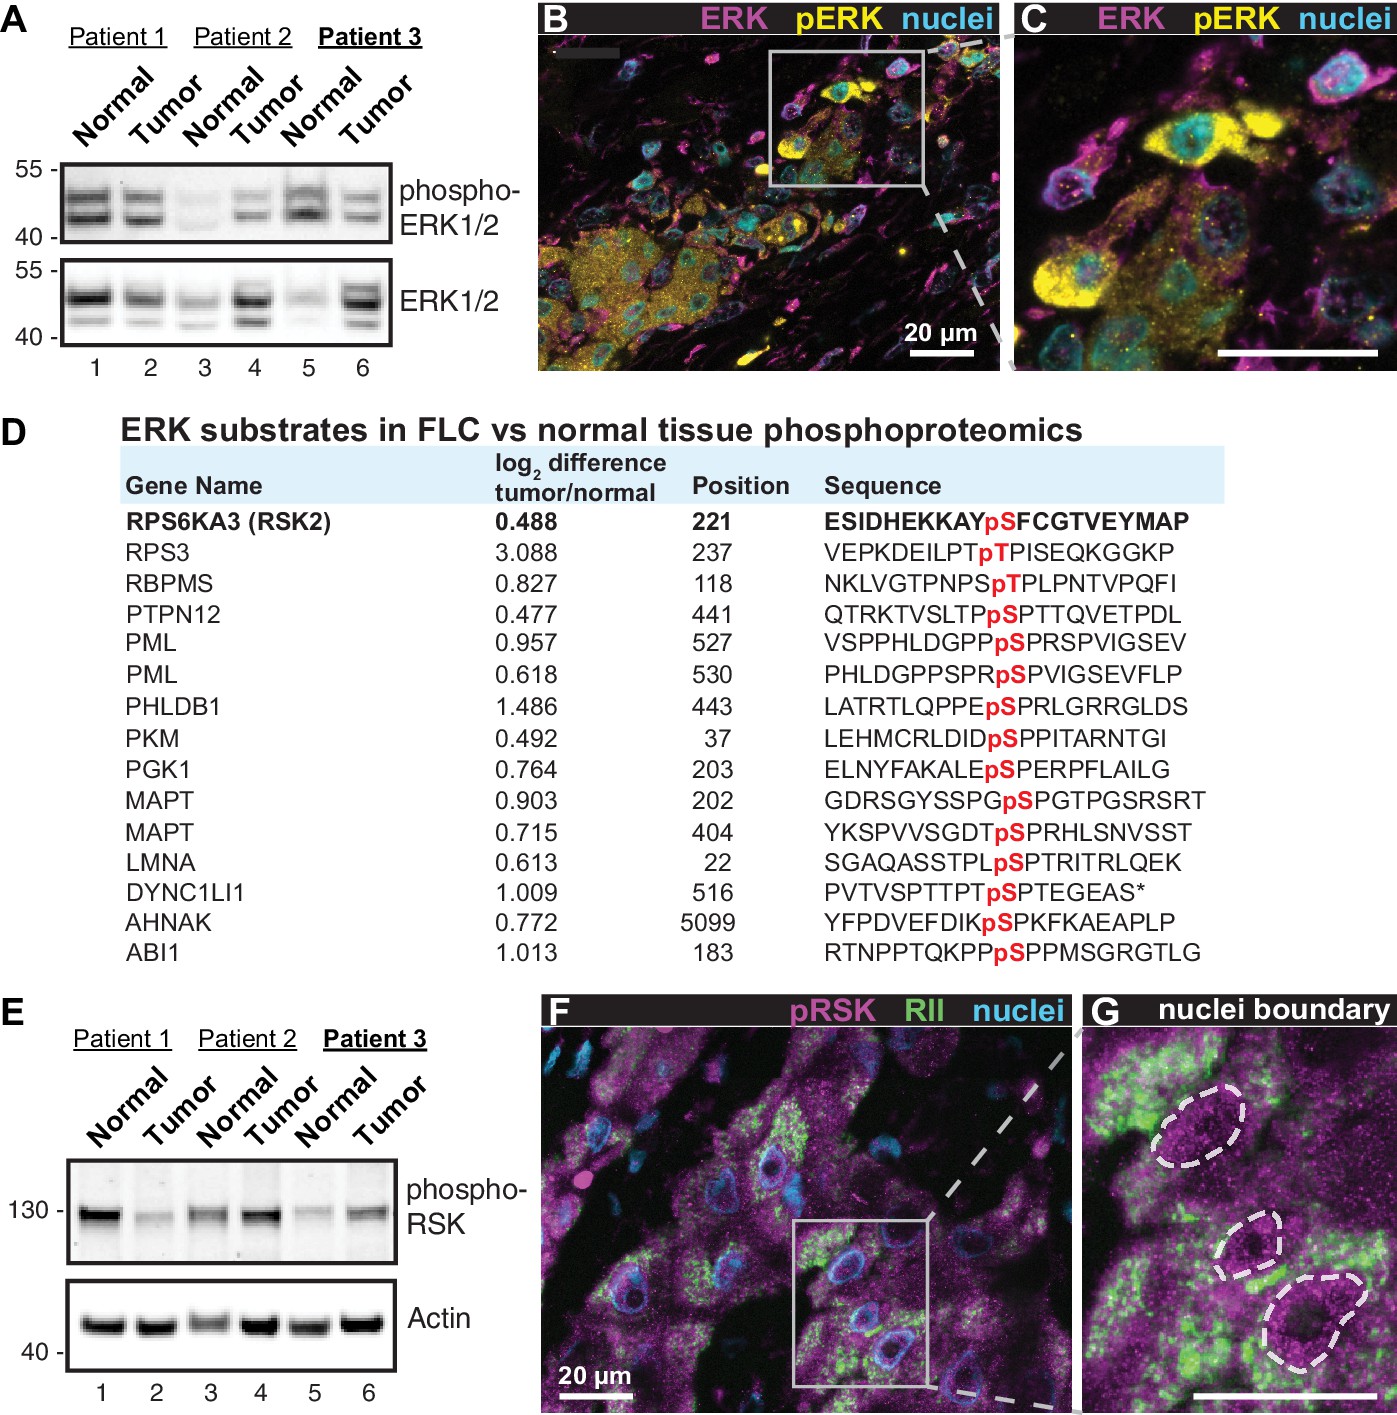
Heterogeneous activation of ERK signaling in FLCs.
(A) Immunoblots of paired tumor and normal adjacent liver from FLC patients probed with antibodies to phospho-ERK1/2 (top panel) and total ERK1/2 (bottom panel). (B) Immunofluorescence images of FLC section from patient #3 were stained with antibodies against phospho-ERK (yellow), total ERK (magenta) and DAPI (nuclei, blue). Scale bar represents 20 μm. (C) Enlarged region from (B) showing prominent phospho-ERK staining in a subset of tumor hepatocytes. (D) Salient ERK substrates identified in phosphoproteomic analysis of FLC. Gene names, degree of enrichment (log2difference tumor/normal) and primary phosphosite sequences (one letter code) are indicated. The protein kinase P90-RSK2 is highlighted. (E) Immunoblots of paired tumor and normal adjacent liver from FLC patients probed with antibodies to phospho-P90RSK (top panel). Actin loading control (bottom panel). (F) Immunofluorescence image of FLC section stained with antibodies against phospho-P90RSK (magenta), PKA RII (green) and the nuclear marker DAPI (blue). (G) Enlarged region from (F). Dashed lines) highlight increased nuclear accumulation of phospho-P90RSK signal. Scale bars indicate 20 μm.
Figure 5 with 1 supplement
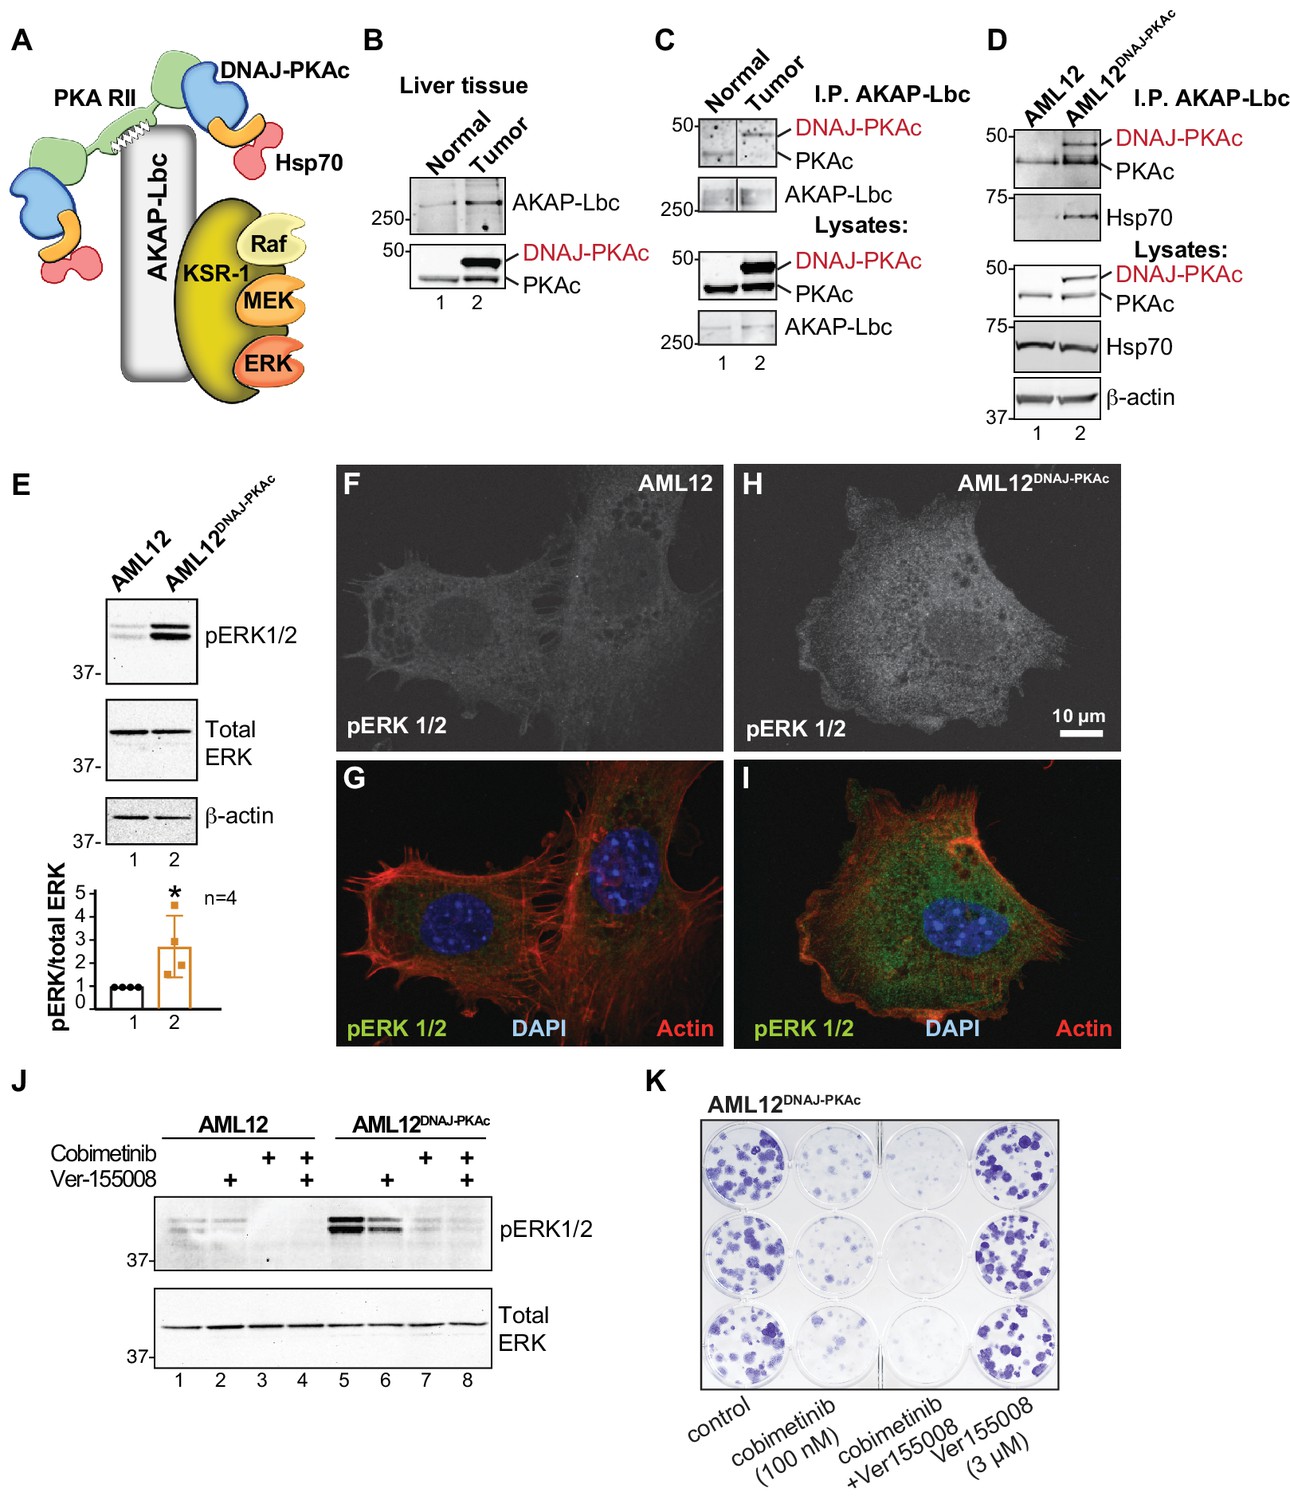
Pharmacologically targeting DNAJ-PKAc assemblies.
(A) Schematic of an AKAP-Lbc-KSR-1 macromolecular assembly that sequesters Hsp70 and DNAJ-PKAc with elements of the ERK kinase cascade. (B) Immunoblots of paired FLC and normal adjacent liver probed with antibodies to AKAP-Lbc (top panels) and PKAc (bottom panels). (C) Immunoblot detection of PKAc (top) in AKAP-Lbc immune complexes (upper-mid) from normal adjacent tissue and FLC. PKAc (lower-mid) and AKAP-Lbc (bottom) in tissue lysates are indicated. DNAJ-PKAc (red) is indicated. (D) Co-immunoprecipitation of signaling elements with AKAP-Lbc from AML12DNAJ-PKAc cells. Immunoblot detection of PKAc (top) and Hsp70 (upper-mid) in immune complexes isolated from AML12DNAJ-PKAc cells. PKAc (middle), Hsp70 (mid-lower) in lysates from wildtype and AML12DNAJ-PKAc cells. Actin (bottom) served as loading control. (E) Immunoblot detection of phospho-ERK1/2 (top) as an index of ERK kinase activity in cell lysates from AML12 and AML12DNAJ-PKAc cells. Bottom) Immunoblot detection of total ERK served as a loading control. Quantification of immunoblots (n = 4); mean ±s.d. and p=0.04 (t = 2.6, df = 6). (f–I) In situ immunofluorescence of basal ERK activity. Grayscale images depicting immunofluorescent detection of phospho-ERK1/2 in (F) wildtype and (H) AML12DNAJ-PKAc cells. Composite images of phospho-ERK1/2 (green), actin (red) and nuclei (blue) in (G) wildtype and (I) AML12DNAJ-PKAc cells. Scale bar represents 10 μm. (J) Immunoblot detection of phospho-ERK 1/2 in wildtype AML12 (lanes 1–4) and AML12DNAJ-PKAc cells (lanes 5–8). Cells were treated with 100 nM of the MEK inhibitor cobimetinib, 3 μM Ver-155008 or combination of both drugs. Bottom) Detection of total ERK served as loading control. (K) Clonogenic growth assay portraying crystal violet (blue) staining of AML12DNAJ-PKAc cell proliferation in the presence of cobimetinib (100 nM), Ver-155008 (3 µM) and both drugs in combination.
Figure 5—figure supplement 1

Effect of combination treatment with trametinib and Ver-155008 on cell growth.
Clonogenic growth assay of AML12DNAJ-PKAc cells in the presence of the MEK inhibitor trametinib ± Hsp70 inhibition with Ver-155008.
Figure 6
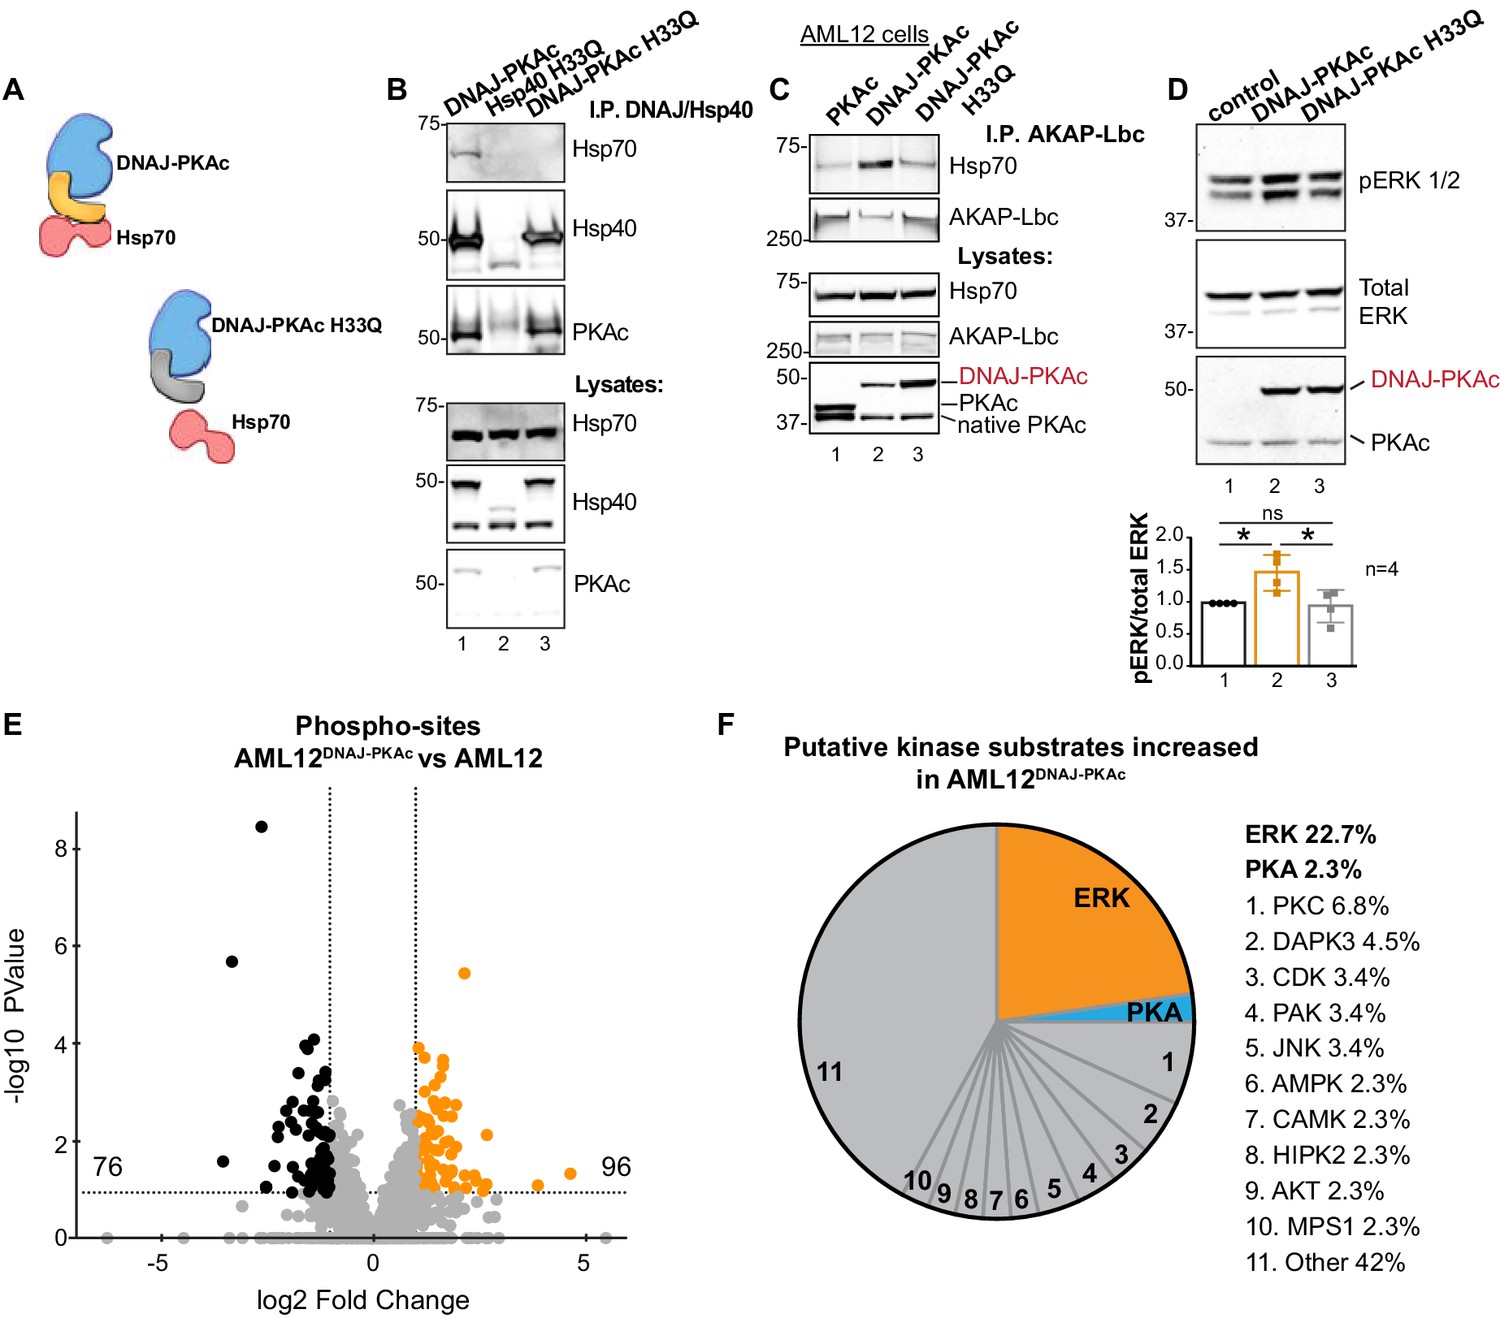
Interruption of the DNAJ-PKAc/Hsp70 interface reduces ERK activation: substrate bias towards ERK signaling in AML12DNAJ-PKAc cells.
(A) Schematics of native DNAJ-PKAc (left) and DNAJ-PKAc H33Q mutant that cannot bind Hsp70 (right, gray). (B) Mutation of the chaperonin-binding site (H33Q) on DNAJ-PKAc abrogates interaction with Hsp70. Endogenous HSP70 co-precipitates with DNAJ-PKAc in AML12 cells expressing FLAG-DNAJ-PKAc (lane 1), but not with FLAG-Hsp40 H33Q control (lane 2) or the FLAG-DNAJ-PKAc H33Q mutant (lane 3). (C) GFP-tagged AKAP-Lbc co-precipitates endogenous Hsp70 in AML12 cells expressing FLAG-DNAJ-PKAc (lane 2) but not in cells expressing the wildtype FLAG-PKAc (lane 1) or the FLAG-DNAJ-PKAc H33Q mutant (lane 3). (D) Immunoblot detection of phospho-ERK1/2 in AML12 cells transiently transfected with DNAJ-PKAc (lane 2) or DNAJ-PKAc H33Q (lane 3). Total ERK (middle) served as a loading control. Detection of PKAc (bottom) monitored transfection efficiency. Quantitation of blots from four experiments, p=0.01 (t = 3.406, df = 6) and p=0.03 (t = 2.758, df = 6). (E and F) Differential phosphoproteomic profiling of AML12DNAJ-PKAc cells. (E) Volcano plot showing abundance (orange) and reduction (black) of phosphopeptides in AML12DNAJ-PKAc cells. Statistical significance of biological replicates was calculated by Student’s t test with Log10-transformed p-values of individual phosphopeptides plotted against log2-transformed fold change; n = 6. (F) Pie chart of putative kinase substrates increased in AML12DNAJ-PKAc cells. Sites identified by NetworKIN platform. Individual kinases are listed. ‘Other’ kinases include: CK, ABL2, GRK, GSK3, JAK2, NLK, and SRC.
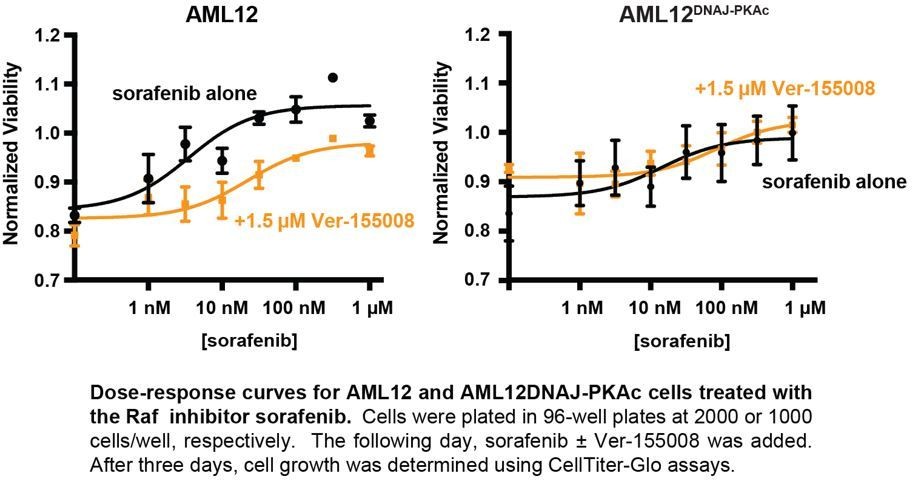
Author response image 1
Tables
Key resources table
| Reagent type (species) or resource | Designation | Source or reference | Identifiers | Additional information |
|---|---|---|---|---|
| Antibody | ActinGreen-488 | Molecular probes | R37110 | Manufacturer instructions |
| Antibody | ActinRed-555 | Molecular probes | R37112 | Manufacturer instructions |
| Antibody | AKAP-Lbc (VO96) | Diviani et al., 2001 | rabbit polyclonal | (1:1000) |
| Antibody | Amersham ECL Mouse IgG, HRP-linked F(ab')₂ fragment (from sheep) | GE Life Sciences | NA9310 | (1:10000) |
| Antibody | Amersham ECL Rabbit IgG, HRP-linked F(ab')₂ fragment (from donkey) | GE Life Sciences | NA9340 | (1:10000) |
| Antibody | Actin beta | Sigma-Aldrich | A1978 mouse monoclonal RRID:AB_476692 | (1:2500) |
| Antibody | BrdU | Dako | M0744 mouse monoclonal RRID:AB_10013660 | (1:1000) |
| Antibody | Donkey anti-Mouse IgG, Alexa Fluor 555 | Invitrogen | A-31570 | (1:500) |
| Antibody | Donkey anti-Mouse IgG, Alexa Fluor 488 | Invitrogen | A-21202 | (1:800) |
| Antibody | Donkey anti-Rabbit IgG, Alexa Fluor 488 | Invitrogen | R37118 | (1:500) |
| Antibody | Donkey anti-Rabbit IgG, Alexa Fluor 555 | Invitrogen | A-31572 | (1:800) |
| Antibody | GAPDH-HRP | Novus | NB110-40405 mouse monoclonal RRID:AB_669249 | (1:1000) |
| Antibody | Hsp70 | Proteintech | 10995–1 rabbit polyclonal RRID:AB_2264230 | WB (1:500), PLA in tissue (1:200), PLA in cells (1:500) |
| Antibody | p-44/42 ERK | CST | 9102 rabbit polyclonal RRID:AB_330744 | (1:1000) |
| Antibody | p-44/42 ERK | BD Transduction | 610123 mouse monoclonal RRID:AB_397529 | WB (1:1000), IHC (1:100) |
| Antibody | phospho-p44/42 MAPK | CST | 9101 rabbit polyclonal RRID:AB_331646 | WB (1:500), IHC (1:100) |
| Antibody | PKAc | BD Transduction | 610981 mouse monoclonal RRID:AB_398294 | WB (1:500), PLA in tissue (1:200), PLA in cells (1:500) |
| Antibody | PKAc | CST | 5842 rabbit monoclonal RRID:AB_10706172 | IHC (1:500) |
| Antibody | RIa | BD Transduction | 610610 mouse monoclonal RRID:AB_397944 | (1:1000) |
| Antibody | RIIa | BD Transduction | 612243 mouse monoclonal RRID:AB_399566 | (1:1000) |
| Antibody | RIIb | BD Transduction | 610626 mouse monoclonal RRID:AB_397958 | (1:1000) |
| Antibody | phospho-RSK | Thermo-Fisher | PA5-37829 rabbit polyclonal RRID:AB_2554437 | WB (1:500), IHC (1:100) |
| Antibody | FLAG M2 Magnetic Beads | Sigma-Aldrich | M8823 mouse monoclonal RRID:AB_2637089 | IP (1:40) |
| Antibody | GFP | Rockland | 600-101-215 goat polyclonal RRID:AB_218182 | WB (1:1000), IP (1:700) |
| Antibody | RI | BD Transduction | 610165 mouse monoclonal RRID:AB_397566 | (1:500) |
| Antibody | phospho-PKA substrates (RRXS*/T*) | CST | 9624 rabbit monoclonal RRID:AB_331817 | (1:1000) |
| Antibody | NeutrAvidin-HRP | Thermo-Fisher | 31030 | (1:5000) |
| Antibody | RIIa and b | McCartney et al., 1995 | goat polyclonal | (1:200) |
| Cell line (M. musculus) | AML12 | ATCC | ATCC: CRL-2254 RRID:CVCL_0140 | Obtained from KJR by way of Nelson Fausto lab (original ATCC depositor) |
| Chemical compound, drug | DAPI | Thermo-Fisher | 62248 | Manufacturer instructions |
| Chemical compound, drug | ATP, [γ−32P]- 3000 Ci/mmol 10mCi/ml EasyTide, 100 µCi | Perkin-Elmer | BLU502A100UC | |
| Chemical compound, drug | BrdU | Invitrogen | B23151 | |
| Chemical compound, drug | Cobimetinib | Sigma-Aldrich | ADV465749767 | |
| Chemical compound, drug | Trametinib | Sigma-Aldrich | ADV465749287 | |
| Chemical compound, drug | Dexamethasone | Sigma-Aldrich | D4902 | |
| Chemical compound, drug | DMEM/F-12 | Gibco | 11320033 | |
| Chemical compound, drug | Fetal Bovine Serum | Thermo-Fisher | A3382001 | |
| Chemical compound, drug | Gentamicin sulfate salt | Sigma-Aldrich | G1264 | |
| Chemical compound, drug | ITS Liquid Media Supplement | Sigma-Aldrich | I3146 | |
| Chemical compound, drug | Lipofectamine LTX with Plus Reagent | Thermo-Fisher | 15338100 | |
| Chemical compound, drug | Puromycin | Sigma-Aldrich | P8833 | |
| Chemical compound, drug | TransIT-LT1 Transfection Reagent | Mirus | MIR2300 | |
| Chemical compound, drug | Trypsin-EDTA (0.25%), phenol red | Gibco | 25200056 | |
| Chemical compound, drug | Crystal Violet | Sigma | C3886 | |
| Chemical compound, drug | Ver-155008 | Sigma-Aldrich | 1134156-31-2 | |
| Commercial assay or kit | CellTiter 96 AQueous One Solution Cell Proliferation Assay | Promega | G3582 | |
| Commercial assay or kit | CryoGrinder Kir | OPS Diagnostics | CG0801 | |
| Commercial assay or kit | Duolink In Situ Orange Starter Kit Mouse/Rabbit | Sigma-Aldrich | DUO92102 | |
| Commercial assay or kit | GeneJET Genomic DNA purification kit | Thermo | K0721 | |
| Commercial assay or kit | Pierce BCA Protein Assay Kit | Thermo | 23225 | |
| Commercial assay or kit | PowerUp SYBR Green Master Mix | Thermo-Fisher | A25741 | |
| Commercial assay or kit | Reverse Transcription Supermix | Bio-Rad | 1708840 | |
| Commercial assay or kit | RNeasy Mini Kit | Qiagen | 74106 | |
| Commercial assay or kit | SignaTECT cAMP-Dependent Protein Kinase (PKA) Assay System | Promega | V7480 | |
| Commercial assay or kit | Zero Blunt TOPO PCR Cloning Kit | Thermo-Fisher | 450245 | |
| Peptide, recombinant protein | RII-biotin | Carr et al., 1992 | ||
| Peptide, recombinant protein | PKI | Sigma-Aldrich | P7739 | |
| Recombinant DNA reagent | DNAJ-PKAc FLAG | This paper | In-house modified pDEST12.2 (N-terminal FLAG) | |
| Recombinant DNA reagent | DNAJ-PKAc H33Q FLAG | This paper | In-house modified pDEST12.2 (N-terminal FLAG) | |
| Recombinant DNA reagent | DNAJB1 FLAG | This paper | This paper | In-house modified pDEST12.2 with N-terminal FLAG; backbone from Invitrogen (discontinued) |
| Recombinant DNA reagent | AKAP-Lbc GFP | Clonetech; Diviani et al., 2001 | pEGFP-N1 (Clontech) backbone | |
| Recombinant DNA reagent | hSpCas9-gDnajb1-Prkaca-2A-Puro | This paper | RRID:Addgene_48138 | PX458 backbone; Dual U6-sgRNA cassettes |
| Sequenced-based reagent | Gipc1_F | This paper | PCR primers | GGGAAAGGACAAAAGGAACCC |
| Sequenced-based reagent | Gipc1_R | This paper | PCR primers | CAGGGCATTTGCACCCCATGCC |
| Sequenced-based reagent | Ddx39_F | This paper | PCR primers | CCGGGACTTTCTACTGAAGCC |
| Sequenced-based reagent | Ddx39_R | This paper | PCR primers | GAATGGCCTGGGGAATACAC |
| Sequenced-based reagent | Lphn1_F | This paper | PCR primers | ACCCCTTCCAGATGGAGAATGT |
| Sequenced-based reagent | Lphn1_R | This paper | PCR primers | TGGGCAAGCATCTATGGCAC |
| Sequenced-based reagent | Dnajb1_ex2_F | This paper | qPCR primers | GGGACCAGACCTCGAACAAC |
| Sequenced-based reagent | Dnajb1_ex2_R | This paper | qPCR primers | GGCTAATCCTGGCTGGATAGAT |
| Sequenced-based reagent | Prkaca_ex1_F | This paper | qPCR primers | AAGAAGGGCAGCGAGCAGGA |
| Sequenced-based reagent | Prkaca_ex1_R | This paper | qPCR primers | GCCGGTGCCAAGGGTCTTGAT |
| Sequenced-based reagent | Gapdh_F | This paper | qPCR primers | ATTTGGCCGTATTGGGCGCCT |
| Sequenced-based reagent | Gapdh_R | This paper | qPCR primers | CCCGGCCTTCTCCATGGTGG |
| Sequenced-based reagent | Dnaj-PKAc_F | This paper | qPCR primers | ACGAGATCAAGCGAGCCTAC |
| Sequenced-based reagent | Dnaj-PKAc_R | This paper | qPCR primers | TTCCCACTCTCCTTGTGCTT |
| Software, algorithm | GraphPad Prism | GraphPad Prism (https://graphpad.com) | ||
| Software, algorithm | ImageJ | ImageJ (http://imagej.nih.gov/ij/) | ||
| Software, algorithm | MaxQuant/Andromeda | https://www.maxquant.org/ | PMID: 19029910 | |
| Software, algorithm | NetworKIN | http://networkin.info/ | PMID: 24874572 | |
| Software, algorithm | Perseus | https://maxquant.net/perseus/ | PMID: 27348712 | |
| Software, algorithm | PhosphoSitePlus | https://www.phosphosite.org |
Additional files
-
Supplementary file 1
Combination drug screen data.
- https://doi.org/10.7554/eLife.44187.016
-
Supplementary file 2
Phosphoproteomic data from FLCs and AML12DNAJ-PKAc cells.
- https://doi.org/10.7554/eLife.44187.017
-
Transparent reporting form
- https://doi.org/10.7554/eLife.44187.018
Download links
A two-part list of links to download the article, or parts of the article, in various formats.
Downloads (link to download the article as PDF)
Open citations (links to open the citations from this article in various online reference manager services)
Cite this article (links to download the citations from this article in formats compatible with various reference manager tools)
An acquired scaffolding function of the DNAJ-PKAc fusion contributes to oncogenic signaling in fibrolamellar carcinoma
eLife 8:e44187.
https://doi.org/10.7554/eLife.44187


