Type-I myosins promote actin polymerization to drive membrane bending in endocytosis
- University of Geneva, Switzerland
- European Molecular Biology Laboratory (EMBL), Germany
Figures
Figure 1
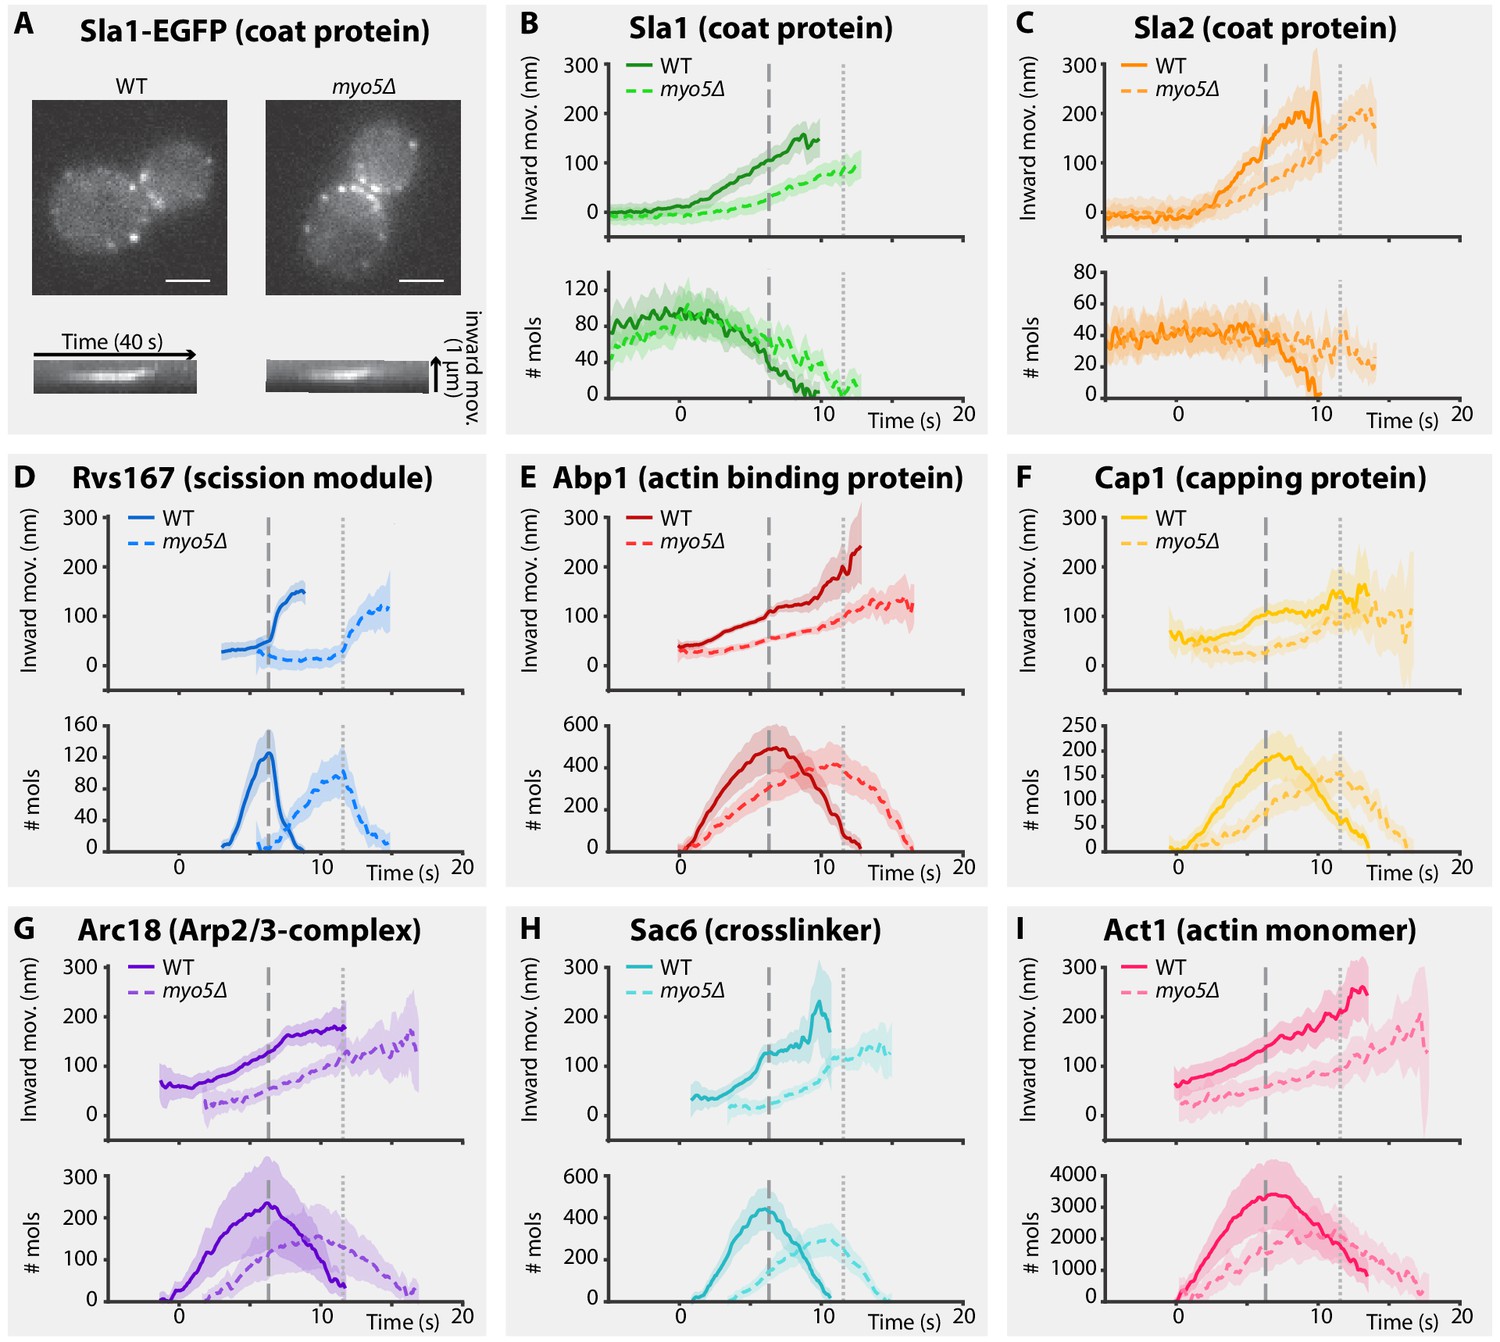
Endocytic protein dynamics in WT and myo5Δ cells.
(A) Top: Sla1-EGFP distribution in WT and myo5Δ cells, bottom: kymographs of Sla1-EGFP patch movement. scalebars: 2 μm. (B–I) Inward movement (top graphs) and number of molecules (bottom graphs) of eight different endocytic proteins in WT (darker, solid line) and myo5Δ cells (lighter, dashed line). Within each genotype (WT or myo5Δ) traces are aligned to each other based on co-alignment with Abp1-mCherry, and plotted such that t = 0 is the onset of Abp1 assembly, and y = 0 is the start of the Sla2 trajectory, marking the position of the plasma membrane. The peak in Rvs167 molecule numbers, representing scission, is marked by dashed vertical lines for the WT dataset, and dotted lines for myo5Δ. Shading represents 95% confidence interval.
-
Figure 1—source data 1
The source data of the trajectories plotted in Figure 1.
- https://doi.org/10.7554/eLife.44215.003
Figure 2 with 1 supplement
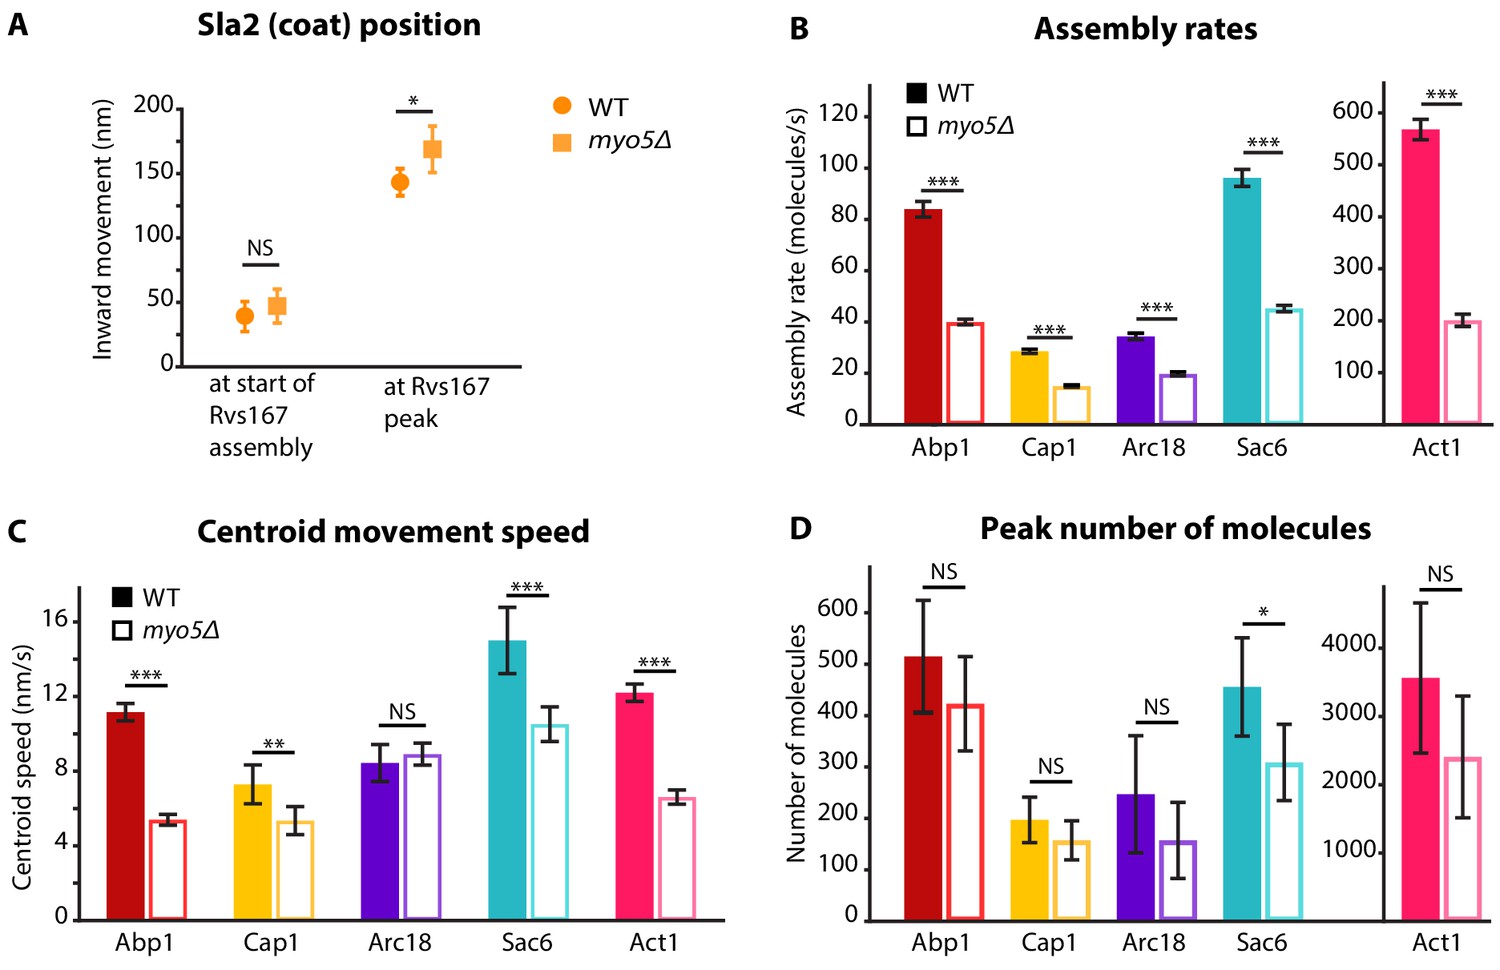
Quantification of endocytic protein dynamics in WT and myo5Δ cells.
(A) Sla2 centroid position at different timepoints in WT (circles) and myo5Δ (squares). (B) Assembly rates for the five different actin network components in WT (darker, solid bars) and myo5Δ (lighter, open bars), calculated from trajectories plotted in Figure 1. (C) Centroid movement speed for the same proteins. (D) Peak number of molecules for the same proteins. Error bars represents the 95% confidence interval. WT and myo5Δ data were compared using 2-sided z-tests. NS: not significant, *: p≤0.05, **: p≤0.01, ***: p≤0.001.
-
Figure 2—source data 1
Assembly rates, Centroid speeds, and Peak number of molecules represented in Figure 2.
- https://doi.org/10.7554/eLife.44215.006
Figure 2—figure supplement 1
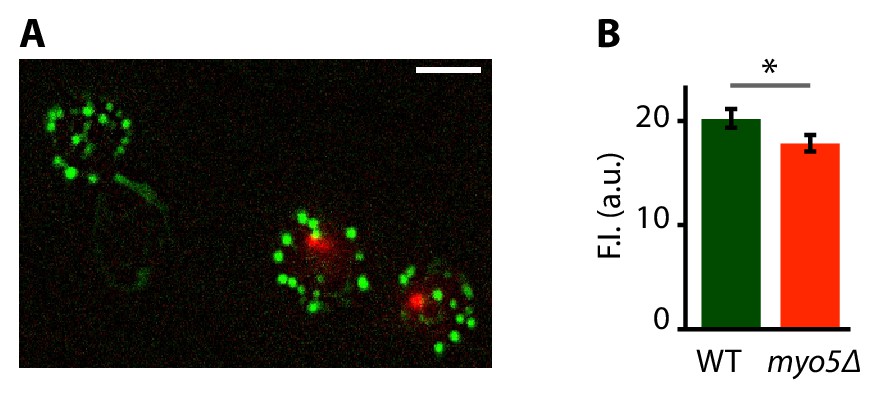
phalloidin staining of WT and myo5Δ cells.
(A) Maximum projection of a Z-stack of WT cells expressing Nuf2-mCherry (cells with red spot) and myo5Δ cells, stained with fluorescent phalloidin (green). (B) Quantification of the phalloidin staining. ND: not determined, F.I.: fluorescence intensity, *: p≤0.05. Scalebar = 5 μm.
Figure 3 with 2 supplements
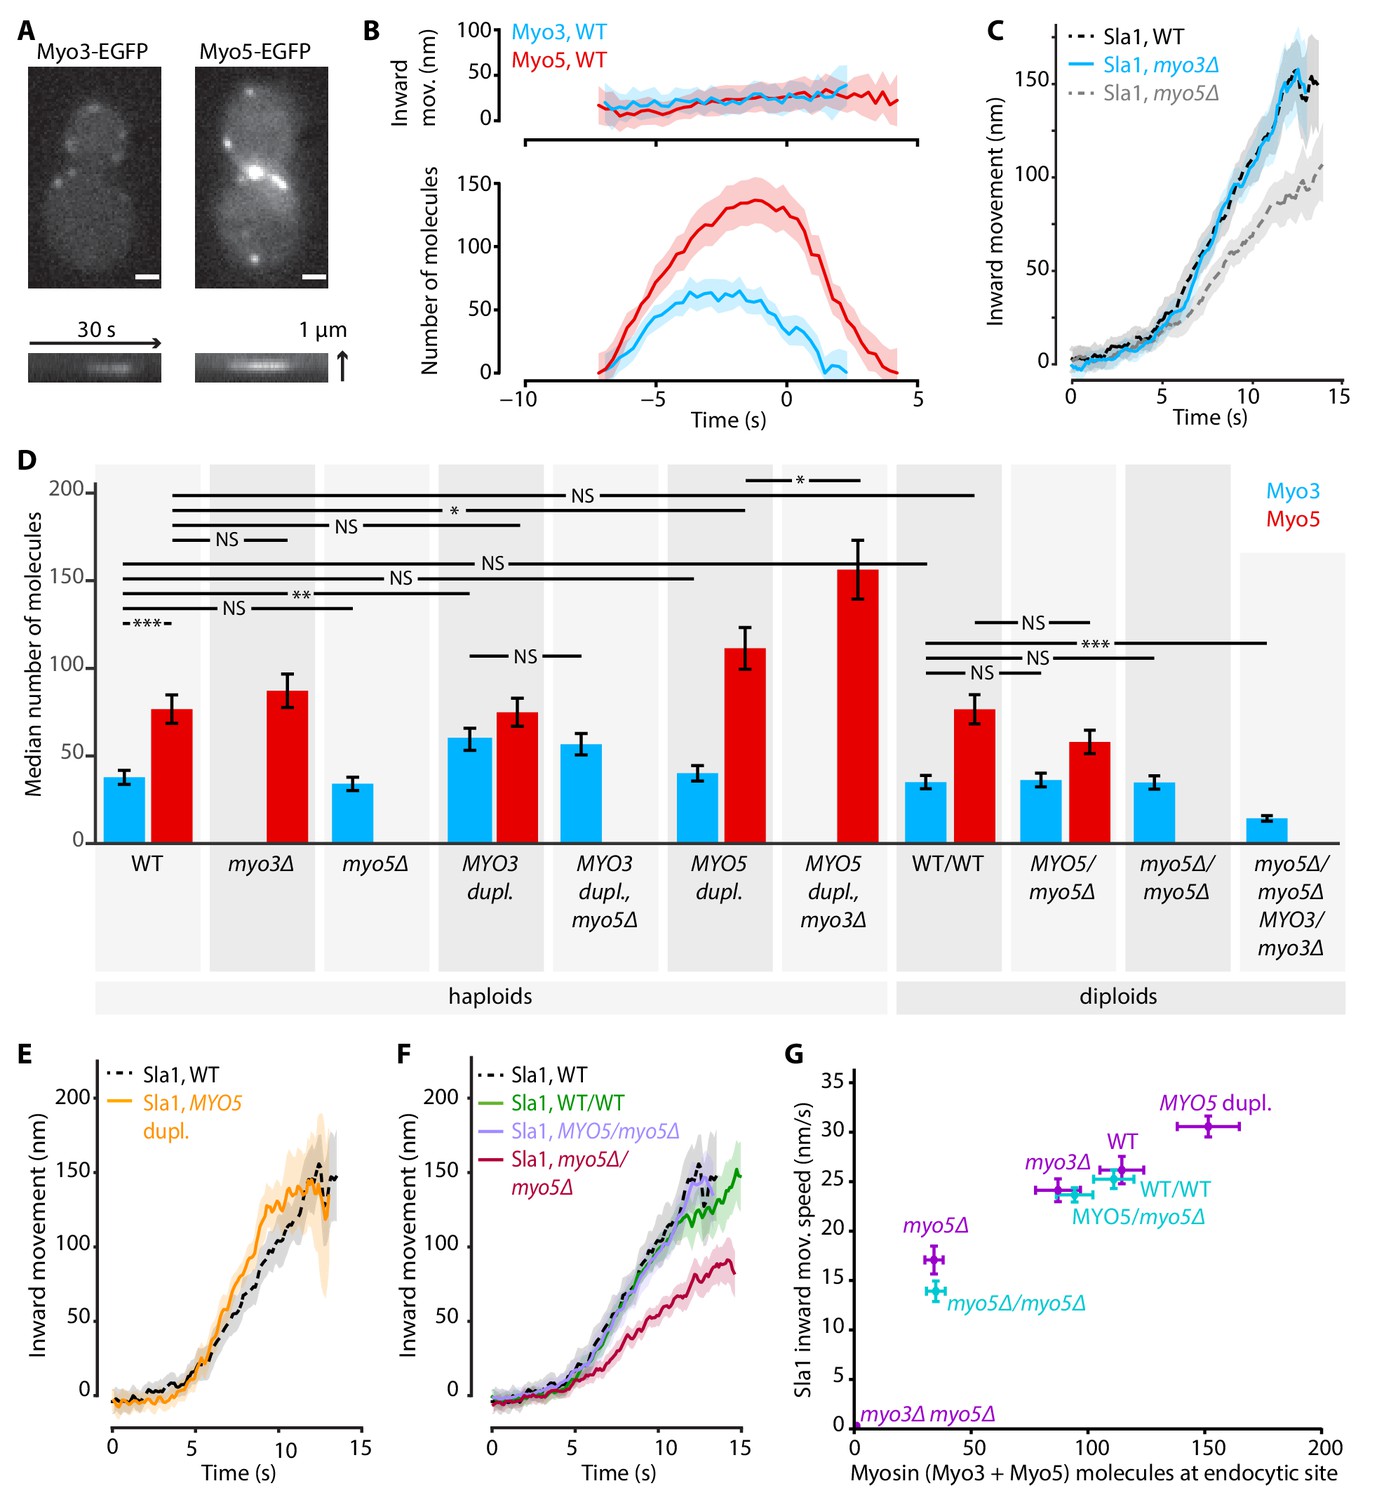
Myo3 and Myo5 control Sla1 inward movement rates.
(A) Top: Myo3-EGFP or Myo5-EGFP patches in WT cells, bottom: kymographs. Scalebar: 1 μm. (B) Inward movement (top) and number of molecules (bottom) of Myo3-EGFP and Myo5-EGFP over time at endocytic sites. Traces are aligned in time based on co-alignment with Abp1-mCherry, and plotted such that t = 0 is the peak in Rvs167 molecule numbers (scission). Shading represents 95% confidence interval. (C) Average Sla1-EGFP centroid inward movement in WT, myo3Δ and myo5Δ. Traces are plotted so that the initial position is y = 0, and are aligned in time to the onset of inward movement. Shading represents 95% confidence interval. One of two independent replicates for each genotype is shown. WT and myo5Δ trajectories are the same as in Figure 1. (D) The median number of Myo3-EGFP and/or Myo5-EGFP molecules over the lifetime of an endocytic site are plotted for several haploid and diploid genotypes (gray boxes). Error bars reflect SEM. Molecule numbers were compared using 2-sided z-tests. (E) Sla1-EGFP centroid inward movement is plotted over time for WT and MYO5 duplication cells. (F) Sla1-EGFP centroid movement in WT haploids, WT diploids and diploids carrying one or no MYO5 alleles. (G) Sla1 centroid inward movement speed is plotted as a function of the total number of myosins per endocytic site (the sum of the median number of Myo3 and Myo5 molecules). Purple datapoints originate from haploid cells, blue from diploids. The datapoints are labeled with their genotype. Horizontal errorbars are SEM, vertical errorbars SE. mov. = movement, dupl. = duplication, NS = not significant, *: p≤0.05, **: p≤0.01, ***: p≤0.001.
-
Figure 3—source data 1
Figure 3C, E, and F average trajectory source data.
- https://doi.org/10.7554/eLife.44215.012
Figure 3—figure supplement 1
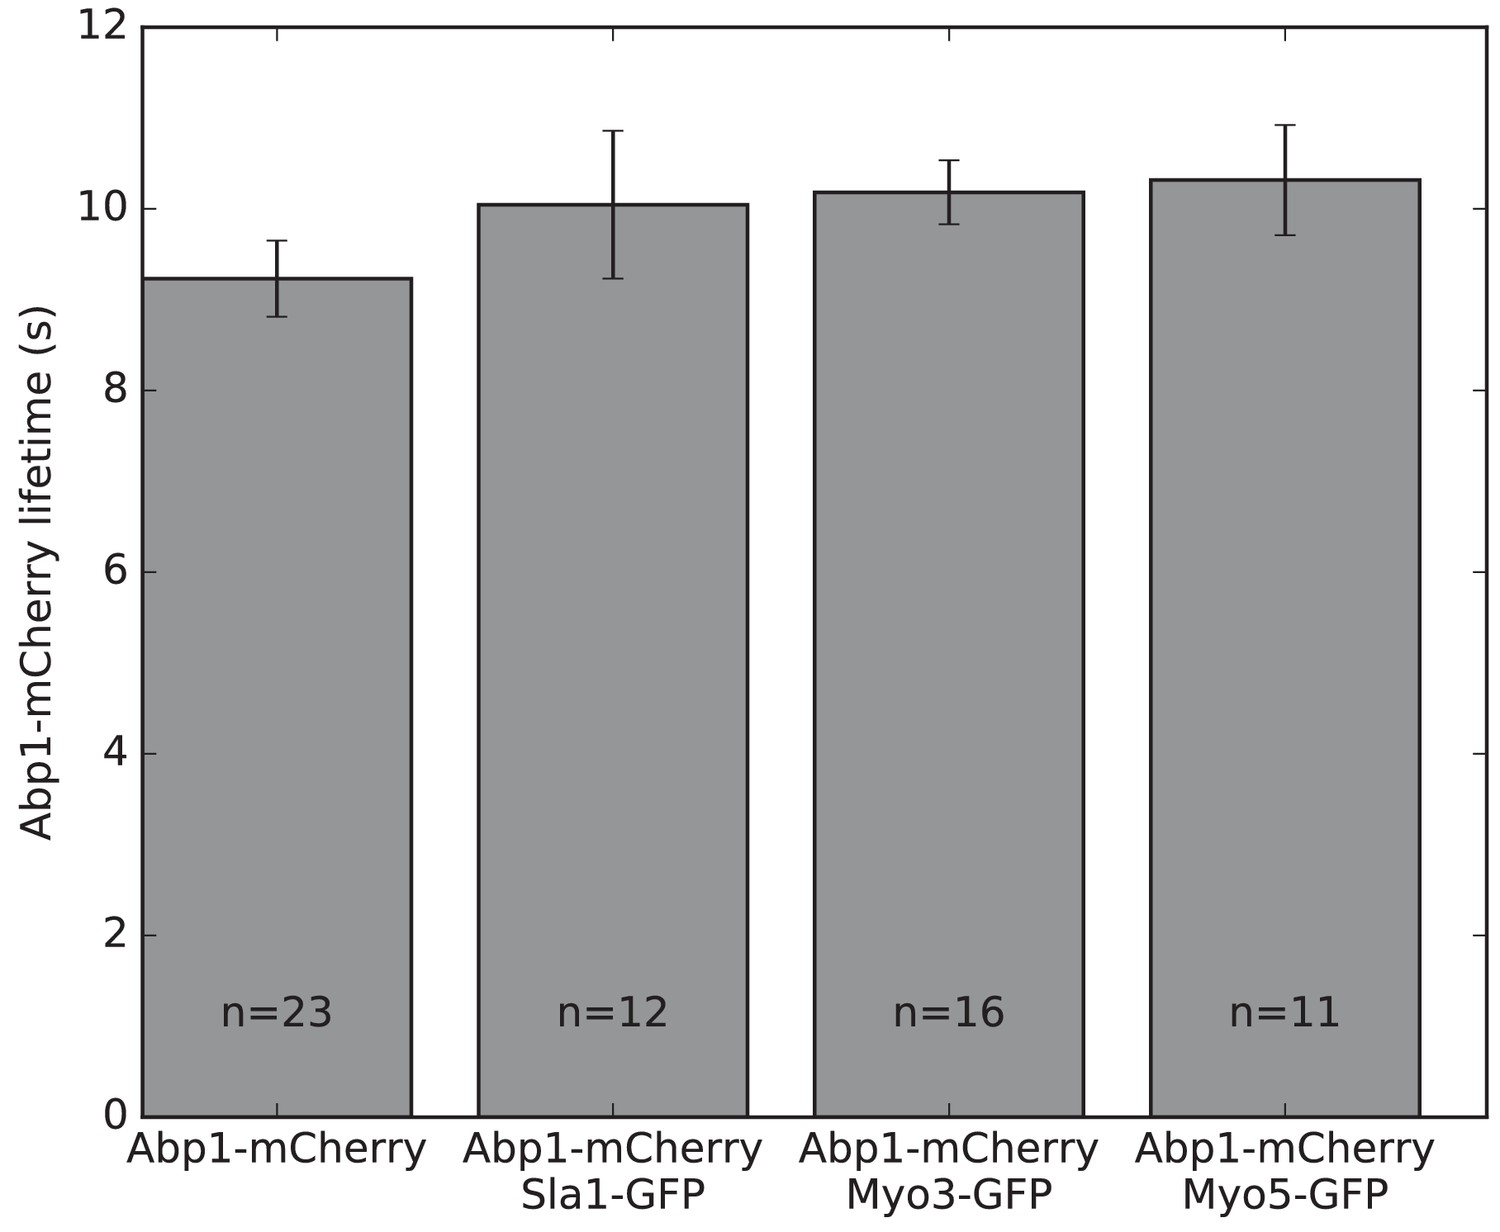
C-terminal EGFP-tagging does not affect Abp1-mCherry lifetimes.
The Abp1-mCherry lifetime is measured in cells expressing no EGFP tag, Sla1-EGFP, Myo3-EGFP, or Myo5-EGFP.
-
Figure 3—figure supplement 1—source data 1
Abp1-mCherry lifetime data in cells expressing no EGFP, Sla1-EGFP, Myo3-EGFP, and Myo5-EGFP.
- https://doi.org/10.7554/eLife.44215.009
Figure 3—figure supplement 2
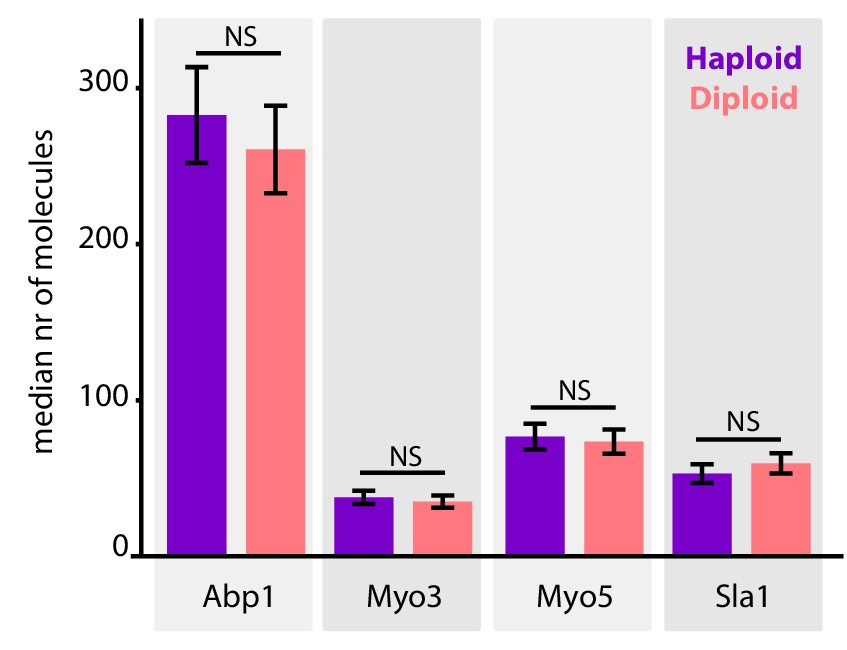
Endocytic site composition in haploid and diploid yeasts.
Median number of endocytic proteins recruited over the lifetime of the endocytic site in wildtype haploid and diploid cells. Error bars are SEM. NS = not significant.
-
Figure 3—figure supplement 2—source data 2
The median number of molecules represented in Figure 3—figure supplement 2.
- https://doi.org/10.7554/eLife.44215.011
Figure 4
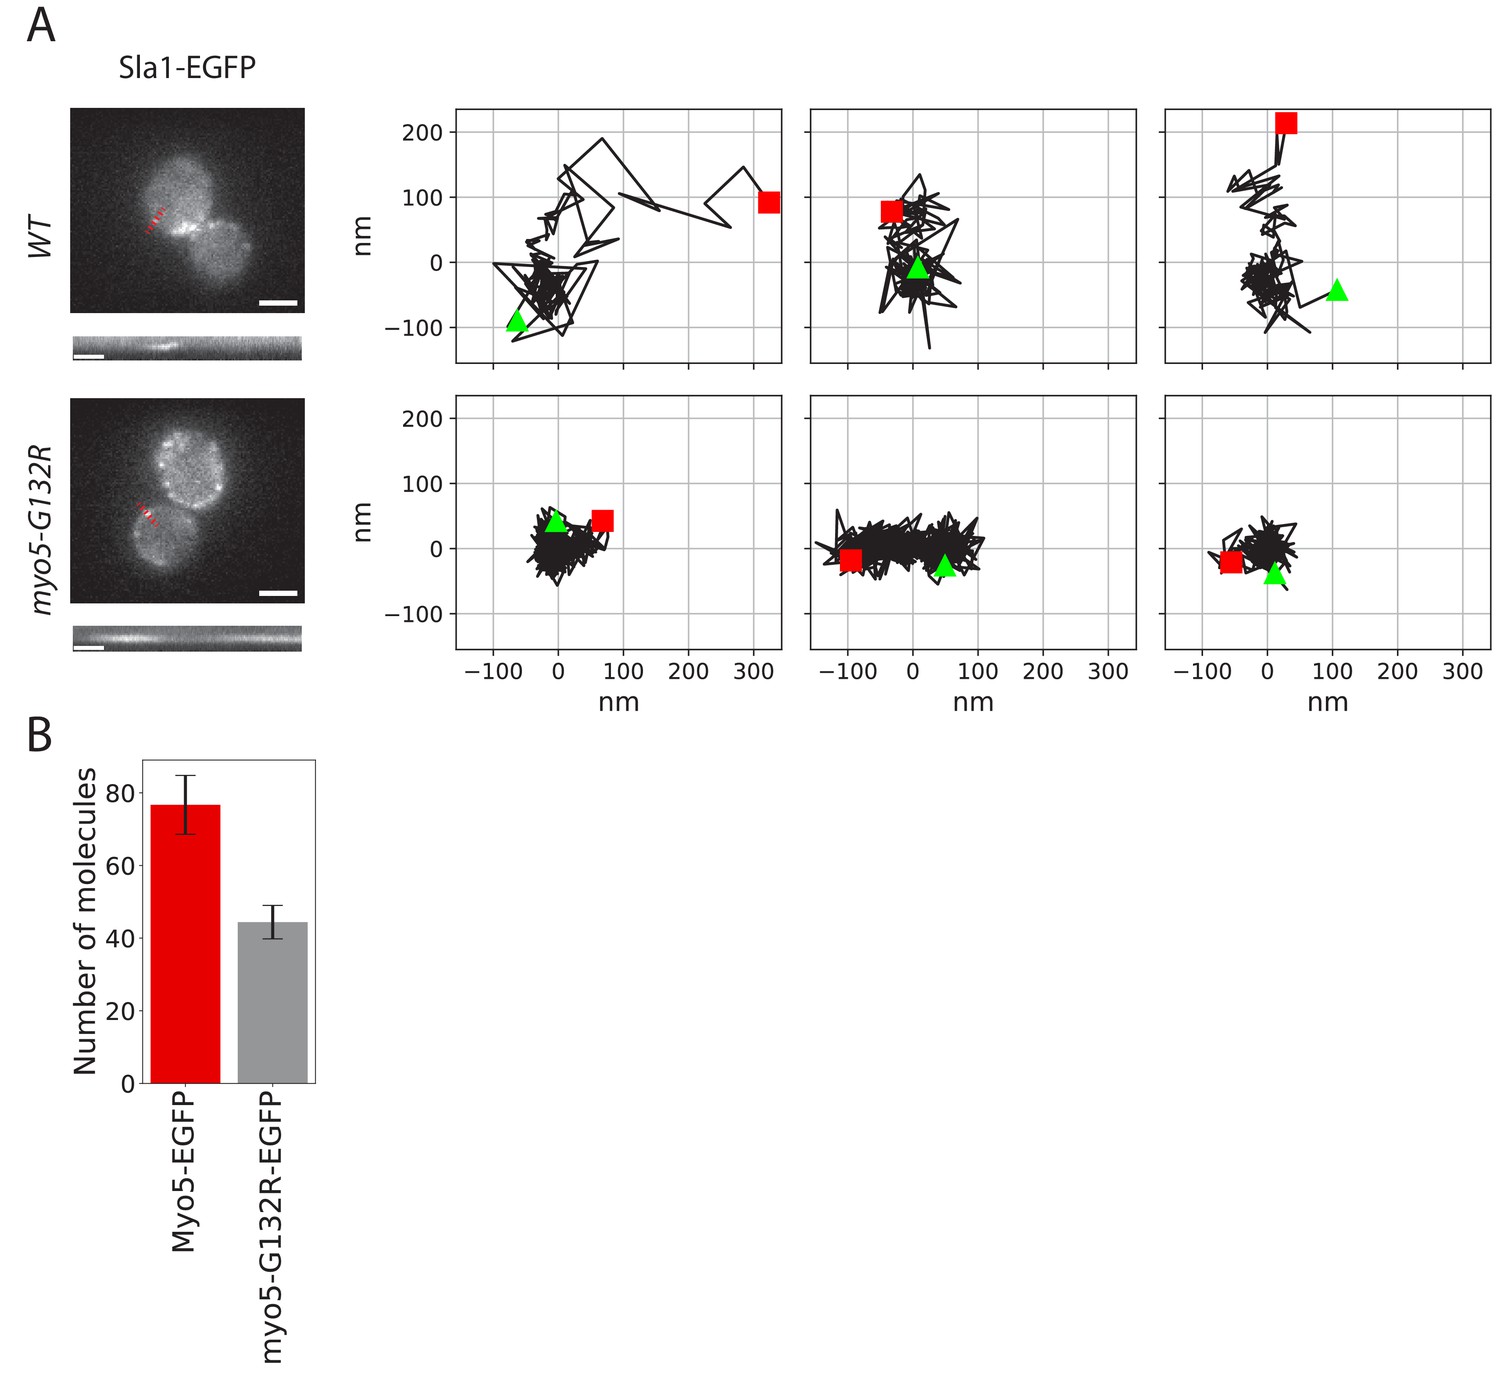
Endocytic protein dynamics in myo5-G132R cells.
(A) Left: Sla1-EGFP distribution in WT and myo5-G132R cells (scale bars: 2 μm) and kymographs of Sla1-EGFP patch movement (scale bars: 20 s). Right: Examples of Sla1-EGFP trajectories tracked in WT (top row) and myo5-G132R cells (bottom row). The trajectories are oriented so that the x-axis is parallel to the cell plasma membrane. The start and the end of each trajectory are marked by a green triangle and a red square respectively. (B) The median number of myo5-G132R-EGFP molecules recruited at the endocytic sites plotted aside the median number of Myo5-EGFP molecules as a comparison. Error bars are SEM.
-
Figure 4—source data 1
Figure 4A trajectory source data.
- https://doi.org/10.7554/eLife.44215.014
Figure 5
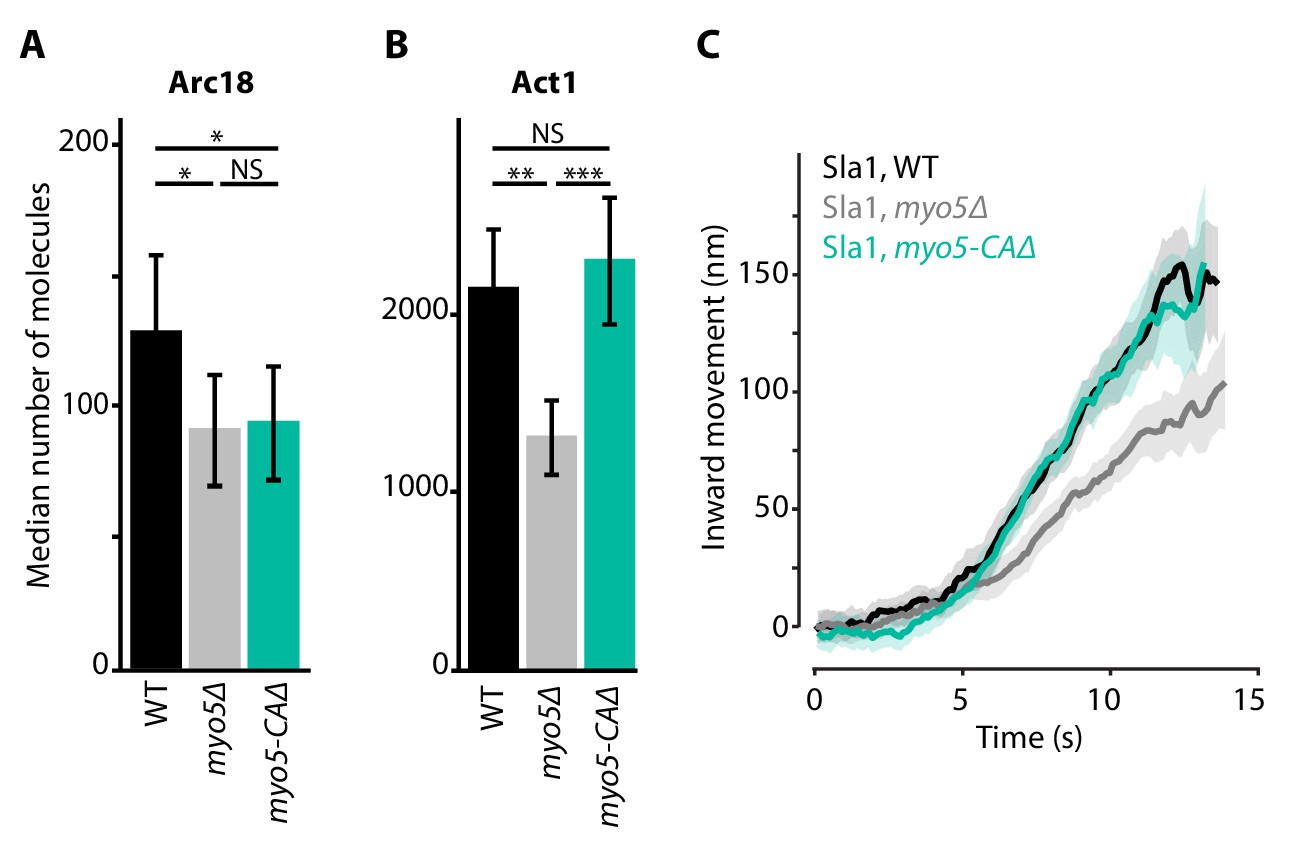
Actin network composition and Sla1 dynamics in myo5-CAΔ.
(A) Median number of Arc18 molecules per endocytic site in WT (black), myo5Δ (gray) and myo5-CAΔ (turquoise) cells. Error bars represent SEM. Molecule numbers were compared using 2-sided z-tests. (B) Act1 molecules in the same genotypes. (C) Sla1 centroid movement in the same genetic backgrounds (only the inward movement phase is plotted). WT and myo5Δ data are the same as in Figure 1. Shaded area depicts the 95% confidence interval. NS: not significant, *: p≤0.05, **: p≤0.01, ***: p≤0.001.
-
Figure 5—source data 1
Figure 5C average trajectory source data.
- https://doi.org/10.7554/eLife.44215.016
-
Figure 5—source data 2
The median number of molecules represented in Figure 5A and B.
- https://doi.org/10.7554/eLife.44215.017
Figure 6
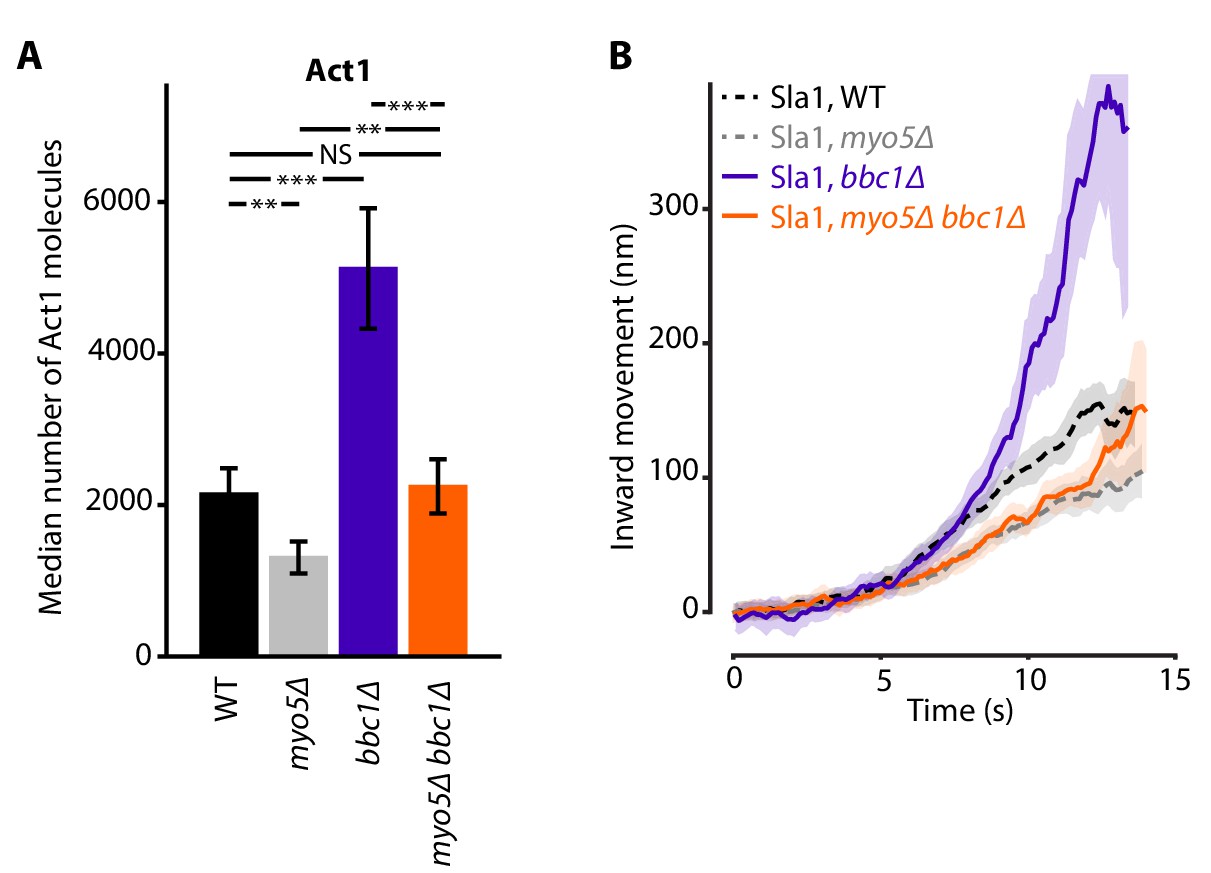
Actin content and Sla1 dynamics in myo5Δ bbc1Δ double deletion.
(A) Median number of Act1 molecules per endocytic site in WT, myo5Δ, bbc1Δ and myo5Δ bbc1Δ cells. Error bars are SEM. Values were compared using 2-sided z-tests. WT and myo5Δ data are the same as in Figure 1. (B) Centroid movement of Sla1-EGFP in the same genetic backgrounds. Only the inward movement phase is plotted. WT and myo5Δ trajectories are the same as in Figure 2. Shaded area represents 95% confidence interval. NS: not significant, *: p≤0.05, **: p≤0.01, ***: p≤0.001.
-
Figure 6—source data 1
Figure 6B average trajectory source data.
- https://doi.org/10.7554/eLife.44215.019
-
Figure 6—source data 2
The median number of Act1 molecules represented in Figure 6A.
- https://doi.org/10.7554/eLife.44215.020
Figure 7
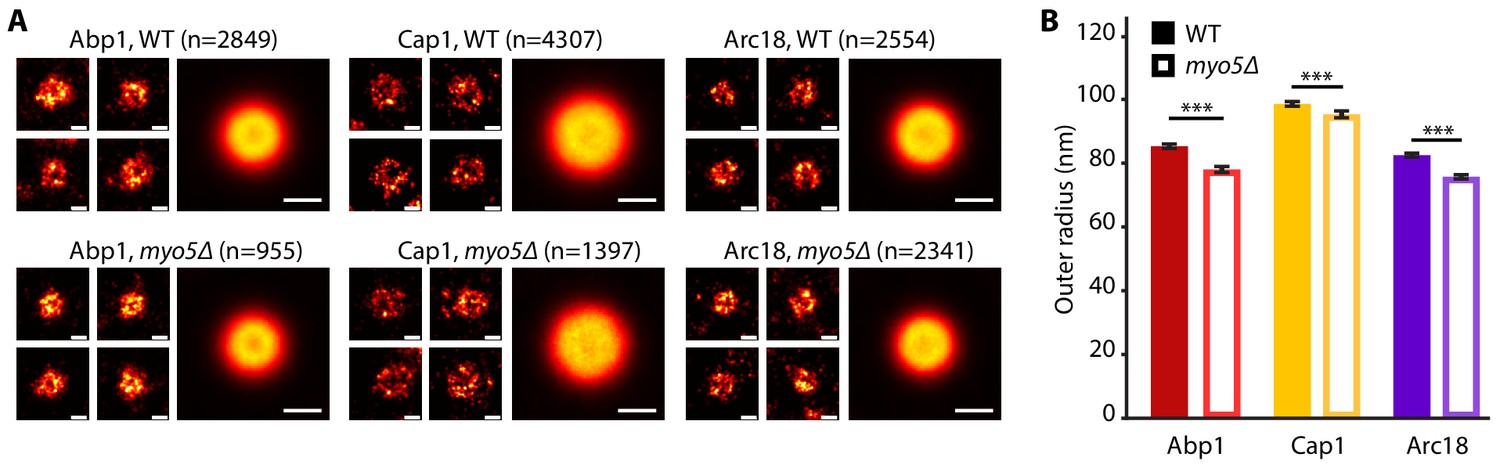
The endocytic network is slightly narrower in myo5Δ.
(A) Individual endocytic sites (small pictures) and average protein distributions (big pictures) imaged at the bottom focal plane of the cell for Abp1-mMaple, Cap1-mMaple or Arc18-mMaple in WT (top row) and myo5Δ (bottom row) cells. (B) Outer radii of the actin network components. Genotypes were compared using 2-sided t-tests. Scalebars: 100 nm. n = number of individual endocytic sites analyzed. ***: p≤0.001. WT data is from Mund et al. (2018).
-
Figure 7—source data 1
The outer radius measurements represented in Figure 7B.
- https://doi.org/10.7554/eLife.44215.022
Figure 8 with 1 supplement
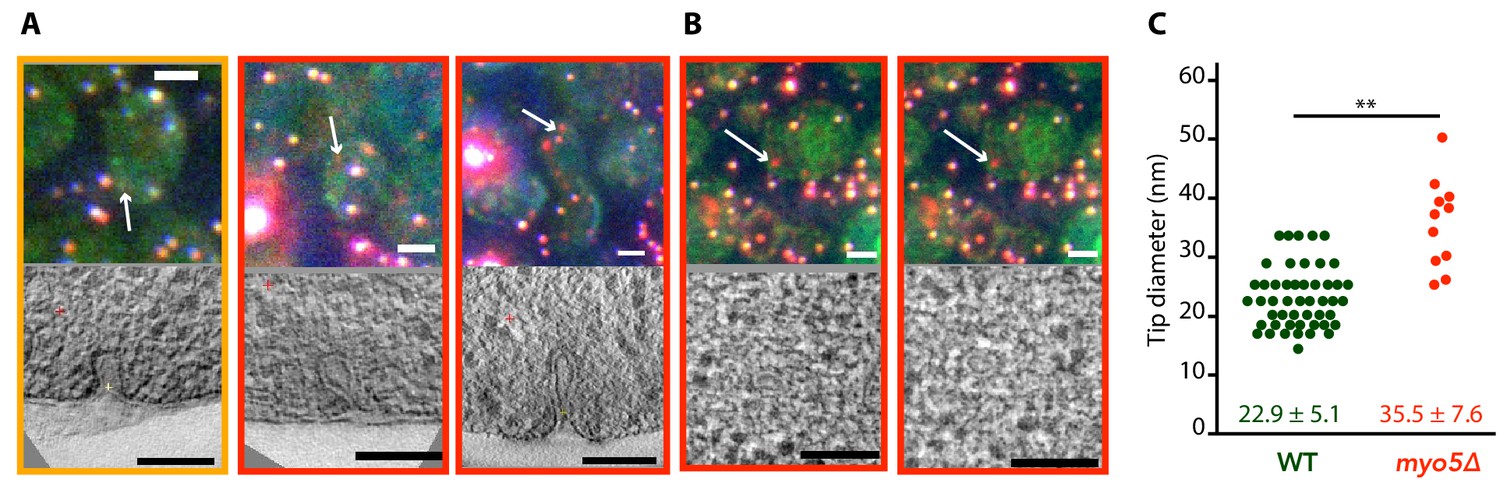
Membrane reshaping in myo5Δ.
(A) and (B): Gallery of light microscopy (top) and electron tomography (bottom) images of invaginations (A) and vesicles (B) found in myo5Δ Sla1-EGFP Abp1-mCherry cells. The correlated fluorescent spots are indicated by arrows. Note that in (B) the same fluorescent spot correlated with two vesicles. The color of the border corresponds to the markers that were present in the endocytic spot (yellow: Sla1-EGFP + Abp1 mCherry, red: only Abp1-mCherry). Scalebars: 2 μm in light microscopy images, 100 nm in electron tomogram slices. (C) Diameter of the invagination tip. Only invaginations longer than 40 nm were included. WT data (green) from Kukulski et al. (2012a). **: p≤0.01.
Figure 8—figure supplement 1
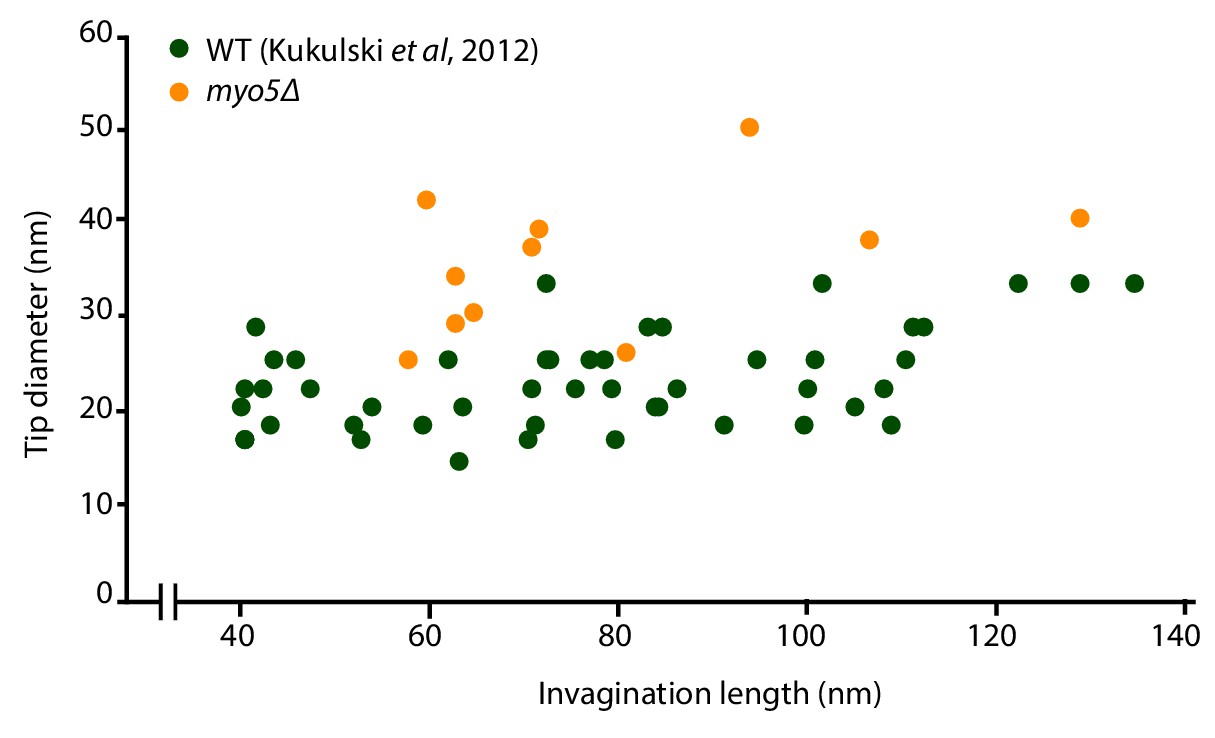
Endocytic invaginations found in myo5Δ cells Invagination tip diameter plotted as a function of invagination length.
Only invaginations longer than 40 nm were included. WT data from Kukulski et al. (2012b).
Figure 9
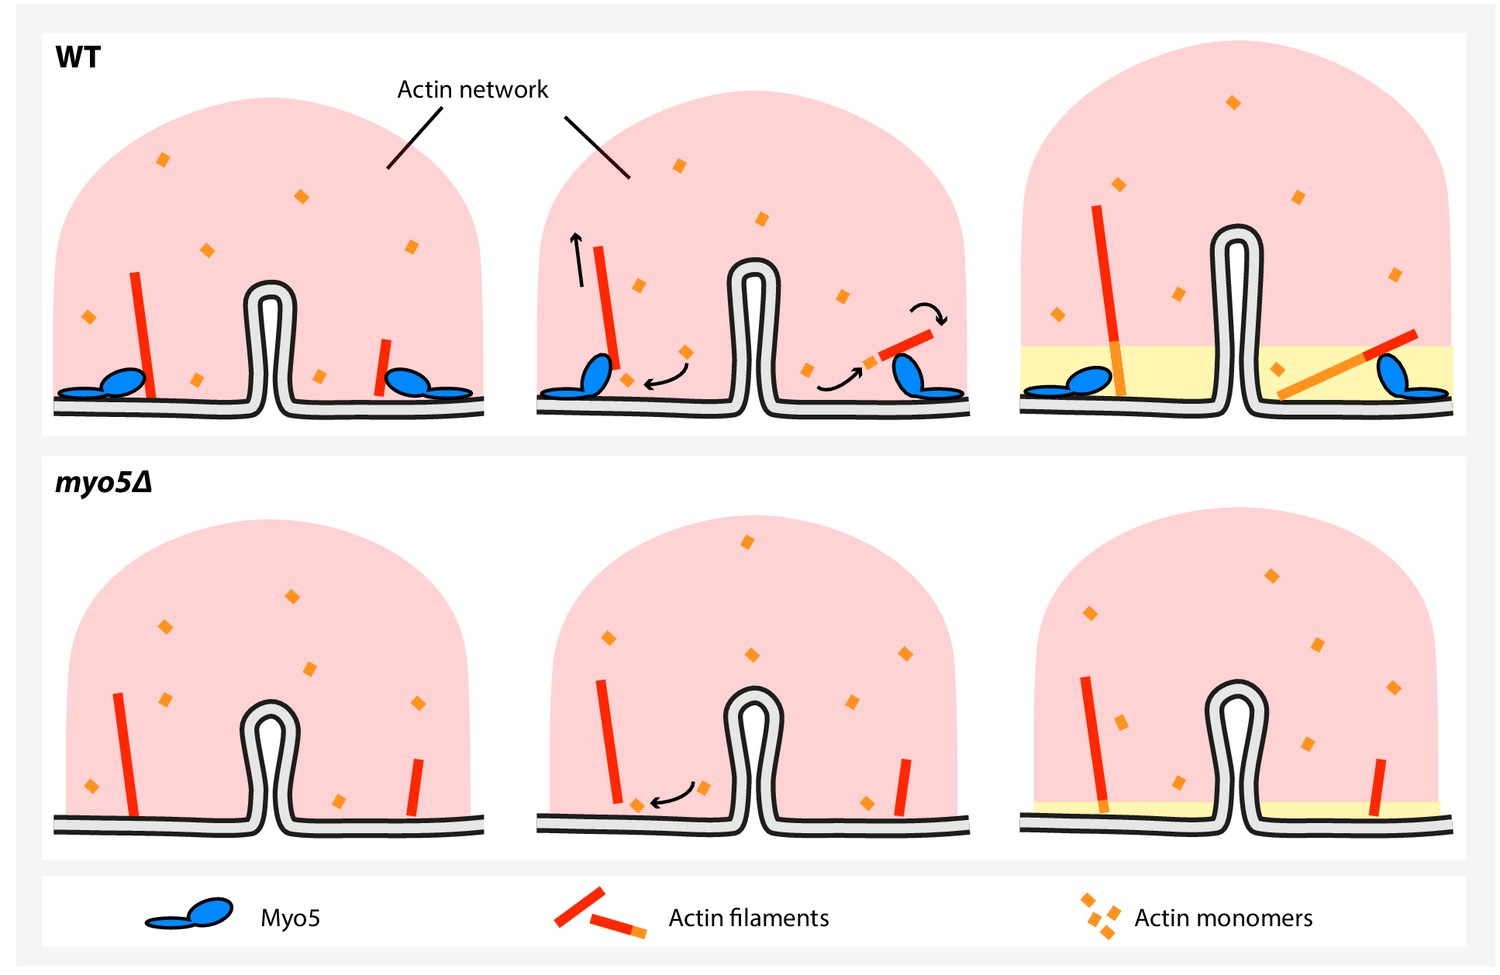
A model for myosin-I function during endocytosis in yeast.
In WT cells (top), myosin-I reorients or translocates actin filaments whose barbed ends are blocked against the plasma membrane. The barbed ends become accessible to actin monomers again and continue to grow, resulting in actin network expansion. The growing network is coupled to the invagination tip, leading to elongation of the membrane tube. In the myo5Δ strain (bottom), many filaments get stuck, decreasing actin polymerization and impairing actin network growth, resulting in slower membrane invagination.
Additional files
-
Supplementary file 1
The supplemental tables.
Supplemental table 1: Sla1 centroid speeds per genotype. Supplemental table 2: Myosin molecule numbers per genotype. Supplemental table 3: Yeast strains used in this work. Supplemental table 4: Plasmids used in this work. Supplemental table 5: Number of trajectories per dataset. Supplemental table 6: Number of analyzed endocytic sites for quantification of molecule numbers. Supplemental table 7: Summary of CLEM data.
- https://doi.org/10.7554/eLife.44215.026
-
Transparent reporting form
- https://doi.org/10.7554/eLife.44215.027
Download links
A two-part list of links to download the article, or parts of the article, in various formats.
Downloads (link to download the article as PDF)
Open citations (links to open the citations from this article in various online reference manager services)
Cite this article (links to download the citations from this article in formats compatible with various reference manager tools)
Type-I myosins promote actin polymerization to drive membrane bending in endocytosis
eLife 8:e44215.
https://doi.org/10.7554/eLife.44215


