Expression of WIPI2B counteracts age-related decline in autophagosome biogenesis in neurons
- Perelman School of Medicine, University of Pennsylvania, United States
- The Francis Crick Institute, United Kingdom
Figures
Figure 1 with 1 supplement
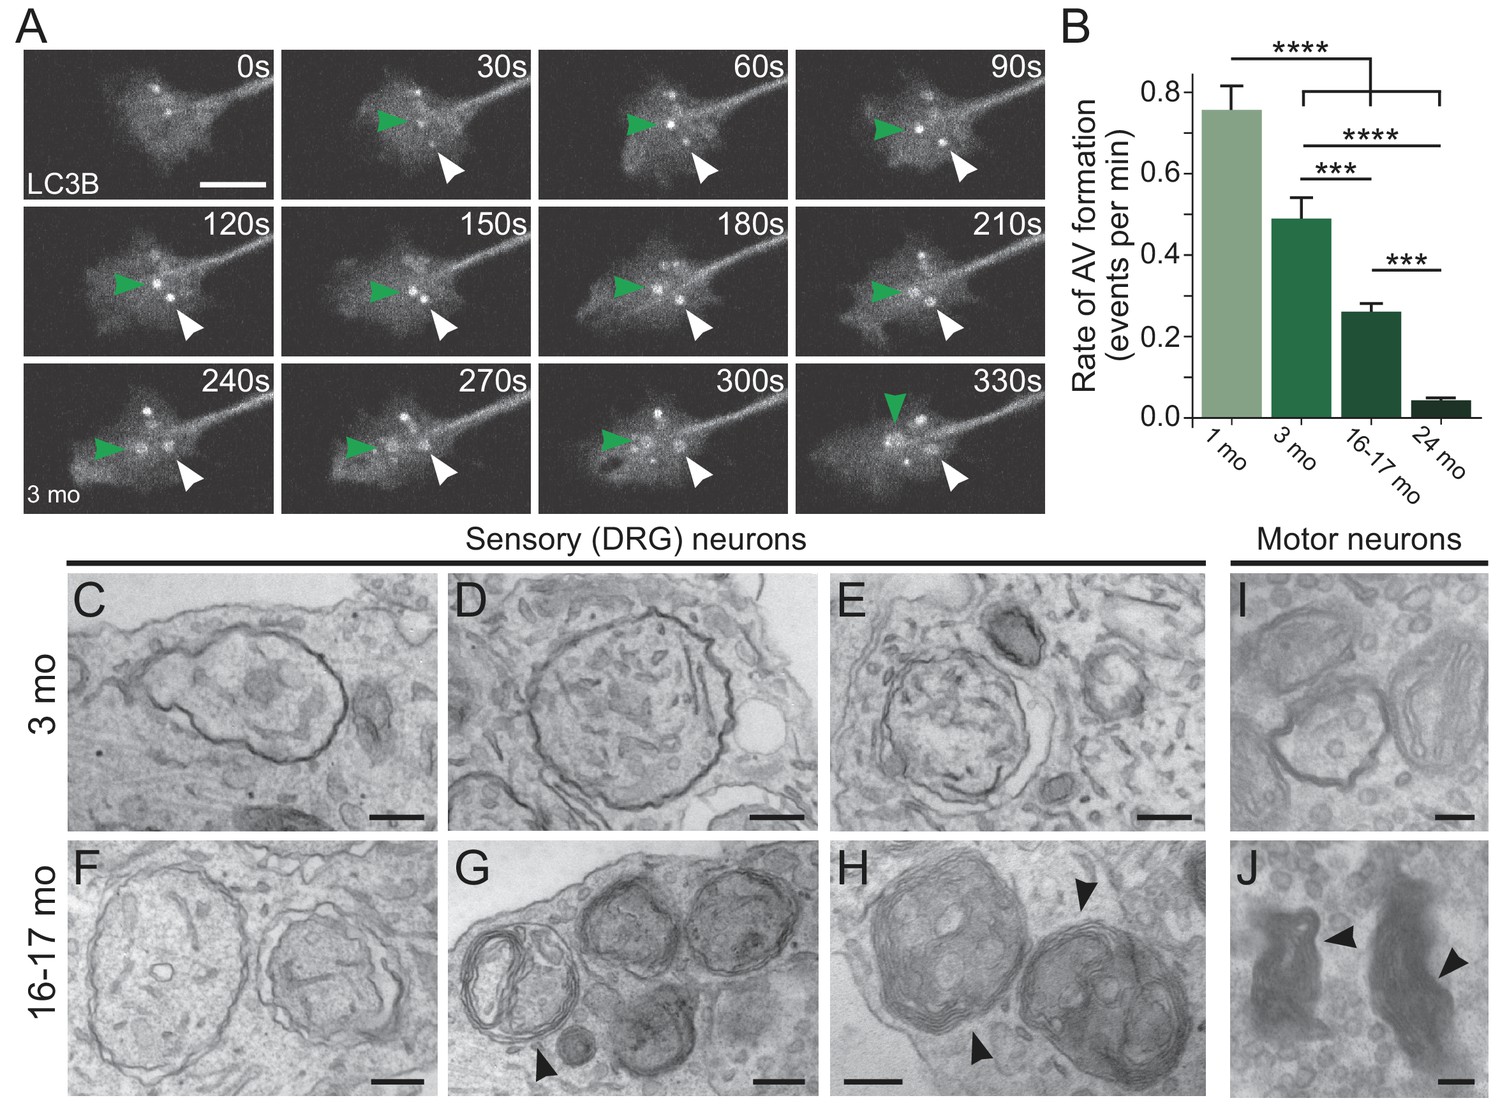
Autophagosome biogenesis decreases with age and results in aberrant AV formation in mammalian neurons.
(A) Time series of GFP-LC3B in the distal axon of a DRG neuron from a young adult mouse. Green and white arrowheads each follow one autophagosome biogenesis event. Retrograde is to the right. Scale bar, 2 μm. (B) Quantification of the rate of autophagic vesicle (AV) biogenesis (assayed by GFP-LC3B puncta formation per minute) in DRG neurons from young (one mo, light green), young adult (three mo, green), aged (16–17 mo, dark green), and advanced aged (24 mo, very dark green) mice (mean ± SEM; n ≥ 54 neurons from three biological replicates). ***p<0.0005; ****p<0.0001 by one-way ANOVA test with Tukey’s multiple comparisons test. (C–E) Representative electron micrographs of autophagosomes in DRG distal tips from young adult mice. AVs are composed of a continuous double membrane enclosing engulfed cytoplasm. Scale bars, 200 nm. (F–H) Representative electron micrographs of autophagosomes in DRG distal tips from aged mice. AVs contain multiple, ruffled double membranes (G, H). Scale bars, 200 nm. (I–J) Electron micrographs of autophagosomes in the presynaptic compartment of neuromuscular junctions (NMJs) from young adult (I) and aged (J) mice. Scale bars, 100 nm. Arrowheads indicate multilamellar membranes in DRGs and NMJs.
Figure 1—figure supplement 1

Morphological differences in autophagosomes in neurons from young adult and aged mice.
(A–B) Electron micrographs of DRG distal tips from young adult (A) or aged (B) mice. Scale bars, 200 nm. (C–E) Representative electron micrographs of autophagosomes in DRG axonal distal tips from young adult mice. Scale bars, 200 nm. (F–M) Representative electron micrographs of autophagosomes in DRG axonal distal tips from aged mice. Scale bars, 200 nm. (N) Representative electron micrograph of an autophagosome in a NMJ from an aged mouse. Scale bar, 200 nm. (O–P) Lower magnification electron micrographs of Figure 1I and J of autophagosomes in the presynaptic compartment of NMJs from young adult (O) and aged (P) mice. Dashed boxes indicate corresponding magnified regions in Figure 1I–1J. Scale bar in O, 500 nm; in P, 2 μm.
Figure 2
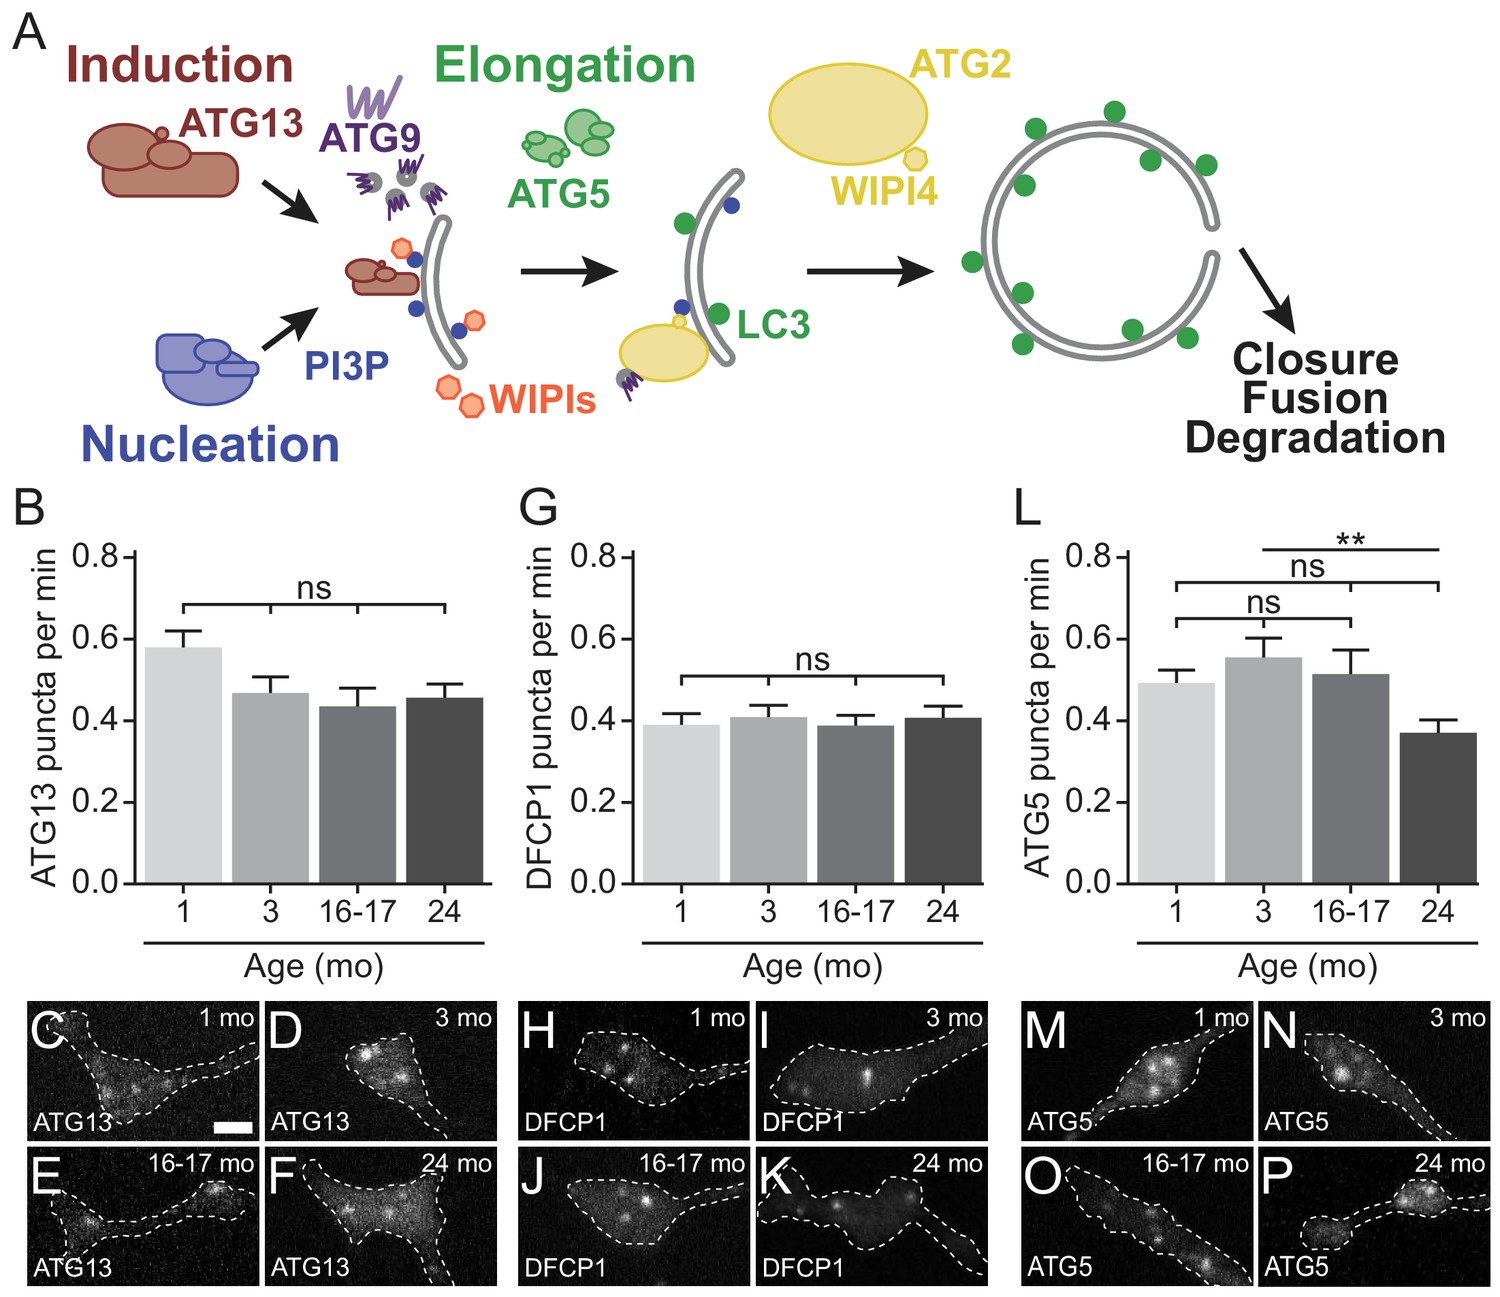
Early autophagosome biogenesis components do not change with age.
(A) Schematic of autophagy pathway, focusing on the protein complexes involved in autophagosome biogenesis: induction (red), nucleation (blue), elongation (green), and ATG2/WIPI4 (yellow). ATG9, a multi-pass transmembrane protein is in purple. The product of the nucleation complex, PI3P, is depicted as a blue dot, while LC3-II, the product of the elongation complex, is depicted as a green dot. WIPI1 and WIPI2, which bind to PI3P, are displayed in orange. (B) Quantification of the rate of mCh-ATG13 puncta formation in live-cell imaging of DRG neurons from young, young adult, aged, and advanced aged mice (mean ± SEM; n ≥ 28 neurons from three biological replicates). ns, not significant by Kruskal-Wallis ANOVA test with Dunn’s multiple comparisons test. (C–F) Representative micrographs of mCh-ATG13 in the distal tip of DRG neurons from young (C), young adult (D), aged (E), and advanced aged (F) mice. (G) Quantification of the rate of Halo-DFCP1 puncta in DRG neurons from young, young adult, aged, and advanced aged mice (mean ± SEM; n ≥ 18 neurons from three biological replicates). ns, not significant by Kruskal-Wallis ANOVA test with Dunn’s multiple comparisons test. (H–K) Representative micrographs of Halo-DFCP1 in the distal tip of DRG neurons from young (H), young adult (I), aged (J), and advanced aged (K) mice. (L) Quantification of the rate of mCh-ATG5 puncta in DRG neurons from young, young adult, aged, and advanced aged mice (mean ± SEM; n ≥ 34 neurons from three biological replicates). ns, not significant; **p<0.001 by Kruskal-Wallis ANOVA test with Dunn’s multiple comparisons test. (M–P) Representative micrographs of mCh-ATG5 in the distal tip of DRG neurons from young (M), young adult (N), aged (O), and advanced aged (P) mice. Scale bar in C, 2 μm, for C-F, H-K, M-P.
Figure 3 with 1 supplement
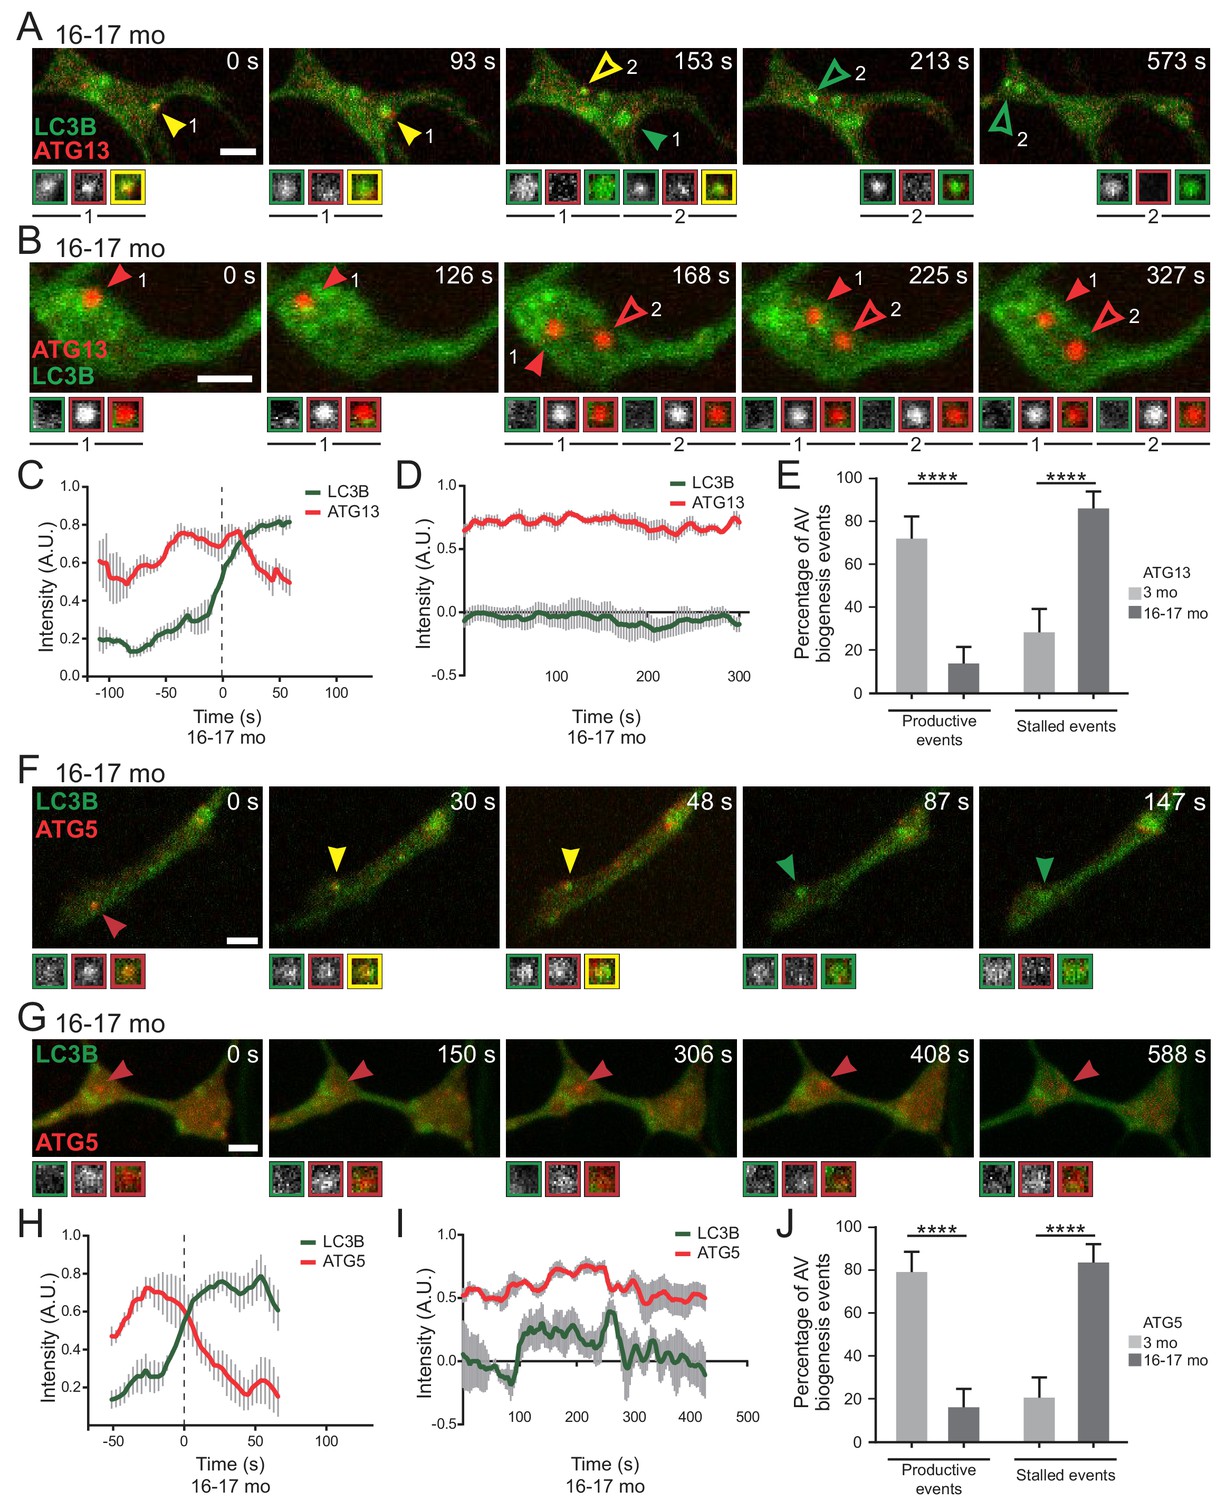
Stalled AVs predominate in neurons from aged mice.
(A–B) Time series of merge micrographs of mCh-ATG13 and GFP-LC3B from live cell imaging of the distal neurite of DRGs from aged mice depicting a productive (A) or a stalled (B) autophagosome biogenesis event. Yellow arrowheads denote colocalization of mCh-ATG13 and GFP-LC3B; green arrowheads denote a GFP-LC3B-positive punctum from which mCh-ATG13 has dissociated; red arrowheads denote mCh-ATG13-positive puncta that fail to recruit GFP-LC3B; solid arrowheads track one punctum, hollow arrowheads follow a second punctum. Magnified views of denoted puncta are shown below full micrograph; border color represents channel or colocalization state in merge. Retrograde is to the right. Scale bars, 2 μm. (C–D) Individual intensity profiles were averaged to improve signal-to-noise of mCh-ATG13 (red) and GFP-LC3B (green) for productive (C) and stalled (D) AVs (mean ± SEM; n ≥ 5 biogenesis events from five neurons from three biological replicates). (E) Quantification of the proportion of total mCh-ATG13-positive AV biogenesis events (both productive and stalled events) in DRG neurons from young adult (light gray) and aged (dark gray) mice (mean ± 95% confidence interval; n ≥ 62 AVs from three biological replicates for each condition). ****p<0.0001 by Fisher’s exact test. (F–G) Time series of merge micrographs of mCh-ATG5 and GFP-LC3B in the distal neurite of DRGs from aged mice depicting a productive (F) or stalled (G) autophagosome biogenesis event. Arrowheads point to puncta magnified below micrograph; colors denote channel or colocalization state in merge. Scale bars, 2 μm. (H–J) Mean intensity profiles of mCh-ATG5 (red) and GFP-LC3B (green) for productive (H) and stalled (I) AVs (mean ± SEM; n = 5 productive biogenesis events from five neurons or n = 4 stalled biogenesis events from four neurons from three biological replicates). Vertical dashed line in (C and H) indicates the half-maximum of GFP-LC3B intensity, which was used to align the traces. (J) Quantification of the proportion of total mCh-ATG5-positive AV biogenesis events (both productive and stalled events) in DRG neurons from young adult and aged mice (mean ± 95% confidence interval; n ≥ 62 AVs from three biological replicates for each condition). ****p<0.0001 by Fisher’s exact test. See also Videos 1–6.
Figure 3—figure supplement 1
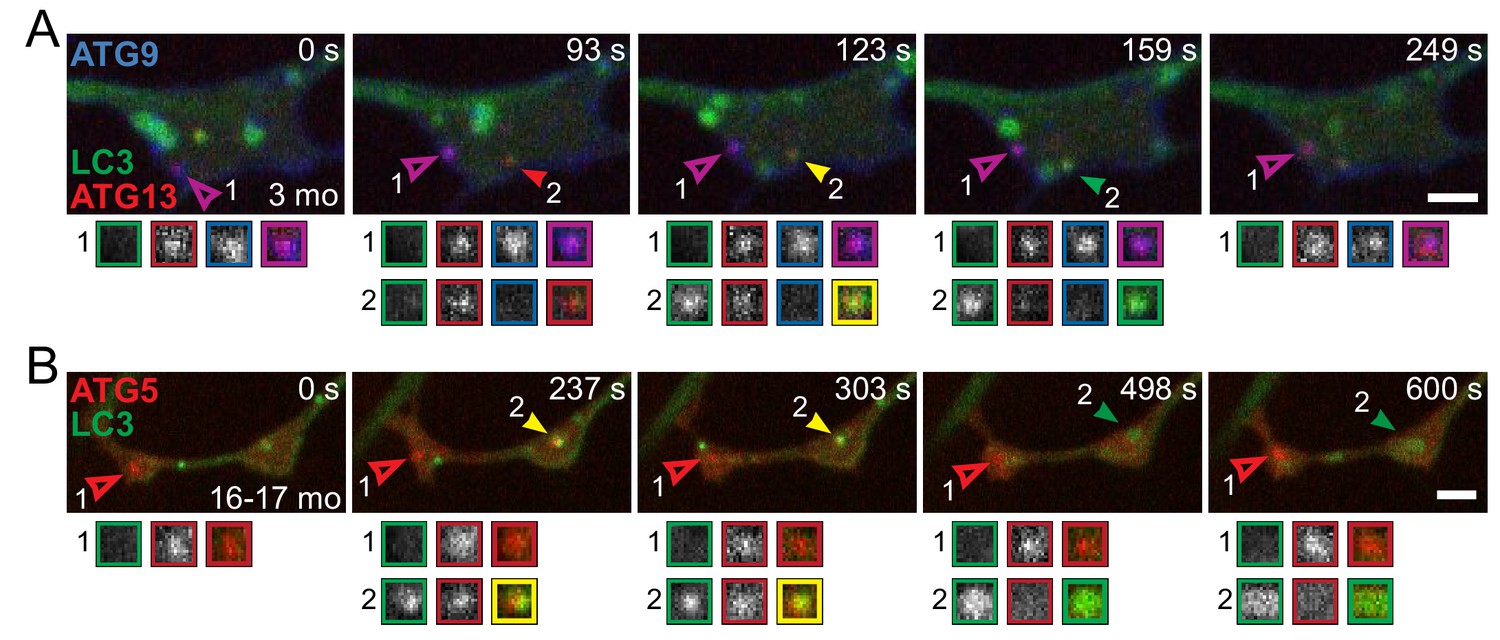
Productive and stalled AVs occur in the same axonal tips.
(A) Time series of GFP-LC3B, mCh-ATG13, and SNAP-ATG9 in the distal neurite of a DRG neuron from a young adult mouse depicting a productive autophagosome biogenesis event (solid arrowhead, #2) and a stalled biogenesis event (outlined arrowhead, #1). (B) Time series of GFP-LC3B and mCh-ATG5 in the distal neurite of a DRG neuron from an aged mouse depicting a productive autophagosome biogenesis event (solid arrowhead, #2) and a stalled biogenesis event (outlined arrowhead, #1). Magnified views of denoted puncta are shown below full micrograph; border color represents channel or colocalization state in merge. Retrograde is to the right. Scale bars, 2 μm.
Figure 4 with 1 supplement
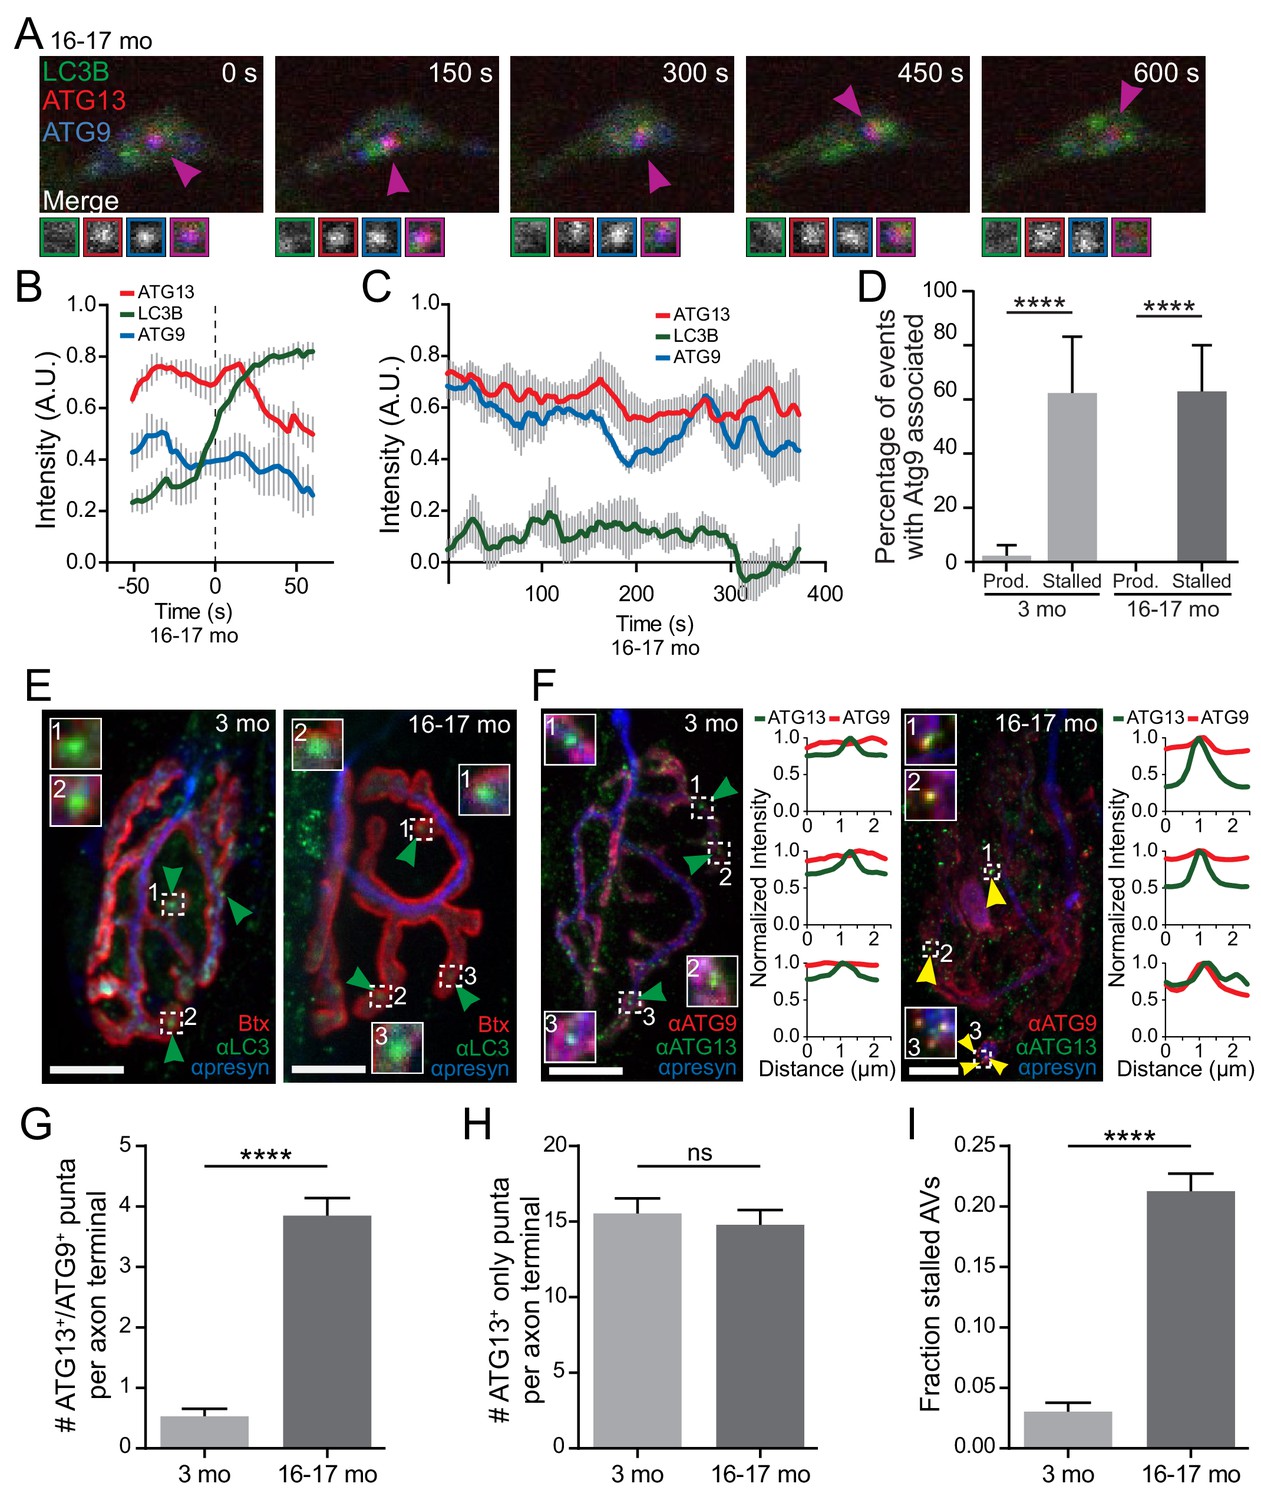
Atg9, a multi-pass transmembrane protein, aberrantly associates with stalled AVs in vitro and in vivo.
(A) Time series of live imaging of mCh-ATG13, SNAP-ATG9, and GFP-LC3B in the distal neurite of a DRG neuron from an aged mouse depicting a stalled AV. Magenta arrowheads indicate colocalization between mCh-ATG13 and SNAP-ATG9 without GFP-LC3B. Magnified views of denoted puncta are shown below full micrograph; border color represents channel or colocalization state in merge. Retrograde is to the right. Scale bar, 2 μm. (B–C) Mean intensity profiles of mCh-ATG13 (red), SNAP-ATG9 (blue), and GFP-LC3B (green) for productive (B) and stalled (C) AVs in DRG distal tips from aged mice (mean ± SEM; n = 5 biogenesis events from five neurons from three biological replicates for each graph). Vertical dashed line in (B) indicates the half-maximum of GFP-LC3B intensity, which was used to align the traces. (D) Quantification of the percentage of AVs that have SNAP-ATG9 associated in the distal neurites of DRGs from young adult and aged mice (mean ± 95% confidence interval; n ≥ 17 for each age group). ****p<0.0001 by two-tailed Fisher’s exact test. (E–F) Maximal projection micrographs of NMJs from young adult (three mo) and aged mice (16–17 mo). In panel (E), NMJs were stained with α-Bungarotoxin-tetramethylrhodamine (Btx) to stain the endplate, anti-SV2 together with anti-neurofilament H (both in blue) to visualize the presynaptic motor neuron, and anti-LC3B to visualize AVs at the synapse. In panel (F), NMJs from young and aged mice were stained with the presynaptic markers SV2 and neurofilmament H (together in blue), as well as antibodies to ATG9 (red) and ATG13 (green). Dashed boxes indicate magnified insets; line scans of ATG9 (red) and ATG13 (green) intensities at the indicated puncta are also shown. Scale bars, 10 μm. Arrowheads denote LC3B AVs (E) or the colocalization state of ATG13 with ATG9 at AVs (F). (G–I) Quantification of micrographs of NMJs from young adult (gray) and aged (dark gray) mice stained with Btx, anti-SV2, anti-neurofilament H, anti-ATG13, and anti-ATG9. (G) Quantification of stalled AVs, defined as colocalization of ATG13 and ATG9 at puncta, in the NMJ motor axon terminal. (H) Quantification of ATG13 puncta that do not have colocalized ATG9 in the NMJ motor axon terminal. (I) Quantification of the fraction of stalled AVs out of the total ATG13-positive puncta in the NMJ motor axon terminal. In G-I, mean ± SEM; n ≥ 62 motor axon terminals for each age from three biological replicates. ****p<0.0001, ns = 0.3443 by Mann-Whitney t tests. See also Videos 3,4,7.
Figure 4—figure supplement 1

NMJ immunohistochemistry.
(A–D) Individual channels of maximal projection micrographs of NMJs from young adult (three mo) and aged mice (16–17 mo) shown in Figure 4E–F. (A–B), NMJs were stained with α- Btx to stain the endplate, anti-SV2 together with anti-neurofilament H (NFH) (both in blue) to visualize the presynaptic motor neuron, and anti-LC3B to visualize AVs at the synapse. (C–D), NMJs from young and aged mice were stained with the anti-SV2 and anti-NFH (together in blue), as well as anti- ATG9 and anti-ATG13. Scale bars, 10 μm. Arrowheads denote LC3B AVs (A–B) or the colocalization state of ATG13 with ATG9 at AVs (C–D). Merge micrographs are the same as in Figure 4E–F.
Figure 5 with 1 supplement
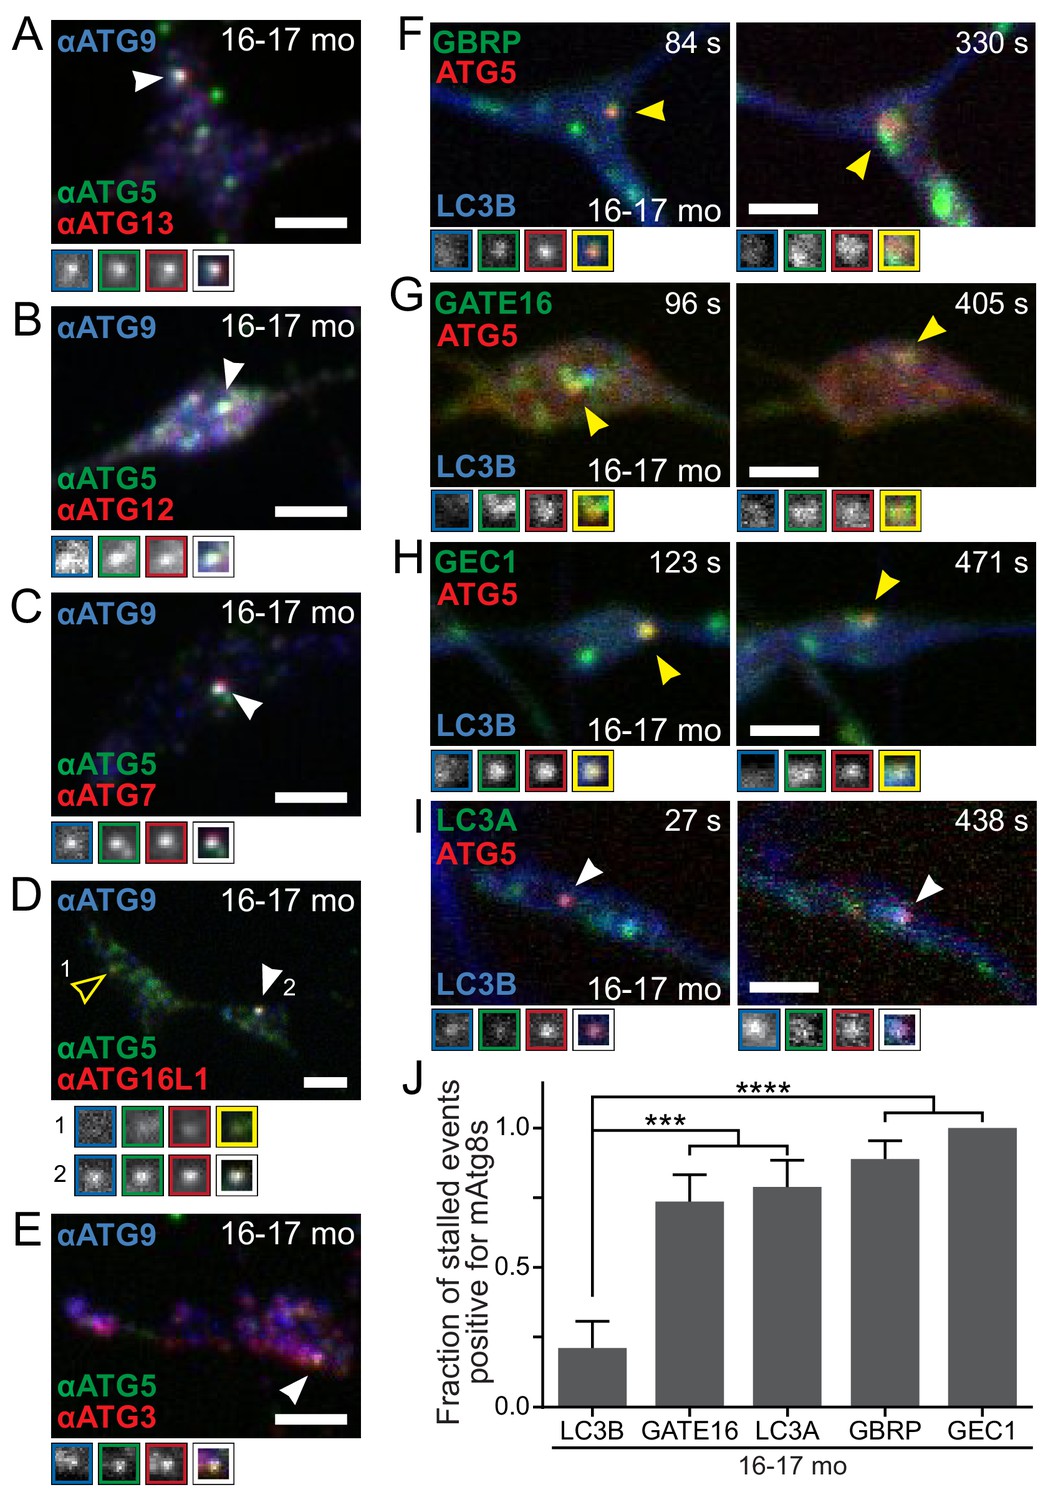
Recruitment of autophagy machinery, including LC3B homologs, to stalled AVs is not sufficient to rescue the biogenesis defect.
(A–E) Representative maximal projection micrographs of the distal neurites of fixed DRG neurons from aged mice. Stalled AVs are identified by colocalization of anti-ATG5 (green) and anti-ATG9 (blue). Antibodies to other autophagy components are visualized in red: ATG13 (A) or elongation complex components ATG12 (B), ATG7 (C), ATG16L1 (D), and ATG3 (E). Arrowheads denote colocalization state of AVs (stalled, filled arrowheads). Borders of magnifications of indicated puncta denote channel or colocalization state in merge. (F–I) Time series (channels merged) of Halo-ATG5, mAtg8s (mCh-GABARAP in F, mCh-GABARAPL2/GATE16 in G, mCh-GABARAPL1/GEC1 in H, and mScarlet-LC3A in I), and GFP-LC3B in the distal neurite of DRG neurons from aged mice depicting stalled AVs. Arrowheads denote colocalization of mAtg8s with stalled AVs. Magnified views of denoted puncta are shown below full micrograph; border color represents channel or colocalization state in merge. Time is indicated as time since stalled AV was first visible. (J) Quantification of the fraction of stalled AVs co-recruiting each LC3/GABARAP family member when individually overexpressed in DRGs from aged mice (mean ± SEM; n ≥ 10 stalled AVs in three biological replicates for each mAtg8). ***p<0.001; ****p<0.0001 by two-tailed Fisher’s exact test. Scale bars, 2 μm.
Figure 5—figure supplement 1
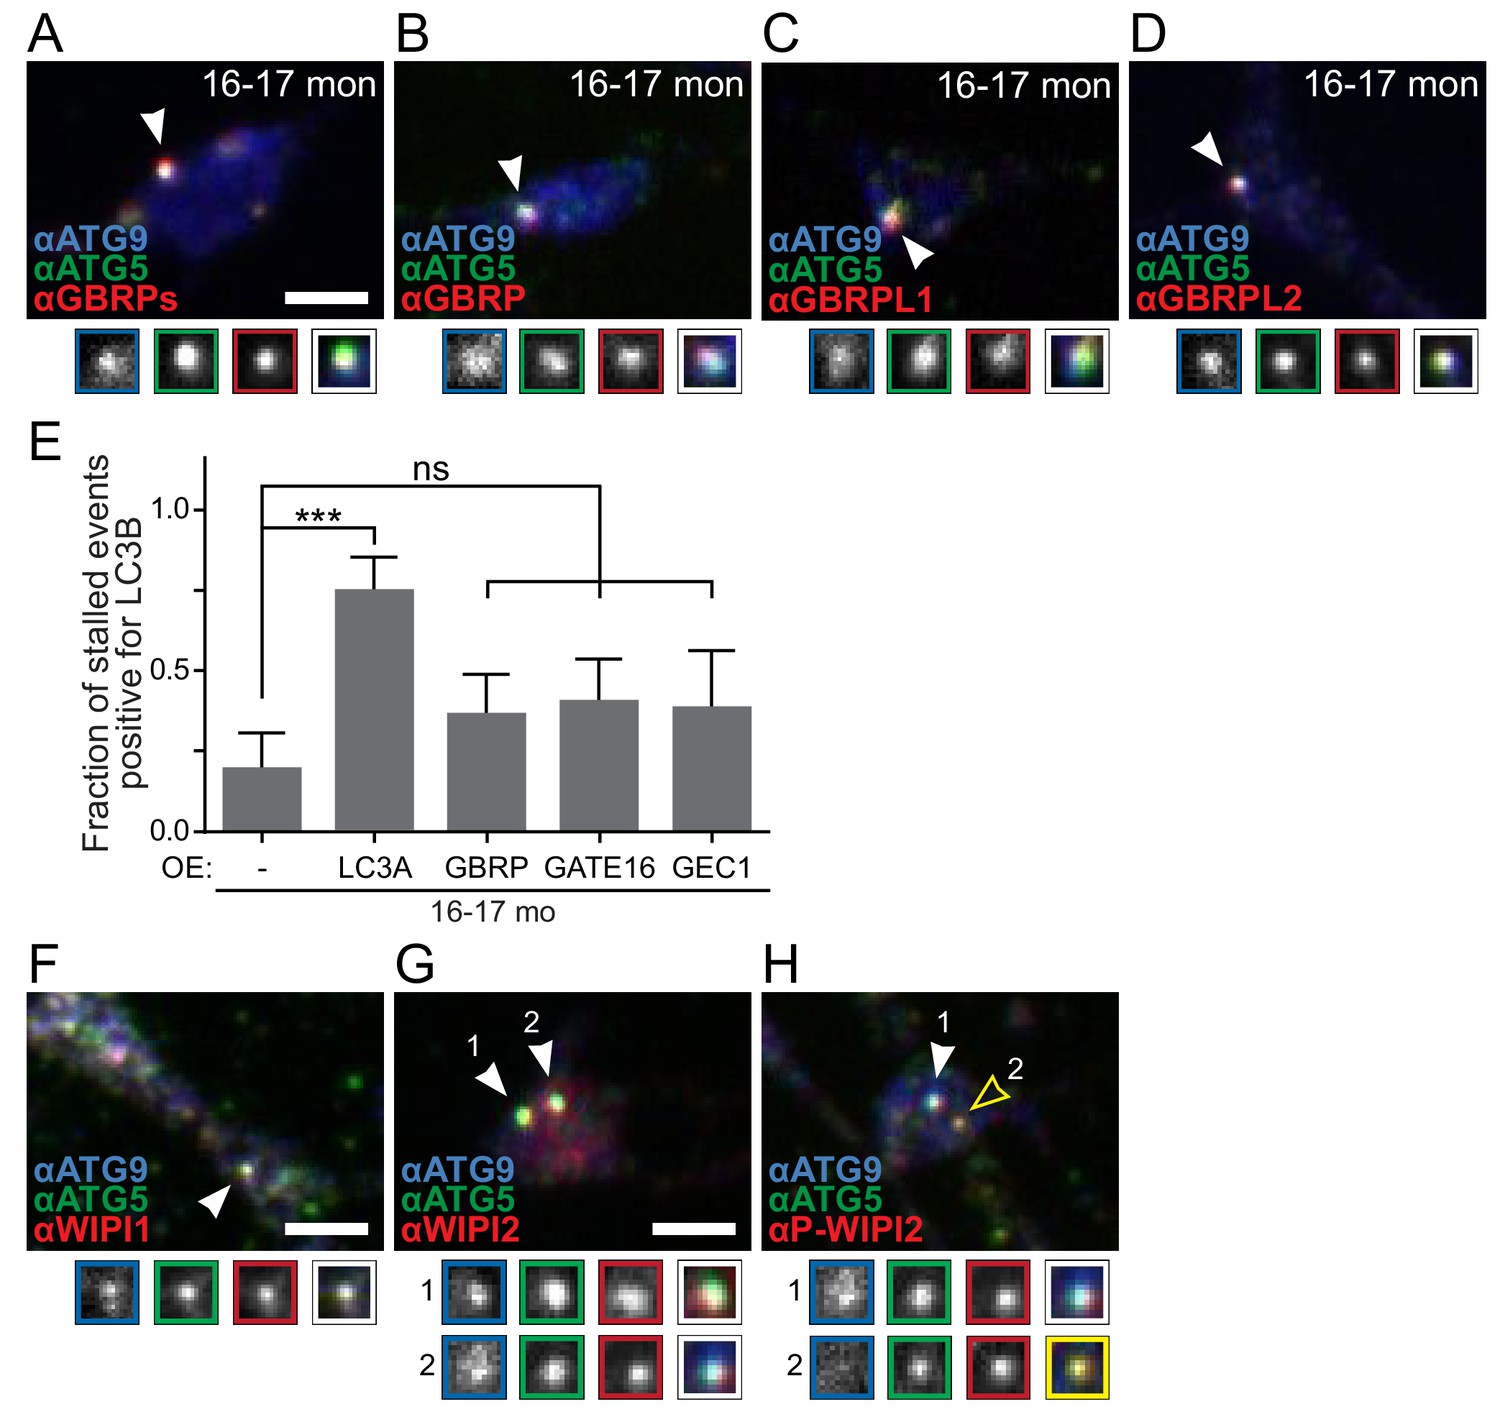
Endogenous mAtg8s are recruited to stalled AVs in vitro.
(A–D) Representative maximal projection immunocytochemistry micrographs of ATG5 and ATG9 with mAtg8 homologs GABARAPs (A), GABARAP (B), GABARAPL1/GEC1 (C), and GABARAPL2/GATE-16 (D) in the distal neurites of DRG neurons from aged mice. (E) Quantification of the fraction of stalled events that are LC3B-positive in DRG neurons from aged mice with control or overexpression of individual mAtg8s (mean ± 95% confidence interval; n ≥ 10 AVs from three biological replicates). ***p=0.0002, ns >0.05 by Fisher’s exact test. (F–H) Representative maximal projection immunocytochemistry micrographs of ATG5 and ATG9 with WIPI1 (F), WIPI2 (G), and phospho-WIPI2 (H). Arrowheads denote colocalization state of AVs. Magnified views of denoted puncta are shown below full micrograph; border color represents channel or colocalization state in merge. Scale bar, 2 μm for all panels.
Figure 6 with 2 supplements
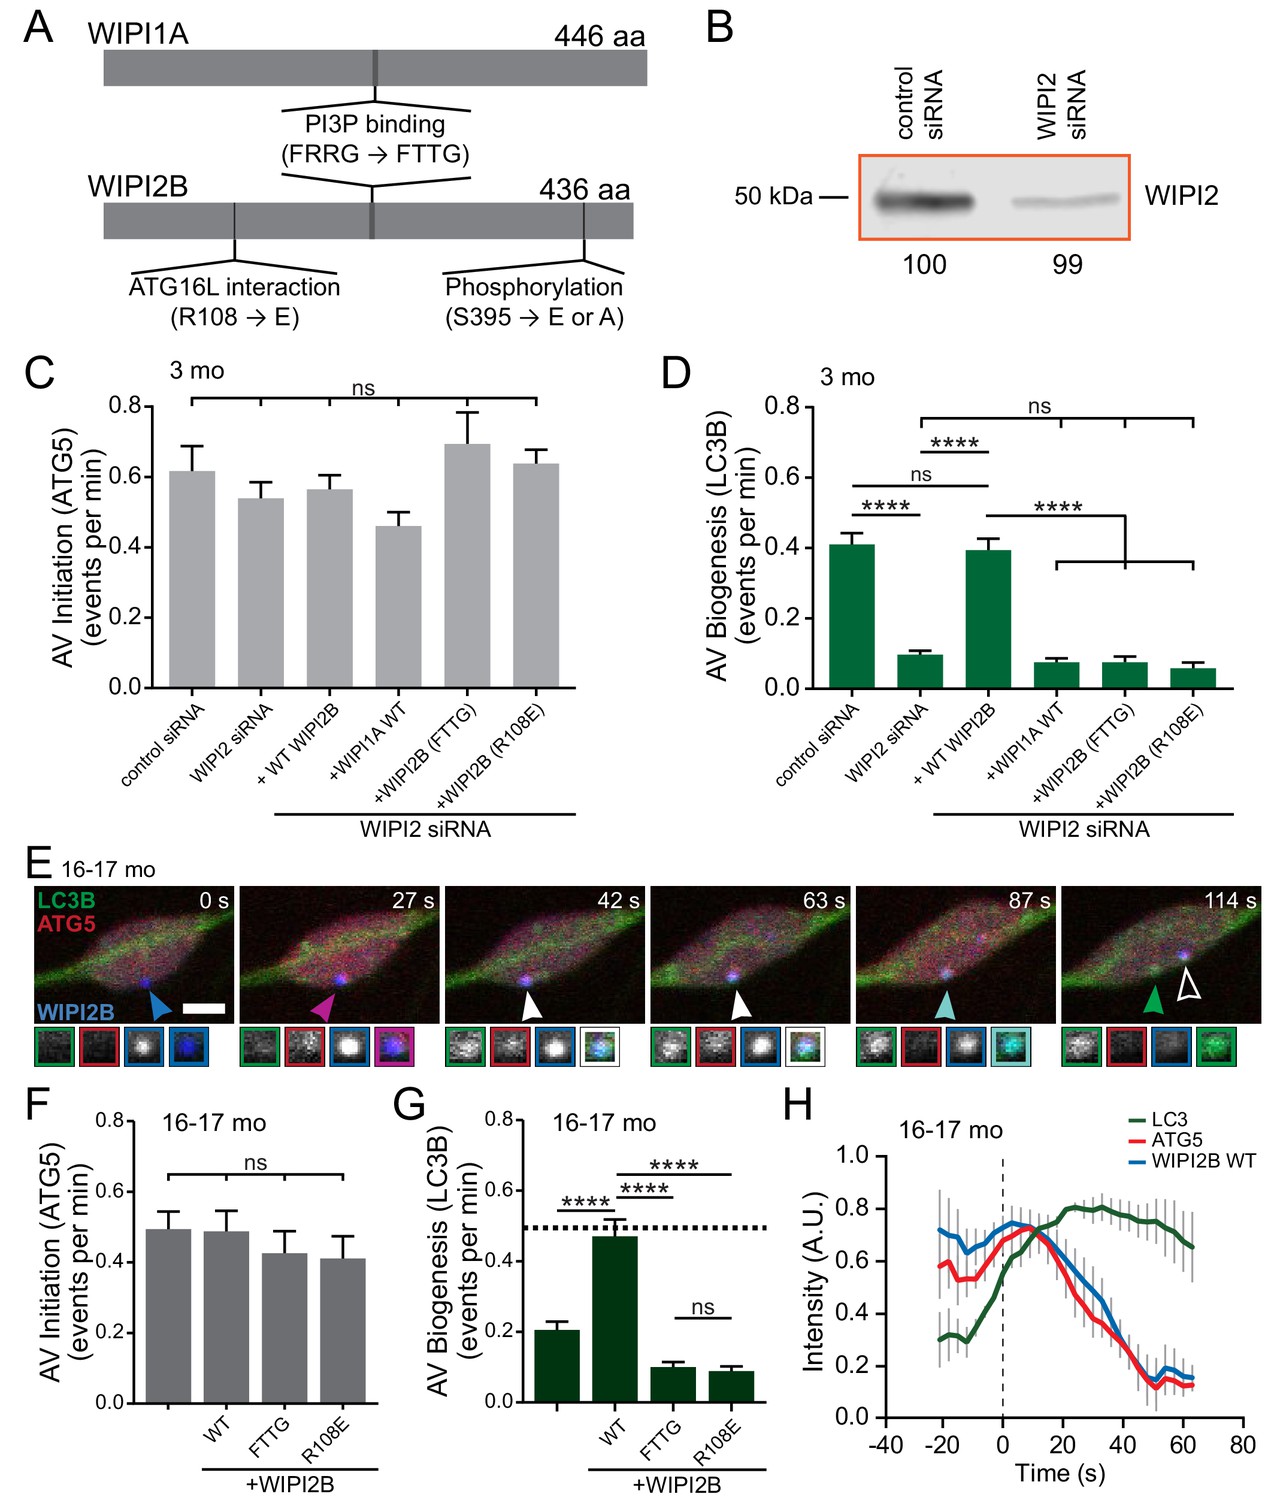
Overexpression of WIPI2B in neurons from aged mice returns autophagosome biogenesis to levels observed in neurons from young adult mice.
(A) Schematic of WIPI1A and WIPI2B proteins, depicting the PI3P-interaction domains (FRRG), the ATG16L1-binding domain in WIPI2B (R108), and the phosphorylation site in WIPI2B (S395). Point mutations to disrupt these interactions are indicated in the relevant domains (FRRG → FTTG, R108 → E, or S395 → E or A). (B) Immunoblot of DRG lysates treated with indicated siRNA, collected after 2 days in vitro. Total protein was used as a loading control; normalization factor is indicated below blot as a percentage. (C) Quantification of the rate of AV initiation (mCh-ATG5 puncta) in DRG neurons from young adult mice with control or WIPI2 siRNA or WIPI2 siRNA with indicated RNAi-resistant Halo-WIPI2B or SNAP-WIPI1A constructs (mean ± SEM; n ≥ 15 neurons from three biological replicates for each siRNA condition). ns (not significant) p>0.05 by Kruskal-Wallis ANOVA test with Dunn’s multiple comparisons test. (D) Quantification of the rate of AV biogenesis (GFP-LC3B puncta) in DRG neurons from young adult mice with control or WIPI2 siRNA or WIPI2 siRNA with indicated RNAi-resistant Halo-WIPI2B or SNAP-WIPI1A constructs (mean ± SEM; n ≥ 15 neurons from three biological replicates for each siRNA condition). ns p>0.05; ****p<0.0001 by Kruskal-Wallis ANOVA test with Dunn’s multiple comparisons test. (E) Time series of merged micrographs of GFP-LC3B, mCh-ATG5, and Halo-WIPI2B WT in the distal neurite of a DRG neuron from an aged mouse depicting a productive autophagosome biogenesis event. Arrowheads indicate colocalization state on the isolation membrane; solid arrowhead follows one punctum, while outlined arrowhead indicates a different AV biogenesis event. Magnified views of denoted puncta are shown below full micrograph; border color represents channel or colocalization state in merge. Retrograde is to the right. Scale bar, 2 μm. (F) Quantification of the rate of AV initiation (mCh-ATG5 puncta) in DRG neurons from aged mice with or without overexpression of the indicated Halo-WIPI2B construct (mean ± SEM; n ≥ 17 neurons from three biological replicates for each condition). ns p>0.05 by Kruskal-Wallis ANOVA test with Dunn’s multiple comparisons test. (G) Quantification of the rate of AV biogenesis (marked with GFP-LC3B) in DRG neurons from aged mice with or without overexpression of the indicated Halo-WIPI2B construct (mean ± SEM; n ≥ 17 neurons from three biological replicates for each condition). ****p<0.0001; ns p>0.05 by Kruskal-Wallis ANOVA test with Dunn’s multiple comparisons test. (H) Mean intensity profiles of mCh-ATG5 (red), Halo-WIPI2B WT (blue), and GFP-LC3B (green) for productive AVs (mean ± SEM; n = 6 biogenesis events from five neurons from three biological replicates). Vertical dashed line indicates the half-maximum of GFP-LC3B intensity, which was used to align the traces.
Figure 6—figure supplement 1
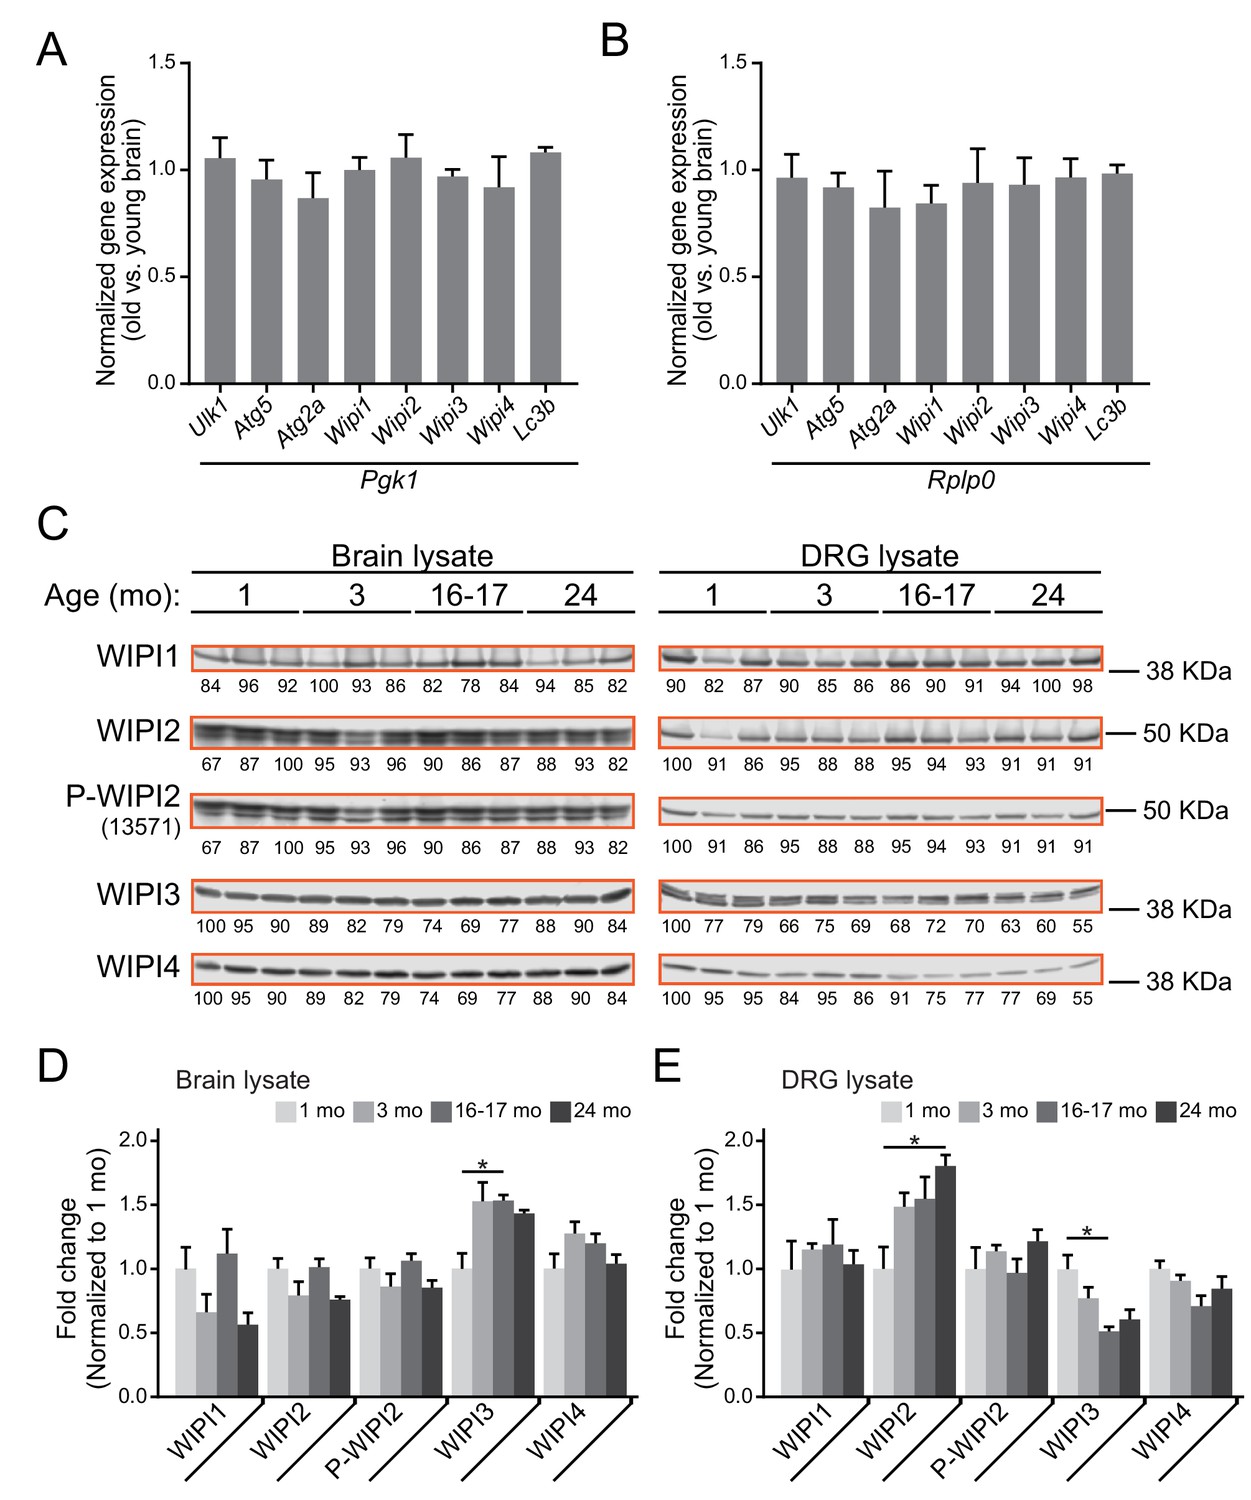
WIPI protein and mRNA levels.
(A–B) Quantitative real-time PCR of autophagosome biogenesis components in brain from aged versus young adult mice (n = 4 biological replicates for each age). The fold-change in target gene expression level (ΔΔCt) was determined by normalization to two separate reference genes, phosphoglycerate kinase 1 (Pgk1) (A) and ribosomal protein, large P0 (Rplp0) (B). The official mouse Wipi3 gene name is Wdr45b; the official mouse Wipi4 gene name is Wdr45; and the official mouse Lc3b gene name is Map1lc3b. (C) Immunoblots of brain or DRG lysates from young, young adult, aged, and advanced mice (n = 3 biological replicates shown for each age). Total protein was used as a loading control (normalization factor indicated below each blot as a percentage). Equal total protein was loaded in each lane for each lysate type (40 μg per lane for brain, 30 μg per lane for DRG). (D–E) Quantification of immunoblots for brain (D) and DRG (E) lysates, normalized first to total protein, then to one mo levels (n = 6 biological replicates for each age, 3 male and three female mice). *p<0.05 between indicated groups by one-way ANOVA with Tukey’s post-hoc analysis; all other groups within one target and lysate type are not significantly different by one-way ANOVA with Tukey’s post-hoc analysis.
Figure 6—figure supplement 2
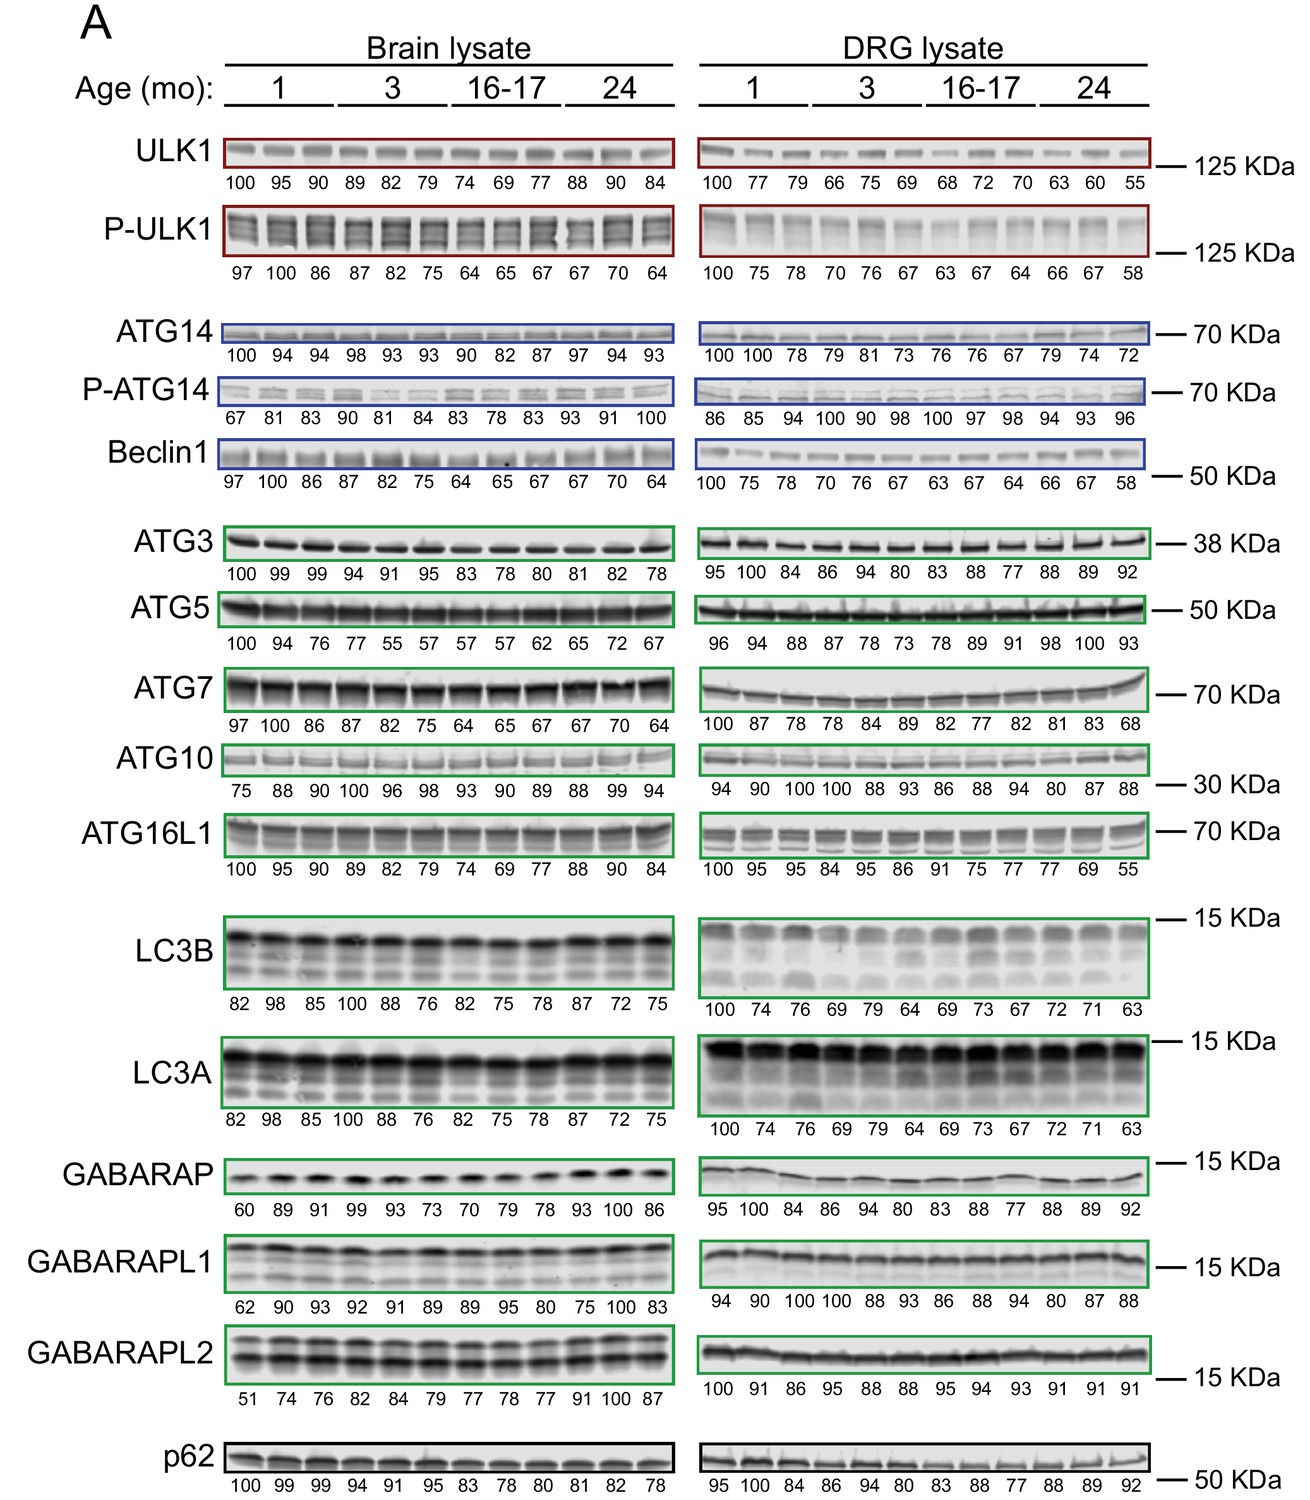
Autophagy protein levels.
(A) Immunoblots of brain or DRG lysates from young, young adult, aged, and advanced aged mice (n = 3 biological replicates shown for each age, blots were repeated on another set of 3 biological replicates for each age). Total protein was used as a loading control (normalization factor indicated below each blot as a percentage). Equal total protein was loaded in each lane for each lysate type (40 μg per lane for brain, 30 μg per lane for DRG).
Figure 7 with 2 supplements
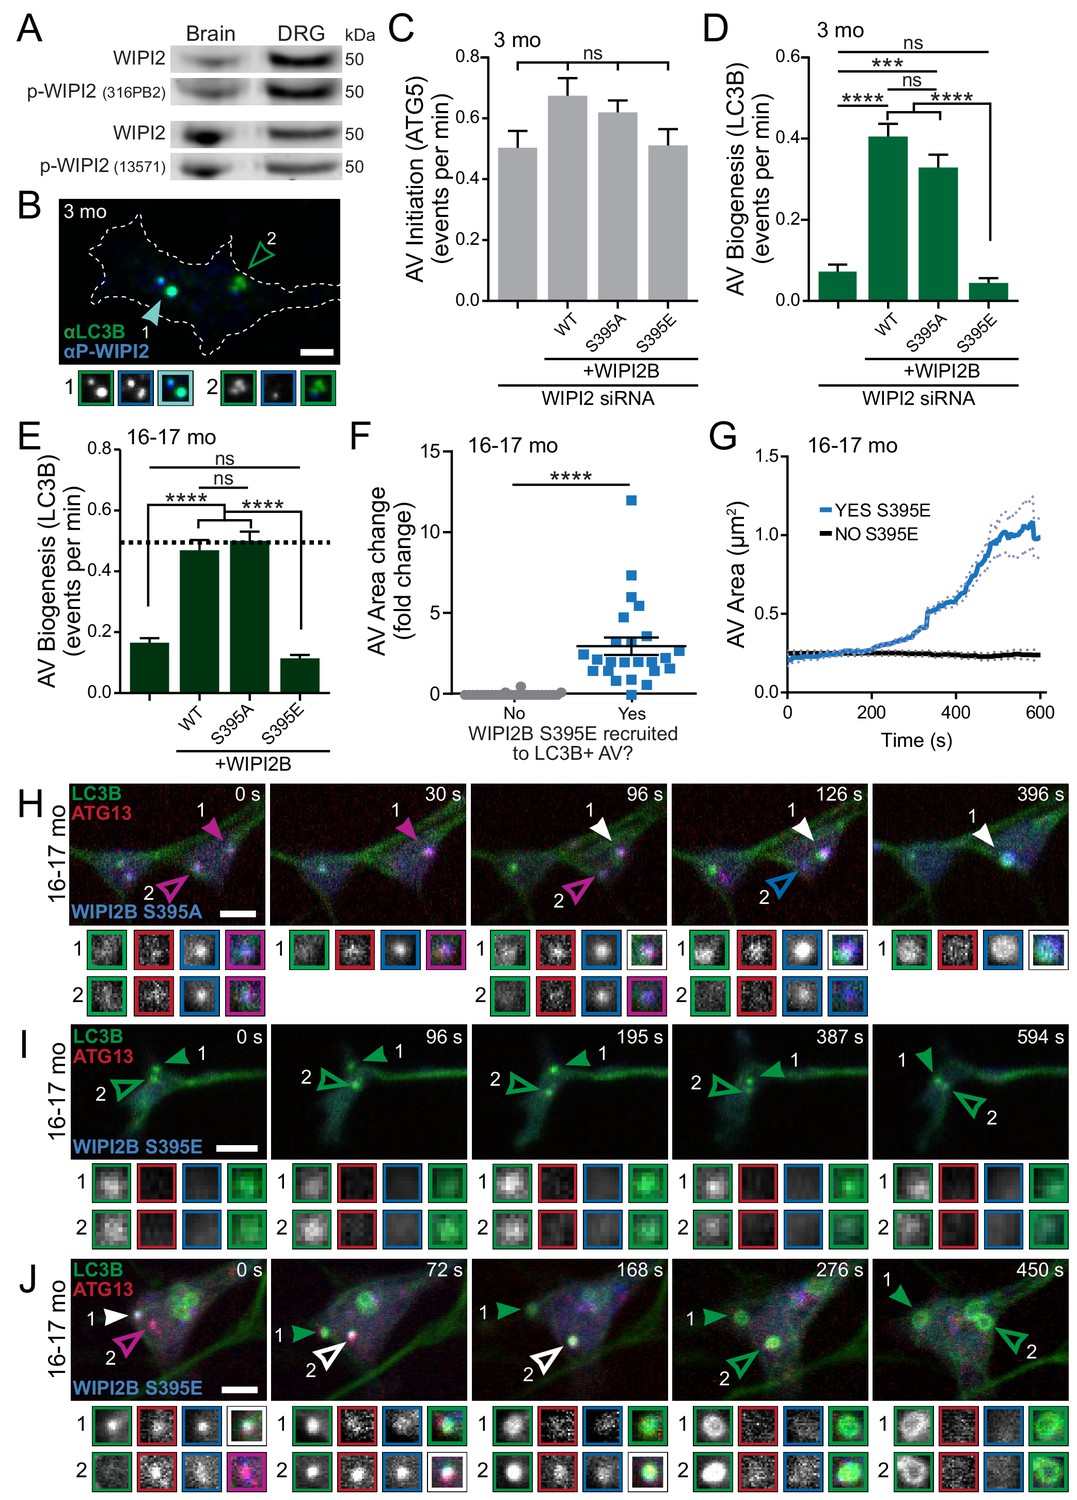
Dynamic WIPI2B phosphorylation in neurons is required for autophagosome biogenesis.
(A) Immunoblot of whole brain or DRG lysates from aged mice demonstrates p-WIPI2 can be detected with two different phospho-WIPI2 antibodies. (B) Representative maximal projection immunocytochemistry micrograph of LC3B and phospho-WIPI2 in the distal tip of a DRG neuron from a young adult mouse. Arrowheads indicate colocalization state on the AV; solid arrowhead indicates puncta with both proteins, while outlined arrowhead designates a different AV with no phospho-WIPI2 colocalized with LC3B. Borders of magnifications of indicated puncta denote channel or colocalization state in merge. Scale bar, 2 μm. (C) Quantification of the rate of AV initiation (mCh-ATG5 puncta) in DRG neurons from young adult mice with WIPI2 siRNA or WIPI2 siRNA with indicated RNAi-resistant Halo-WIPI2B constructs (mean ± SEM; n ≥ 17 neurons from three biological replicates for each siRNA condition). ns (not significant) p>0.05 by Kruskal-Wallis ANOVA test with Dunn’s multiple comparisons test. (D) Quantification of the rate of AV biogenesis (GFP-LC3B puncta) in DRG neurons from young adult mice with WIPI2 siRNA or WIPI2 siRNA with indicated RNAi-resistant Halo-WIPI2B constructs (mean ± SEM; n ≥ 17 neurons from three biological replicates for each siRNA condition). ns (not significant) p>0.05; ***p=0.0001; ****p<0.0001 by Kruskal-Wallis ANOVA test with Dunn’s multiple comparisons test. (E) Quantification of the rate of AV biogenesis (marked with GFP-LC3B) in DRG neurons from aged mice with or without overexpression of the indicated Halo-WIPI2B construct (mean ± SEM; n ≥ 23 neurons from three biological replicates for each condition). ****p<0.0001; ns (not significant) p>0.05 by Kruskal-Wallis ANOVA test with Dunn’s multiple comparisons test. Horizontal dashed line indicates rate of AV biogenesis in neurons from young adult mice. (F) Quantification of AV area change with or without recruitment of Halo-WIPI2B(S395E) (mean ± SEM; n ≥ 24 AVs from 14 neurons from three biological replicates). ****p<0.0001 by Mann-Whitney test. (G) Individual AV area profiles were averaged to improve signal-to-noise of GFP-LC3B puncta that were positive (blue) or negative (black) for Halo-WIPI2B(S395E) (mean ± SEM; n ≥ 25 AVs from ≥17 neurons from three biological replicates). (H) Time series of merge micrographs of GFP-LC3B, mCh-ATG13, and Halo-WIPI2B(S395A) in the distal neurite of a DRG neuron from an aged mouse. (I–J) Time series of merged micrographs of GFP-LC3B, mCh-ATG13, and Halo-WIPI2B(S395E) in the distal neurite of DRG neurons from aged mice depicting AVs that fail to recruit Halo-WIPI2B(S395E) and fail to grow (I) and AVs that do recruit Halo-WIPI2B(S395E) and increase in area (J) during the imaging window. Arrowheads indicate colocalization state on the isolation membrane; solid arrowhead follows one punctum, while outlined arrowhead indicates a second AV. Magnified views of denoted puncta are shown below full micrograph; border color represents channel or colocalization state in merge. Retrograde is to the right. Scale bars, 2 μm.
Figure 7—figure supplement 1
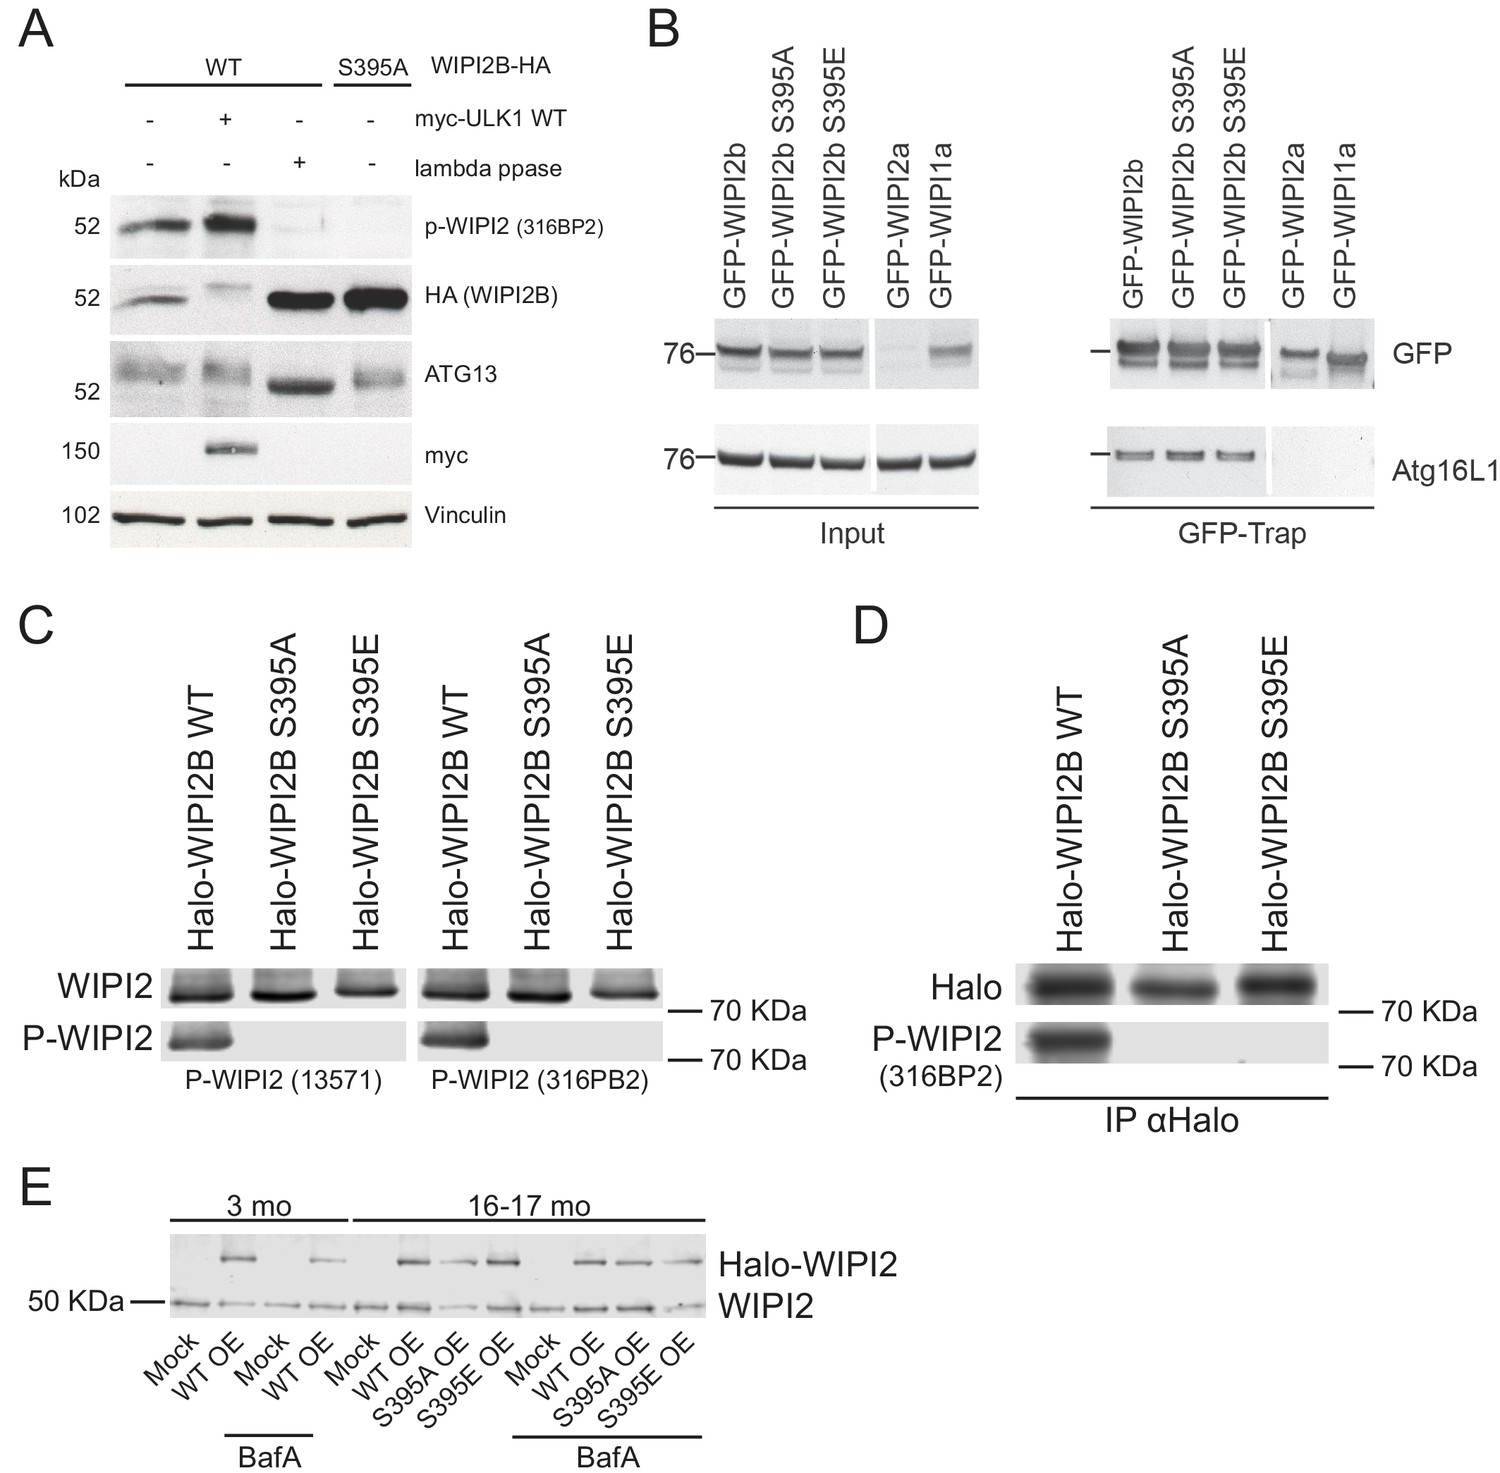
WIPI2B is phosphorylated at S395.
(A) WIPI2 CRISPR KO HEK293A cells were transiently transfected with WIPI2B-HA WT or WIPI2B-HA S395A in combination with either empty vector or myc-ULK1 WT. The cells were lysed and subsequently subjected to lambda phosphatase treatment. Sodium orthovanadate was used as a phosphatase inhibitor in control samples. The samples were analyzed by western blot. Vinculin was used as a loading control. (B) GFP-WIPI2 or GFP-WIPI1A constructs were pulled down using GFP-Trap beads from HEK293 cells expressing GFP-WIPI2B WT, GFP-WIPI2B(S395A), GFP-WIPI2B(S395E), GFP-WIPI2A, or GFP-WIPI1A. ATG16L1 was detected by immunoblotting. (C) HeLa-M cells were transiently transfected with Halo-WIPI2B WT, Halo-WIPI2B(S395A), or Halo-WIPI2B(S395E). The cell lysates were analyzed by western blot. (D) HeLa-M cells were transiently transfected with Halo-WIPI2B WT, Halo-WIPI2B(S395A), or Halo-WIPI2B(S395E). Halo-WIPI2B constructs were pulled down using anti-Halo and detected by immunoblotting.
Figure 7—figure supplement 2

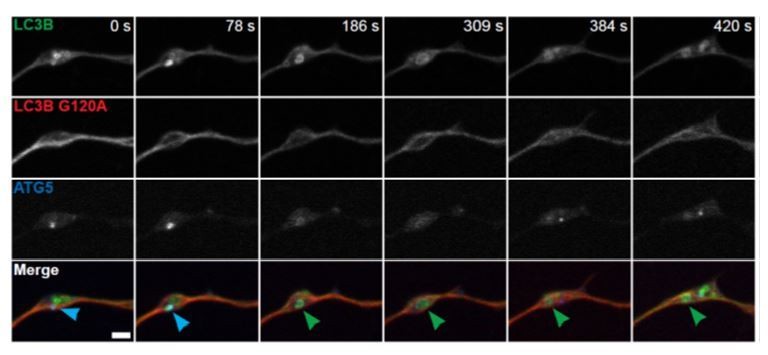
GFP-LC3B-positive AVs do not enlarge when Halo-WIPI2B(S395E) is not recruited.
Full panels of micrographs depicted in Figure 7I. Time series of micrographs of GFP-LC3B, mCh-ATG13, and Halo-WIPI2B(S395E) in the distal neurite of DRG neurons from aged mice depicting AVs that fail to recruit Halo-WIPI2B(S395E) and fail to grow during the imaging window. Arrowheads indicate colocalization state on the isolation membrane; solid arrowhead follows one punctum, while outlined arrowhead indicates a second AV. Retrograde is to the right. Scale bars, 2 μm.
Figure 8
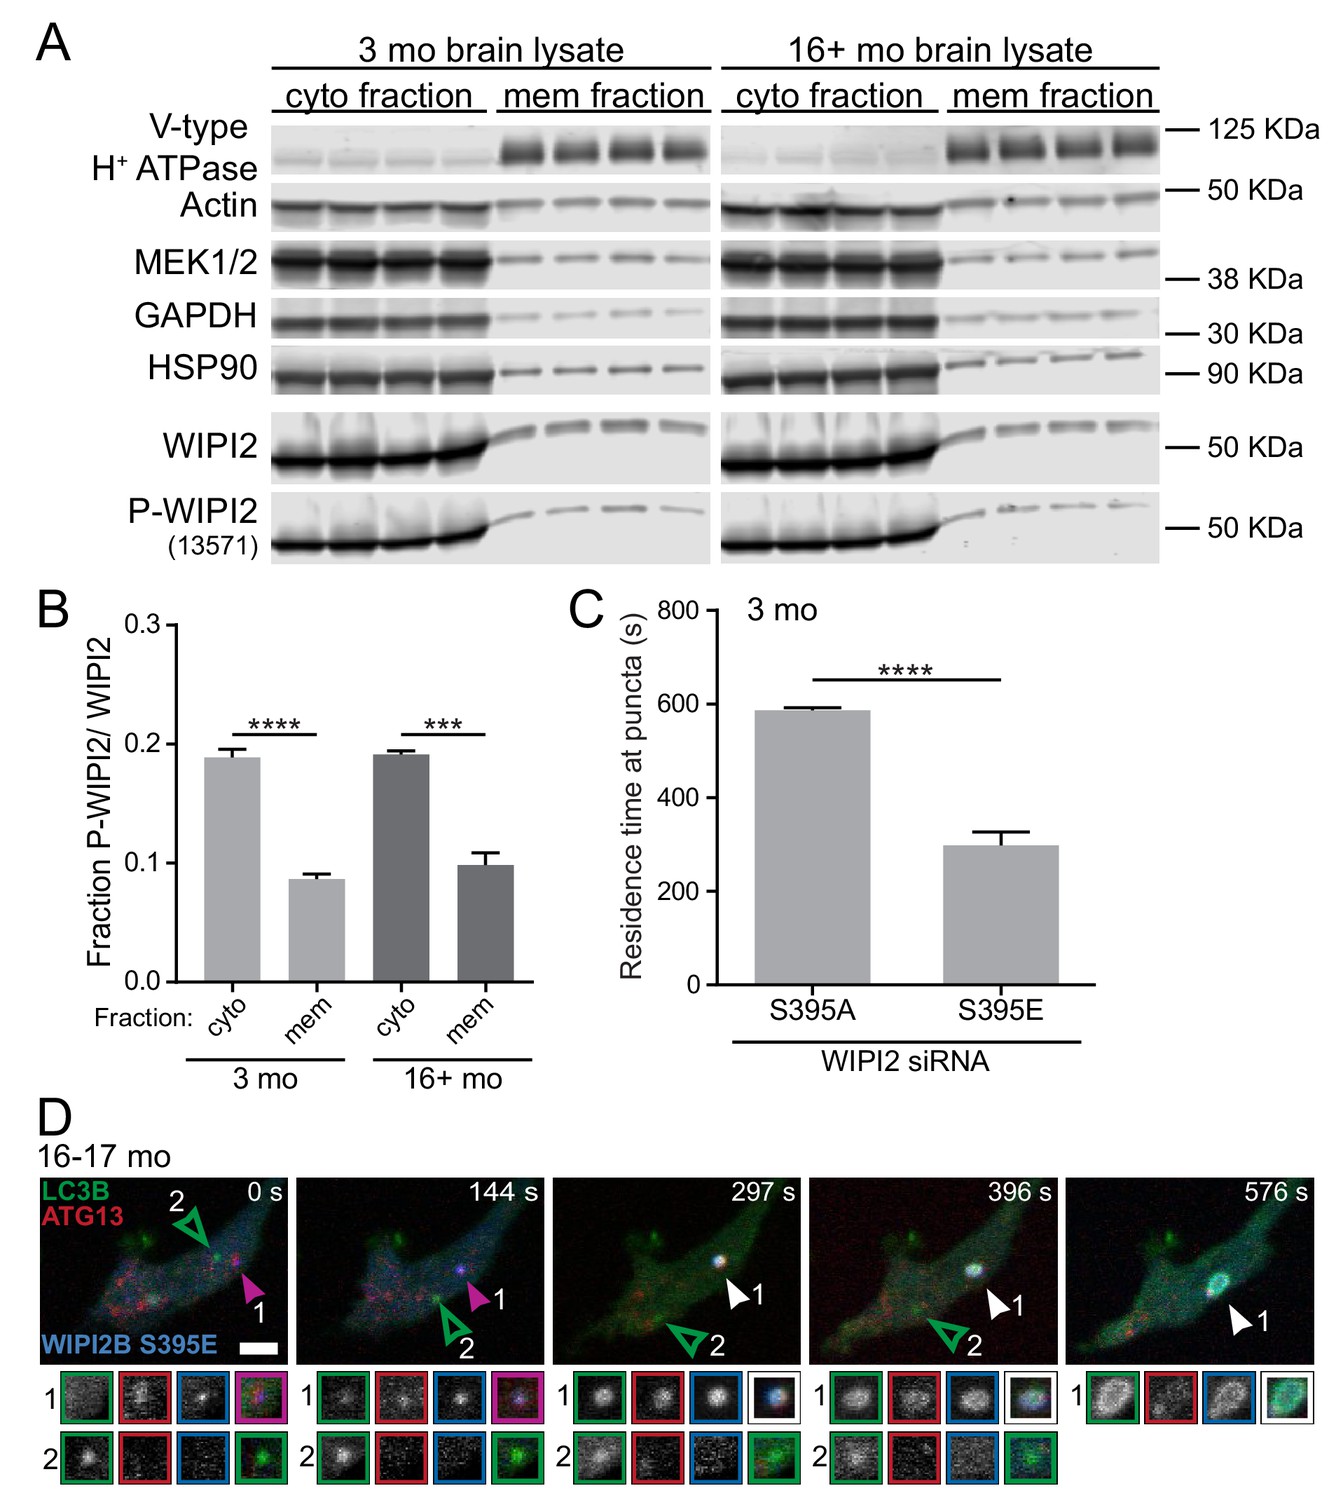
Phosphorylation of WIPI2B at serine 395 decreases the affinity of WIPI2B for membranes.
(A) Immunoblot of cytosolic and membrane fractions of brain lysates from young adult (left) and aged (right) mice (n = 4 biological replicates for each age). (B) Quantification of the ratio of Phospho-WIPI2 to total WIPI2 in the cytosolic (cyto) and membrane (mem) fractions from the immunoblot in A (mean ± SEM; n = 4 biological replicates for each age). ****p<0.0001; ***p=0.0001 by two-tailed unpaired t test. (C) Quantification of the residence time of Halo-WIPI2B(S395A) or SNAP-WIPI2B(S395E) in the distal tips of DRG neurons from young adult mice with WIPI2 siRNA (mean ± SEM; n = 25 neurons from three biological replicates). ****p<0.0001 by Mann-Whitney test. (D) Time series of merged micrographs of GFP-LC3B, mCh-ATG5, and Halo-WIPI2B(S395E) in the distal neurite of a DRG neuron from an aged mouse depicting an AV that fails to recruit Halo-WIPI2B(S395E) and fails to grow (open arrowhead) and an AV that does recruit Halo-WIPI2B(S395E) and increases in area (filled arrowhead) during the imaging window in the same DRG distal neurite. Arrowheads indicate colocalization state on the isolation membrane. Magnified views of denoted puncta are shown below full micrograph; border color represents channel or colocalization state in merge. Retrograde is to the right. Scale bar, 2 μm.
Figure 9
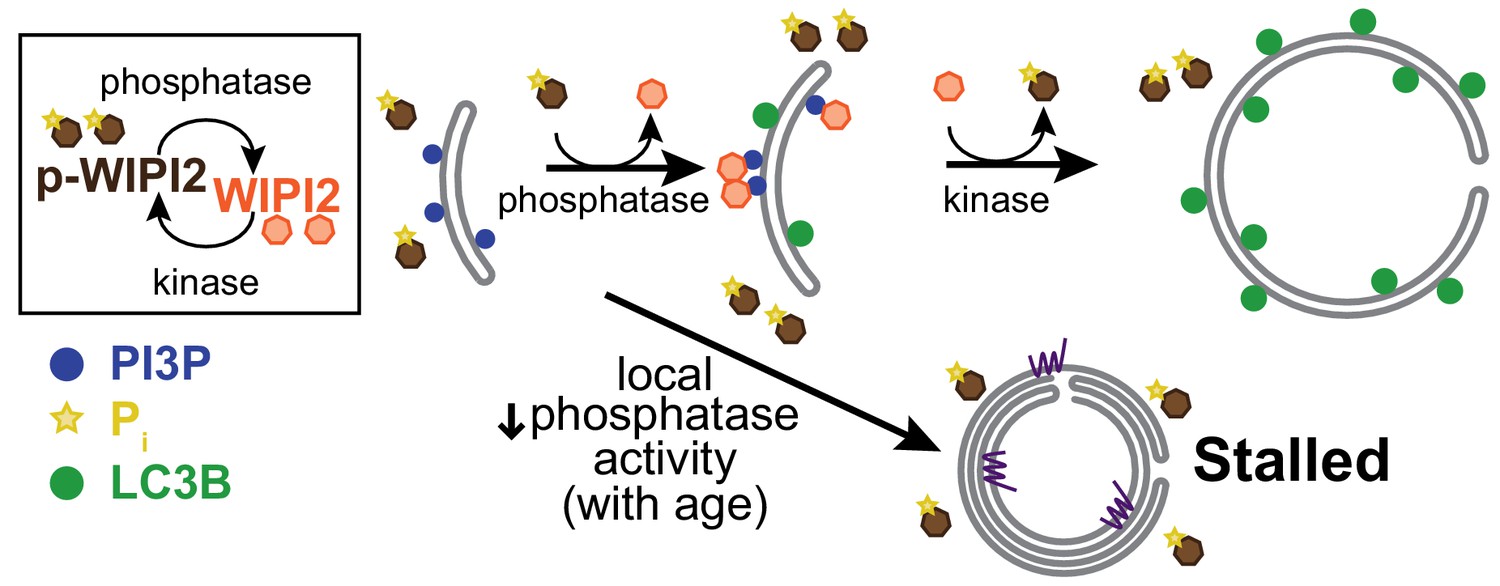
Local dynamic phosphorylation of WIPI2B is required for progression through autophagosome biogenesis.
Model of how dynamic phosphorylation of WIPI2 and autophagosome biogenesis changes in neurons with aging, characterized by formation of both productive and stalled events.
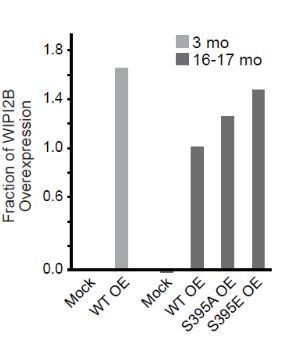
Author response image 1

Author response image 2
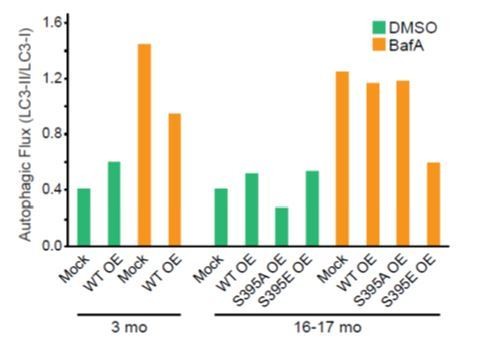
DRG neurons were harvested from 3-mo- or 16-17-mo-old mice and co-transfected with mCh-ATG5 and the indicated Halo-tagged construct.
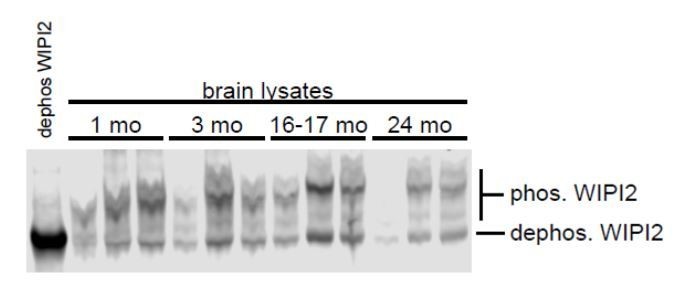
Neurons from 2 mice were pooled during isolation and then split into two samples and nucleofected and plated separately. After 2 DIV, neurons were treated with 2 uL DMSO or 2 uL Bafilomycin A1 (100 nM final concentration) for 4 hours. Neurons were then lysed and harvested. Equal amounts of total protein were loaded onto a SDS-PAGE gel and assessed by immunoblot. LC3 levels were first normalized to total protein, then the LC3-II/LC3-I ratio was calculated and plotted.</
Author response image 3

Author response image 4
Author response image 5
Author response image 6
Author response image 7
Author response image 8
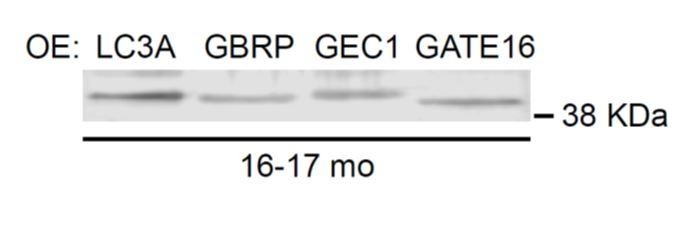
DRG neurons were harvested from 16-17 mo GFP-LC3B transgenic mice and co-transfected with the indicated mCherry-mAtg8 construct and Halo-ATG5 to mimic the imaging experiments.
Neurons were grown for 2 DIV, harvested, and immunoblotted for mCherry. Total protein for each lane was quantified: 100, 47, 83, and 57 for each lane, from left to right.
Videos
Video 1
Productive biogenesis events in a neuron from an aged mouse.
GFP-LC3B and mCh-ATG13 in the distal neurite of a DRG neuron from an aged mouse depicting a productive autophagosome biogenesis event. In the merge movie (bottom), yellow arrowheads denote colocalization of ATG13 and LC3B; green arrowheads denote a LC3B-positive punctum from which ATG13 has dissociated; solid arrowheads track one punctum, hollow arrowheads follow a second punctum. Retrograde is to the right. Scale bar, 2 μm. Playback at five frames per second. Movie stills are shown in Figure 3A.
Video 2
Stalled biogenesis events in a neuron from an aged mouse.
GFP-LC3B and mCh-ATG13 in the distal neurite of a DRG neuron from an aged mouse depicting a stalled autophagosome biogenesis event. In the merge movie (bottom), red arrowheads denote lack of colocalization between ATG13 and LC3B; solid arrowheads track one punctum, hollow arrowheads follow a second punctum. Retrograde is to the right. Scale bar, 2 μm. Playback at five frames per second. Movie stills are shown in Figure 3B.
Video 3
Productive biogenesis events in a neuron from an aged mouse.
GFP-LC3B, mCh-ATG5, and SNAP-ATG9 in the distal neurite of a DRG neuron from an aged mouse depicting a productive autophagosome biogenesis event. In the merge movie (bottom), yellow arrowheads denote colocalization of ATG5 and LC3B without ATG9; green arrowheads denote a LC3B-positive punctum from which ATG5 has dissociated. Retrograde is to the right. Scale bar, 2 μm. Playback at five frames per second. Movie stills are shown in Figure 3F.
Video 4
Stalled biogenesis events in a neuron from an aged mouse.
GFP-LC3B, mCh-ATG5, and SNAP-ATG9 in the distal neurite of a DRG neuron from an aged mouse depicting a stalled autophagosome biogenesis event. In the merge movie (bottom), magenta arrowheads denote colocalization between ATG5 and ATG9 without LC3B. Retrograde is to the right. Scale bar, 2 μm. Playback at five frames per second. Movie stills are shown in Figure 3G.
Video 5
Productive and stalled biogenesis events occur in the same neuron from a young adult mouse.
GFP-LC3B, mCh-ATG13, and SNAP-ATG9 in the distal neurite of a DRG neuron from a young adult mouse depicting both productive (solid arrowhead, solid arrow) and stalled (outlined arrowhead) autophagosome biogenesis events. In the merge movie (bottom), arrowhead color denotes colocalization state of indicated punctum. Retrograde is to the right. Scale bar, 2 μm. Playback at five frames per second. Movie stills are shown in Figure 3—figure supplement 1A.
Video 6
Productive and stalled biogenesis events occur in the same neuron from an aged mouse.
GFP-LC3B and mCh-ATG5 in the distal neurite of a DRG neuron from an aged mouse depicting both productive (solid arrowhead) and stalled (outlined arrowhead) autophagosome biogenesis events. In the merge movie (bottom), arrowhead color denotes colocalization state of indicated punctum. Retrograde is to the right. Scale bar, 2 μm. Playback at five frames per second. Movie stills are shown in Figure 3—figure supplement 1B.
Video 7
Atg9 accumulates at stalled biogenesis events in a neuron from an aged mouse.
GFP-LC3B, mCh-ATG13, and SNAP-ATG9 in the distal neurite of a DRG neuron from an aged mouse depicting a stalled autophagosome biogenesis event. In the merge movie (bottom), arrowhead color denotes colocalization state of the punctum. Retrograde is to the right. Scale bar, 2 μm. Playback at five frames per second. Movie stills are shown in Figure 4A.
Video 8
WIPI2B colocalizes with other autophagy components in a productive event in a neuron from an aged mouse.
GFP-LC3B, mCh-ATG13, and Halo-WIPI2B in the distal neurite of DRGs from aged mice depicting a productive autophagosome biogenesis event. In the merge movie (bottom), arrowhead color denotes colocalization state of the punctum. Retrograde is to the right. Scale bar, 2 μm. Playback at five frames per second. Movie stills are shown in Figure 6E.
Tables
Key resources table
| Reagent type (species) or resource | Designation | Source or reference | Identifiers | Additional information |
|---|---|---|---|---|
| Genetic reagent (Mus musculus) | GFP-LC3B | RIKEN BioResource Center in Japan; PMID: 14699058 | RRID:IMSR_RBRC00806 | |
| Genetic reagent (M. musculus) | C57BL/6J | Jackson Laboratory | Cat # 000664; RRID:IMSR_JAX:000664 | |
| Cell line (Homo sapiens) | HEK293 | Gibco (ThermoFisher) | Cat # R70507 | Authenticated by STR profiling; tested negative for mycoplasma |
| Cell line (H. sapiens) | HeLa-M | A. Peden (Cambridge Institute for Medical Research) | Authenticated by STR profiling; tested negative for mycoplasma | |
| Transfected construct (H. sapiens) | mCherry-ATG13 | This paper | Subcloned from RRID:Addgene_22875 | |
| Transfected construct (M. musculus) | mCherry-ATG5 | Addgene; PMID:16645637 | RRID:Addgene_13095 | |
| Transfected construct (H. sapiens) | Halo-ATG5 | This paper | Subcloned from RRID:Addgene_13095 | |
| Transfected construct (H. sapiens) | SNAP-ATG9 | This paper | Subcloned from RRID:Addgene_60609 | |
| Transfected construct (H. sapiens) | Halo-ATG9 | This paper | Subcloned from RRID:Addgene_60609 | |
| Transfected construct (H. sapiens) | SNAP-WIPI1A | This paper | Subcloned from RRID:Addgene_38272 | |
| Transfected construct (M. musculus) | Halo-DFCP1 | This paper | Subcloned from RRID:Addgene_38269 | |
| Transfected construct (H. sapiens) | mScarlet-LC3A | This paper | Subcloned from RRID:Addgene_73946 | |
| Transfected construct (H. sapiens) | mCherry-GABARAP | This paper | Subcloned from RRID:Addgene_73948 | |
| Transfected construct (H. sapiens) | mCherry-GEC1(GABARAPL1) | This paper | Subcloned from RRID:Addgene_73945 | |
| Transfected construct (H. sapiens) | mCherry-GATE16(GABARAPL2) | This paper | Subcloned from RRID:Addgene_73518 | |
| Transfected construct (H. sapiens) | SNAP-WIPI2B WT | This paper | Subcloned from GFP-WIPI2B, PMID: 24954904 | |
| Transfected construct (H. sapiens) | Halo-WIPI2B WT | This paper | Subcloned from GFP-WIPI2B, PMID: 24954904 | |
| Transfected construct (H. sapiens) | SNAP-WIPI2B (FTTG) | This paper | Generated via quick change from SNAP-WIPI2B WT | |
| Transfected construct (H. sapiens) | Halo-WIPI2B (FTTG) | This paper | Generated via quick change from Halo-WIPI2B WT | |
| Transfected construct (H. sapiens) | SNAP-WIPI2B (R108E) | This paper | Generated via quick change from SNAP-WIPI2B WT | |
| Transfected construct (H. sapiens) | Halo-WIPI2B (R108E) | This paper | Generated via quick change from Halo-WIPI2B WT | |
| Transfected construct (H. sapiens) | SNAP-WIPI2B (S395A) | This paper | Generated via quick change from SNAP-WIPI2B WT | |
| Transfected construct (H. sapiens) | Halo-WIPI2B (S395A) | This paper | Generated via quick change from Halo-WIPI2B WT | |
| Transfected construct (H. sapiens) | SNAP-WIPI2B (S395E) | This paper | Generated via quick change from SNAP-WIPI2B WT | |
| Transfected construct (H. sapiens) | Halo-WIPI2B (S395E) | This paper | Generated via quick change from Halo-WIPI2B WT | |
| Antibody | Anti-Actin, Mouse Polyclonal | EMD Millipore | Cat # MAB1501; RRID:AB_2223041 | WB (1:3000) |
| Antibody | Anti-ATG10, Rabbit Polyclonal | Novus | Cat # NBP2-38524 | WB (1:100) |
| Antibody | Anti-ATG12, Rabbit Polyclonal | Abcam | Cat # ab155589 | ICC (1:50) |
| Antibody | Anti-ATG13, Rabbit Polyclonal | Abcam | Cat # ab105392; RRID:AB_10892365 | ICC (1:50), IHC (1:100) |
| Antibody | Anti-ATG14, Rabbit Monoclonal | Cell Signaling Technology | Cat # 96752; RRID:AB_2737056 | WB (1:1000) |
| Antibody | Anti-ATG16L1, Rabbit Monoclonal | Abcam | Cat # ab187671 | WB (1:1000), ICC (1:50) |
| Antibody | Anti-ATG3, Rabbit Monoclonal | Abcam | Cat # ab108251; RRID:AB_10865145 | WB (1:3000), ICC (1:50) |
| Antibody | Anti-ATG5, Rabbit Monoclonal | Abcam | Cat # ab108327; RRID:AB_2650499 | WB (1:1000) |
| Antibody | Anti-ATG5-Alexa647, Rabbit Monoclonal | Abcam | Cat # ab206715 | ICC (1:50 ON) |
| Antibody | Anti-ATG7, Rabbit Monoclonal | Abcam | Cat # ab133528; RRID:AB_2532126 | WB (1:1000), ICC (1:50) |
| Antibody | Anti-ATG9, Armenian Hamster Monoclonal | Abcam | Cat # ab187823 | ICC (1:100), IHC (1:100) |
| Antibody | Anti-ATG9-Alexa488, Rabbit Monoclonal | Abcam | Cat # ab206252 | ICC (1:50 ON) |
| Antibody | Anti-Beclin1 (BECN1), Mouse Monoclonal | Santa Cruz | Cat # sc-48341; RRID:AB_626745 | WB (1:200) |
| Antibody | Anti-GABARAP, Rabbit Monoclonal | Cell Signaling Technology | Cat # 13733; RRID:AB_2798306 | WB (1:1000), ICC (1:50) |
| Antibody | Anti-GAPDH, Mouse Monoclonal | Abcam | Cat # ab9484; RRID:AB_307274 | WB (1:1000) |
| Antibody | Anti-GABARAPL1 (GEC1), Rabbit Monoclonal | Cell Signaling Technology | Cat # 26632; RRID:AB_2798928 | WB (1:1000), ICC (1:200) |
| Antibody | Anti-GABARAPL2 (GATE16), Rabbit Polyclonal | Abcam | Cat # ab137511 | ICC (1:50) |
| Antibody | Anti-GABARAPL2 (GATE16), Rabbit Monoclonal | Cell Signaling Technology | Cat # 14256; RRID:AB_2798436 | WB (1:1000) |
| Antibody | Anti-GABARAPs, Rabbit Monoclonal | Abcam | Cat # ab109364; RRID:AB_10861928 | ICC (1:100) |
| Antibody | Anti-Halo, Mouse Monoclonal | Promega | Cat # G9211 | WB (1:500), IP (3 μg) |
| Antibody | Anti-HSP90, Rabbit Monoclonal | Cell Signaling Technology | Cat # 4877; RRID:AB_2233307 | WB (1:1000) |
| Antibody | Anti-LC3, Rabbit Polyclonal | Abcam | Cat # ab48394; RRID:AB_881433 | IHC (1:200) |
| Antibody | Anti-LC3A, Rabbit Monoclonal | Cell Signaling Technology | Cat # 4599; RRID:AB_10548192 | WB (1:1000) |
| Antibody | Anti-LC3B, Mouse Monoclonal | Santa Cruz | Cat # sc-376404; RRID:AB_11150489 | WB (1:100), ICC (1:50) |
| Antibody | Anti-MEK1/2, Rabbit Monoclonal | Cell Signaling Technology | Cat # 8727; RRID:AB_10829473 | WB (1:1000) |
| Antibody | Anti-NFH, Chicken Polyclonal | Aves | Cat # NFH; RRID:AB_2313552 | IHC (1:400) |
| Antibody | Anti-p62, Mouse Monoclonal | Abcam | Cat # ab56416; RRID:AB_945626 | WB (1:200) |
| Antibody | Anti-phospho-ATG14(S29), Rabbit Polyclonal | Cell Signaling Technology | Cat # 13155; RRID:AB_2798133 | WB (1:1000) |
| Antibody | Anti-phospho-ULK1(S757), Rabbit Polyclonal | Cell Signaling Technology | Cat # 6888; RRID:AB_10829226 | WB (1:500) |
| Antibody | Anti-phospho-WIPI2(S395), Rabbit Polyclonal | Cell Signaling Technology | Cat # 13571; RRID:AB_2798259 | WB (1:1000) |
| Antibody | Anti-phospho-WIPI2(S395), Rabbit Polyclonal | This paper | # STO 316PB2 | WB (1:500), ICC (1:50) |
| Antibody | Anti-SV2, Mouse Monoclonal | Developmental Studies Hybridoma Bank, University of Iowa | Cat # SV2; RRID:AB_2315387 | IHC (1:100) |
| Antibody | Anti-ULK1, Rabbit Monoclonal | Cell Signaling Technology | Cat # 8054; RRID:AB_11178668 | WB (1:500) |
| Antibody | Anti-V-type H + ATPase, Rabbit Polyclonal | Synaptic Systems | Cat # 109–002; RRID:AB_887696 | WB (1:500) |
| Antibody | Anti-WIPI1, Rabbit Polyclonal | ThermoFisher | Cat # PA5-34973; RRID:AB_2552322 | WB (1:500) |
| Antibody | Anti-WIPI2, Mouse Monoclonal | Abcam | Cat # ab105459; RRID:AB_10860881 | WB (1:4000) |
| Antibody | Anti-WIPI3, Mouse IgM Monoclonal | Santa Cruz | Cat # sc-514194 | WB (1:100) |
| Antibody | Anti-WIPI4, Rabbit Polyclonal | ThermoFisher | Cat # PA5-71803; RRID:AB_2717657 | WB (1:250) |
| Antibody | Anti-Chicken IgY-AlexaFluor405, Goat Polyclonal | Abcam | Cat # ab175674 | IHC (1:200) |
| Antibody | Anti-Mouse IgG-AlexaFluor405, Goat Polyclonal | ThermoFisher | Cat # A31553; RRID:AB_221604 | IHC (1:200) |
| Antibody | Anti-Armenian Hamster-AlexaFluor647, Goat Polyclonal | Abcam | Cat # ab173004; RRID:AB_2732023 | IHC (1:200) |
| Antibody | Anti-Rabbit-AlexaFluor488,Goat Polyclonal | ThermoFisher | Cat # A11034; RRID:AB_2576217 | IHC (1:200) |
| Antibody | Anti-Armenian Hamster-AlexaFluor488, Goat Polyclonal | Abcam | Cat # ab173003 | ICC (1:200) |
| Antibody | Anti-Rabbit IgG-AlexaFluor546, Donkey Polyclonal | ThermoFisher | Cat # A10040; RRID:AB_2534016 | ICC (1:200) |
| Antibody | Anti-Mouse IgG-AlexaFluor546, Donkey Polyclonal | ThermoFisher | Cat # A10036; RRID:AB_2534012 | ICC (1:200) |
| Antibody | Anti-Rabbit IgG-AlexaFluor647, Donkey Polyclonal | ThermoFisher | Cat # A31573; RRID:AB_2536183 | ICC (1:200), IHC (1:200) |
| Antibody | Anti-Rabbit IgG-IRDye 800CW, Donkey Polyclonal | LI-COR Biosciences | Cat # 926–32213; RRID:AB_621848 | WB (1:20,000) |
| Antibody | Anti-Mouse IgG-IRDye 800CW, Donkey Polyclonal | LI-COR Biosciences | Cat # 926–32212; RRID:AB_621847 | WB (1:20,000) |
| Antibody | Anti-Mouse IgM-IRDye 800CW, Goat Polyclonal | LI-COR Biosciences | Cat # 926–32280 | WB (1:20,000) |
| Antibody | Anti-Rabbit IgG-IRDye 680RD, Donkey Polyclonal | LI-COR Biosciences | Cat # 926–68073; RRID:AB_10954442 | WB (1:10,000) |
| Antibody | Anti-Mouse IgG Light Chain-AlexaFluor680, Goat Polyclonal | Jackson ImmunoResearch Labs | Cat # 115-625-174; RRID:AB_2338937 | WB (1:20,000) |
| Sequence-based reagent | ON-TARGET plus SMARTpool Mouse Wipi2 siRNA | Dharmacon | Cat # L-057690–01 | Proprietary sequence |
| Sequence-based reagent | ON-TARGET plus non-targeting siRNA | Dharmacon | Cat # D-001810–01 | Proprietary sequence |
| Chemical compound, drug | SNAP-Cell 647-SiR | New England Biolabs | Cat # S9102S | |
| Chemical compound, drug | SNAP-Cell TMR-Star | New England Biolabs | Cat # S9105S | |
| Chemical compound, drug | SNAP-Cell 430 | New England Biolabs | Cat # S9109S | |
| Chemical compound, drug | HaloTag TMR | Promega | Cat # G8251 | |
| Chemical compound, drug | silicon-rhodamine-Halo | K. Johnsson, École Polytechnique Federale de Lausanne | ||
| Chemical compound, drug | JF646-Halo | Luke Lavis, Janelia Farms (HHMI) | ||
| Chemical compound, drug | α-Bungarotoxin-tetramethylrhodamine | Sigma | T0195 | |
| Software, algorithm | Volocity | PerkinElmer | ||
| Software, algorithm | FIJI | PMID: 22743772 | ||
| Software, algorithm | Prism 6, Prism 8 | GraphPad | ||
| Software, algorithm | Adobe Illustrator CS4 | Adobe Systems |
Additional files
-
Transparent reporting form
- https://doi.org/10.7554/eLife.44219.028
Download links
A two-part list of links to download the article, or parts of the article, in various formats.
Downloads (link to download the article as PDF)
Open citations (links to open the citations from this article in various online reference manager services)
Cite this article (links to download the citations from this article in formats compatible with various reference manager tools)
Expression of WIPI2B counteracts age-related decline in autophagosome biogenesis in neurons
eLife 8:e44219.
https://doi.org/10.7554/eLife.44219


