Quantification of microenvironmental metabolites in murine cancers reveals determinants of tumor nutrient availability
- Massachusetts Institute of Technology, United States
- University of Massachusetts, United States
- Dana-Farber Cancer Institute, United States
- University of Chicago, United States
Figures
Figure 1 with 3 supplements
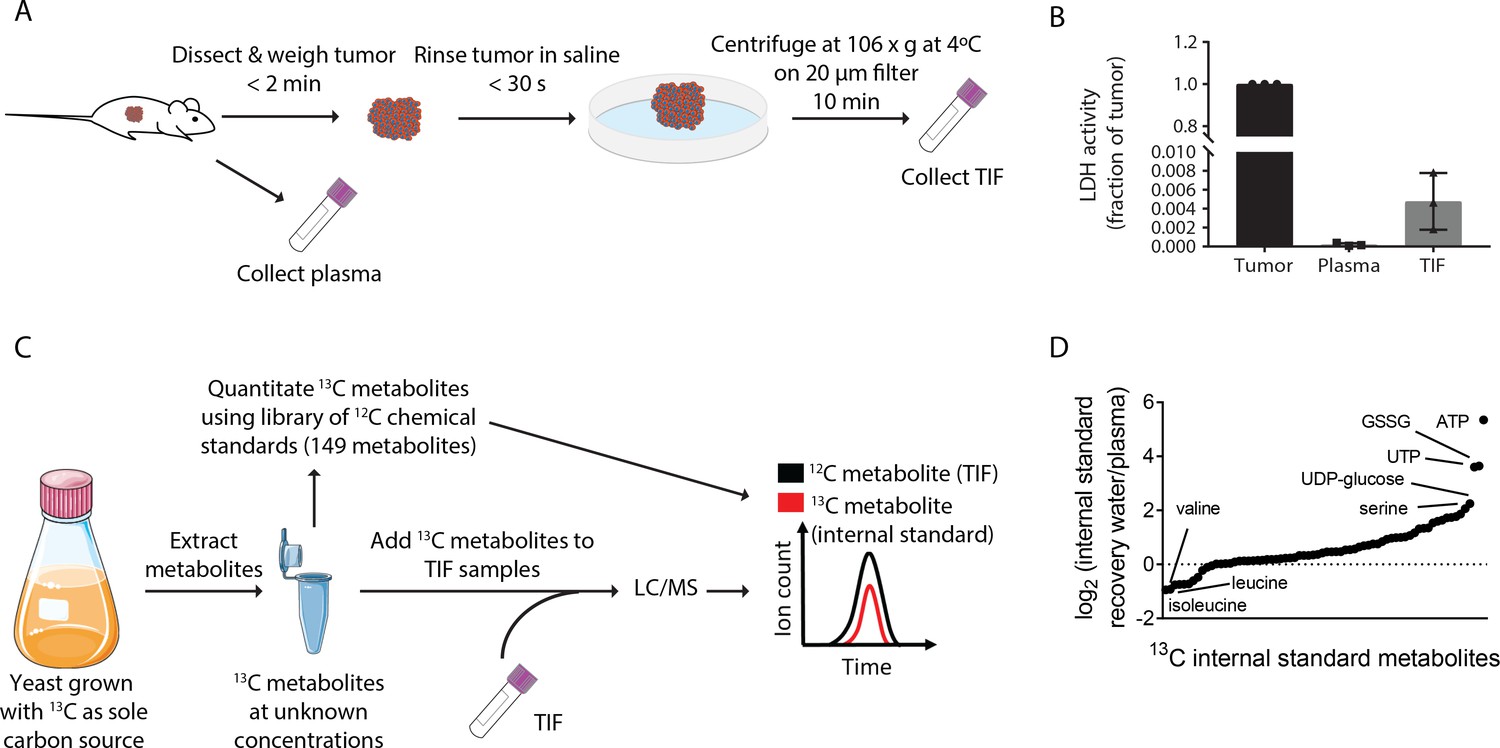
Stable Isotope dilution can be utilized to analyze the composition of TIF.
(A) Schematic of TIF isolation. (B) LDH activity assay measuring the amount of LDH present in whole tumors, plasma, and TIF from PDAC tumor bearing mice. LDH activity was calculated for the entire volume of TIF isolated from one tumor and plotted as a ratio to the amount of LDH present in the whole tumor lysate. For each TIF sample, an equal volume of plasma was analyzed and compared to the tumor lysate. n = 3 tumors, plasma, and TIF samples each. (C) Schematic summarizing the method used for TIF quantification. (D) LC/MS measurement of equal concentrations of 70 13C chemical standards suspended in either water or mouse plasma. Data are plotted as the log2 fold change between the peak area of the metabolite in water versus in plasma. n = 19 plasma samples and n = 6 water samples.
-
Figure 1—source data 1
13C metabolite peak areas of metabolites suspended in plasma and water for matrix effect analysis in Figure 1C.
- https://doi.org/10.7554/eLife.44235.007
Figure 1—figure supplement 1
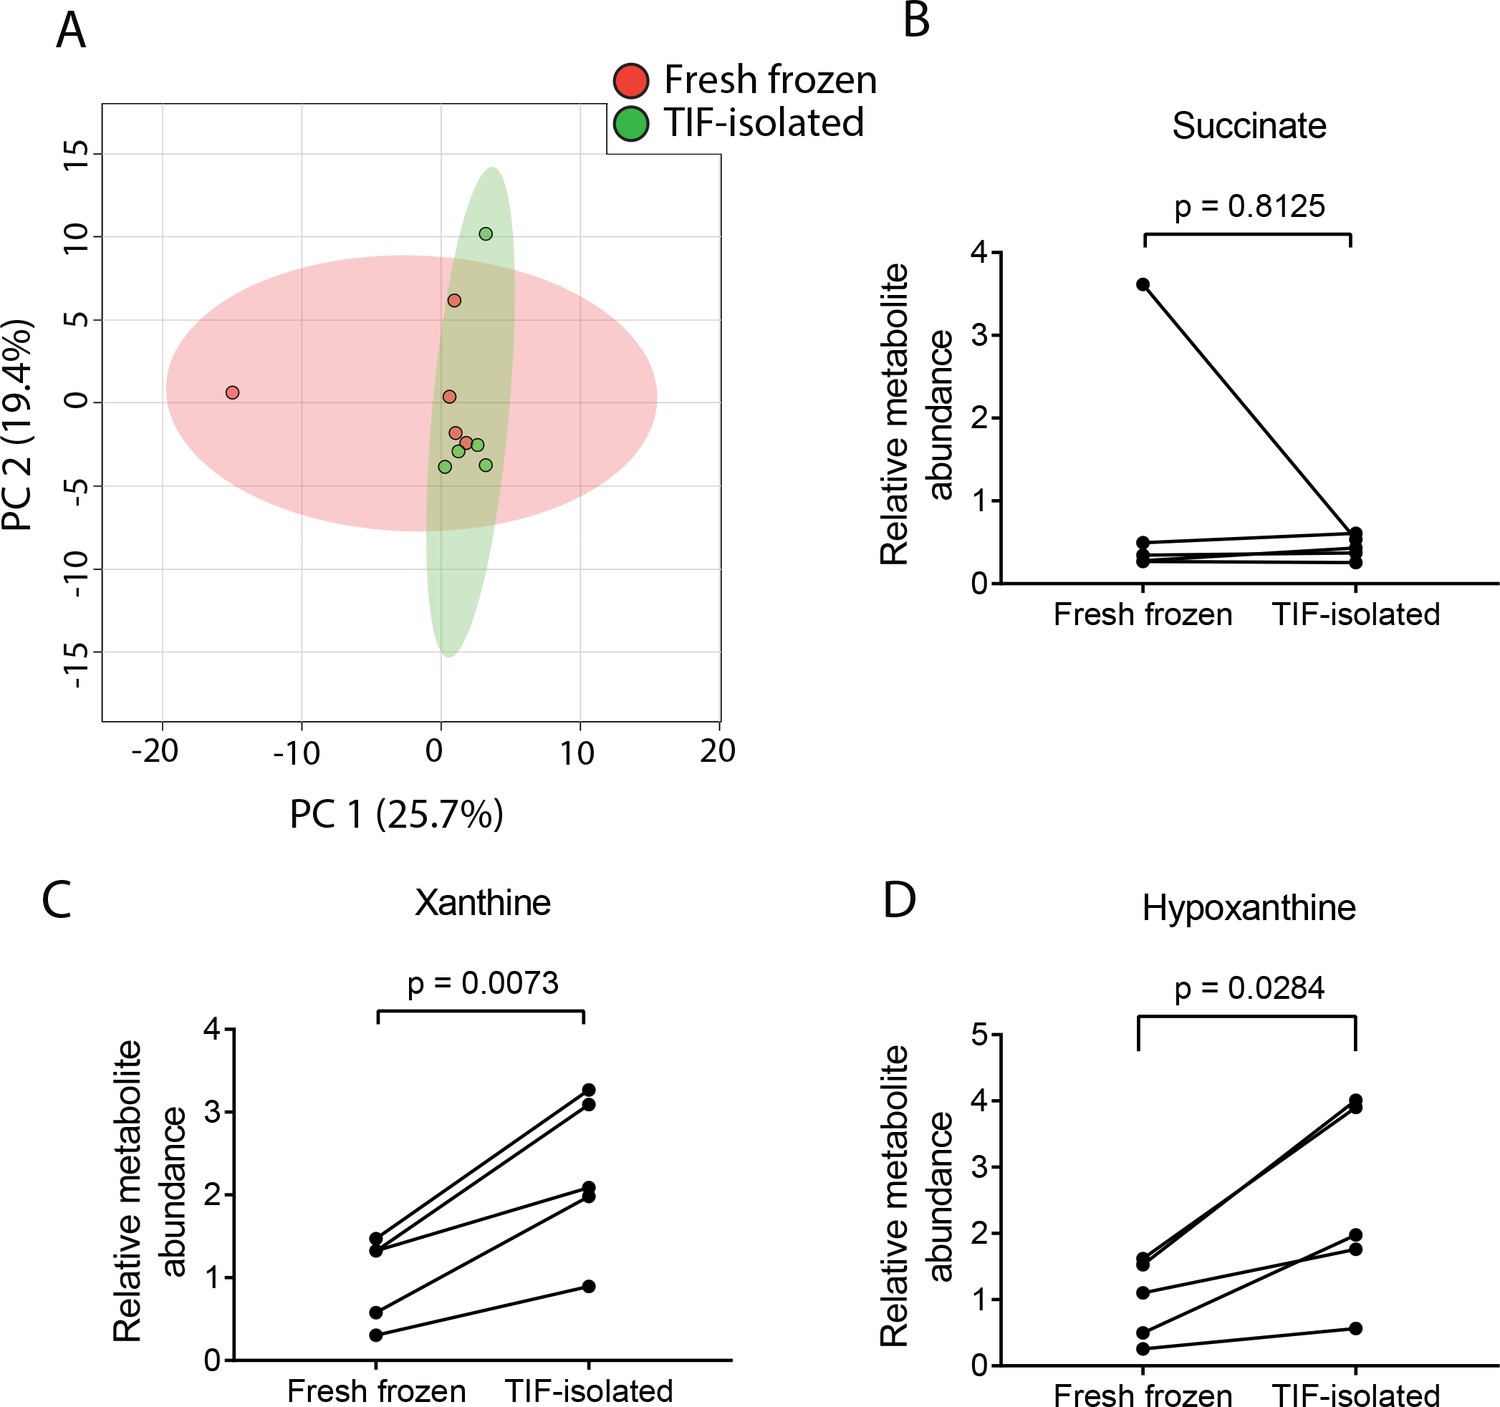
TIF isolation causes only minor increases in some metabolites known to be affected by ischemia in tumors.
LC/MS measurements of relative levels of 112 metabolites (see Figure 1—figure supplement 1—source data 1) were made in extracts from KP-/-C PDAC tumors (n = 5) that were dissected in half and where one half was immediately frozen in liquid nitrogen, while the other half was frozen after isolation of TIF by centrifugation. (A) Principle component analysis of all metabolites measured from tumor samples prepared before and after TIF isolation. Relative levels of the ischemia-sensitive metabolites (B) succinate (C) xanthine or (D) hypoxanthine between paired PDAC tumor pieces are shown. p-values were derived from paired, two-tailed t tests.
-
Figure 1—figure supplement 1—source data 1
Relative levels of metabolites in paired PDAC tumors that were either dissected and flash frozen, or were frozen after TIF-isolation in Figure 1—figure supplement 1.
- https://doi.org/10.7554/eLife.44235.009
Figure 1—figure supplement 2
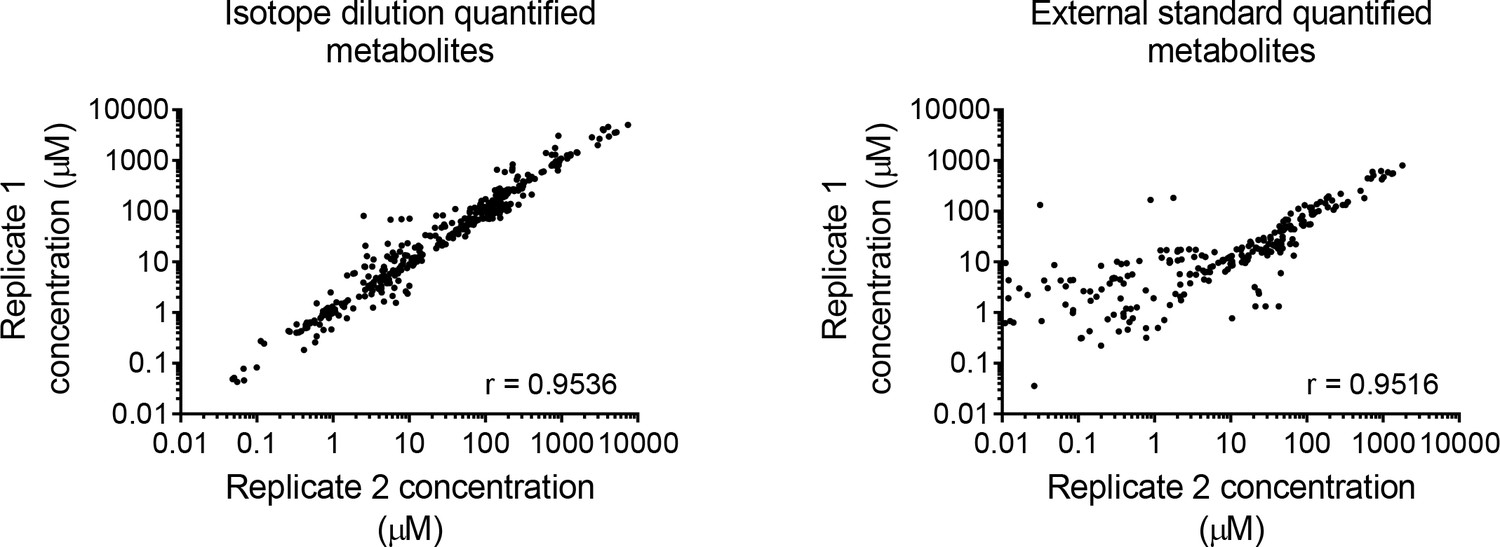
TIF metabolite quantification is reproducible, particularly when using stable isotope dilution.
Scatter plots of average LC/MS measurements of metabolite concentrations across two technical replicates of 6 PDAC TIF samples run on different days using either stable isotope dilution (left) or calibration to external standard curves (right). Each PDAC sample was quantified twice, on different days and using different batches of 13C yeast extract.
-
Figure 1—figure supplement 2—source data 1
Metabolite concentrations in 6 PDAC TIF samples analyzed in two inter-day technical replicates in Figure 1—figure supplement 2.
- https://doi.org/10.7554/eLife.44235.008
Figure 1—figure supplement 3
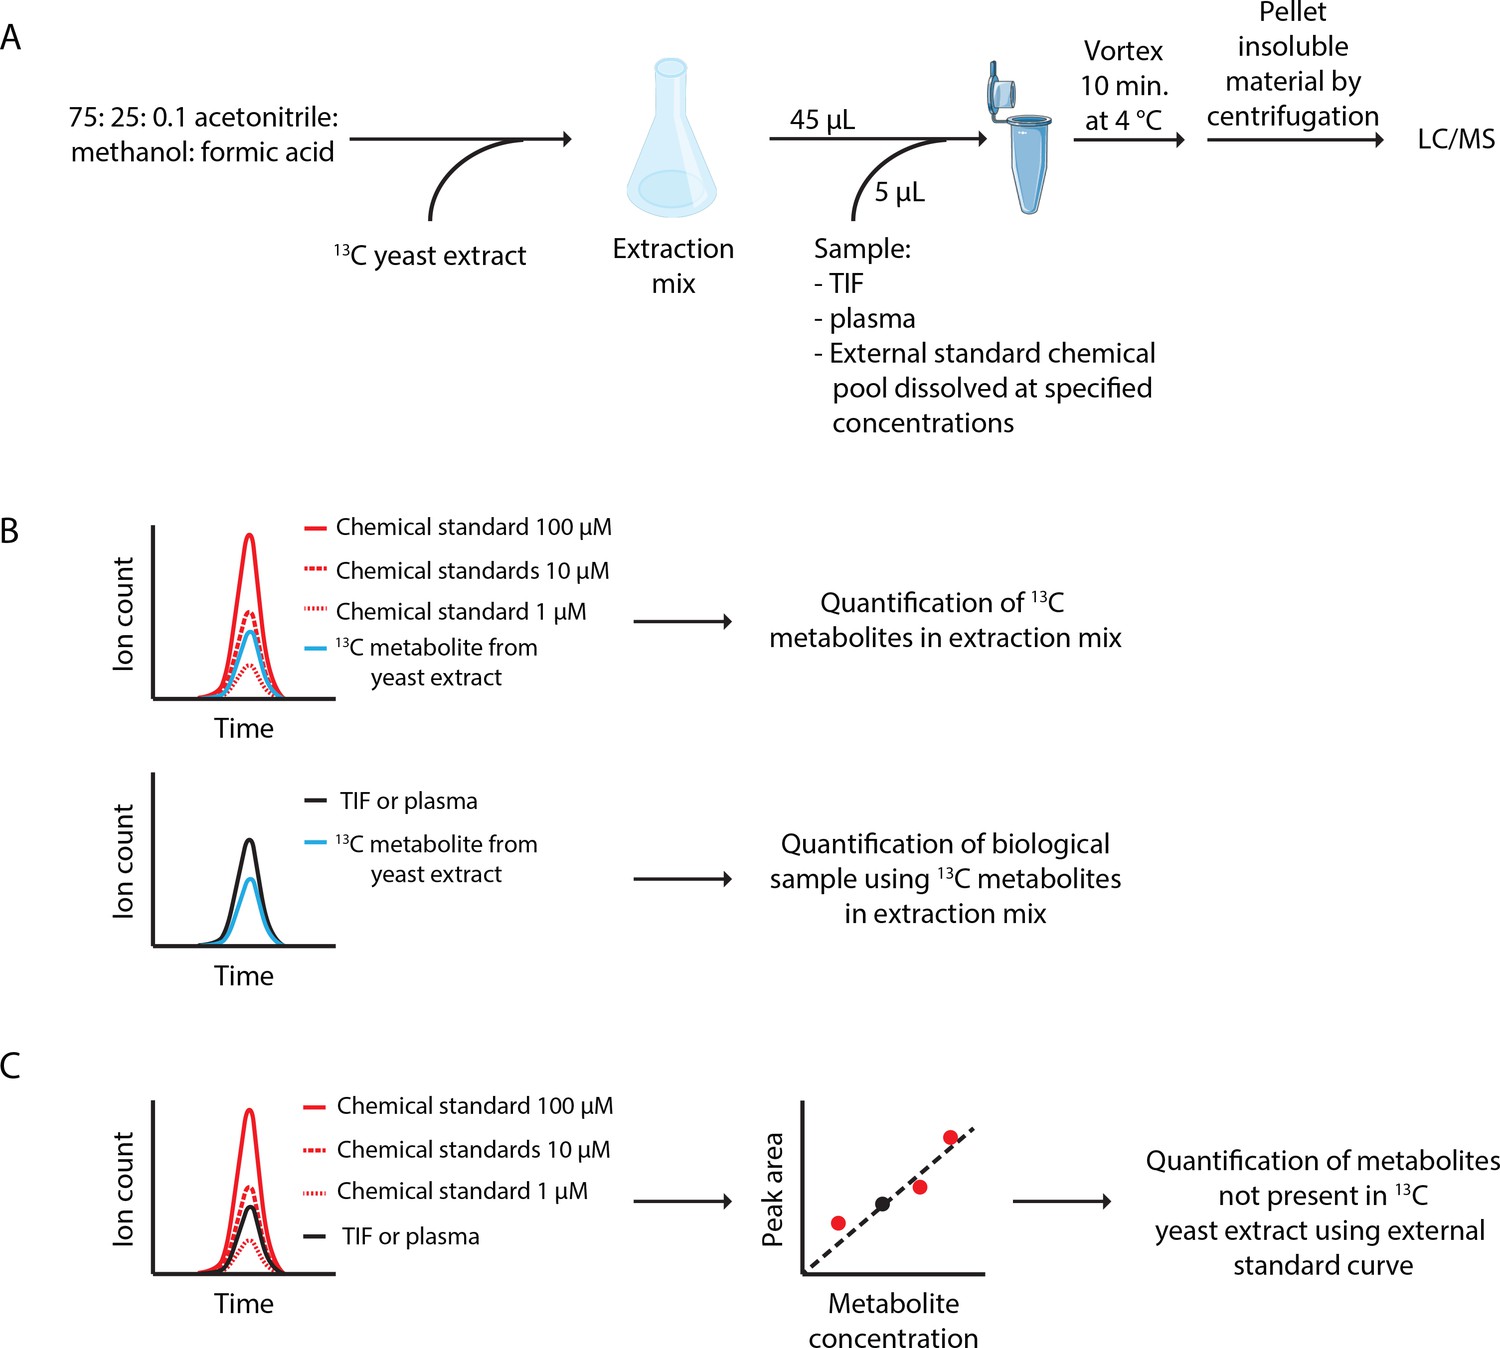
Overview of sample preparation and data analysis.
(A) A schematic describing sample and standard preparation for LC/MS analysis. First, extraction mix with added isotopically labeled internal standards is prepared. This extraction mix is then used to extract metabolites from either biological samples (TIF or plasma) or external standard pools (chemical standards diluted in water). The insoluble material is sedimented and the soluble material is then analyzed by LC/MS. (B) An overview of the data analysis method for metabolites quantified by stable isotope dilution. (upper) First, the concentration of isotope labeled metabolites in the extraction mix is determined. This is done by comparing the peak area of the isotope labeled internal standard metabolite with the peak area of unlabeled chemical standards at known concentration in the external standard pool samples analyzed by LC/MS. This provides an absolute concentration of the isotope labeled metabolite that was included in all samples, including TIF and plasma samples (lower) Next, in the TIF and plasma samples, the peak area of isotopically labeled metabolites from the extraction solvent are compared to the peak area of unlabeled metabolites coming from the biological sample. As the absolute concentration of the isotope labeled internal standard is known, the concentration of the unlabeled metabolite in the TIF or plasma sample can be determined by knowing the ratio of the labeled and unlabeled metabolites in the biological samples.
Figure 2 with 7 supplements

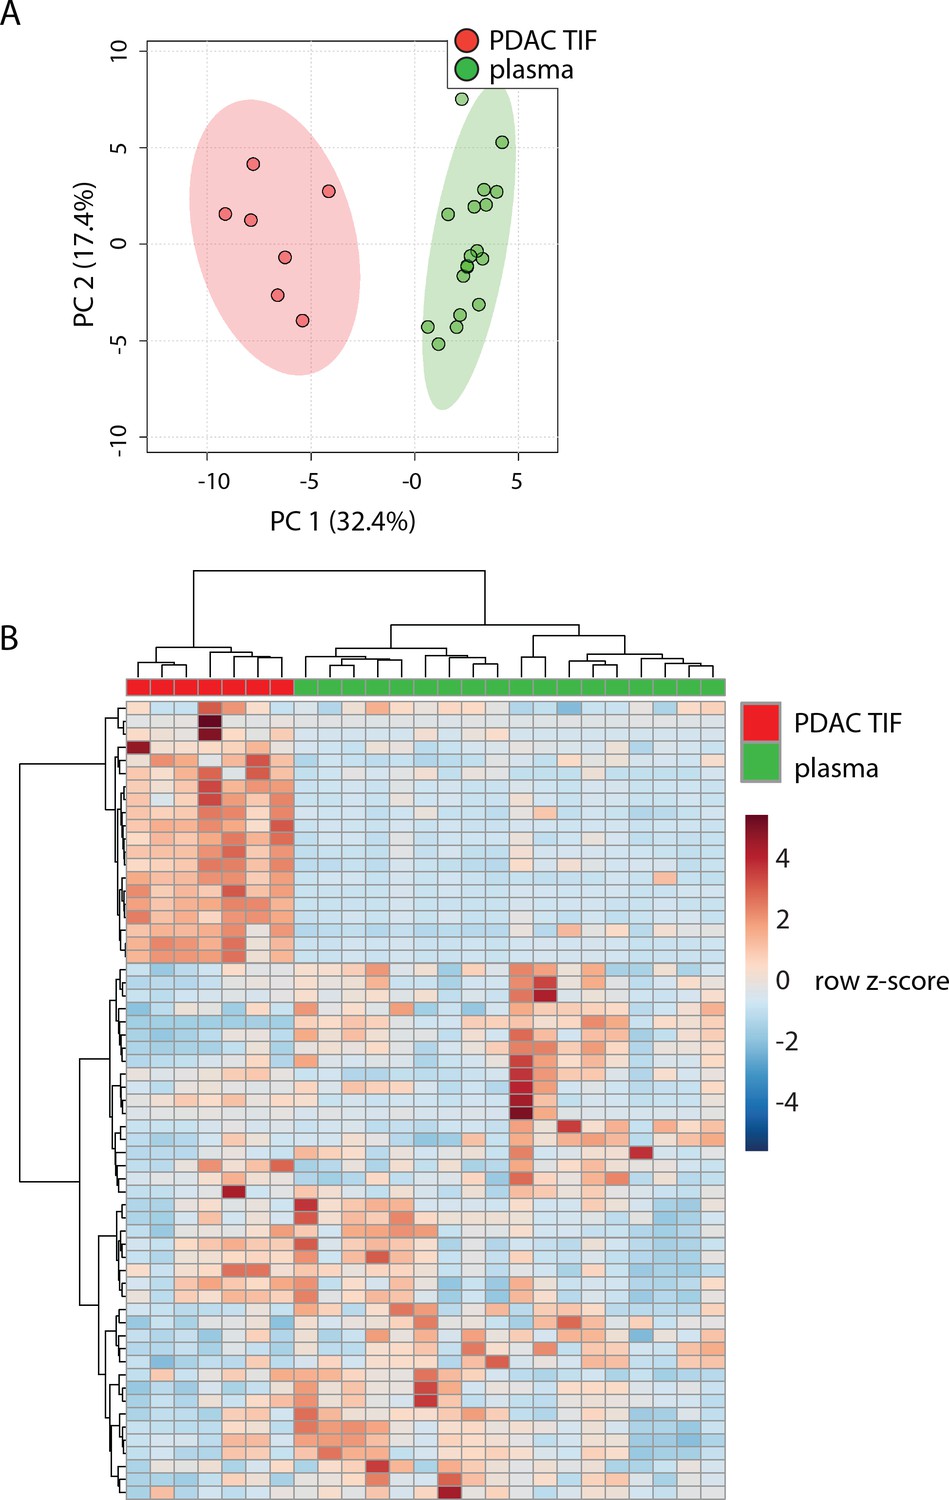
TIF metabolite levels are different than those in plasma.
(A) Hierarchical clustering of PDAC TIF and mouse plasma samples based on LC/MS measurements of 136 metabolite concentrations. (B) Principal component analysis of PDAC TIF samples and mouse plasma samples based on LC/MS measurements of 136 metabolite concentrations. (C) Volcano plot depicting the log2 fold change in metabolite concentration between PDAC TIF and plasma. A fold change of 1.5 and a raw p-value of 0.01 assuming unequal variance were used to select significantly altered metabolites indicated in pink. LC/MS measurements of glucose (D), lactate (E), glutamine (F), arginine (G), tryptophan (H), alanine (I), cystine (J), and ornithine (K) in PDAC TIF and plasma samples. p-values were derived from unpaired, two-tailed Welch’s t tests for all metabolites except glutamine (F) and tryptophan (H), which did not pass the Shapiro-Wilk test for normal distribution. These p-values were derived from a Wilcoxon-Mann-Whitney test. For all panels, n = 7 for PDAC TIF and n = 18 for plasma samples.
-
Figure 2—source data 1
Concentrations of 136 metabolites determined by both external standard calibration and stable isotope dilution in all PDAC TIF and plasma samples in Figure 2.
- https://doi.org/10.7554/eLife.44235.018
Figure 2—figure supplement 1

Method of blood collection affects plasma metabolite levels.
Principal component analysis of mouse plasma samples based on LC/MS measurements of 117 metabolite concentrations from C57BL/6J mice bearing PDAC tumors. Blood was collected using either retro-orbital bleeding from anesthetized mice or cardiac puncture immediately following cervical dislocation of mice. n = 6 for retro-orbital blood collection, n = 7 for cardiac puncture blood collection.
-
Figure 2—figure supplement 1—source data 1
Concentrations of 117 metabolites determined by both external standard calibration and stable isotope dilution for all plasma samples isolated from C57BL/6J mice either by retro-orbital or cardiac puncture collection in Figure 2—figure supplement 1.
- https://doi.org/10.7554/eLife.44235.019
Figure 2—figure supplement 2

TIF metabolite levels are different from those in plasma of paired mice.
(A) Hierarchical clustering of PDAC TIF and mouse plasma samples from paired mice based on LC/MS measurements of 136 metabolite concentrations. (B) Principal component analysis of PDAC TIF samples and mouse plasma samples from paired mice based on LC/MS measurements of 136 metabolite concentrations. Paired samples are connected by black lines. (C) Volcano plot depicting the log2 fold change in metabolite concentration between PDAC TIF and plasma from paired mice. A fold change of 1.5 and a raw p-value of 0.01 assuming unequal variance were used to select significantly altered metabolites indicated in pink. LC/MS measurements of glucose (D), lactate (E), glutamine (F), arginine (G), tryptophan (H), alanine (I), cystine (J), and ornithine (K) in PDAC TIF and plasma samples from paired mice. p-values were derived from paired, two-tailed t tests for all metabolites except arginine (G) and tryptophan (H), which did not pass the Shapiro-Wilk test for normal distribution. These p-values were derived from a Wilcoxon matched-pairs signed rank test. For all panels, n = 6 for PDAC TIF and n = 6 for plasma samples with the exception of (J) for which n = 5.
-
Figure 2—figure supplement 2—source data 1
13C metabolite peak areas of metabolites suspended in plasma and TIF for matrix effect analysis in Figure 2—figure supplement 2.
- https://doi.org/10.7554/eLife.44235.020
Figure 2—figure supplement 3
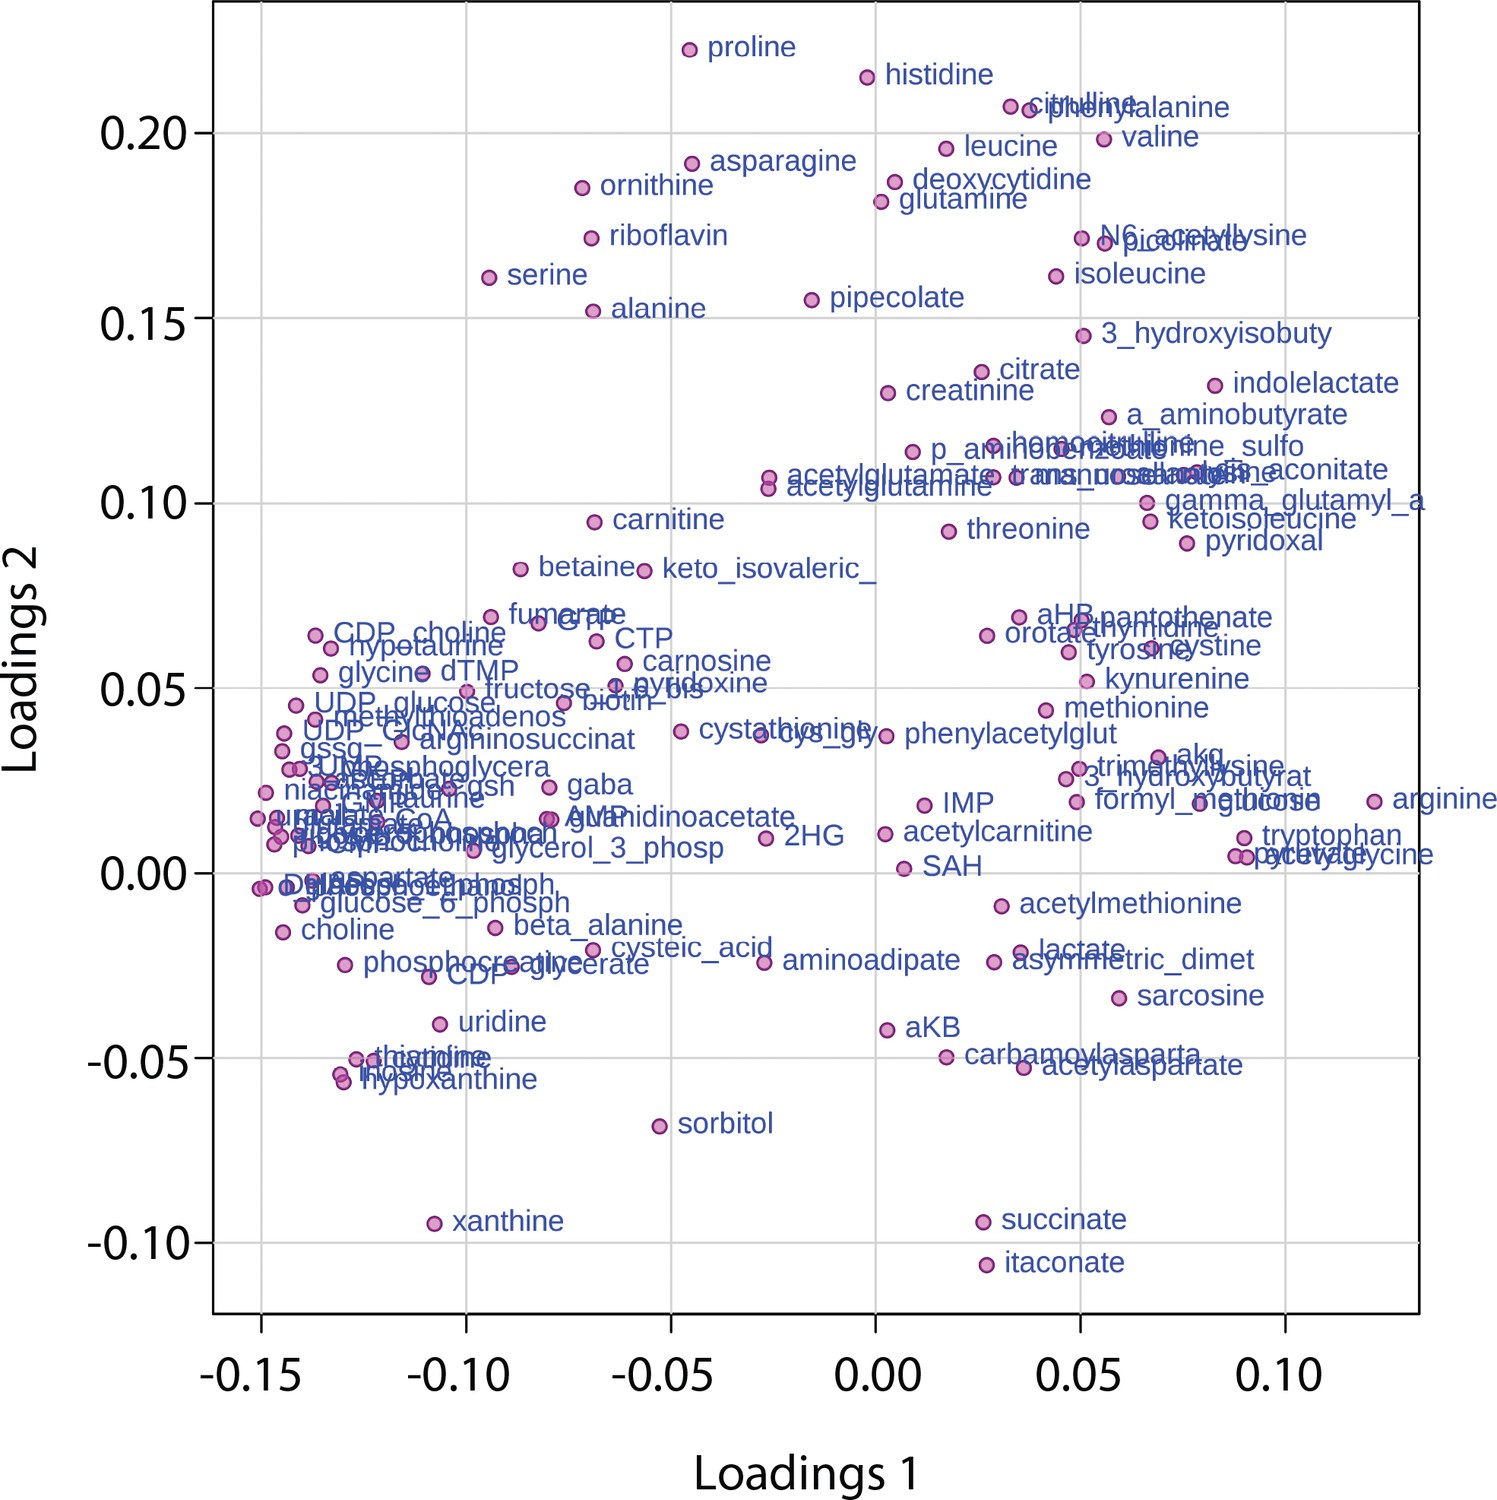
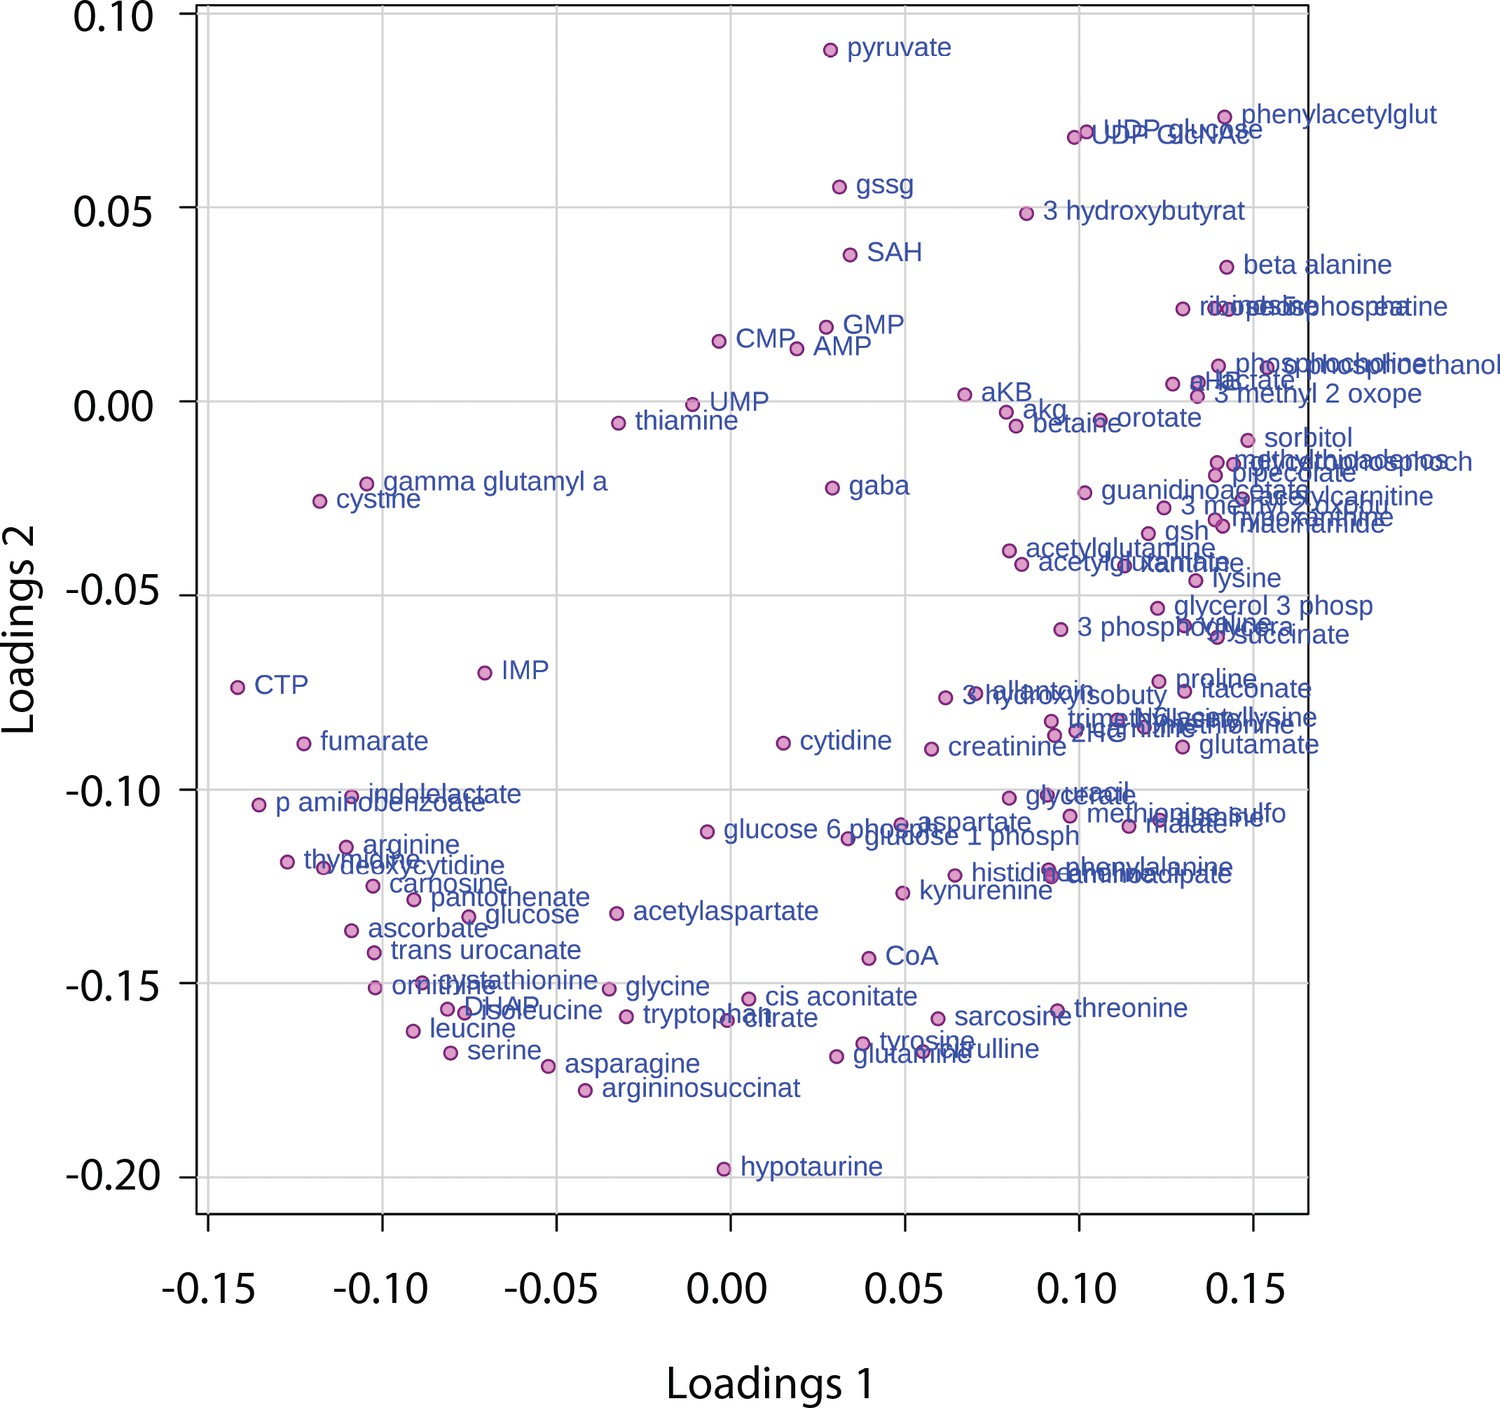
Loading plot presenting the contribution of individual metabolites to the PCA components in Figure 2B.
https://doi.org/10.7554/eLife.44235.013
Figure 2—figure supplement 4

Hierarchical clustering of PDAC TIF and mouse plasma samples based on LC/MS measurements of 136 metabolite concentrations.
https://doi.org/10.7554/eLife.44235.014
Figure 2—figure supplement 5
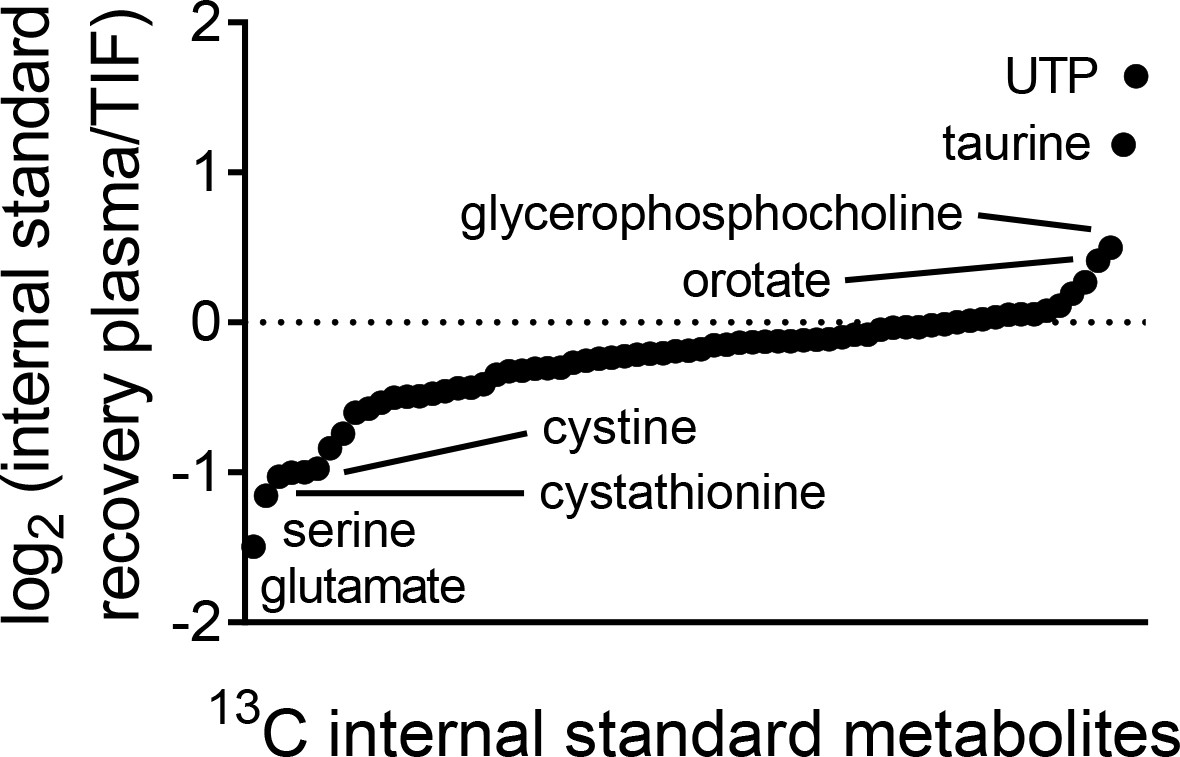
Plasma and TIF exhibit different matrix effects.
LC/MS measurement of equal concentrations of 70 13C chemical standards suspended in either mouse plasma or mouse PDAC TIF. Data are plotted as the log2 fold change between the peak area of the 13C metabolite in water versus in plasma. n = 19 plasma samples, n = 22 TIF samples.
Figure 2—figure supplement 6
PDAC TIF differs from plasma when comparing only those metabolites quantified using internal isotope-labeled standards.
Hierarchical clustering (A) and principal component analysis (B) of PDAC TIF and mouse plasma samples based on LC/MS measurements of 62 metabolite concentrations using internal standards. For all panels, n = 7 for PDAC TIF and n = 18 for plasma samples.
-
Figure 2—figure supplement 6—source data 1
Concentrations of 62 metabolites determined only by stable isotope dilution in all PDAC TIF and plasma samples in Figure 2—figure supplement 6.
- https://doi.org/10.7554/eLife.44235.021
Figure 2—figure supplement 7
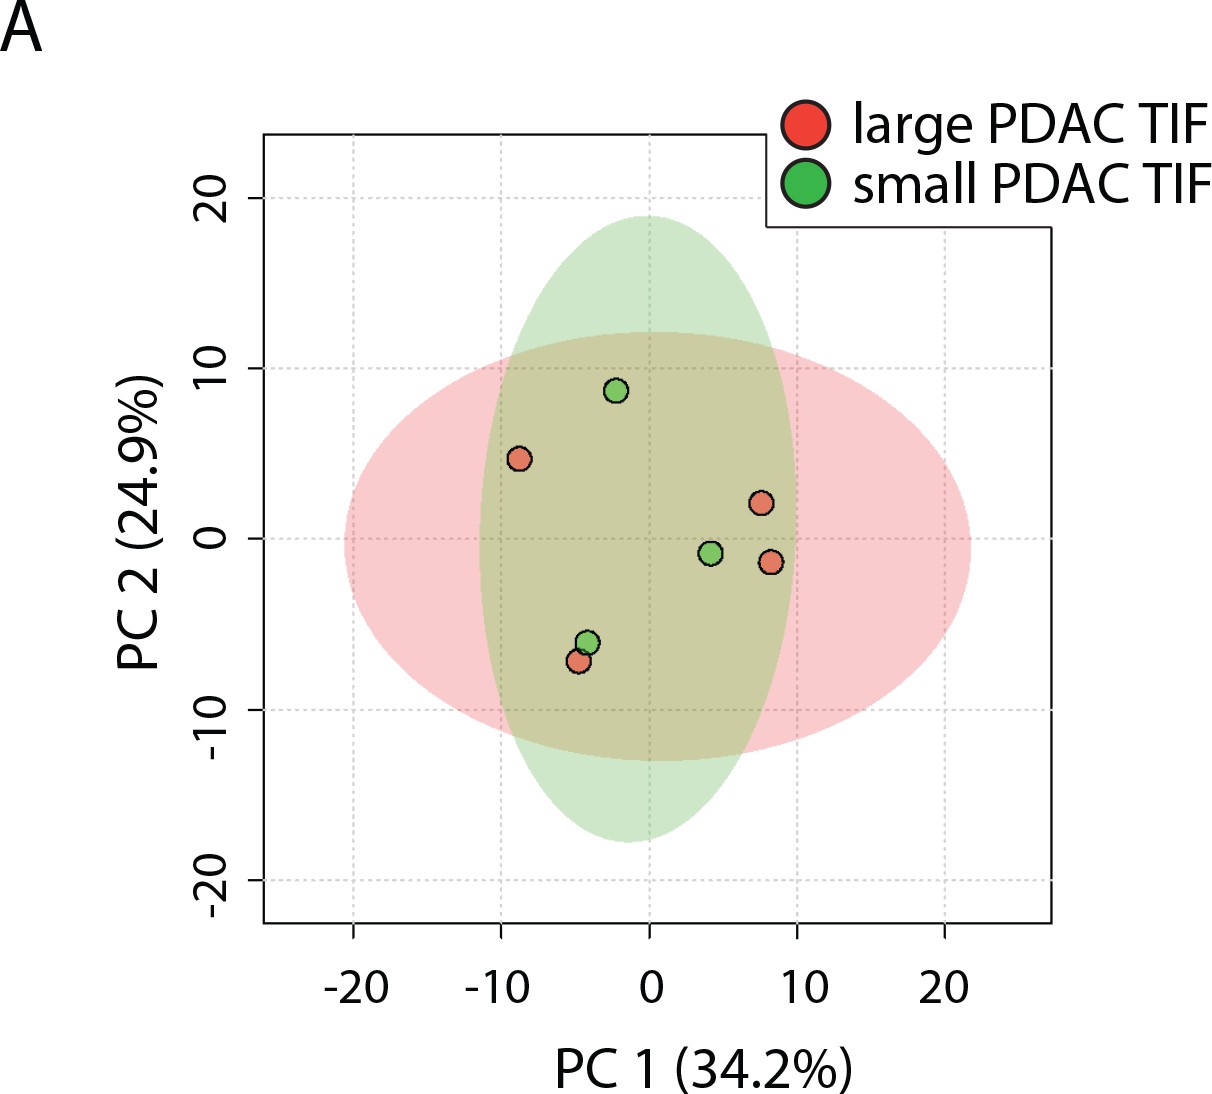
PDAC TIF metabolite levels are not significantly different between large and small tumors.
Principal component analysis of TIF samples from large (1.71–1.24 g) and small (1.22–0.78 g) PDAC tumors based on LC/MS measurements of 136 metabolite concentrations. n = 4 for large PDAC tumors and n = 3 for small PDAC tumors.
Figure 3 with 2 supplements
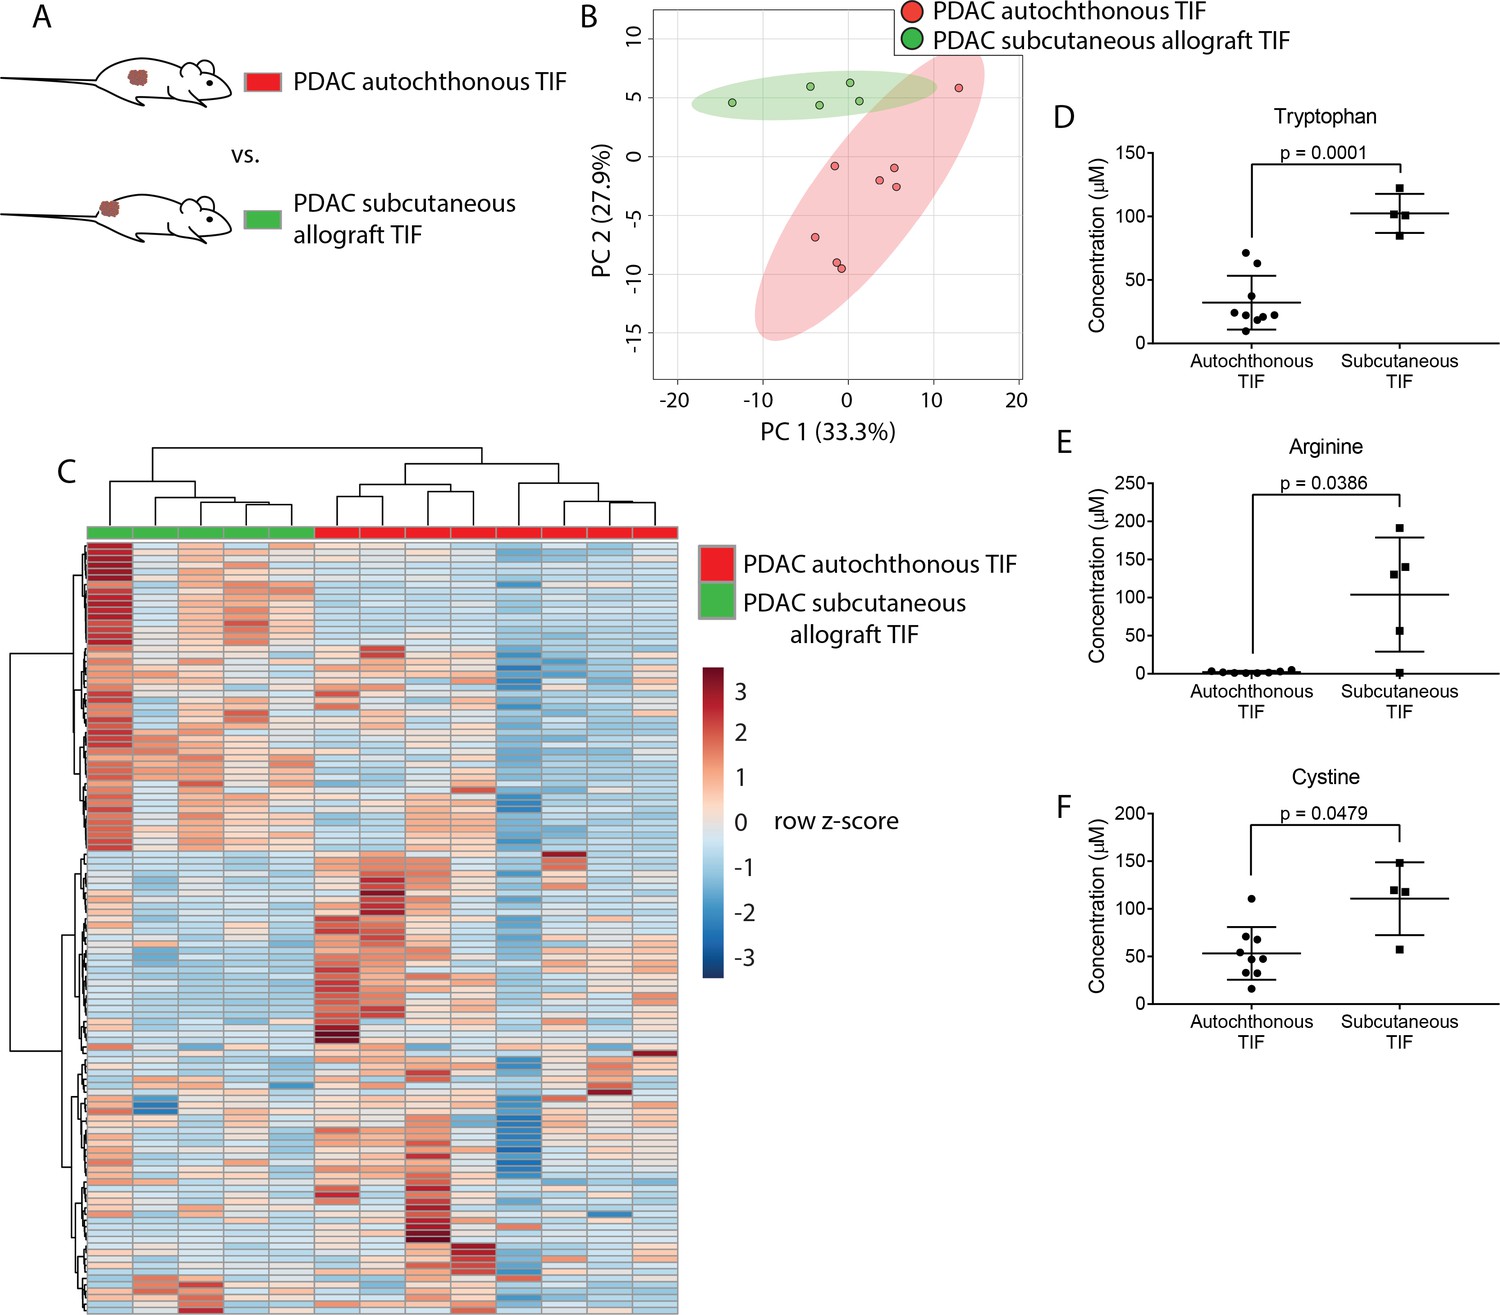
Tumor location dictates metabolic TIF composition.
(A) Diagram of experimental models used to test the effect of tumor location on TIF metabolite levels. Principal component analysis (B) and hierarchical clustering (C) of PDAC TIF and PDAC subcutaneous allograft TIF samples based on LC/MS measurements of 123 metabolite concentrations. LC/MS measurements of tryptophan (D), arginine (E), and cystine (F) in PDAC TIF and PDAC subcutaneous allograft TIF. p-values were derived from unpaired, two-tailed Welch’s t tests. For all panels, n = 7 for PDAC TIF samples and n = 5 for PDAC subcutaneous allografts.
-
Figure 3—source data 1
Concentrations of 123 metabolites determined by both external standard calibration and stable isotope dilution in all autochthonous and subcutaneous PDAC TIF samples in Figure 3.
- https://doi.org/10.7554/eLife.44235.025
Figure 3—figure supplement 1
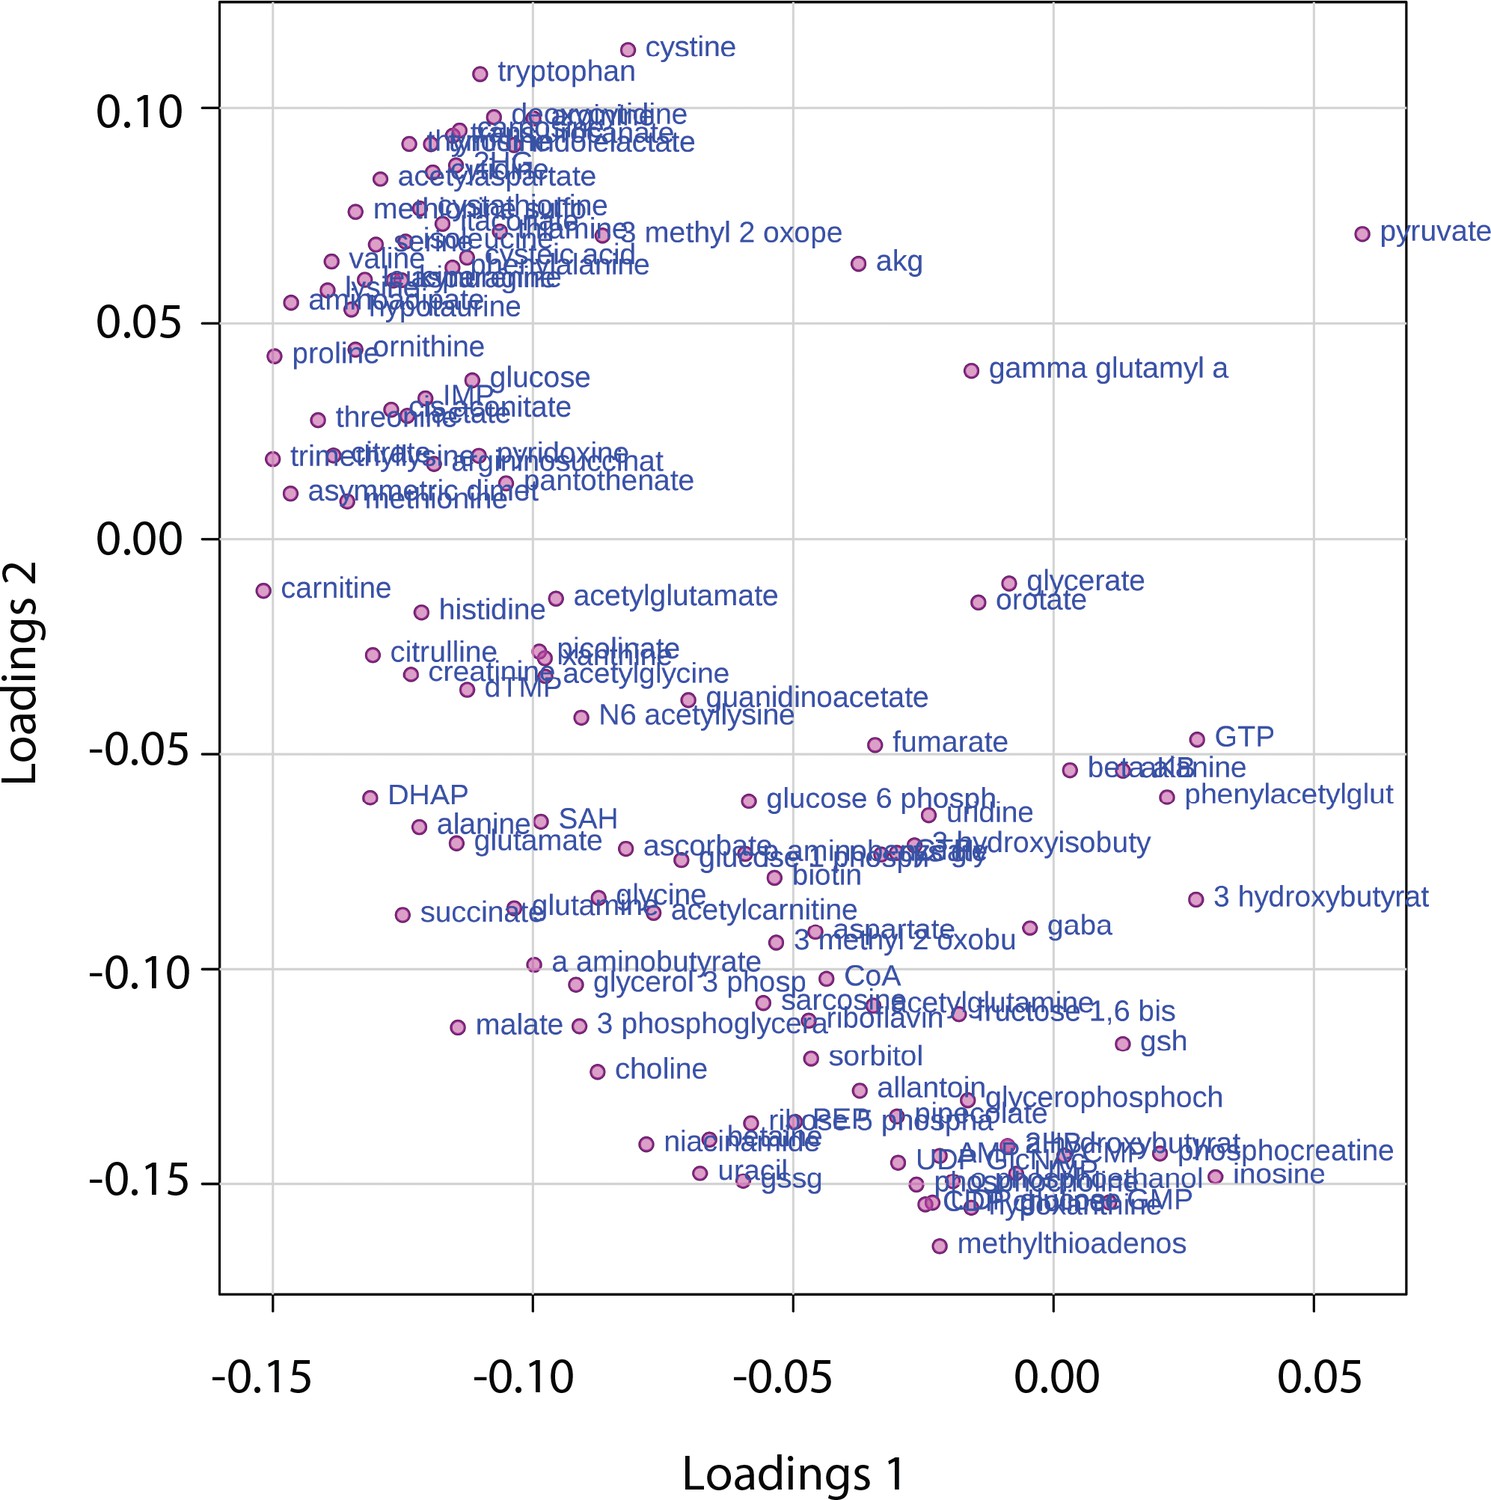
Loading plot presenting the contribution of individual metabolites to the PCA components in Figure 3B.
https://doi.org/10.7554/eLife.44235.023
Figure 3—figure supplement 2
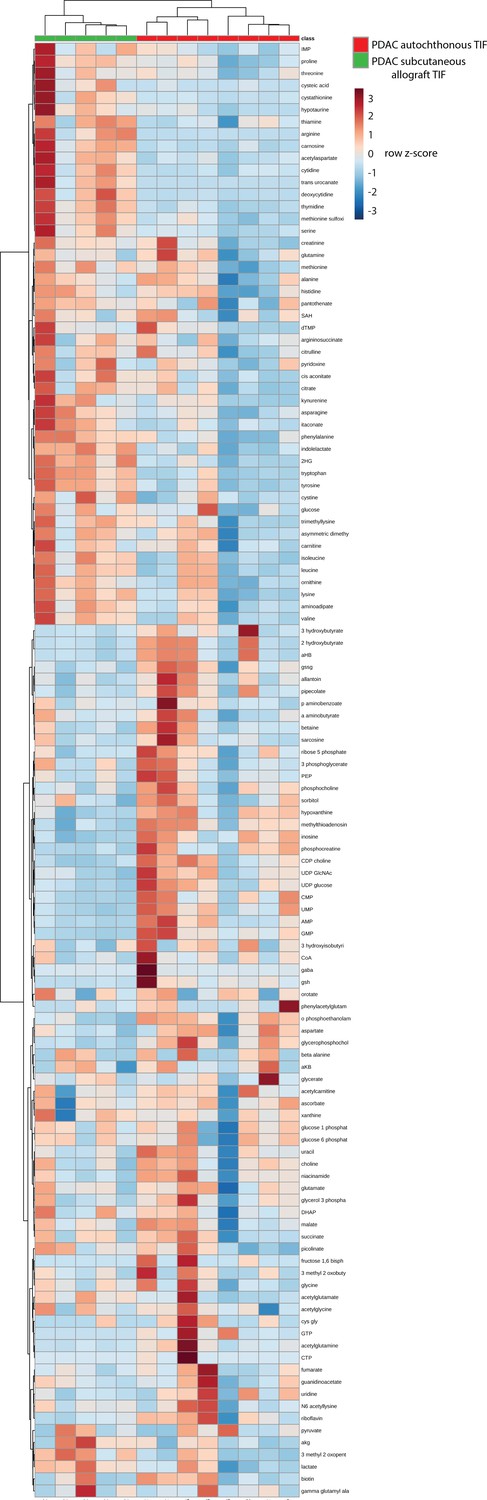
Hierarchical clustering of PDAC TIF and PDAC subcutaneous allograft TIF samples based on LC/MS measurements of 123 metabolite concentrations.
https://doi.org/10.7554/eLife.44235.024
Figure 4 with 2 supplements
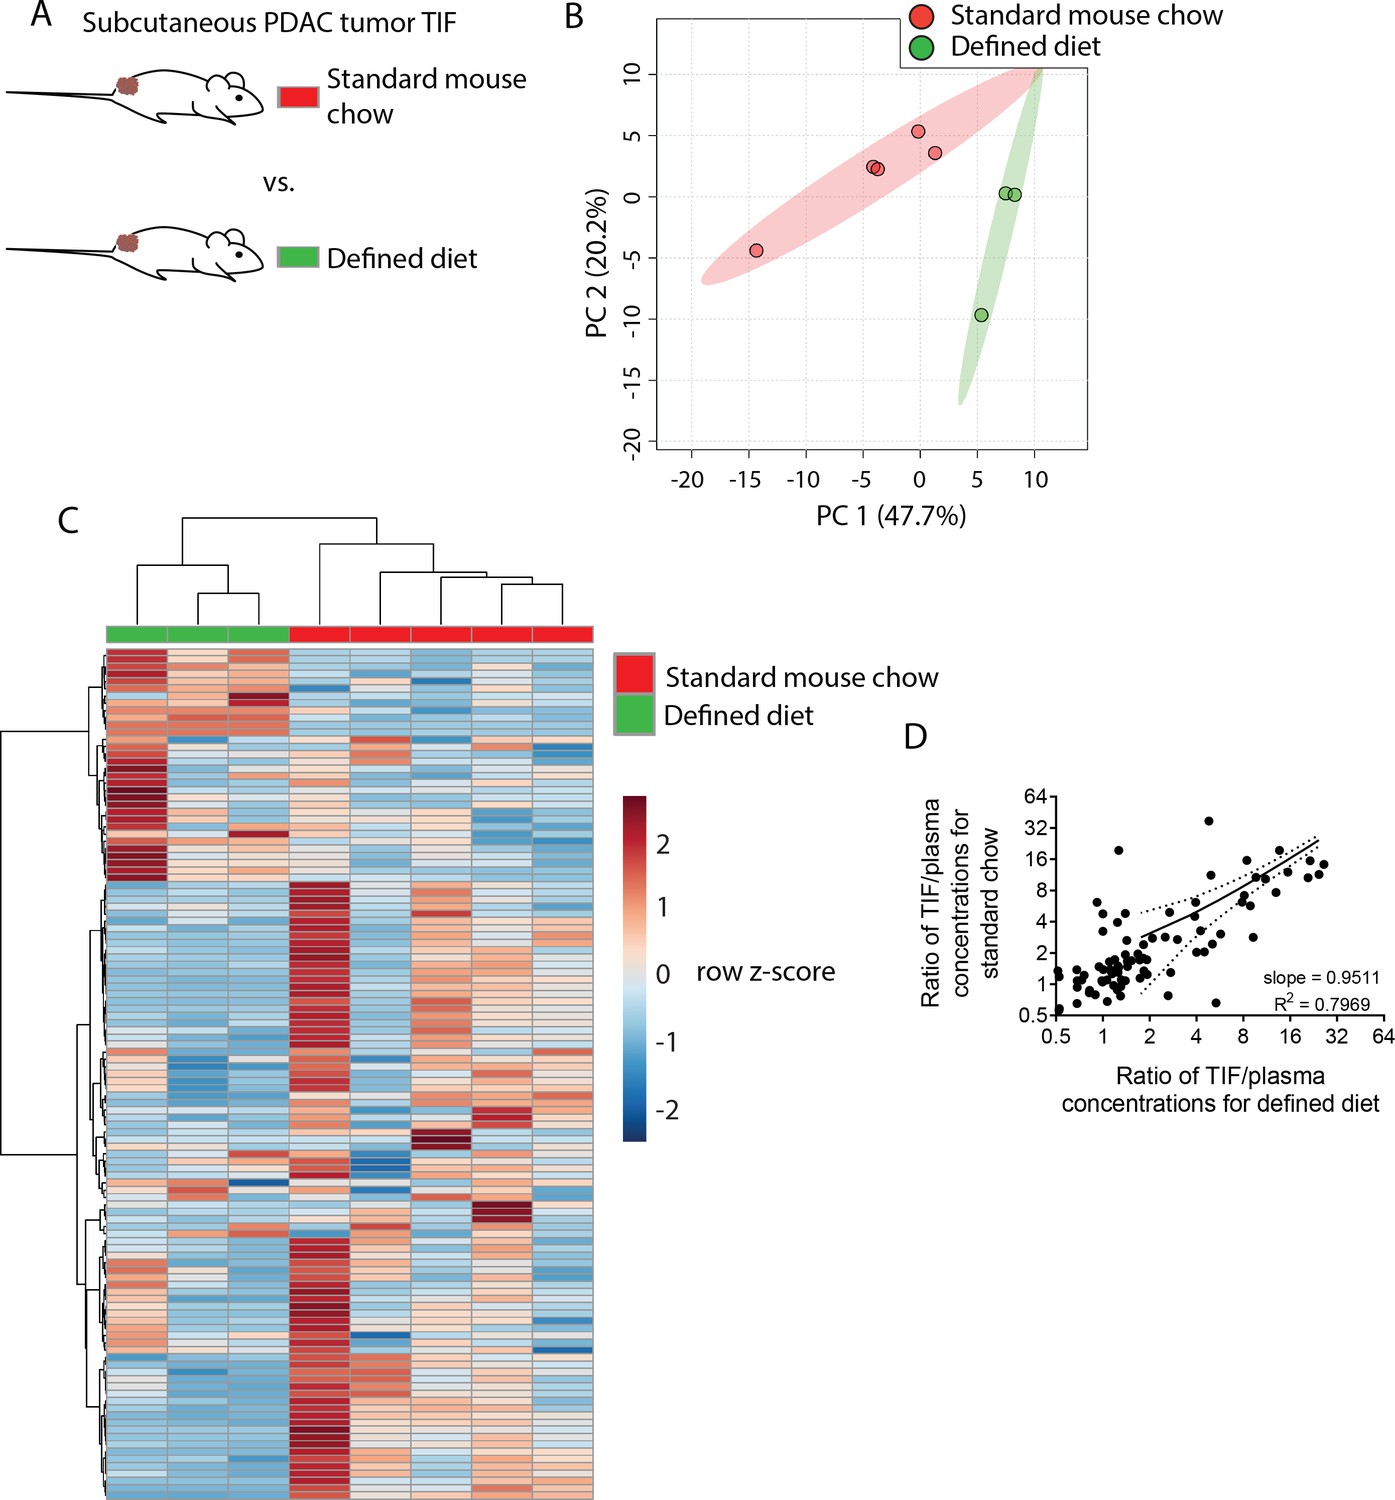
Dietary changes alter TIF composition.
(A) Schematic of experimental models used to test the effect of diet on TIF metabolite levels. Principal component analysis (B) and hierarchical clustering (C) of subcutaneous PDAC allograft TIF samples from mice fed standard mouse chow versus mice fed a defined diet based on LC/MS measurements of 123 metabolite concentrations. (D) Ratios of LC/MS measurements of 123 metabolites in TIF versus matched plasma from the same mouse fed standard mouse chow plotted versus the same ratios in mice fed a defined diet. For all panels, n = 5 for TIF from mice fed standard mouse chow and n = 3 for TIF from mice fed a defined diet.
-
Figure 4—source data 1
Concentrations of 123 metabolites determined by both external standard calibration and stable isotope dilution in all plasma and subcutaneous PDAC TIF samples in Figure 4.
- https://doi.org/10.7554/eLife.44235.029
Figure 4—figure supplement 1
Loading plot presenting the contribution of individual metabolites to the PCA components in Figure 4B.
https://doi.org/10.7554/eLife.44235.027
Figure 4—figure supplement 2

Hierarchical clustering of subcutaneous PDAC allograft TIF samples from mice fed standard mouse chow versus mice fed a defined diet based on LC/MS measurements of 123 metabolite concentrations.
https://doi.org/10.7554/eLife.44235.028
Figure 5 with 3 supplements
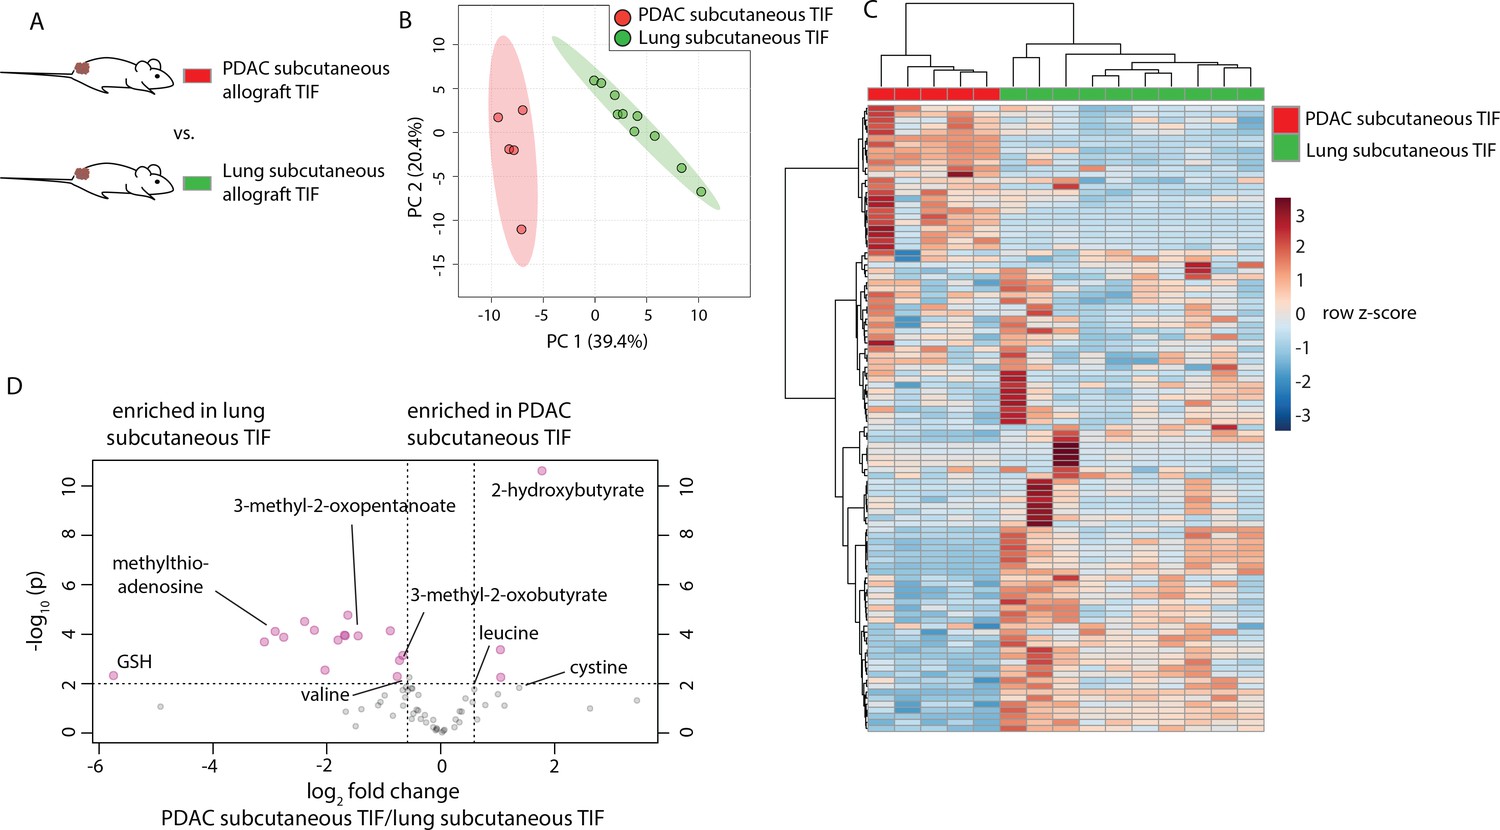
Tumor tissue of origin influences TIF composition independent of tumor location.
(A) Diagram of experimental models used to test the effect of tumor tissue of origin on TIF metabolite levels. Principal component analysis (B) and hierarchical clustering (C) of PDAC subcutaneous allograft TIF and LUAD subcutaneous allograft TIF samples based on LC/MS measurements of 104 metabolite concentrations. (D) Volcano plot depicting the log2 fold change in metabolite concentration between PDAC and LUAD TIF for metabolites measured using stable isotope dilution. A fold change of 1.5 and raw p-value of 0.01 assuming unequal variance were used to select significantly altered metabolites indicated in pink. For all panels, n = 5 for PDAC subcutaneous allograft TIF samples and n = 10 for LUAD subcutaneous allograft TIF samples.
-
Figure 5—source data 1
Concentrations of 104 metabolites determined by both external standard calibration and stable isotope dilution in all subcutaneous PDAC and LUAD TIF samples in Figure 5.
- https://doi.org/10.7554/eLife.44235.034
Figure 5—figure supplement 1
Tumor tissue of origin influences TIF when measured using internal standards only.
(A) Diagram of experimental models used to test the effect of tumor tissue of origin on TIF metabolite levels. Principal component analysis (B) and hierarchical clustering (C) of PDAC subcutaneous allograft TIF and LUAD subcutaneous allograft TIF samples based on LC/MS measurements of 67 metabolites quantified using isotope-labeled internal standards. For all panels, n = 5 for PDAC subcutaneous allograft TIF samples and n = 10 for LUAD subcutaneous allograft TIF samples.
-
Figure 5—figure supplement 1—source data 1
Concentrations of 66 metabolites determined by only stable isotope dilution in all subcutaneous PDAC and LUAD TIF samples in Figure 5—figure supplement 1.
- https://doi.org/10.7554/eLife.44235.035
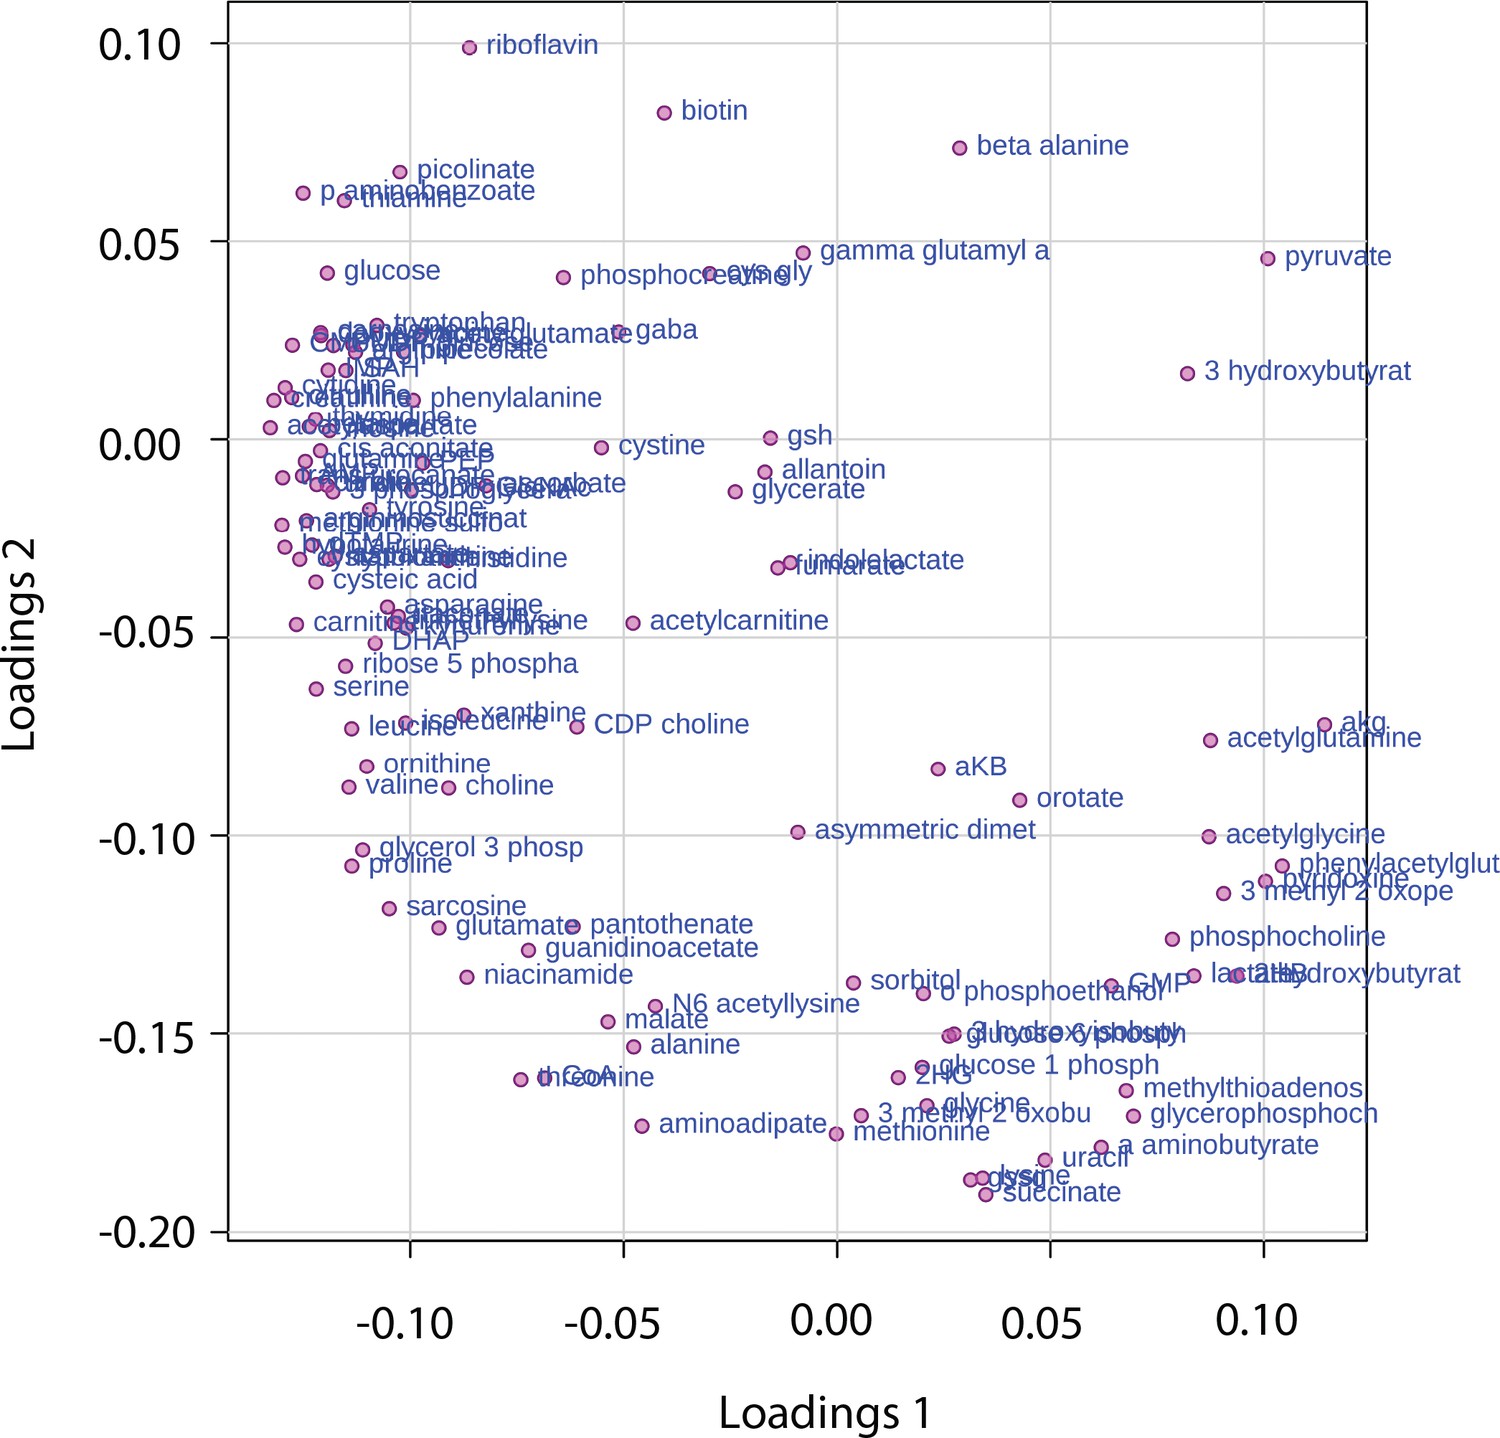
Figure 5—figure supplement 2
Loading plot presenting the contribution of individual metabolites to the PCA components in Figure 5B.
https://doi.org/10.7554/eLife.44235.032
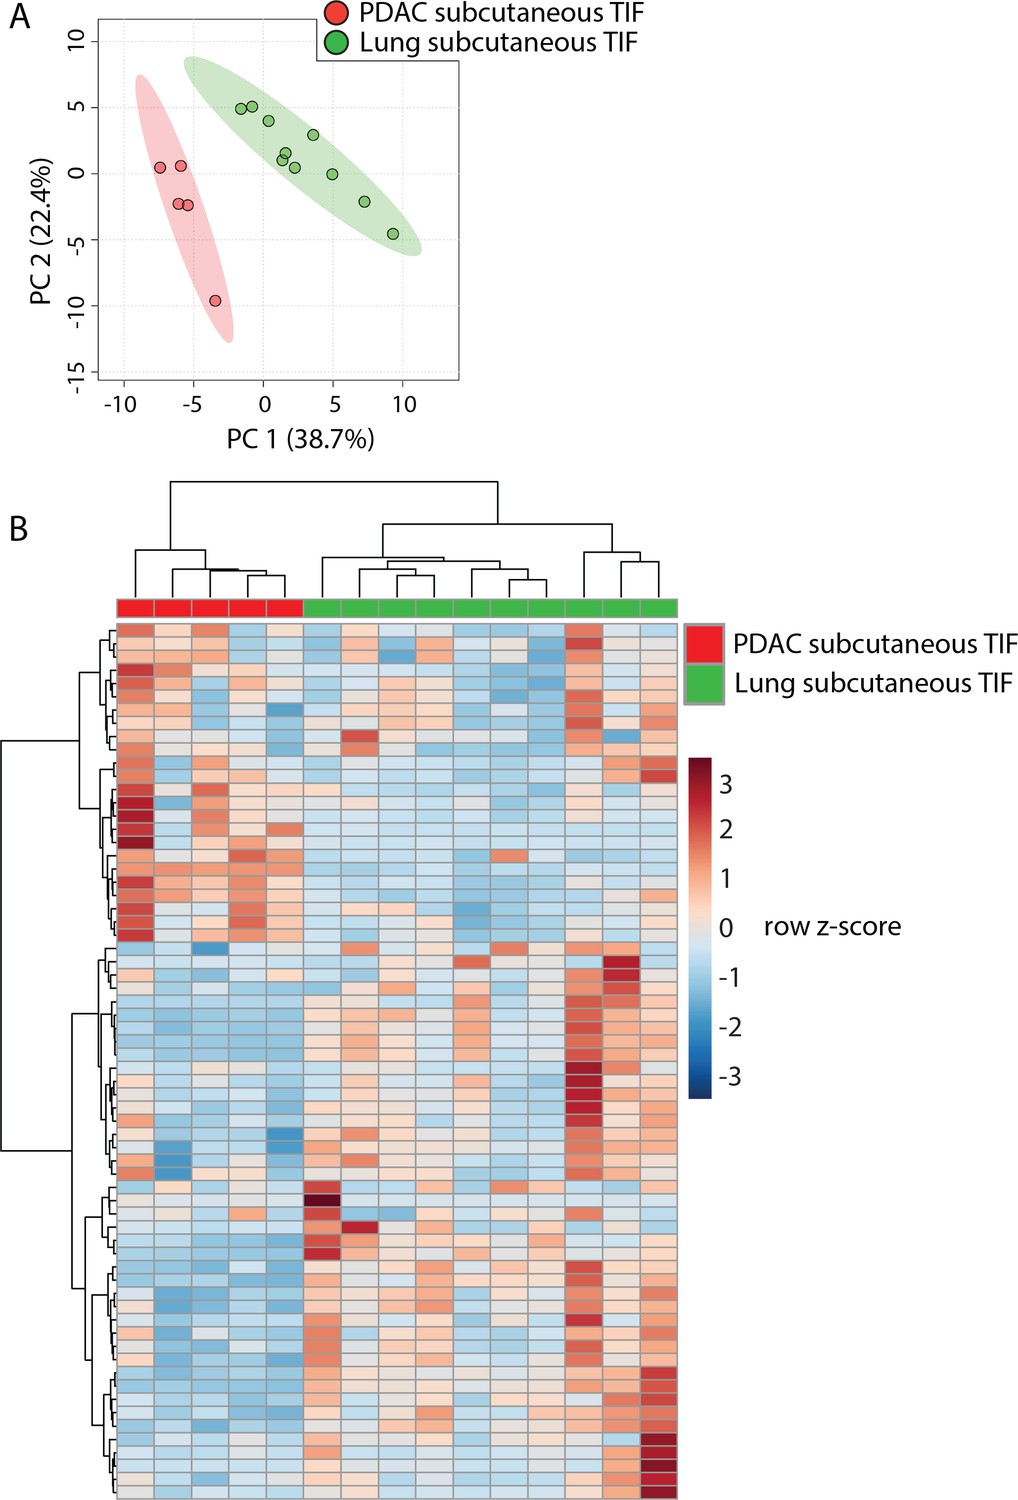
Figure 5—figure supplement 3
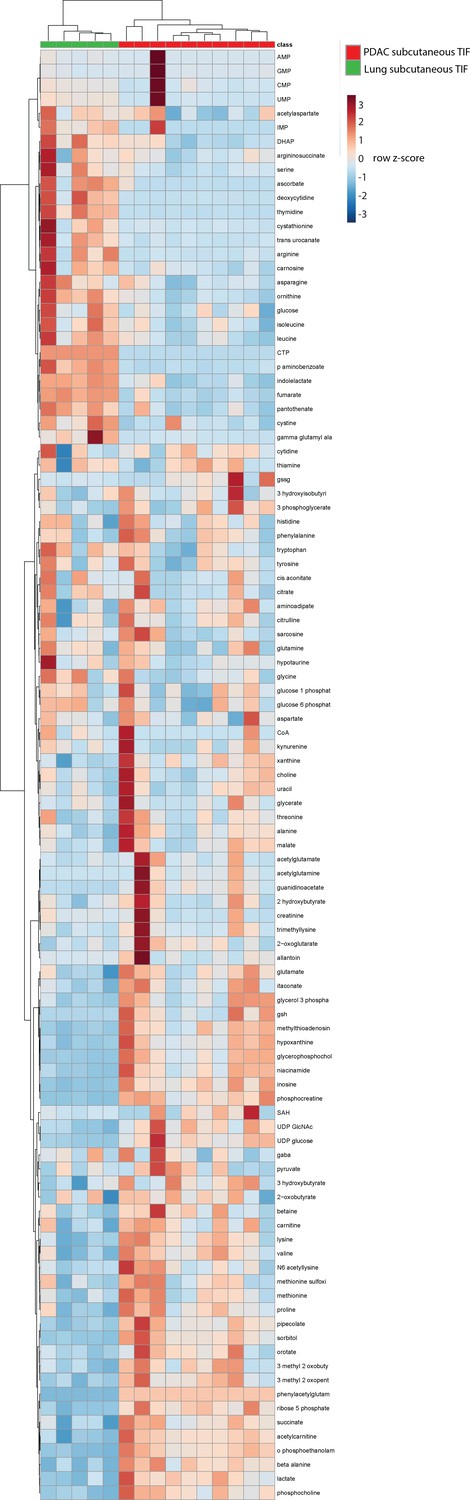
Hierarchical clustering of PDAC subcutaneous allograft TIF and LUAD subcutaneous allograft TIF samples based on LC/MS measurements of 104 metabolite concentrations.
https://doi.org/10.7554/eLife.44235.033
Figure 6 with 2 supplements
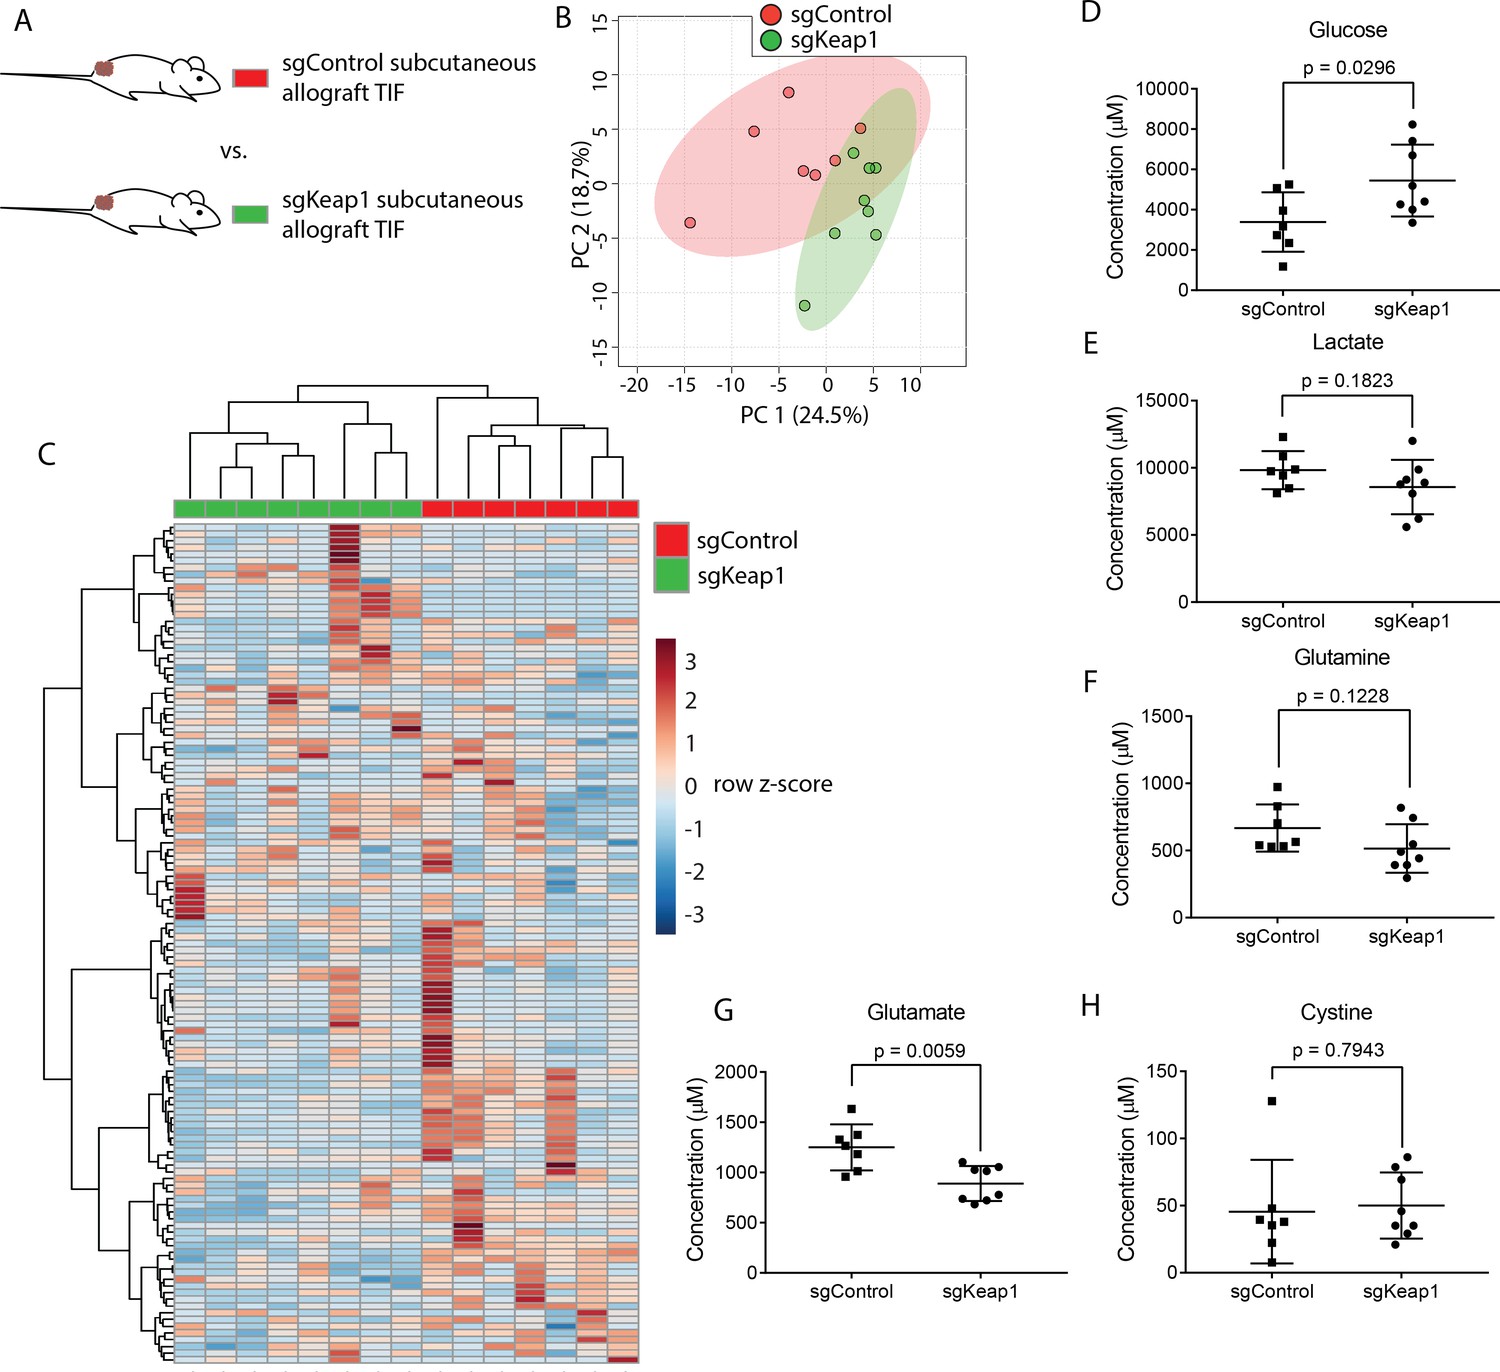
Genetic Keap1 status is not a major determinant of TIF composition in subcutaneous LUAD allograft tumors.
(A) Schematic of experimental models used to test the effect of genetic loss of Keap1 on TIF metabolite levels. Principal component analysis (B) and hierarchical clustering (C) of Keap1 wild-type (sgControl) and Keap1 null (sgKeap1) subcutaneous LUAD allograft TIF samples based on LC/MS measurements of 131 metabolite concentrations. LC/MS measurements of glucose (D), lactate (E), glutamine (F), glutamate (G), and cystine (H) in Keap1 wild-type (sgControl) and Keap1 null (sgKeap1) subcutaneous lung allograft TIF samples. p-values were derived from unpaired, two-tailed Welch’s t tests. For all panels, n = 10 for sgControl subcutaneous lung allograft TIF samples and n = 8 for sgKeap1 subcutaneous LUAD allograft TIF samples.
-
Figure 6—source data 1
Concentrations of 131 metabolites determined by both external standard calibration and stable isotope dilution in all sgControl and sgKeap1 LUAD TIF samples in Figure 6.
- https://doi.org/10.7554/eLife.44235.039
Figure 6—figure supplement 1
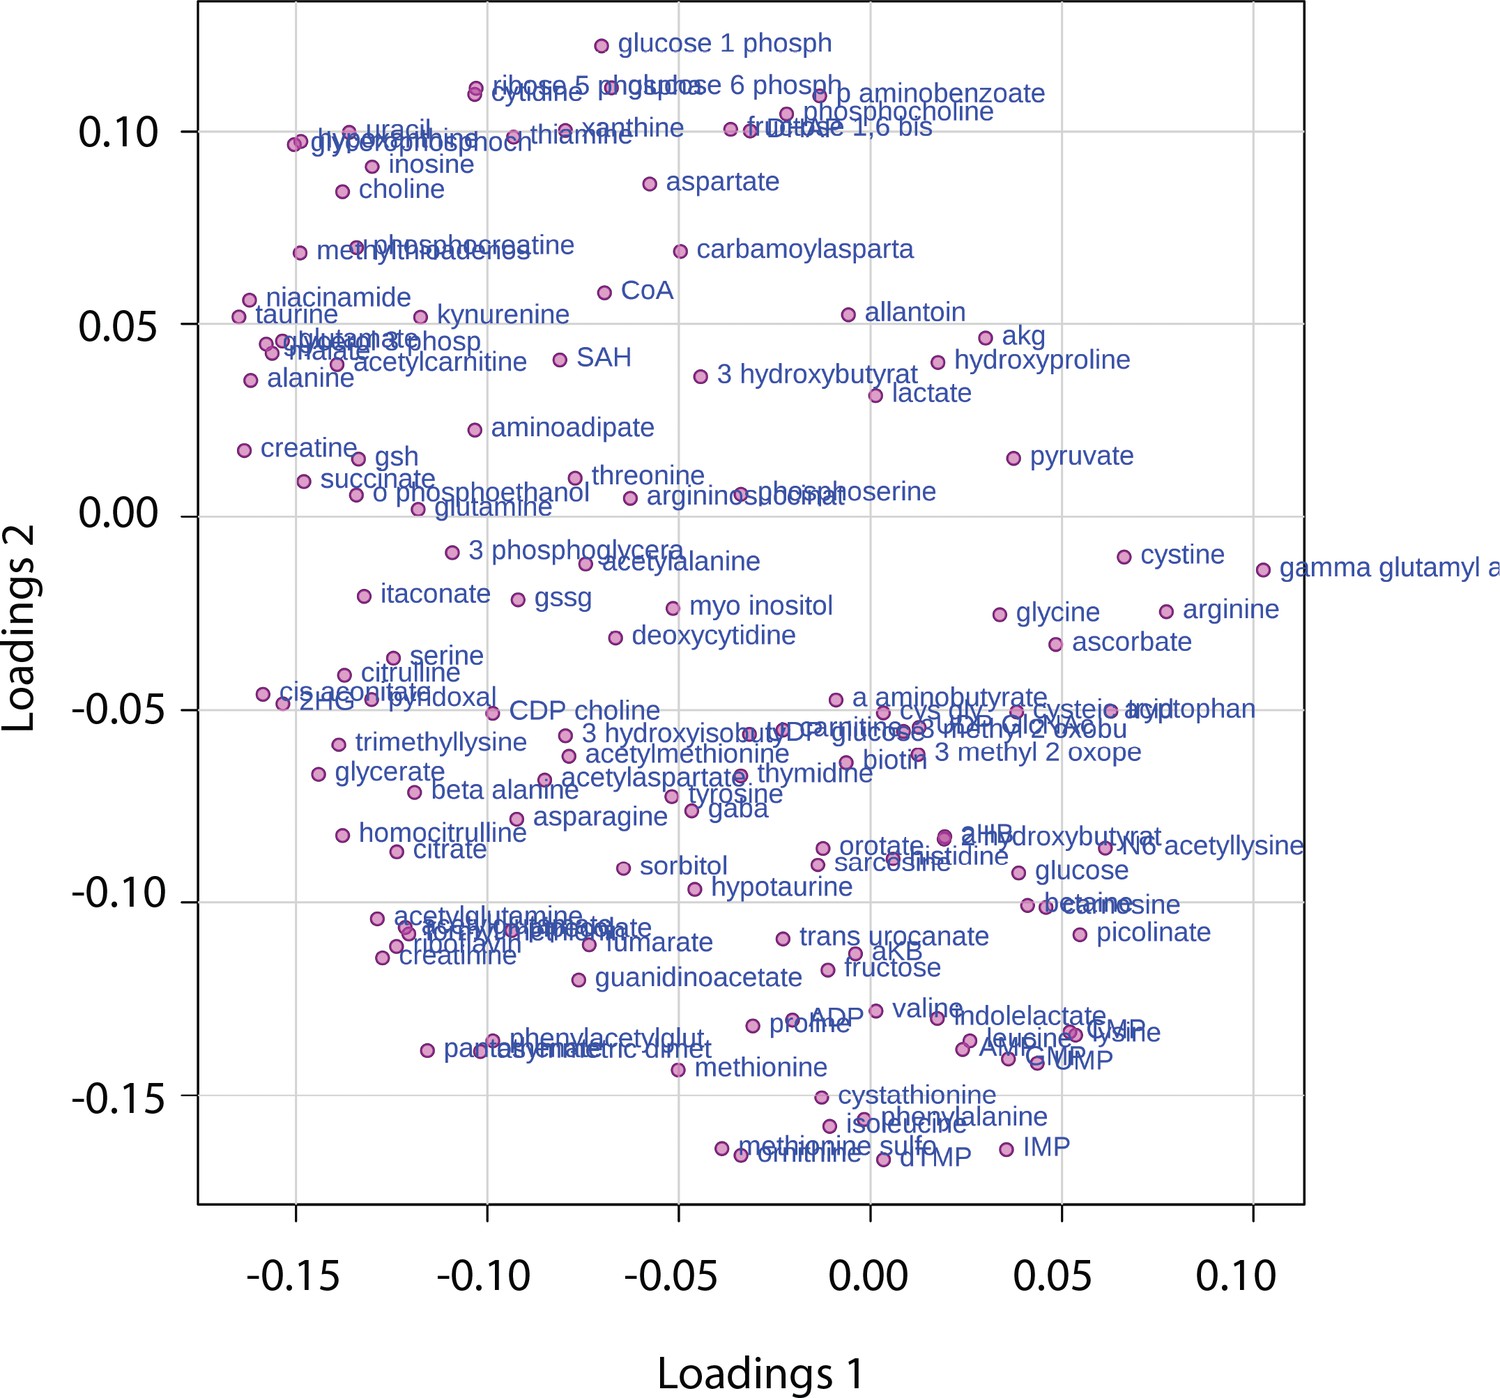
Loading plot presenting the contribution of individual metabolites to the PCA components in Figure 6B.
https://doi.org/10.7554/eLife.44235.037
Figure 6—figure supplement 2
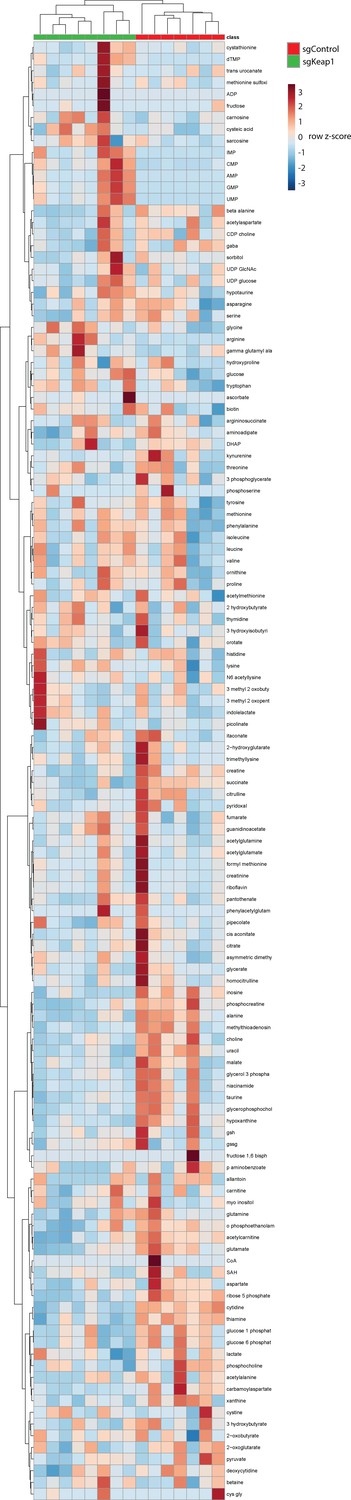
Hierarchical clustering of Keap1 wild-type (sgControl) and Keap1 null (sgKeap1) subcutaneous LUAD allograft TIF samples based on LC/MS measurements of 131 metabolite concentrations.
https://doi.org/10.7554/eLife.44235.038Additional files
-
Supplementary file 1
Information on metabolites analyzed in this study including metabolite name, organization of metabolite pools, concentration of each metabolite in each metabolite pool, polarity in which the metabolite was best detected, m/z, limit of detection, and method of quantification.
- https://doi.org/10.7554/eLife.44235.040
-
Supplementary file 2
Composition of animal diets used in this study.
- https://doi.org/10.7554/eLife.44235.041
-
Transparent reporting form
- https://doi.org/10.7554/eLife.44235.042
Download links
A two-part list of links to download the article, or parts of the article, in various formats.
Downloads (link to download the article as PDF)
Open citations (links to open the citations from this article in various online reference manager services)
Cite this article (links to download the citations from this article in formats compatible with various reference manager tools)
Quantification of microenvironmental metabolites in murine cancers reveals determinants of tumor nutrient availability
eLife 8:e44235.
https://doi.org/10.7554/eLife.44235


